Article

Wettability, Adsorption and Adhesion in Polymer (PMMA)—Commercially Available Mouthrinse System

by
Stanislaw Pogorzelski
1,
Paulina Janowicz
1,
Krzysztof Dorywalski
1,
Katarzyna Boniewicz-Szmyt
2 and
Pawel Rochowski
1,*
1
Institute of Experimental Physics, Faculty of Mathematics, Physics and Informatics, University of Gdańsk, Wita Stwosza 57, 80-308 Gdańsk, Poland
2
Department of Physics, Gdynia Maritime University, Morska 81-87, 81-225 Gdynia, Poland
*
Author to whom correspondence should be addressed.
Materials 2023, 16(17), 5753; https://doi.org/10.3390/ma16175753
Submission received: 22 June 2023 / Revised: 11 August 2023 / Accepted: 18 August 2023 / Published: 22 August 2023

Abstract

:
The study concerns the evaluation of the physicochemical and thermo-adsorptive surface properties of six commercially available mouthrinses, particularly surface tension, surface activity, partitioning coefficient, critical micellar concentration, Gibbs excesses at interfaces, surface entropy, and enthalpy. The aim was to quantify their effect on the adhesion and wettability of a model poly(methyl methacrylate) (PMMA) polymer. The adsorptive and thermal surface characteristics were derived from surface tension (γLV) vs. concentration and temperature dependences. Polymer surface wettability was characterized by the contact angle hysteresis (CAH) formalism, using the measurable advancing ΘA and receding ΘR dynamic contact angles and γLV as the input data. Further, wettability parameters: Young static angle (Θ), film pressure (Π), surface free energy (γSV) with its dispersive and polar components, work of adhesion (WA), and adhesional tension (γLV cosΘA) were considered as interfacial interaction indicators. The mouthrinse effect demonstrated the parameter’s evolution in reference to the PMMA/pure water case: Θ, ΘA and ΘR↓, CAH↑, Π↓, WA↓, γSV↓, and γLV cosΘA↑. Furthermore, the variations of the surface excess ratio pointed to the formation of multilayered structures of surfactants composing the mouthrinse mixtures considered. The contact angle data allowed for the penetration coefficient and the Marangoni temperature gradient-driven liquid flow speed to be estimated.

1. Introduction

Mouthrinses are frequently used in dentistry to improve dental health. They can be useful in preventing plaque accumulation by adding antibacterial compounds such as chlorhexidine. They are a very popular additional oral hygiene element, and there are plenty of individual products whose compositions are in a state of continuous modification. In order to be effective on smooth surfaces, a mouthrinse should spread completely over the tooth surface to enlarge its contact area and lower the contact angle (CA), which is attributed to its wettability [1]. Another important property is the capacity of a liquid to penetrate through pores and capillaries in hard materials of the oral cavity, as determined by its viscosity, surface tension, and contact angle on the capillary surface, expressed by the penetration coefficient (PC) [2] and Marangoni surface tension-gradient flow speed [3]. A typical mouthwash on the market is a water–glycerin mixture, consisting of an additional sweetener (saccharin), surfactant (PEG-40 hydrogenated castor oil, sodium lauryl sulphate, polysorbate 20, etc.), preservative (sodium benzoate), some dyes, and flavoring agent, as well as having two oral health substances, an anticaries compound (sodium fluoride) and an antimicrobial drug, as recently reviewed in detail [4]. The main aim of this concept research is to quantify the mouthrinse effect on adhesion and surface wettability of a model PMMA polymer/mouthrinse system. The interfacial interaction signatures in mouthrinse/oral solid surfaces are attributed to several physical mechanisms simultaneously taking place at the air/liquid and liquid/solid interfaces, namely surface adsorption, adhesion, and spreading, which are quantified in terms of several parameters determined from detailed adsorption and wettability studies performed on model systems. To address the problem, the first surface adsorptive and thermal parameters of six commercially available mouthrinse products were derived from the surface tension-temperature and surface tension-concentration dependences experimentally determined using the de Nuoy ring method [5]. To obtain the surface wettability parameters, the contact angle hysteresis (CAH) formalism was used, which is based on the three measurable quantities: dynamic contact angles: advancing (θA), receding (θR), and probe liquid surface tension (γLV) [6]. Apart from the dynamic contact angles, the surface free energy of solids (γSV), 2D adsorptive film pressure (Π), adhesional tension, works of adhesion (WA), and spreading (WS) were selected as condition level indicators of the studied PMMA-water (reference) and PMMA-mouthrinse-treated surfaces. Modern oral cavity dental materials include a wide group of polymers, ceramics, composites, metals, and their alloys. In this paper, a PMMA polymeric substratum of well-defined surface composition and properties, largely met inside the human mouth as a replica for teeth or material for preparing dentures, was used as the reference material. Polymethylmethacrylate (PMMA) is one of the most widely used acrylate plastics in light of its excellent biocompatibility and aging resistance. Since PMMA is a weakly polar polymer compound that contains –CH3, –CO, and –OCH3 groups, surfactant-containing liquids can interact with PMMA surfaces through a variety of adsorption mechanisms [7]. In the studied phenomenon, the essential problem seems to be bacterial attachment to surfaces. The biochemical studies highlight that the pellicle, which is a thin layer of organic material (saliva glycoproteins, phosphoproteins, proteins, enzymes, and receptors for bacterial adhesins), plays a crucial role. However, the physicochemical mechanisms of bacterial adhesion involve a thermodynamic model based on the interfacial free energies of liquids and interacting surfaces [8]. Moreover, the surface topography, together with surface roughness and surface pattern, influences cell adhesion. However, surface wettability’s energetic effect on solid surface bioadhesion had already been addressed. In particular, as demonstrated for polymers, values of water contact angles ranging from 40° to 70° are reported to be the most suitable for cell adhesion [8]. The surface free energy (SFE) decrease was observed for the coated surface with saliva in reference to the free one (from 36.6 to 31.8 mJ m−2) for PMMA acrylic resin [9]. Similarly, a decrease in SFE was also observed for denture acrylic resins after storage in substances for the hygiene of dentures [10]. Comprehensive CA studies of saliva and mouthwashes on enamel and composite dental materials were performed to understand how saliva interacts with restorative materials [11]. Water (over 99%) and inorganic and organic compounds such as immunoglobulins, proteins, enzymes, mucins, and nitrogenous compounds compose the majority of saliva. The interaction between saliva and morphological structures, mucosa, and hard dental tissues is critical for overall oral health and physiology. A balance of requirements often governs mouthrinse product formulation, including antibacterial, remineralization, and antidemineralization, stability, and taste requirements. In fact, these requirements are often conflicting, so it is not possible to point out the most effective mouthrinse product among the studied ones here. Consequently, further biological oral bacterial biotome destruction, physicochemical direct substrata surface dissolution, and erosion studies remain to be carried out that are correlated to the discussed here adsorptive, thermodynamic, and wettability signatures of a model mouthrinse/PMMA system useful to create a novel oral hygiene liquid composition selection procedure.

2. Theoretical Background

2.1. Adsorptive and Thermodynamic Surface Characteristics of Surfactant Solutions at Liquid-Vapor (LV) Interface

Surface tension vs. (bulk) concentration ( γ c ) plots for surfactant-containing systems can be analyzed in a wide concentration range, from the premicellar ( c < c m c , where c m c stands for the critical micelle concentration) to saturation adsorption ( c > c m c ) regions, to obtain the interfacial adsorption parameters: Gibbs’ surface excess concentration Γ, molecular area Amolec, surface activity σ = d γ / d c , surface effectiveness γ c m c (the surface tension reduction at the so-called critical micelle concentration), and surface molecular partitioning coefficient of the surfactant molecules between the surface and bulk phase KP, as already performed in surface tensiometry studies on surfactant-preservative formulations for antimicrobial drug protection characterization [12]. Particularly, Gibbs’ equation quantitatively expresses the adsorption of surfactants at the liquid/vapor (LV) interface as follows [5]:
Γ = 1 R T d γ d l n c
where: Γ is related to the area per molecule by Amolec = NA; R—the gas constant; T—the absolute temperature; and NA is the Avogadro number. The surface adsorption Γ, and further the molecular area Amolec can be obtained from the slope of γ plotted versus the (natural logarithm of) concentration. Adsorption of a surface-active agent at the interface leads to the γ decrease as the total concentration is raised. At the particular point (and concentration = cmc), the interface becomes saturated with monomers ( Γ = Γ ). As a result, γ level off. The 2-D surface pressure of the adsorbed film is provided by π = γ 0 γ , where: γ0 and γ are the surface tensions of solvent and solution, respectively. The limiting area per molecule is given by A l i m = γ 0 γ c m c / R T . Above a breaking point of γ c dependence, the concentration range is named the micelle formation region.
The surface activity (σ) of a surfactant in the solution is proportional to the partitioning coefficient K P = Γ / c   of the surfactant molecules between the surface and bulk phases ( c < c m c ), as derived from Equation (1):
σ = d γ d c = Γ R T c
Assuming the conservation law for surfactant concentration, the total amount of surfactant molecules, n (moles), must follow the relation:
n = A Γ + V c
where A and V stand for the interfacial region area and the bulk volume, respectively [13]. It should be noted that intercomparisons of the surface rheological properties of surfactant films (in particular Γ and Amolec) occurring originally at surfaces and these obtained from studies of an interfacial system covering a different area, performed on the same sample quantity of the bulk volume V, require the portioning effect of the surfactant molecules between the surface and bulk phases to be estimated since the geometric surface development coefficient A/V takes different values for the mentioned above systems. Such a correction is required for surfactant solutions with highly developed interfaces likely to be found in foam, emulsion, and other dispersive systems [14]. Surface tension versus temperature studies are important for the correction or calibration purposes of instruments and interfacial system data at different temperatures. The variation of γ for water with temperature T (in °C) is given by various investigators, but reliable data revealed the following dependence proposed by [15]:
γ w a t e r = 75.67 0.14 T 0.29 · 10 3 T 2
Thermodynamic surface parameters discussed here include the surface free energy γ (note that the surface free energy of liquids is commonly referred to as the surface tension), entropy (SS), and enthalpy (HS) of a model liquid interface. The surface entropy and enthalpy (per unit area) can be determined from the γ vs. T dependence [5]. The particular expressions are given by:
S S = d γ d T
H S = γ T d γ d T
Both relations are positive-valued due to the observable γ reduction with the temperature rise. As an example, in a pure water system, d γ / d T takes a negative value equal to −0.16 mN m−1 K−1; as such, HS > Γ. The entropic term in Equation (6) takes into account the energy losses related to the new surface creation. HS, being a temperature-independent parameter, is more informative of the two quantities, or at least it is unequivocally related to molecular arrangements at the interface affected by surface-active species adsorption, as found in seawater tensiometry studies [16].

2.2. Surface Wettability Energetics

The classic formulation of the force balance on the contact line, known as the Young–Dupre Equation, predicts the static, equilibrium (Young) contact angle θ in terms of the interfacial free energies of the three interfaces of the system [5]:
cos θ = γ S V γ S L γ L V
where subscripts SV, SL, and LV denote the interfacial free energies between solid/vapor, solid/liquid and liquid/vapor, respectively.
Most of the solid surface free energy determination formalisms are based on Young’s equation, employing equilibrium CA data [17]. In contrast, the contact angle hysteresis CAH-based model developed by Chibowski allows the solid surface free energy γSV, and the related surface wettability energetic parameters of liquid–solid surface interaction to be derived from only three measurable quantities: the surface tension of probe liquid γLV, and the dynamic contact angles: the advancing θA and receding θR, with C A H = θ A θ R [6]. This approach is one of the latest methods for calculating the surface free energies of polymeric materials. Unlike the other approaches, it takes into account adsorption at the solid-surface interface. The 2D tangential tension Π induced by the adsorbed film is defined as:
Π = γ L V cos θ R cos θ A
As a result, the apparent surface free energy of a film-coated surface γ S F = γ S V + Π reads as follows ( γ S F γ S V ):
γ S V = Π 1 + cos θ A 2 1 + cos θ R 2 1 + cos θ A 2  
The surface free energy dispersive component γ S V d is defined as:
γ S V d = 1 4 γ L G 1 + cos θ A 2
From the surface energetics point of view, forces of dispersive nature dominate in the polymer (PMMA)-water solution system, and the term γ S V d accounts for up to 0.89–0.98% in the total γSV [18].
The work of spreading WS of liquid on a solid surface can be easily derived from the work of adhesion WA ( = γ L G 1 + cos θ A ) and the work of cohesion WC ( = 2 γ L V ):
W S = W A W C
This thermodynamic quantity relates the wettability to the mechanical strength of adhesion and allows us to characterize the competition between solid–liquid adhesions with different liquids [19].

2.3. Surfactant Adsorption at Polymer Surfaces—Adhesional Tension

By referring to Equation (7), the difference between γ S V and γ S L , given simply by γ L V cos θ , is called the adhesional tension, which stands for another important quantity to predict the wetting properties of solid materials affected by surfactant adsorption. As found, there is a linear dependence between the adhesional tension and surface tension of aqueous surfactant solutions ( c < c m c ) [20]:
γ L V cos θ = a γ L V + b
where a and b are constants. On the basis of such a linear relationship and relating Young’s equation with the Gibbs adsorption relation [21], the surfactant’s adsorption amounts at the interfaces can be obtained as follows [7]:
d γ L V cos θ d γ L V = Γ S V Γ S L Γ L V
where subscripts denote the corresponding interfaces. The relative adsorption at interfaces can be simply quantified upon analysis of the γ L V cos θ γ L V plot. By assuming Γ S V = 0 , the surface excesses ratio is provided by the slope a = Γ S L Γ L V , as results from Equation (13).

3. Materials and Methods

Poly(methyl methacrylate) and PMMA (Organika S.A. Sarzyna, Nowa Sarzyna, Poland) square (20 mm × 20 mm) plates, selected as a model polymer substratum, were flushed in a 20% methanol solution in an ultrasonic cleaner for 15 min and rinsed with Milli-Q water. The procedure for preparation and cleaning of PMMA is presented in detail elsewhere [22]. This study evaluated the principal physical properties of six commercially available mouthrinses apart from Coca-Cola, orange, and apple juices (available from local markets) commonly found in the oral cavity, namely surface tension γLV, density ρ, dynamic viscosity μ, acidity (pH), and liquid/solid contact angle (CA). The studied liquid’s surface tension was measured with a tensiometer (PI-MT1M, Donserv, Warsaw, Poland) based on the de Nuoy ring method (6 cm platinum–iridium ring, Sinterface, Berlin, Germany), with an accuracy of 0.2 mN m−1. The pH measurements of the model liquids were carried out with a pH-meter (CP-315, Elmetron, Zabrze, Poland) with a universal electrode. The Ubbelohde viscometer (Equimed, Krakow, Poland) was used for the kinematic viscosity measurements. Table 1 collects the physical and surface characteristics of the probe liquids. Listerine Cool Mint and Dentalux (+alcohol) were the most acidic liquids (pH = 4.3 and 4.9). Low pH values might stimulate the formation of CaF2, which is said to form a protective layer on enamel from which F ions are released [2]. In addition, low pH and high buffer capacity values seem undesirable, leading to enamel demineralization [1].
A circular (10 cm diameter) glass vessel containing the studied solution was temperature-controlled within the range 22–45 °C in order to obtain a surface tension-temperature dependence. Distilled water, used to prepare a diluted mouthrinse solution, was taken from a water deionization apparatus (Millipore, conductivity 0.05 μS cm−1) with pH 6.8 ± 0.1 and the surface tension γLV = 72.5 ± 0.2 mN m−1 at room temperature T = 22 °C. CA measurements were performed on PMMA substrata enclosed in a humidity-controlled cell (see Figure 1 in [23]). To maintain saturation, the probe liquid was placed inside a temperature-controlled cell. A similar CA determination system based on the sessile drop geometry was already used in [24]. The axisymmetric sessile drop shape profile routine was used to evaluate CAs from the sessile drops (3–5 mm in diameter) of probe liquid images [18]. 4–7 CA measurements were performed at 5–10 different surface locations for the spatial inhomogeneity evaluations. The Young-equilibrium CAs were measured after 30 s from the moment of the liquid drop deposition from both sides of the image by means of the ImageJ program and then averaged (the obtained CA determination errors were ~1°). The CA hysteresis, CAH, was evaluated from the sessile drop shape taken with a tilted plate set-up for larger drop volumes (20–50 μL), as presented in [18]. Exemplary sessile drop images for Listerine Cool Mint/PMMA surfaces are depicted in Figure 1. Particular values: advancing CA θ A = 65.2°, receding CA θ R = 18.7°, CAH = 46.5°, plate inclination angle = 24.4°; Young CAs θ = 46.5° (left) and 45.6° (right), mean value = 46.1°. Small raindrops with a radius up to about 2 mm are nearly perfect spheres, but for a larger radius (exceeding the so-called capillary length lc = 2.7 mm for the air–water interface at 25 °C), they become increasingly flattened; the capillary length ( l c = γ L V / ρ g   ) is expressed via the liquid surface tension γLV, density ρ, and gravity acceleration g.
There is a relation adapted here between the Young’s equilibrium contact angle and the dynamic contact angles: cos θ = ½ cos θA + ½ cos θR, experimentally verified for metallic surfaces covered with spread paint layers [25]. However, some more complicated relationships have also been postulated [26]. In order to obtain the surface tension γLV-mouthrinse concentration dependence, surface tensions were determined on the subsequently diluted samples (of initial concentration—c0) and plotted as a function of the normalized (relative) concentration cn = c0/n, where: n = 2, 3 …

4. Results and Discussion

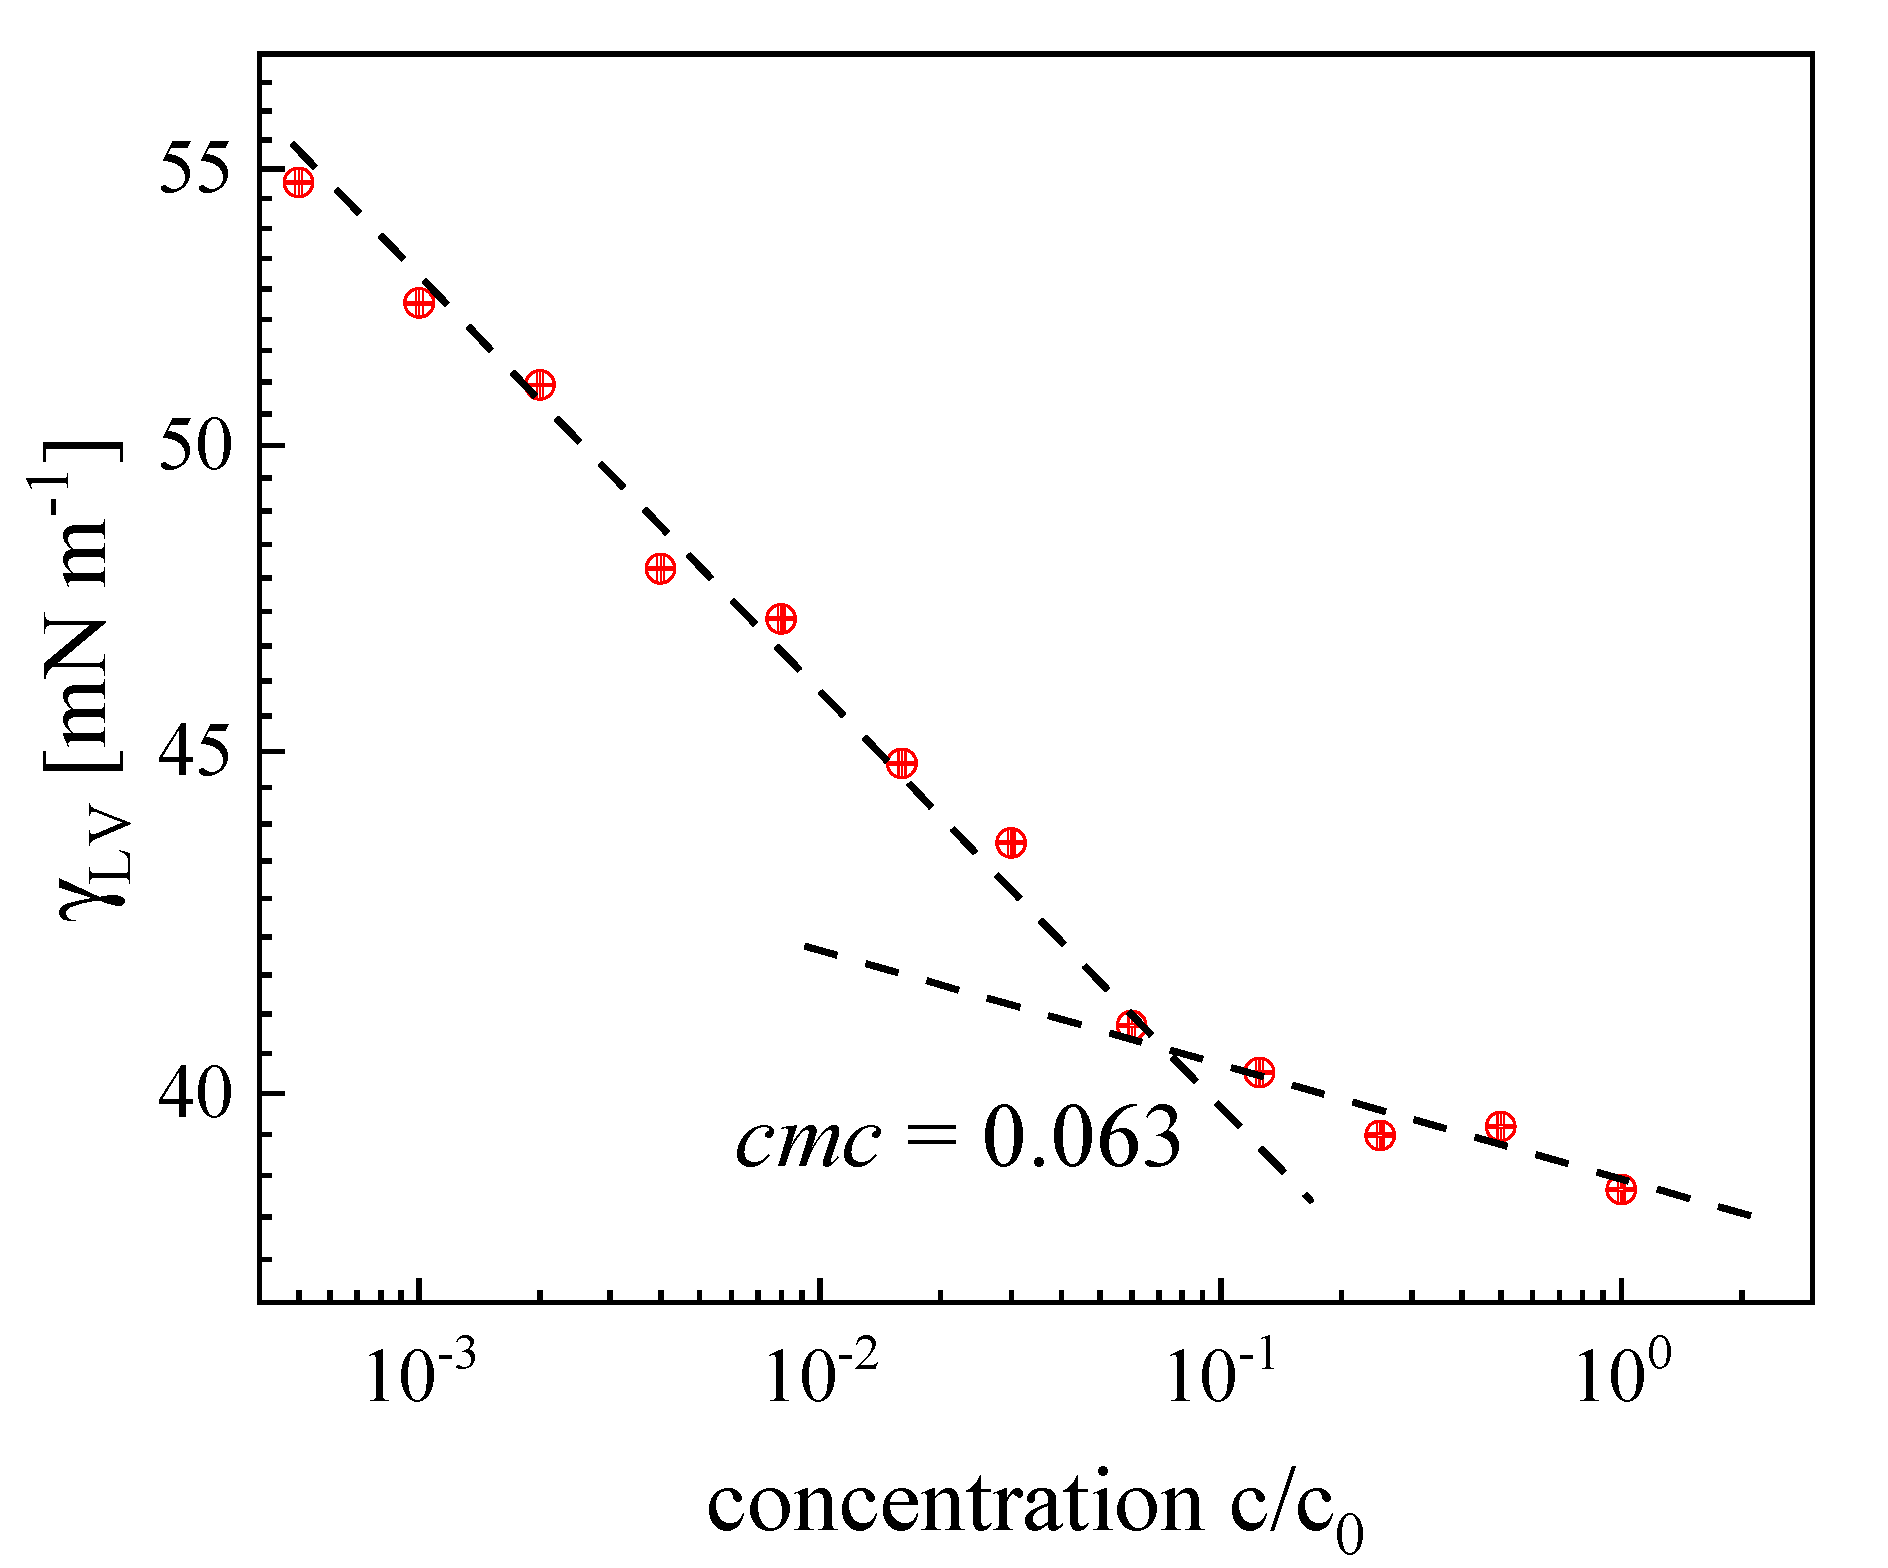
4.1. Surface Adsorptive Parameters of Mouthrinse Solutions at Air/Water Interface

The principal parameters of the surface characteristics for mouthrinse formulations and other model substance water solutions, derived from a surface tension vs. concentration plot, as shown in Figure 2 for Xerostom, are collected in Table 2. In this system, a smooth discontinuity of the γ(c) plot can be first noticed (c < cmc; around 0.5) at the so-called critical aggregation concentration, followed by another one at cmc, where regular micellar structures are expected to appear. Such a scaling approach yields a universal concentration measure of a water mixture of largely unknown composition and surface activity in reference to the original (initial) sample concentration c0.
The lowest c m c value was noticed for Xerostom, whereas for the remaining mouthrinses it was contained within the range 0.03–0.12, still much lower than the original saliva-forming substance mixture (0.31). Mouthrinses c m c data revealed that the concentrations recommended by the producers c0 to apply in a patient’s practice turned out to be around 8–16 times higher than those required to obtain the saturated interfacial layer (at c = c m c ). Under such a condition, the micellar structures are formed in liquid bulk and are capable of entrapping insoluble substances via the micellar solubilization mechanism [5]. As can be seen, the studied substances are capable of lowering the water surface tension (=72.5 mN m−1) by approximately 20–30 mN m−1.
It seems to be of interest to compare surface effectiveness γcmc for a group of model surfactants used in physical chemistry studies. For example, anionic SDS (sodium dodecyl sulfate) lowers the water surface tension to ~44, cationic DTAB to ~35 and non-ionic C12Em to ~32 mN m−1. Further adsorptive parameters: surface activity σ = d γ l v / d c / c 0 (obtained from the linear part of the γ L V c plot for c < c m c ), and the corresponding Amolec related to Γmax were determined as well. Γmax values remained in the range spanning from 0.24 to 0.94 ·106 mol cm−2, which corresponded to the limiting Amolec varying from 170.2 to 839.5 nm2 molec.−1, which is characteristic for so-called LE (liquid expanded) surface films [8]. Amolec values registered for medical liquids (glycerol and glycols) turned out to be lower by a factor of 102 (0.58–1.57 nm2 molec.−1 [27]). Saliva-formed films revealed Alim (=12.6 nm2 molec.−1), i.e., 10 times lower than the mouthrinse did on average. From a medical point of view, it is particularly important to attain a concentration of free preservative agents (included in mouthrinse formulations) in water high enough to achieve sufficient antimicrobial protection. It seems clear that preservatives may remain more or less available for contact with microorganisms depending on their location, i.e., air-water, solid water, or bulk water phase. The surface activity of the surfactant σ is proportional to the partitioning coefficient K P = Γ / c of the surface-active species between the air/water and bulk phases. Among the studied mouthrinses, the most surface-active agents were Eurodont and Dentalux (the lowest c m c and γcmc, and the highest |σ|). In addition, the highest absolute values of σ indicate that the mentioned substances molecules are most hydrophobic and slightly soluble in bulk. Our previous surface tensiometry studies on formulations of surfactants with preservatives revealed, in particular, that methylparaben has |σ| value about 10 times lower than benzalkonium chloride (BAC) and is more soluble in the aqueous phase in the form of free molecules, making it more available for contact with microorganisms residing therein [12].

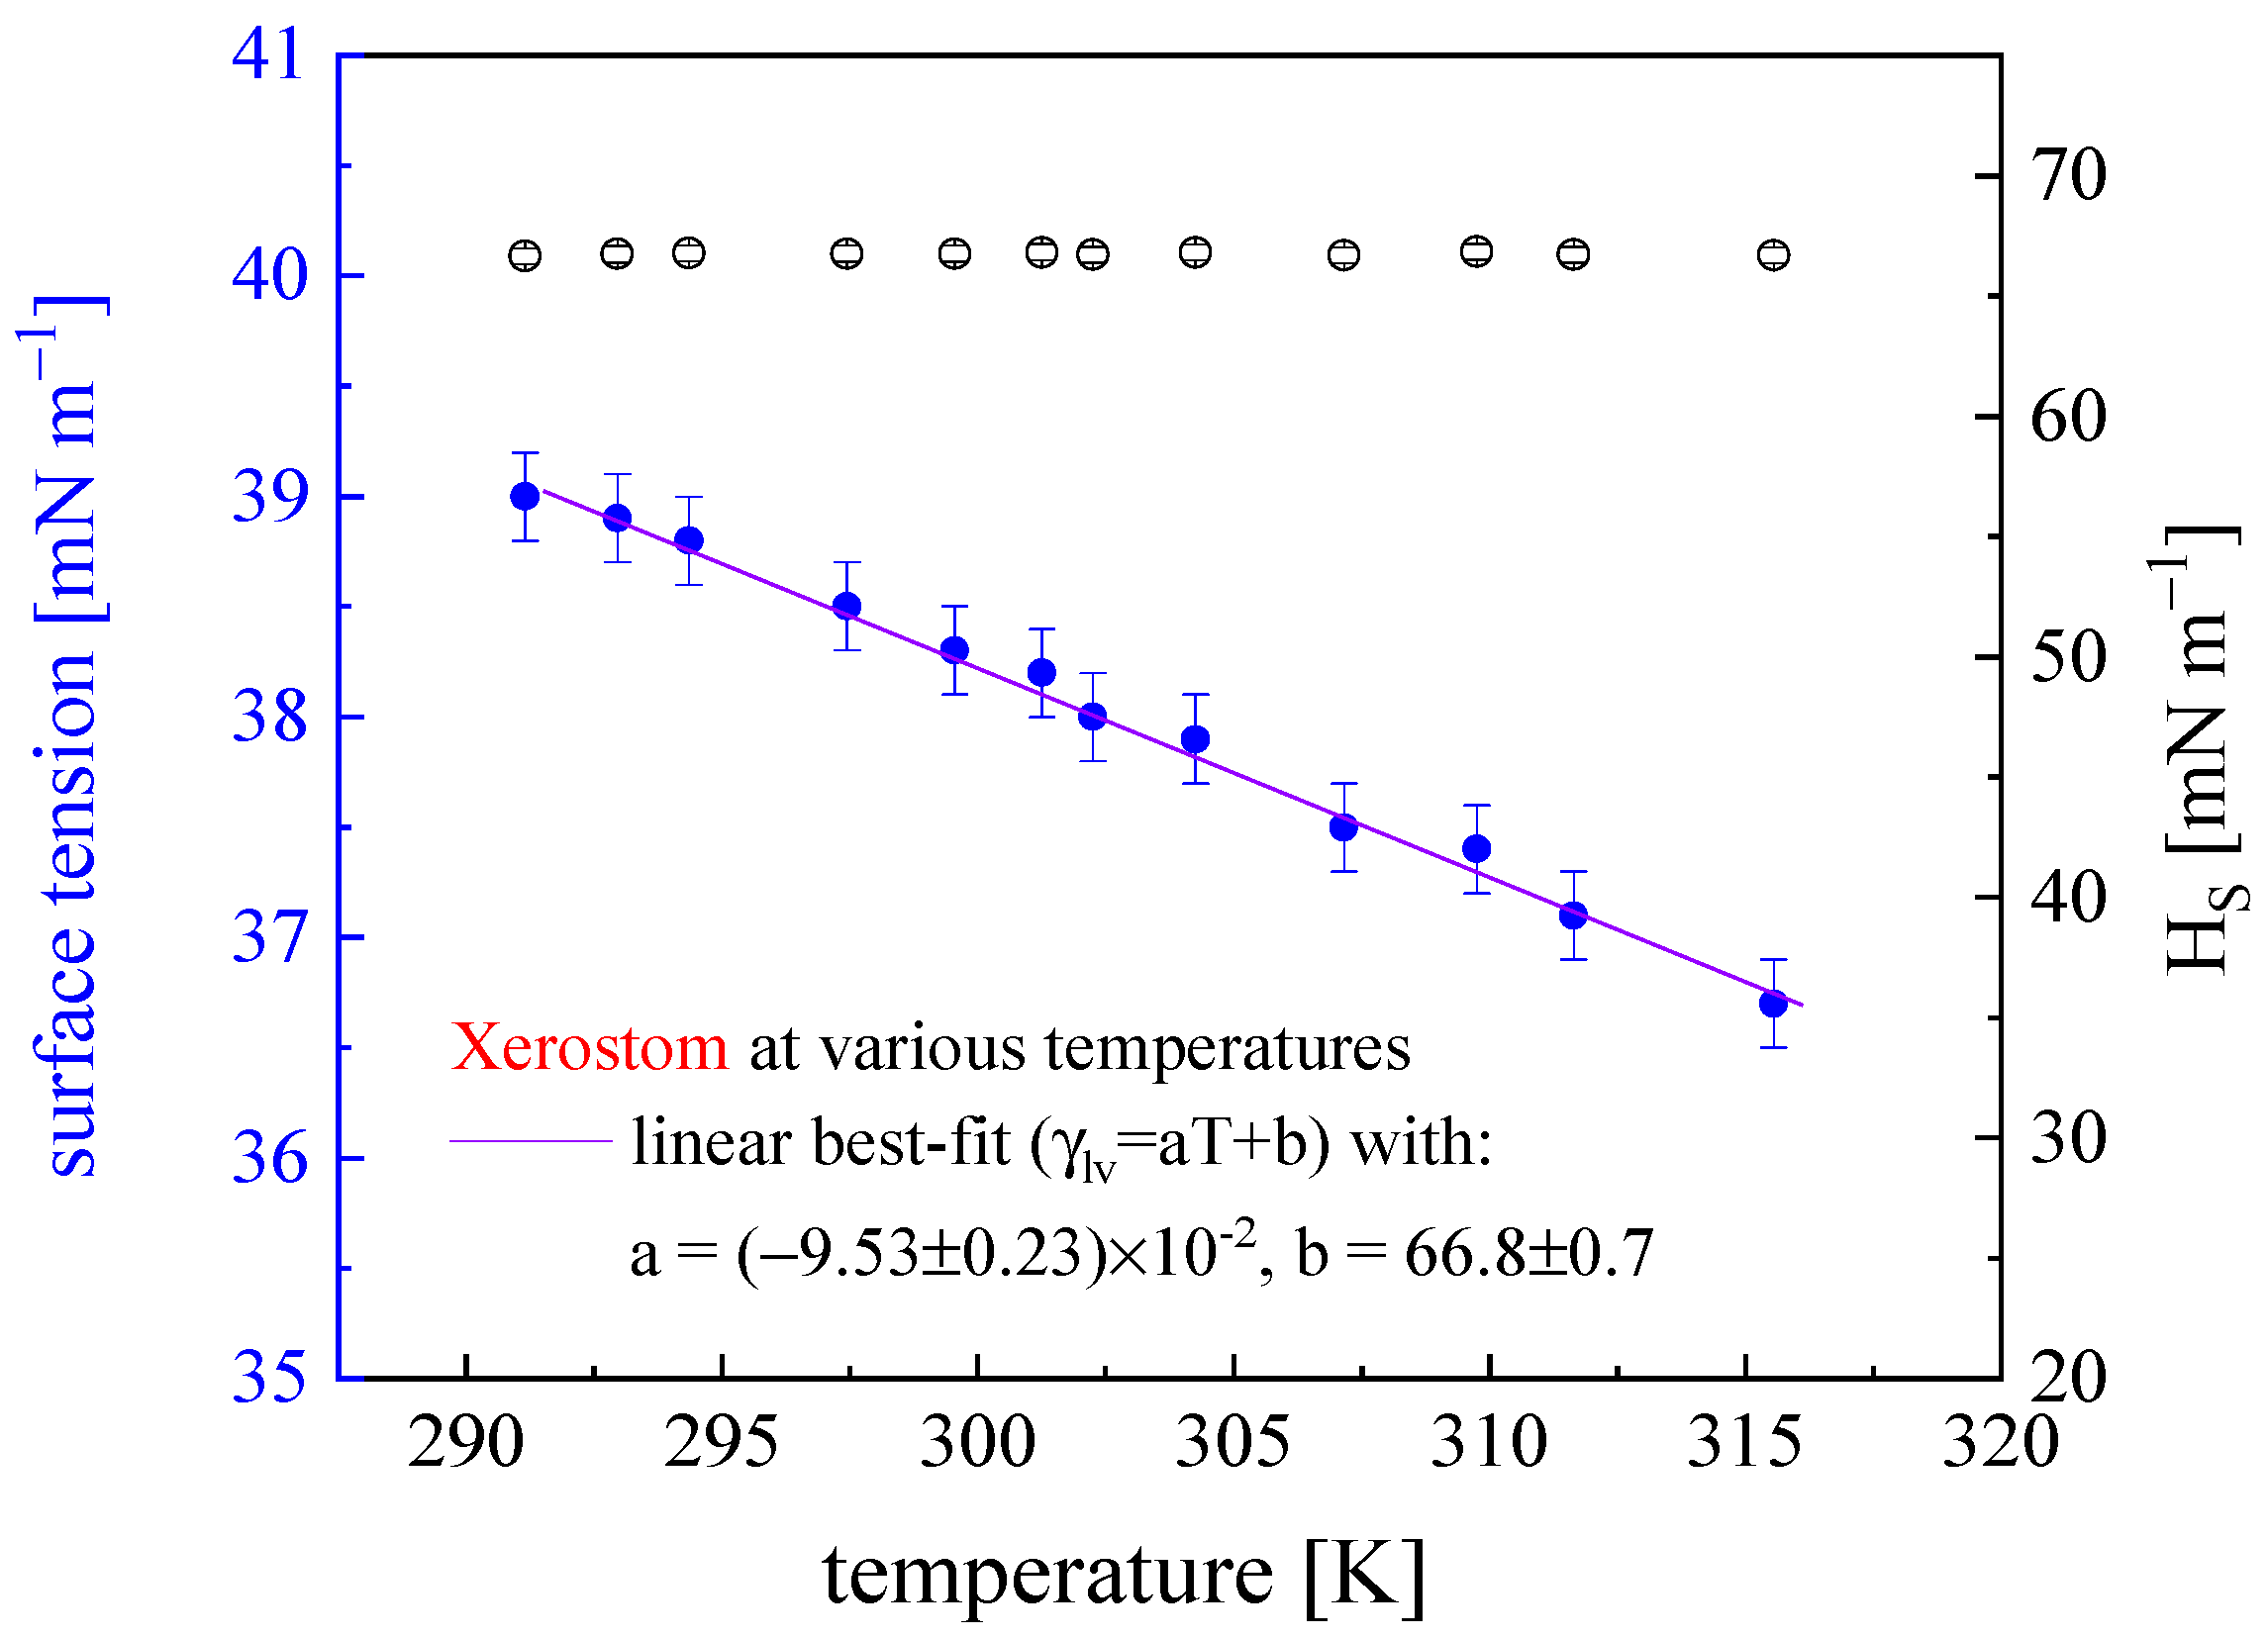
4.2. Surface Thermodynamics Characteristics

An exemplary surface tension γLV versus temperature T dependence, together with HS thermodynamic potential variability, obtained for Xerostom, is shown in Figure 3. A complete set of surface thermodynamic functions for the studied liquids is collected in Table 3. The observable quasi-linear γLV(T) dependence can be approximated with a function γLV = −0.095T + 66.8. HS remains almost constant, slightly leveling down as T increases. SS (values from the TSs column (Table 3) divided by T = 295 K) took values ranging from 0.10 to 0.23 mN m−1 K−1, comparable to the ones found for juices, pure water (0.13–0.18), and saliva (0.11). Higher values of SS point to a less complex surface layer structure consisting of adsorbed surface-active agents and counter ions present in the sub-layer water phase. A double electric layer likely to be present here forms an interfacial system of particular thermodynamics (of higher work of cohesion, WC = 2 γLV) [28].
Surface tensions of the mouthrinses (= 31.7–39.9 mN m−1) are significantly lower than values characteristic for pure water (72.5), its water solutions (61.1–64.1), and saliva (53.6). It is known that the surface active substance adsorption leads to the surface tension drop d γ L V = Γ d μ , where μ is the chemical potential related to the concentration via d μ = R T   l n c , while the Gibbs surface excess Γ d γ L V / R T (see Equations (1) and (2)) for a gaseous surface film according to the Langmuir approach [5]. Surface entropy decreases with an increase in surface adsorption of the amphiphiles [29]. In other words, the surface adsorption from the bulk solution causes a larger negative entropy change.
Generally, HS took lower values for the mouthrinses (66.8–97.6 mN m−1) in reference to pure water (118.8), their derivatives (99.1–116.8 mN m−1), and saliva (85.6) as well. It can be noted that the entropic term TSS (related to the formation of the interfacial surface) contributions to the surface enthalpy HS varied from 0.42 to 0.68, being higher if referred to the pure water reference (0.39), reflecting the presence of adsorbed species. Lower TSS contributions were also noticed for other water-based liquids (0.38–0.41). In the studied water solution mixtures, besides proteins, carbohydrates, and glycerides, which are characterized by small surface activity, there are also very active free fatty acids, active esters, and alcohols. Their relatively small presence can strongly affect the resultant surface tension of a multicomponent film. In such highly structured, polymer-like interfacial systems, the thermodynamic and kinetic processes appear to be more complex [30]. It is interesting to note that the adsorption process is entropy-controlled (TSS > γLV) for Listerine, Dentalux (+alcohol), and Dentalux (alcohol free), but the opposite situation, i.e., (TSS < γLV) was evidenced for Xerostom, pure water, its derivatives (Coca Cola, orange juice), and saliva. Eventually, Ortho Salvia Dental and Eurodont formed adsorptive layers with TSS~γLV.

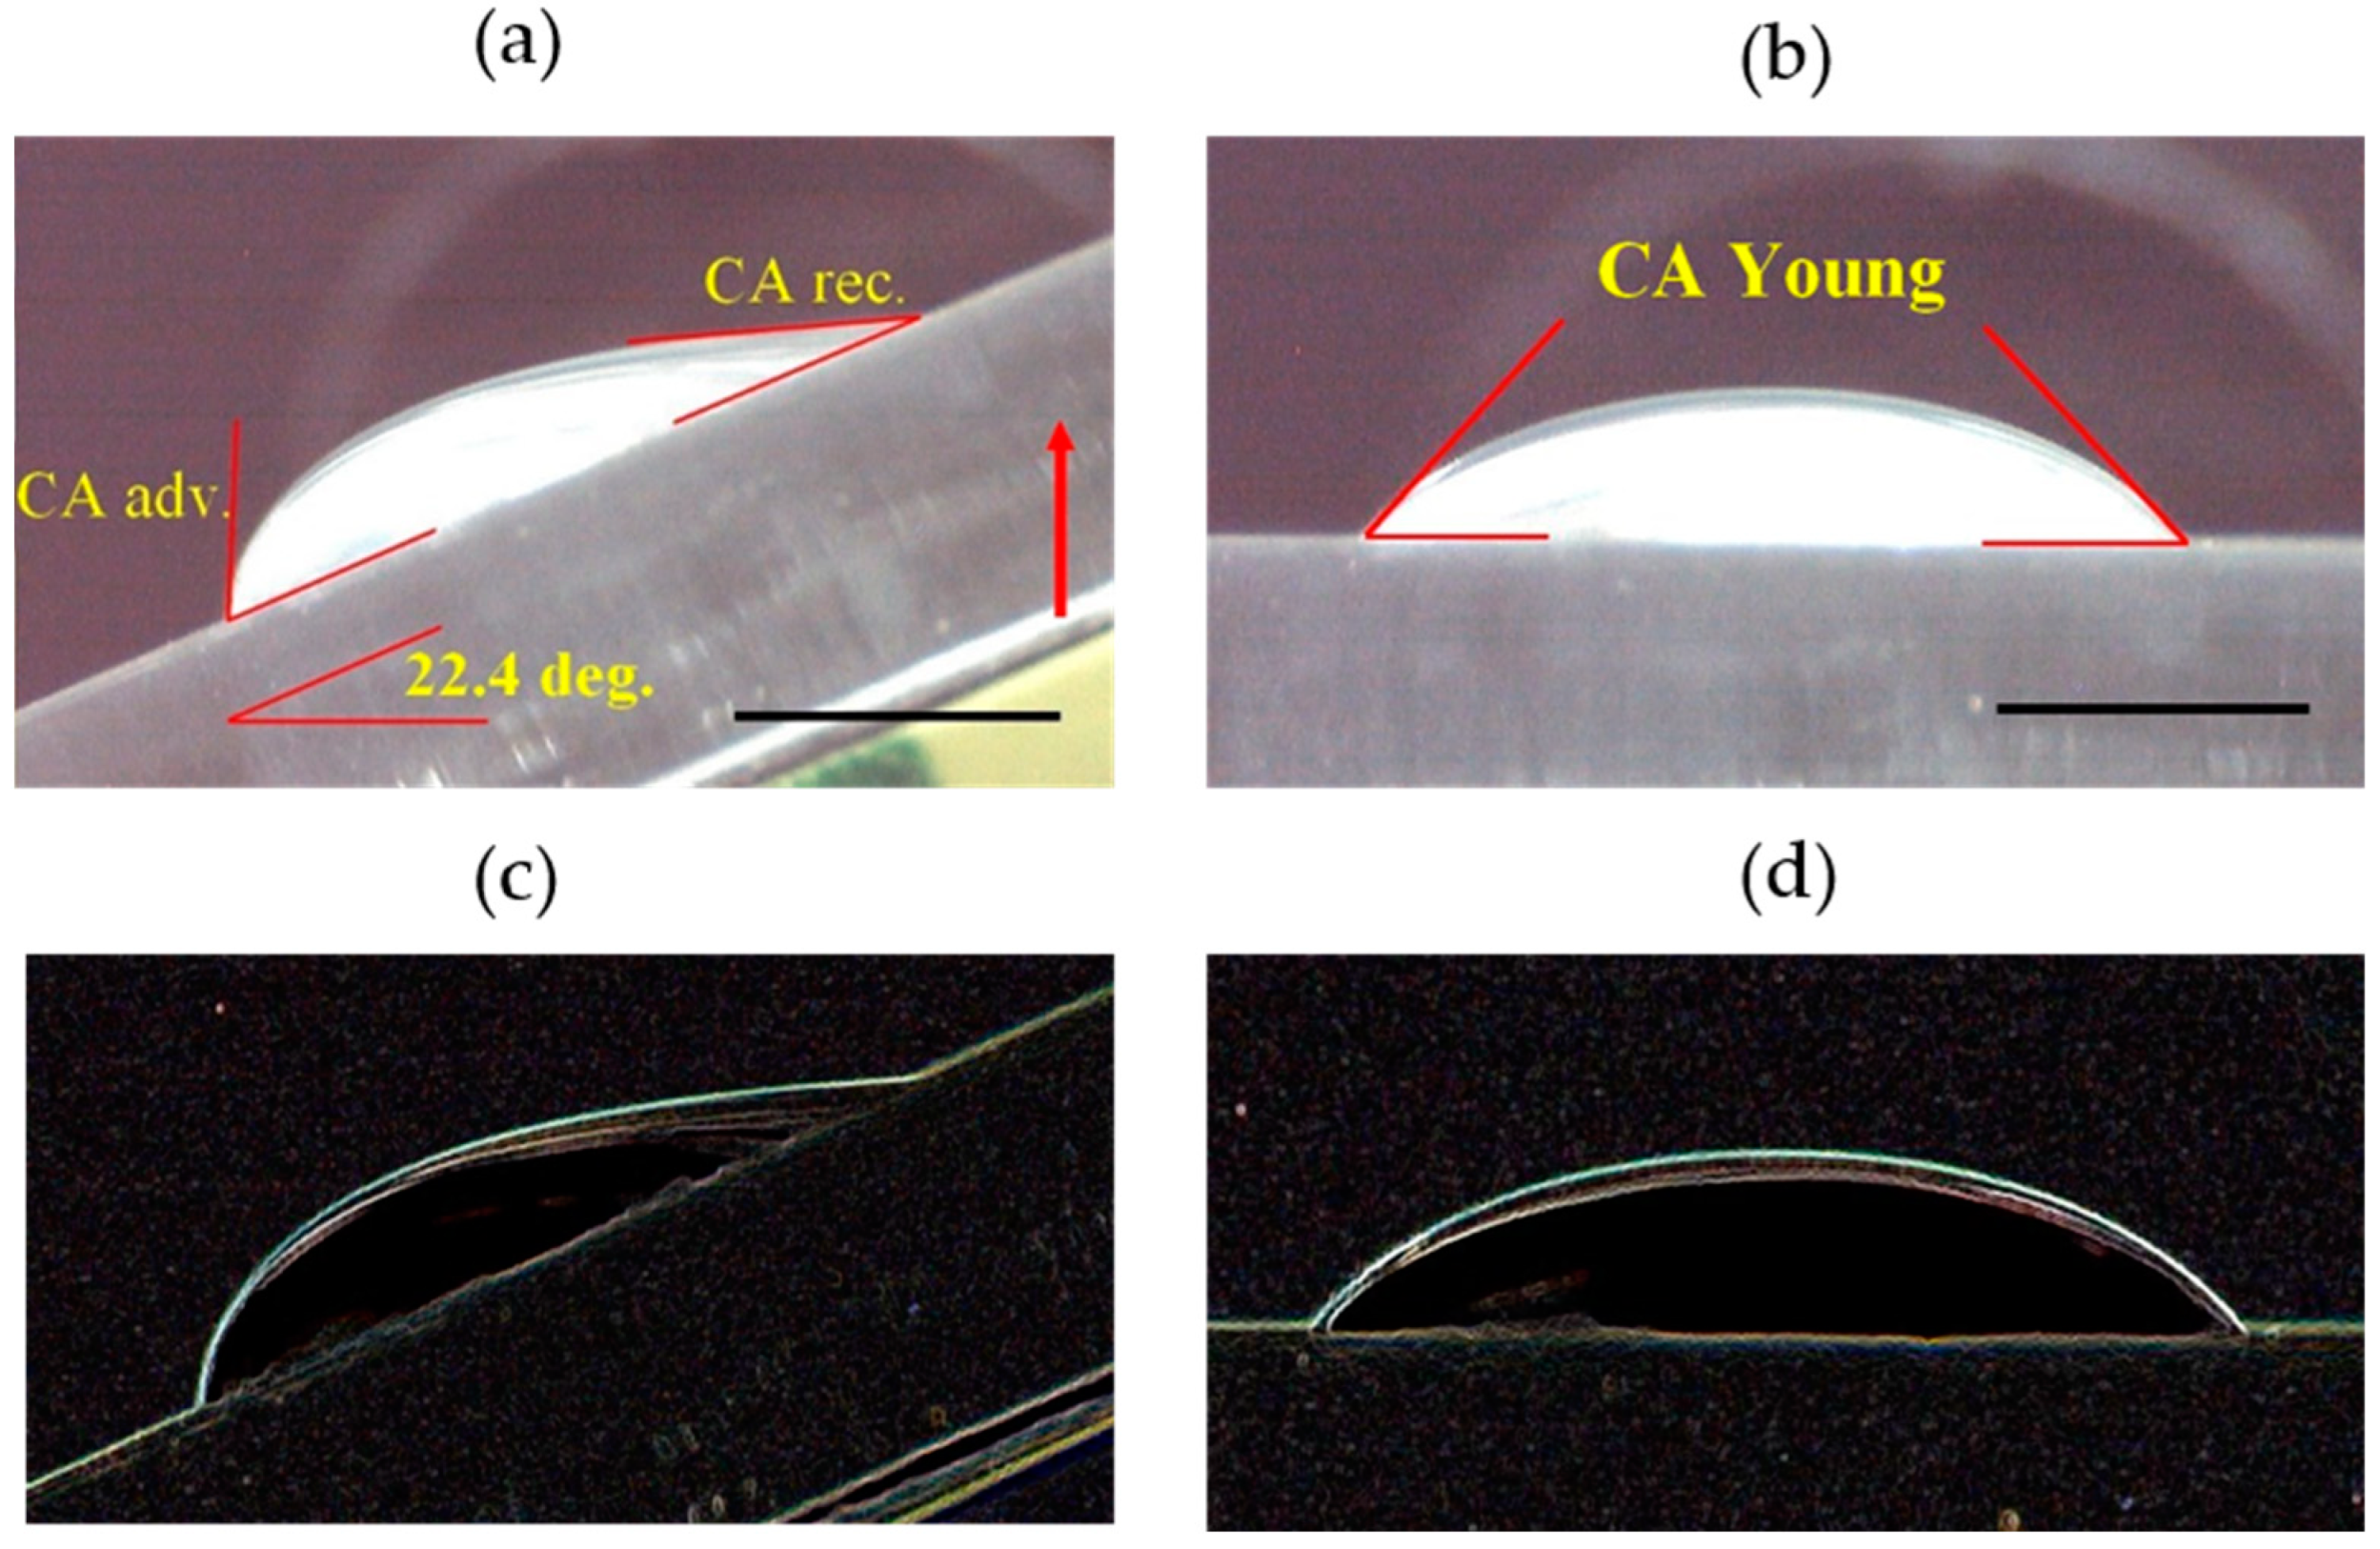
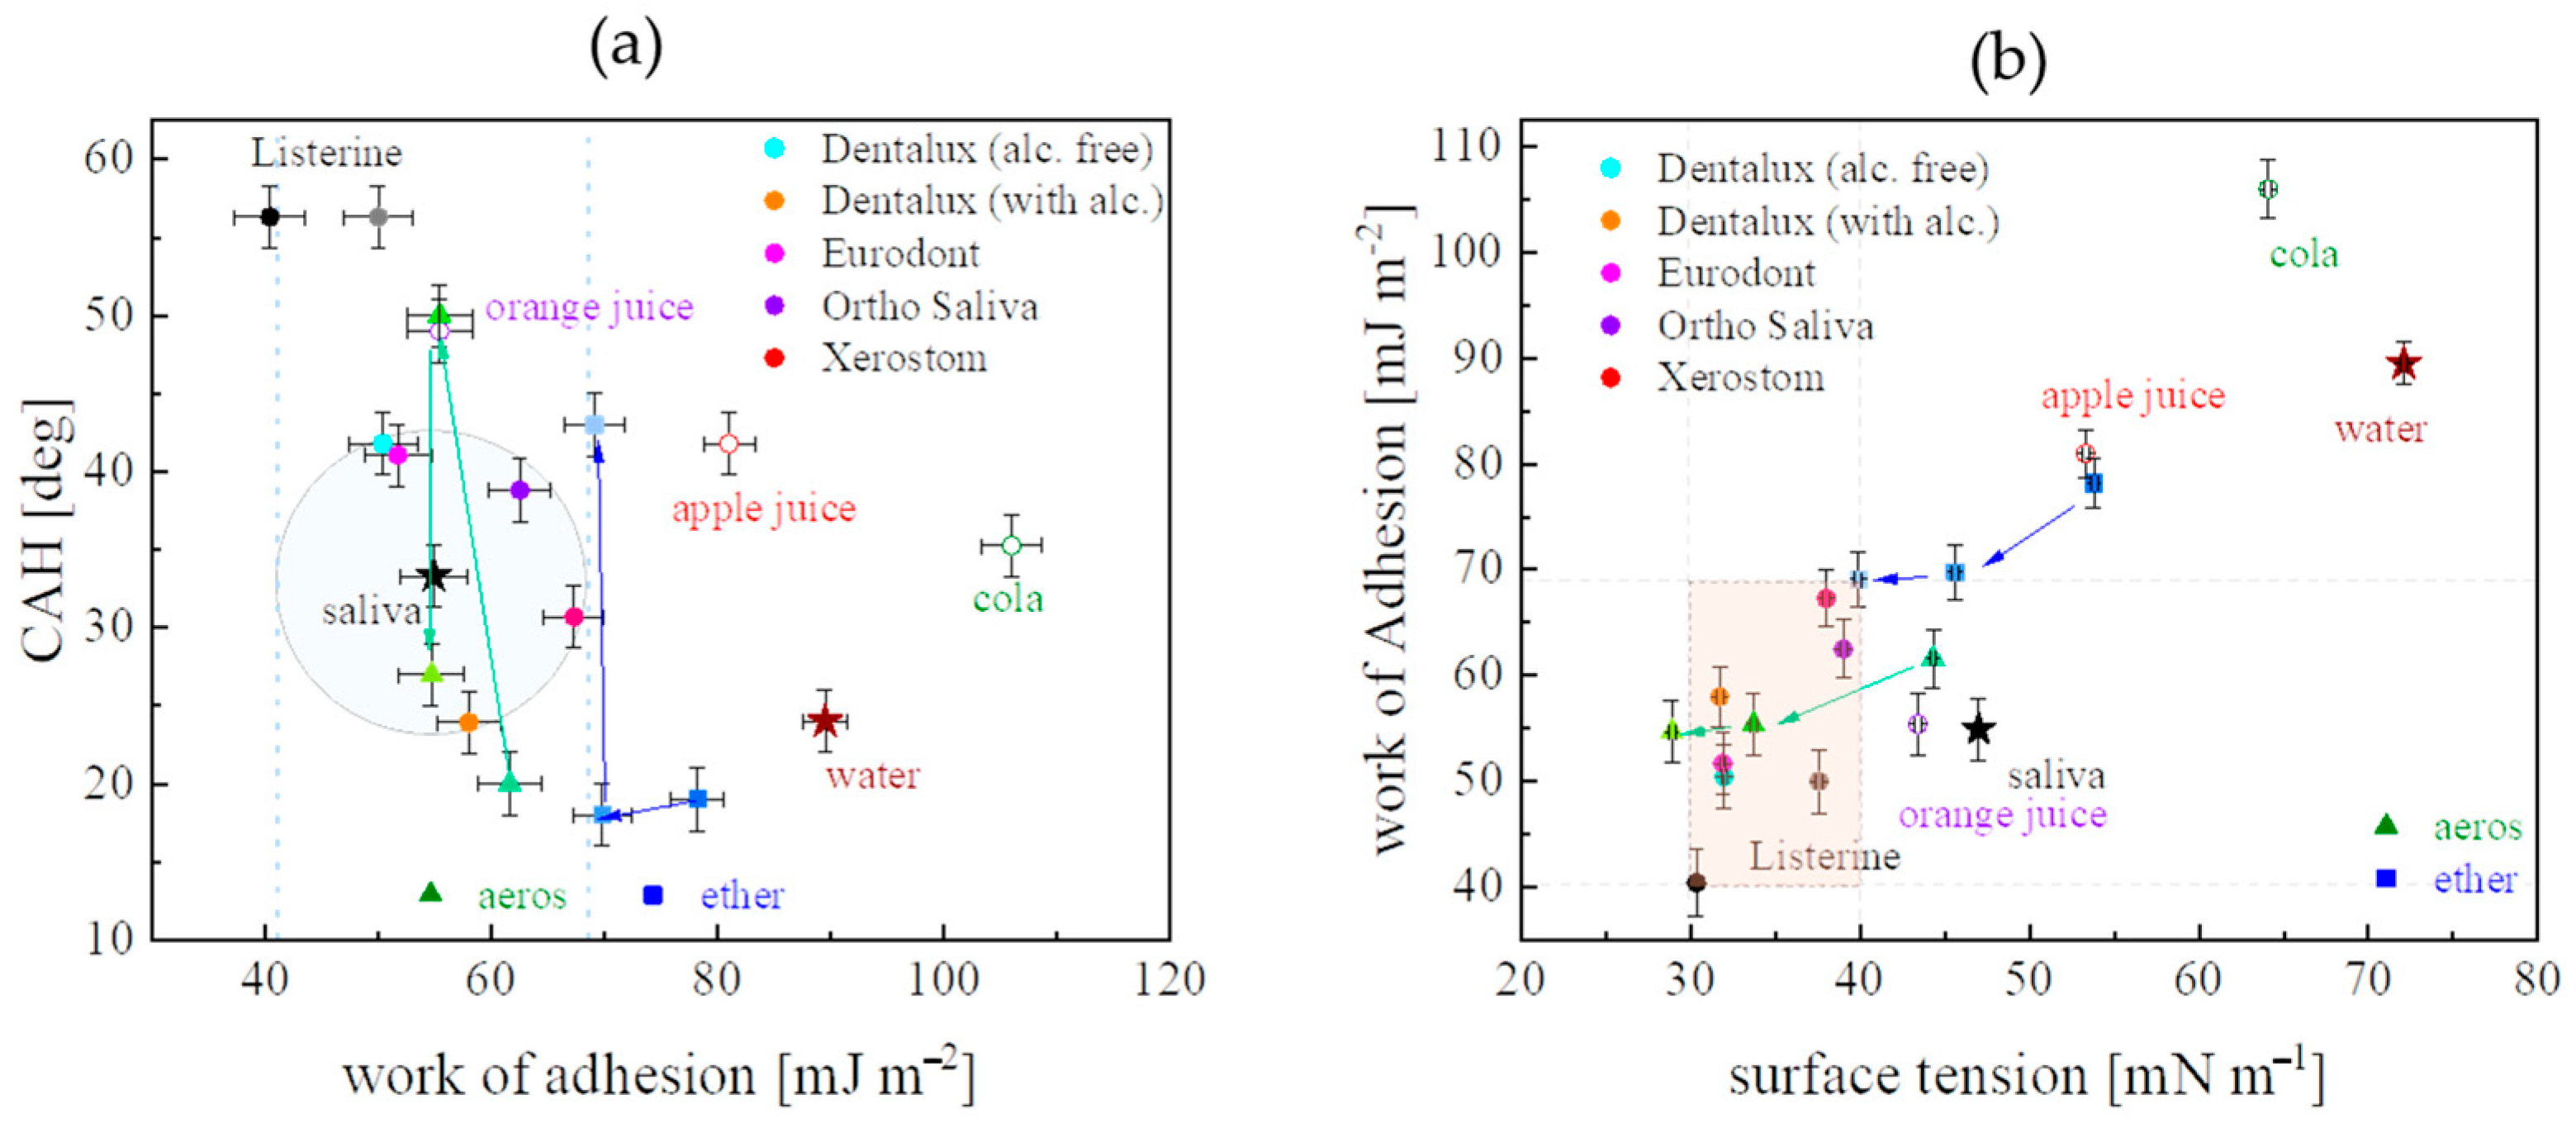
4.3. Wettability Energetics from the Contact Angles Analysis

By referring to Table 4, the value of the static equilibrium contact angle θ for the reference system PMMA–pure water (=64.7°) is significantly higher than for the other probe liquids by about 20°, varying in the range of 30.2 (Eurodont) to 46.1° (Listerine); as such, the systems can be considered hydrophilic (Θ < 90°). A decrease in θ and γSV observed as the PMMA is successively exposed to mouthrinses results from a few effects: adhesion of the liquid compounds, irreversible adsorption in solid pores, chemical erosion of polymeric surfaces, etching and micro-roughness creation, leaching of the more soluble PMMA components, etc. The remaining probe liquids (juices, Cola, and saliva) possess higher both θ and γSV comparable to the pure water reference case. Generally, values of γSV point to the low energy surface of the PMMA, ranging from 38.9 to 22.4 mJ m−2 in contact with pure water and Dentalux (alcohol-free), respectively. Such surface energies are characteristic of hydrophobic surfaces like polymers (20–30 mJ m−2). For all the studied water solutions, which mimic liquids found in the oral cavity, an increase in exposure time leads to the same trend: θ↓, γSV↑, and WA↑ i.e., evidence of transition processes taking place at the solid/liquid interface (research in progress).
The contact angle hysteresis approach provides several further parameters, collected in Table 4, for the PMMA-probe liquid system that are useful in quantitative evaluations of surfactant-containing liquid/hydrophobic solid surface interactions. As a matter of fact, contact angle hysteresis parameter variability (referred to the clean, unaffected surface case) rather than their absolute (particular) values stand for a useful tool for the PMMA surface adsorption modification tracing after exposure to mouthrinse solutions. For the pure water at the PMMA surface, CAH = 24 ± 2.0° was similar to the one reported in the literature (=23.5 ± 1.5° [31]). There are several reasons responsible for the hysteresis effect occurring jointly: surface microroughness, chemical heterogeneity, liquid drop size effect, molecular reorientation of the adsorbed surfactant molecules, liquid penetration into solid pores, sandwich-like structures of the interfacial layer, etc.
CAH values for the mouthrinse-treated surfaces are rather high, ranging from 23.9 (Dentalux + alcohol) to 46.6° (Listerine), which exhibits a surface activity diversity of the surface-active species forming the mixture since θA (42.2–65.2°) corresponds to the most hydrophobic component, whereas θR (12.1–22.3°) points to the less hydrophobic one. 2-D film pressure Π (4.9–19.8 mN m−1) was several times lower than recorded for the PMMA surface contacted with saliva, pure water, and water-originated liquids (20.3–29.2 mN m−1) which seems to be an effect of competitive surface adsorption at the PMMA/liquid interface. A water solution of mouthrinse spreads the PMMA surface to a greater extent (lower Π and WA) and is capable of covering, on the basis of competitive adsorption rules, the already covered surface with less surface active species. It makes the surface adsorption of mouthrinse solutions on the PMMA substratum a process favored energetically. Such a product can effectively remove already-adsorbent surface contaminants occurring on the dental material. As: W A = γ L V + γ L V c o s θ A , the second term, i.e., the adhesional tension contribution to WA (given by the ratio:   γ L V c o s θ A / W A ), spanned from 0.29 (Listerine) to 0.45 (Dentalux + alcohol), and attained only 0.11 and 0.02 for pure water and saliva, respectively. Such a surface-energetics-derived parameter seems to be a signature of the adhesive strength removal ability of the mouthrinse liquids. The differentiated polarity of the probe liquids in contact with the PMMA surface is reflected in the distribution of the experimental points placed in the 2D space of CAH plotted versus WA and of WA versus γLV, as depicted in Figure 4a and 4b, respectively.
As depicted in Figure 4a, a circled, shaded region covered an area CAH of 23.0–42.5° and WA of 42.1–67.8 mJ m−2, corresponding to the data for the studied saliva and mouthrinse-mediated PMMA surfaces. Other water-derived mixtures (water, juices, and Coca-Cola) and pure one-component surfactant solutions (despite their polarity and concentration) demonstrated significant point scatter outside the specified region that pointed to the particular adhesive signatures of the mouthrinse formulations. Similarly, in Figure 4b, the mouthrinse-corresponding points were contained in a narrow shaded box limited by WA ranging from 41.2 to 69.2 mJ m−2 and γLV varying between 29.8 and 40.1 mN m−1, presented on the remaining background data located far outside this specific region. Finally, the particular values of CAH, WA and γLV established in contact angle studies can be of use in the selection of the most proper and specific model liquids for further dental material wettability adjustment recommendations. From the surface energetics point of view, in the PMMA/water solution interactions, forces of a dispersive nature prevail, where the dissipative term γ S V d in the total solid surface free energy γSV accounts for up to 89–98%. The polar and dispersive terms of the total surface free energy for the PMMA surface affected by the studied liquids are depicted in Figure 5. Rather low γ S V p values were obtained for mouthrinses (1.29–3.56 mJ m−2), significantly lower than those exhibited by the remaining liquids (4.54–11.1 mJ m−2). The dispersive term γ S V d values were contained within a narrow range of 18.92–29.31 mJ m−2. The alcohol addition to the Dentalux mixture resulted in a lowering of γ S V p and in an increase of γ S V d . The concentration increase of the standard surfactant solutions, both non-ionic (ether) and anionic (aeros), evidenced a significant drop of the polar component, from 7.3 and 6.2 mJ m−2 to 2.4 and 1.3 mJ m−2, respectively. At the same time, the dispersive term increased slightly from 26.8 and 22.3 to 30.0 and 26 mJ m−2, respectively. In general, the behavior of surfactants at the interface is determined by a number of forces, including electrostatic attraction, covalent bonding, hydrogen bonding, and the solvation of various species. Steric forces arise when molecules with long chain segments are present in the system, e.g., surfactants or polymers.
Generally, it was demonstrated that the CAH is neither correlating to wettability nor adhesion by showing the lack of correlation between the difference θAθR and θ, and the pull-off force (adhesion). Overall results indicate that the CAH originates from a single source: the difference in liquid−solid interaction in the vicinity of the contact line during receding and advancing movement modes [33]. Hysteresis of the Cassie−Baxter wettability state (likely to be present here) depends on θR; the smaller θR, the larger CAH. Moreover, θA is independent of the solid area fraction, and θR decreases and the hysteresis increases as the solid area fraction increases. The large hysteresis is indicative of stickiness. The increased interactions at the water–adsorbed film interface drag the receding contact line, resulting in smaller θR and larger CAH. It is important to point out, that the CAH has two components (θA and θR). Thus, if the CAH is dominated by the liquid−solid interaction at the interface, it will manifest as adhesion. In fact, adhesion correlates to θR alone [34]. Moreover, only a surface modification process accompanied by a decrease in system energy can occur thermodynamically. In surfactant solutions, the changes in CA depend on the orientation of surfactant molecules on a surface. For a strongly hydrophobic surface, it is usually accepted that the hydrocarbon chain of a surfactant faces the surface, leaving the polar group exposed to water and thus causing a reduction in contact angle. Therefore, the interaction between a hydrophilic part of a molecule and the PMMA occurs not through direct contact between the two entities but via a layer of water film sandwiched in between. Since water could not adhere to, or spread over, the PMMA, i.e., water is mobile or slips on the hydrophobic-group exposed surfaces. As a result, the surfactant molecules are oriented on the PMMA surfaces in such a way that the hydrocarbon chains face the surface with the polar groups facing water, thus reducing the contact angles with increasing surfactant concentration (see Figure 12 in [35]). It should be noted that on the PMMA surface, the –CO, –OCH3 and –CH3 groups are present [36]. Therefore, surfactants can interact with PMMA surfaces through a variety of adsorption mechanisms. Oxygen in the –CO and –OCH3 groups can behave as an electron-donor in contact with water or other liquids having active hydrogen, but hydrogen in –CH3 has a small tendency to behave as an electron-acceptor and in some cases only very weak hydrogen bonds can be formed [36]. For this reason, PMMA is called a monopolar solid, in which the contribution of the electron-donor interaction in the adhesion of the liquid to the PMMA surface plays an important role. It is reflected in the surface free energy of PMMA, its components, and related adhesion parameters.

4.4. Wettability Characteristics vs. Bacterial Adhesion

For effective polymer surface preparation in order to avoid bacterial adhesion, multiple aspects of material properties should be considered, such as surface free energy, wettability, surface charges, and material surface architecture, as reviewed in [37]. In particular, surfaces with moderate wettability are more capable of binding bacteria or cells if referred to as extremely hydrophobic or hydrophilic surfaces. Water contact angles of 40–70° turned out to enhance cell adhesion and growth, whereas surfaces with CA of 54–130° had a higher adsorption of bacterial peptidoglycan. A hydrophobic substratum material with a surface energy of 20–30 mJ m−2 produced lower bacterial adhesion as compared to materials with higher surface energies. It was found that the polar component of the surface energy is important for cell adhesion and spreading, where a polar component lower than 5 mJ m−2 led to reduced cell spreading and a polar component greater than 15 mJ m−2 promoted spreading. It should be noted that a superhydrophobic (CA > 150°) surface can be prepared by enhancing material roughness to reduce the apparent surface energy, and because of this roughness, air becomes entrapped between roughening features when a liquid is in contact with the solid surface. Thus, the maintenance of entrapped air plays a crucial role in suppressing bacteria adhesion by reducing the contact area at the interface and further decreasing the adhesion force. The area fraction ( f ) where a probe liquid is in contact with a solid surface as opposed to air can be derived from the apparent contact angle ( θ C B ), assuming the Cassie-Baxter wetting state, and the Young contact angle θ at a smooth surface: cos θ C B = f cos θ + 1 1 , as shown in exemplary water contact angle studies of polystyrene samples with varied surface wettability resulting from the plasma substrate treatment [37]. As a result, the surface energy was substantially increased, especially in the polar component, and the dispersive component was decreased significantly.

4.5. Mouthrinse Dissolution Effect on PMMA Wettability

The original mouthrinse product (Eurodont) of initial concentration ( c 0 ) was subsequently dissolved with ultrapure water and then used in CA PMMA surface wettability studies. Wettability parameters for the system are collected in Table 5. First, the normalized concentration of saturation adsorption c m c (=0.032 c 0 ) was determined from the γLV( c / c 0 ) plot, as already given in Table 2.
Values of θ, θA, θR, CAH, and Π as a function of the normalized concentration c / c 0 are shown in Figure 6a. As expected, for a regular surface-active compound mixture, in the submicelle region ( c > c m c ) no significant CA variability was observed. For concentrations lower than c m c , a continuous increase of static and dynamic CA was observed. However, in this region, CAH fluctuated around ~20.5–27.6°; similarly, the 2D adsorptive film pressure (Π) took significantly, i.e., two times higher (~27.7–32.0 mN m−1) values in reference to the sub-micellar region. This phenomenon results from the complex response of the already adsorbed molecular film structure to the adhesion tension ( γ L V c o s θ A ) induced by the mouthrinse application. CAH versus WA dependence, plotted in Figure 6b, can be approximated by a linear function (R2 = 0.83) as CAH↓ and WA↑ with serial dilution and liquid polarity. The concentration dependence on both γLV and WA is depicted in Figure 6c. A continuous decrease of both quantities was observed in the sub-micellar range ( c < c m c ), but γLV attained almost a constant value (γcmc~32.4 mN m−1) whereas WA further increased in the post-micellar concentration range ( c > c m c ). Since WA is given by the sum of the surface tension and the adhesional tension, the observed WA (under the condition γLV~const for c > c m c ) could result from the different multilayered structure organization of the adsorbed film (see Figure 7 in [7]). The slope of the γ L V cos θ A γ L V dependence, depicted in Figure 6d, allowed the surface surfactant excess ratio: Γ S L / Γ L V to be determined (see Equation (13)). The excesses ratio derived for pre-micellar and post-micellar concentration ranges by means of a linear best-fit procedure was equal to –1.81 ± 0.61 and −1.49 ± 0.23, respectively. The conventional surfactants exhibit negative slopes (from −0.33 to −0.17), which indicates that they adsorb at the PMMA-water surface via hydrophobic interactions [38].

4.6. Mouthrinse Surfactants Partitioning between LV and SL Interfaces

The Γ S L / Γ L V ratio, i.e., the surface surfactant excess ratio, was derived for all the studied mouthrinse solutions over the whole concentration range from the slope of the linear fit to the γ L V cos θ A γ L V dependence plots. The obtained values for the selected mouthrinse formulations, together with the data reported by others for the surfactant water solutions of differentiated polarity in contact with PMMA substratum, are collected in Table 6.
In general, the Γ S L / Γ L V ratio for conventional surfactants such as non-ionic surfactant TX-100, Tween 20, anionic surfactant SDS, and cationic surfactant CTAB are all negative, demonstrating that they adsorb at the PMMA-water interface via hydrophobic interactions. Meanwhile, the conventional surfactants exhibit an absolute slope value of about 0.3, which indicates that they are likely to tile at the PMMA–liquid interface with about 1/3 of the adsorption amounts at the air–liquid interface. In particular, the slope of the linear dependence between the adhesional tension and surface tension is higher than −1 (from −0.33 to −0.17, see Figure 2 in [38]). As it was found, the effect depends on the kind of binary surfactant mixture and its composition. The surface excesses ratios measured here were all negative and contained a range from −1.49 (Eurodont) to −0.20 (Ortho Salvia Dental) at pre-micellar concentrations. Generally, the slope ( = Γ S L / Γ L V ) values were lower than −1, which is evidence of a higher surface concentration of the adhered material at the S/L interface than at the L/V one. Since the mouthrinse is a mixture of several compounds of differentiated surface activity, vertically complex sandwich-like multi-layered molecular structures could be formed, as suggested in [7]. Moreover, zwitterionic surfactants with hydrophilic polar heads containing both a positive and a negative charge show unique adsorptive properties on a solid substratum. For instance, betaines are an important kind of zwitterionic surfactant with high surface activity that could be found in several mouthrinse formulations [20]. Since in the literature it is suggested that the –CO, –OCH3 and –CH3 groups are present at the PMMA surface, for betaines, more than one adsorption interaction between surfactant molecules and the PMMA surface will appear: at low bulk concentration, the betaine molecules adsorb at the PMMA-liquid interface mainly through hydrophilic interaction with alkyl chains oriented towards the solution, which results in a decrease in adhesional tension. However, at concentrations far higher than c m c , more betaine molecules adsorb onto the solid surface by hydrophobic interaction and make the solid more hydrophilic, which would improve adhesional tension. As a result, the adsorption behavior between the conventional surfactants and the extended surfactants is quite different [9].

4.7. Penetration Coefficient and Marangoni Spreading Speed

The penetration coefficient PC is a measure of the ability of a liquid to penetrate into a capillary space, such as interproximal regions, gingival pockets, and pores. PC can be evaluated from the surface tension γLV, contact angle θ, and viscosity μ of the mouthrinse-PMMA surface system as follows [2]:
P C = γ L V 2 μ c o s θ
A liquid with a low viscosity, high surface tension, and low contact angle (i.e., good wetting) could penetrate rapidly into the capillary-structured space. As reported from the in vivo CA studies of the mouthrinses on tooth surfaces (ranging from 37.0 to 54.0°), PC values could be extremely high for water (=0.241 m s−1) [1]. PC values determined in this research for the model mouthrinses are collected in Table 7. They range widely from 9.8 (Xerostom) to 6.5 (Listerine) 10−2 m s−1. It can be noted that the surface tensions of the rinses lie in the range between 39.9–29.7 mN m−1, θ vary from 21.9 (Dentalux-alcohol-free) to 46.9° (Listerine), and their viscosities are all higher than water. It was confirmed that the PC value for pure water is very high, much higher than demonstrated by water solutions (Coca-Cola, juices) and natural saliva (of higher γLV) found in an oral cavity. Xerostom and Ortho Salvia Dental exhibited the highest PCs, whereas Listerine revealed the lowest PC value. This result shows that it would be worthwhile to modify mouthrinse formulations to increase their penetration efficiency. It should be noted that the dynamic contact angle θA measured at the forward face of the moving liquid front can differ from the equilibrium CA, θ, depending on the capillary number ( C a = u μ / γ S L , where u is the specific rate of movement of the liquid-solid contact line front [42]), and expressed by the following empirical relation [43]:
c o s θ A = c o s θ 2 1 + c o s θ C a 0.5  
A spontaneous flow toward regions of high surface tension, so-called Marangoni flow, is another transport process taking place in a liquid layer placed at the solid surface, whose speed US is attributed to the surface tension gradients [44]. The shear stresses appearing at the interface resulting from horizontal surface tension gradients are assumed to be equalized by viscous stresses under steady-state hydrodynamic conditions [45]. For the two-dimensional coordinate model, where x and z are horizontal (along the flat solid surface) and vertical coordinates, respectively, one obtains [46]:
μ U S z = γ T T x γ c c x = S S T x + σ c x .
The outermost surface linear velocity resulting only from the temperature gradient parallel to the spreading flow direction for the liquid layer of thickness d can be expressed by the simplified theoretical relation [47]:
U S = d 4 μ S S T x .
In order to evaluate the thermocapillary flow velocity, the following assumptions were made: d—the sessile drop height was taken from the drop images (with the arbitrary fixed drop footprint radius r = 3.5 mm, directly related to θ). Values of d ranged from 1.87 (Dentalux + alcohol) to 2.67 mm (Listerine), being higher for saliva, water, and the remaining water solutions. The temperature difference between the rinse (T = 20 °C) and the oral cavity (=37 °C) likely to be present along the solid material at a distance Δx = 10 mm leads to the temperature gradient ∂T/∂x~1.7 K mm−1. The supplementary physical and thermal surface parameters, i.e., μ and SS, originate from Table 1 and Table 3, respectively. US values are collected in Table 7 for the model liquids. Generally, Marangoni’s spreading mechanism is slower than the penetration one, with US varying from 0.46 (Dentalux-alcohol-free) down to 0.20 cm s−1 (Listerine), i.e., being 16–47 times lower than PC values. Systematically higher US were found for pure water, juices, Coca-Cola, and saliva (in the range from 0.39 to 0.80 cm s−1). It should be noted that apart from the thermal Marangoni effect, there is also the classic Marangoni one, driven by the surfactant concentration gradients over the solid substrata in the oral cavity (the second term of the right-hand side of Equation (16)). However, the surface activity σ (see Equation (2)) of a surfactant solution was determined in the framework of this study, and the surfactant concentration gradient ( = c / x ) is an undetermined quantity hardly to be estimated. In addition, it was demonstrated in thermo-elastic studies of natural surfactant films in Baltic Sea coastal waters that the principal role is played by the temperature-over-surfactant-mediated gradient effect [47].

5. Conclusions

Adsorptive and thermodynamic surface characteristics of multicomponent mouthrinse surfactant solutions at the liquid/vapor interface allowed for the relative cmc, surface effectiveness (γcmc), area per molecule (Amolec), and surface activity (σ) to be determined. The formed adsorption layers turned out to be of the liquid-expanded type. In particular, σ is proportional to the partitioning coefficient (KP) of surfactant molecules between the bulk and surface phases. Lower KP values correspond to better-soluble compounds in the aqueous phase, thus making them more available for contact with microorganisms in an antibacterial treatment. Surface thermodynamic potentials HS and SS revealed a particular mechanism of interfacial film formation and their molecular organization complexity, respectively. Surface wettability energetics parameters, derived from CA studies, for PMMA/mouthrinse systems revealed the following trend in reference to the PMMA/pure water case: θ, θA and θR all ↓, CAH↑, Π↓, WA↓, γSV↓, γ S V p ↓ and γ L V c o s θ A ↑. The substratum material studied here, characterized by a surface energy of 22.37–30.53 mJ m−2, is assumed to induce lower bacterial adhesion as compared to materials with higher surface energies. The ratio: (γLV cos θA/WA) ranging from 0.29 (Listerine) to 0.45 (Dentalux + alcohol) is a surface-energetics derived parameter that seems to be a signature of the adhesive strength removal ability of the mouthrinse liquids. The surfactant excesses ratio: Γ S L / Γ L V was negative and ranged from −1.42 to −0.20, i.e., the range that is characteristic for hydrophobic surface interactions at the S/L interface. Furthermore, high absolute values of the excess ratio pointed to the formation of multilayered, vertically segregated structures of surfactants composing the mouthrinse mixtures of differentiated surface activity. The pure water mouthrinse dissolution leads to the following wettability parameter variability: θA and θR ↑, CAH↓, Π↑, WA↑, γSV~const,   γ S V p ↑, and γ L V c o s θ A ↓. Finally, the physical properties, CA data, and thermodynamic parameter (SS) allowed the penetration coefficient (PC = (6.5–9.8)·10−2 m s−1), and the Marangoni temperature gradient-driven liquid flow speed (US = (0.20–0.32)·10−2 m s−1) speed to be estimated; these factors appear to be important in oral cavity dental plague elimination strategies. This work demonstrates a promising path to control wetting and de-wetting in a polymer-mouth rinse system by properly engineering the liquid–solid interaction at the contact line during advancing and receding movements rather than the entire surface modification.

Author Contributions

Conceptualization, S.P.; methodology, S.P.; software, K.D.; validation, S.P. and P.R.; formal analysis, S.P.; investigation, S.P. and P.J.; resources, S.P. and K.B.-S.; data curation, K.B.-S. and S.P.; writing—original draft preparation, S.P.; writing—review and editing, P.R.; visualization, S.P. and P.R.; supervision, S.P. All authors have read and agreed to the published version of the manuscript.

Funding

This research received no external funding.

Institutional Review Board Statement

Not applicable.

Informed Consent Statement

Not applicable.

Data Availability Statement

Data could be shared on demand.

Conflicts of Interest

The authors declare no conflict of interest.

References

  1. Perdok, J.F.; van der Mei, H.C.; Busscher, H.J. Physicochemical Properties of Commercially Available Mouthrinses. J. Dent. 1990, 18, 147–150. [Google Scholar] [CrossRef]
  2. O’Brien, W.J. Dental Materials and Their Selection, 3rd ed.; Quintessence Publishing Co.: Batavia, IL, USA, 2002; ISBN 0-86715-406-3. [Google Scholar]
  3. Dai, Q.; Huang, W.; Wang, X.; Khonsari, M.M. Directional Interfacial Motion of Liquids: Fundamentals, Evaluations, and Manipulation Strategies. Tribol. Int. 2021, 154, 106749. [Google Scholar] [CrossRef]
  4. Radzki, D.; Wilhelm-Węglarz, M.; Pruska, K.; Kusiak, A.; Ordyniec-Kwaśnica, I. A Fresh Look at Mouthwashes—What Is Inside and What Is It For? Int. J. Environ. Res. Public Health 2022, 19, 3926. [Google Scholar] [CrossRef] [PubMed]
  5. Adamson, A.W.; Gast, A.P. Physical Chemistry of Surfaces, 6th ed.; Wiley and Sons: New York, NY, USA, 1997; ISBN 0471148733. [Google Scholar]
  6. Chibowski, E. Surface Free Energy of a Solid from Contact Angle Hysteresis. Adv. Colloid Interface Sci. 2003, 103, 149–172. [Google Scholar] [CrossRef] [PubMed]
  7. Jiang, Q.; Du, Y.; Zhang, L.; Ma, W.; Yan, F.; Zhang, L.; Zhao, S. Wettability of a Polymethylmethacrylate Surface by Extended Anionic Surfactants: Effect of Branched Chains. Molecules 2021, 26, 863. [Google Scholar] [CrossRef]
  8. Liber-Kneć, A.; Łagan, S. Surface Testing of Dental Biomaterials—Determination of Contact Angle and Surface Free Energy. Materials 2021, 14, 2716. [Google Scholar] [CrossRef] [PubMed]
  9. Cavalcanti, Y.W.; Wilson, M.; Lewis, M.; Williams, D.; Senna, P.M.; Del-Bel-Cury, A.A.; Silva, W.J. da Salivary Pellicles Equalise Surfaces’ Charges and Modulate the Virulence of Candida Albicans Biofilm. Arch. Oral Biol. 2016, 66, 129–140. [Google Scholar] [CrossRef]
  10. Rüttermann, S.; Trellenkamp, T.; Bergmann, N.; Raab, W.H.-M.; Ritter, H.; Janda, R. A New Approach to Influence Contact Angle and Surface Free Energy of Resin-Based Dental Restorative Materials. Acta Biomater. 2011, 7, 1160–1165. [Google Scholar] [CrossRef]
  11. Qureshi, S.; Milić, L.; Petrović, B.; Vejin, M.; Kojić, S.; Jarić, S.; Stojanović, G. The Measurement of Contact Angle, PH, and Conductivity of Artificial Saliva and Mouthwashes on Enamel, Glass-Ionomer, and Composite Dental Materials. Materials 2022, 15, 4533. [Google Scholar] [CrossRef]
  12. Pogorzelski, S.; Watrobska-Swietlikowska, D.; Sznitowska, M. Surface Tensometry Studies on Formulations of Surfactants with Preservatives as a Tool for Antimicrobial Drug Protection Characterization. J. Biophys. Chem. 2012, 03, 324–333. [Google Scholar] [CrossRef]
  13. Schwarz, G.; Wackerbauer, G.; Taylor, S.E. Partitioning of a Nearly Insoluble Lipid Monolayer into Its Aqueous Subphase. Colloids Surf. A Physicochem. Eng. Asp. 1996, 111, 39–47. [Google Scholar] [CrossRef]
  14. Mazurek, A.Z.; Pogorzelski, S.J.; Kogut, A.D. A Novel Approach for Structure Quantification of Fatty Acids Films on Rain Water. Atmos. Environ. 2006, 40, 4076–4087. [Google Scholar] [CrossRef]
  15. Cini, R.; Loglio, G.; Ficalbi, A. Temperature Dependence of the Surface Tension of Water by the Equilibrium Ring Method. J. Colloid Interface Sci. 1972, 41, 287–297. [Google Scholar] [CrossRef]
  16. Boniewicz-Szmyt, K.; Pogorzelski, S.J. Thermoelastic Surface Properties of Seawater in Coastal Areas of the Baltic Sea. Oceanologia 2016, 58, 25–38. [Google Scholar] [CrossRef]
  17. Gindl, M.; Sinn, G.; Gindl, W.; Reiterer, A.; Tschegg, S. A Comparison of Different Methods to Calculate the Surface Free Energy of Wood Using Contact Angle Measurements. Colloids Surf. A Physicochem. Eng. Asp. 2001, 181, 279–287. [Google Scholar] [CrossRef]
  18. Pogorzelski, S.J.; Berezowski, Z.; Rochowski, P.; Szurkowski, J. A Novel Methodology Based on Contact Angle Hysteresis Approach for Surface Changes Monitoring in Model PMMA-Corega Tabs System. Appl. Surf. Sci. 2012, 258, 3652–3658. [Google Scholar] [CrossRef]
  19. Rodríguez-Valverde, M.; Cabrerizo-Vílchez, M.; Rosales-López, P.; Páez-Dueñas, A.; Hidalgo-Álvarez, R. Contact Angle Measurements on Two (Wood and Stone) Non-Ideal Surfaces. Colloids Surf. A Physicochem. Eng. Asp. 2002, 206, 485–495. [Google Scholar] [CrossRef]
  20. Zhang, Q.; Zhou, Z.-H.; Hu, S.-S.; Li, S.-M.; Ma, D.-S.; Zhou, X.-Y.; Han, L.; Zhang, L.; Zhang, L. Wettability of a Polymethylmethacrylate Surface in the Presence of Benzyl-Substituted Alkyl Betaines. J. Mol. Liq. 2019, 277, 571–576. [Google Scholar] [CrossRef]
  21. Lucassen-Reynders, E.H. Contact Angles and Adsorption on Solids. J. Phys. Chem. 1963, 67, 969–972. [Google Scholar] [CrossRef]
  22. Jańczuk, B.; Białlopiotrowicz, T. Surface Free-Energy Components of Liquids and Low Energy Solids and Contact Angles. J. Colloid Interface Sci. 1989, 127, 189–204. [Google Scholar] [CrossRef]
  23. Pogorzelski, S.J.; Rochowski, P.; Szurkowski, J. Pinus Sylvestris L. Needle Surface Wettability Parameters as Indicators of Atmospheric Environment Pollution Impacts: Novel Contact Angle Hysteresis Methodology. Appl. Surf. Sci. 2014, 292, 857–866. [Google Scholar] [CrossRef]
  24. Li, D.; Xie, M.; Neumann, A.W. Vapour Adsorption and Contact Angles on Hydrophobic Solid Surfaces. Colloid Polym. Sci. 1993, 271, 573–580. [Google Scholar] [CrossRef]
  25. Pogorzelski, S.; Boniewicz-Szmyt, K.; Grzegorczyk, M.; Rochowski, P. Wettability of Metal Surfaces Affected by Paint Layer Covering. Materials 2022, 15, 1830. [Google Scholar] [CrossRef]
  26. Makkonen, L. A Thermodynamic Model of Contact Angle Hysteresis. J. Chem. Phys. 2017, 147, 064703. [Google Scholar] [CrossRef] [PubMed]
  27. Lemanska, J. Adsorptive and Thermoelastic Surface Properties of Denture Cleansers and Mouthrinses for Oral Cavity Hygiene. Master’s Thesis, University of Gdansk, Gdańsk, Poland, 2020. [Google Scholar]
  28. Butt, H.; Graf, K.; Kappl, M. Physics and Chemistry of Interfaces, 1st ed.; Wiley: Hoboken, NJ, USA, 2003. [Google Scholar]
  29. Yamabe, T.; Moroi, Y.; Abe, Y.; Takahasi, T. Micelle Formation and Surface Adsorption of N-(1,1-Dihydroperfluoroalkyl)-N,N,N-Trimethylammonium Chloride. Langmuir 2000, 16, 9754–9758. [Google Scholar] [CrossRef]
  30. Gelbart, W.M.; Ben-Shaul, A.; Roux, D. Micelles, Membranes, Microemulsions, and Monolayers; Gelbart, W.M., Ben-Shaul, A., Roux, D., Eds.; Partially Ordered Systems; Springer: New York, NY, USA, 1994; ISBN 978-1-4613-8391-8. [Google Scholar]
  31. Chibowski, E.J. Surface Free Energy and Wettability of Silyl Layers on Silicon Determined from Contact Angle Hysteresis. Adv. Colloid Interface Sci. 2005, 113, 121–131. [Google Scholar] [CrossRef]
  32. Johnson, B.A.; Kreuter, J.; Zografi, G. Effects of Surfactants and Polymers on Advancing and Receding Contact Angles. Colloids Surf. 1986, 17, 325–342. [Google Scholar] [CrossRef]
  33. Law, K.-Y. Contact Angle Hysteresis on Smooth/Flat and Rough Surfaces. Interpretation, Mechanism, and Origin. Acc. Mater. Res. 2022, 3, 1–7. [Google Scholar] [CrossRef]
  34. Samuel, B.; Zhao, H.; Law, K.-Y. Study of Wetting and Adhesion Interactions between Water and Various Polymer and Superhydrophobic Surfaces. J. Phys. Chem. C 2011, 115, 14852–14861. [Google Scholar] [CrossRef]
  35. Svitova, T.; Hill, R.; Radke, C. Adsorption Layer Structures and Spreading Behavior of Aqueous Non-Ionic Surfactants on Graphite. Colloids Surfaces A Physicochem. Eng. Asp. 2001, 183–185, 607–620. [Google Scholar] [CrossRef]
  36. Szymczyk, K.; Zdziennicka, A.; Krawczyk, J.; Jańczuk, B. Wettability, Adhesion, Adsorption and Interface Tension in the Polymer/Surfactant Aqueous Solution System. I. Critical Surface Tension of Polymer Wetting and Its Surface Tension. Colloids Surf. A Physicochem. Eng. Asp. 2012, 402, 132–138. [Google Scholar] [CrossRef]
  37. Yuan, Y.; Hays, M.P.; Hardwidge, P.R.; Kim, J. Surface Characteristics Influencing Bacterial Adhesion to Polymeric Substrates. RSC Adv. 2017, 7, 14254–14261. [Google Scholar] [CrossRef]
  38. Krawczyk, J.; Szymczyk, K.; Zdziennicka, A.; Jańczuk, B. Wettability of Polymers by Aqueous Solution of Binary Surfactants Mixture with Regard to Adhesion in Polymer–Solution System II. Critical Surface Tension of Polymers Wetting and Work of Adhesion. Int. J. Adhes. Adhes. 2013, 45, 106–111. [Google Scholar] [CrossRef]
  39. Szymczyk, K.; Zdziennicka, A.; Jańczuk, B. Effect of Polysorbates on Solids Wettability and Their Adsorption Properties. Colloids Interfaces 2018, 2, 26. [Google Scholar] [CrossRef]
  40. Zdziennicka, A. The Wettability of Polytetrafluoroethylene and Polymethylmethacrylate by Aqueous Solutions of Triton X-100 and Propanol Mixtures. Appl. Surf. Sci. 2009, 255, 3801–3810. [Google Scholar] [CrossRef]
  41. Zdziennicka, A.; Jańczuk, B. Behavior of Cationic Surfactants and Short-Chain Alcohols in Mixed Surface Layers at Water–Air and Polymer–Water Interfaces with Regard to Polymer Wettability. J. Colloid Interface Sci. 2010, 350, 568–576. [Google Scholar] [CrossRef]
  42. Schäffer, E.; Wong, P. Contact Line Dynamics near the Pinning Threshold: A Capillary Rise and Fall Experiment. Phys. Rev. E 2000, 61, 5257–5277. [Google Scholar] [CrossRef]
  43. Bracke, M.; Voeght, F.; Joos, P. The Kinetics of Wetting: The Dynamic Contact Angle. In Trends in Colloid and Interface Science III; Steinkopff: Darmstadt, Germany, 2000; Volume 61, pp. 142–149. [Google Scholar]
  44. Berg, S. Marangoni-Driven Spreading along Liquid-Liquid Interfaces. Phys. Fluids 2009, 21, 032105. [Google Scholar] [CrossRef]
  45. Pratap, V.; Moumen, N.; Subramanian, R.S. Thermocapillary Motion of a Liquid Drop on a Horizontal Solid Surface. Langmuir 2008, 24, 5185–5193. [Google Scholar] [CrossRef]
  46. Mao, Z.; Lu, P.; Zhang, G.; Yang, C. Numerical Simulation of the Marangoni Effect with Interphase Mass Transfer Between Two Planar Liquid Layers. Chin. J. Chem. Eng. 2008, 16, 161–170. [Google Scholar] [CrossRef]
  47. Boniewicz-Szmyt, K.; Pogorzelski, S.J. Influence of Surfactant Concentration and Temperature Gradients on Spreading of Crude-Oil at Sea*. Front. Mar. Sci. 2018, 5, 388. [Google Scholar] [CrossRef]
Figure 1. Exemplary images of a sessile drop shape as a basis for (a) dynamic and (b) Young equilibrium CA determination with the inclined plate method, for Listerine Cool Mint-PMMA system at 25 °C; γLV = 37.6 mN m−1; bar = 2 mm. Images (c,d) are derived from (a,b), respectively, with FIND EDGES routine of ImageJ program, useful to sharpen the interfacial border line.
Materials 16 05753 g001
Figure 2. Surface tension of Xerostom solution vs. relative concentration c/c0 plot at T = 22 °C. The straight-line best-fit approximations to the data were used to determine the inflection point (c/c0 = 0.063, corresponding to cmc).
Materials 16 05753 g002
Figure 3. Surface free energy γLV and enthalpy HS, for Xerostom solution (at c = c0). SS (= 0.09 ± 0.02 mN m−1 K−1) obtained from the slope of the γLV(T) relation linear fit.
Materials 16 05753 g003
Figure 4. (a) Contact angle hysteresis (CAH) as a function of work of adhesion (WA); (b) WA plotted versus probe liquid surface tension (γLV), for PMMA-probe liquid systems at 22 °C (295 K). Additional points (data from [32]): pure surfactant water solutions of nonionic Polyoxylene Lauryl Ether (blue) of a variable concentration increasing from 3.9 × 10⁻⁴ → 2.0 × 10⁻³ → 2.0 × 10⁻² mol., and anionic Aerosol OT (green) with the concentration varying from 1 × 10⁻² → 6 × 10⁻² → 2 × 10⁻¹ mol.
Materials 16 05753 g004
Figure 5. Polar γ s v p versus dispersive γ s v d terms of the total surface free energy γ s v , for the studied water solutions in contact with PMMA substratum at T = 22 °C. Concentration evolutions for ether (green) and aerosol (blue) as in Figure 4.
Materials 16 05753 g005
Figure 6. Wettability studies of PMMA-Eurodont system at T = 22 °C. (a) Static, dynamic CA and CAH versus relative concentration c / c 0 ; (b) CAH as a function of WA for serial Eurodont dilutions; (c) γLV and WA plotted versus relative concentration c / c 0 ; (d) adhesional tension vs. surface tension (the γ L V c o s θ A γ L V dependence), leading to the surfactant excesses ratio: Γ S L / Γ L V = a (slope) determination.
Materials 16 05753 g006
Table 1. Physical, surface, and penetration-spreading characteristics of probe liquids at 22 °C. Experimental uncertainties and standard deviations are given in round brackets (first row).
LiquidΓLV
[mN m−1]
(0.2)
ρ
[103 kg m−3]
(0.03)
μ
[mPa s]
(0.05)
pH
[-]
(0.1)
Product Source
Xerostom38.70.921.037.2Bio Cosmetics, Madrid, Spain
Ortho Salvia Dental39.90.971.127.3Atos, Warsaw, Poland
Listerine Cool Mint37.60.981.324.3Johnson & Johnson Consumer Health, France
Dentalux (alcohol free)29.70.961.276.0Cosmolux, Pulheim, Germany
Dentalux (+alcohol)31.70.931.104.9Cosmolux, Pulheim, Germany
Eurodont33.70.921.055.6Maxim Markenprodukte, Pulheim, Germany
Coca Cola64.10.911.013.8Lidl Market
Apple Juice54.11.041.123.6Lidl Market
Orange Juice61.11.191.214.5Lidl Market
Pure water72.50.890.866.8
Saliva53.61.121.026.820-year old healthy volunteer
Table 2. Surface adsorptive parameters of mouthrinses at air/liquid interface (T = 22 °C). Mean values and standard deviations (given in brackets).
Liquidcmc
[c/c0]
γcmc
[mN m−1]
Γmax
[×106 mol cm−2]
Amolec
nm2 molec.−1
|σ|
[mN m−1]
Xerostom0.06 (0.01)40.9 (0.1)0.42 (0.09)392.21 (10.15)210 (16)
Ortho Salvia Dental0.03 (0.01)42.7 (0.2)0.24 (0.08)839.53 (15.23)380 (18)
Listerine Cool Mint0.12 (0.02)40.0 (0.2)0.94 (0.09)170.24 (4.45)230 (19)
Dentalux (alcohol free)0.03 (0.01)31.2 (0.2)0.50 (0.08)331.87 (6.23)810 (32)
Dentalux (+alcohol)0.03 (0.01)30.9 (0.2)0.61 (0.07)310.61 (6.10)850 (24)
Eurodont0.03 (0.01)32.4 (0.2)0.91 (0.06)178.46 (3.78)1120 (67)
Saliva0.31 (0.08)53.7 (0.2)1.35 (0.08)12.634 (1.87)40 (5)
Table 3. Surface tension and entropic contributions to the surface enthalpy (following Equations (5) and (6), for probe liquids at T = 22 °C (295 K). Experimental uncertainties and standard deviations are given in brackets.
LiquidΓLV
[mN m−1]
TSs
[mN m−1]
Hs
[mN m−1]
Xerostom38.7 (0.2)28.1 (0.2)66.8 (0.4)
Ortho Salvia Dental39.9 (0.2)38.4 (0.2)78.3 (0.4)
Listerine Cool Mint37.6 (0.2)41.3 (0.2)78.9 (0.4)
Dentalux (alcohol free)29.7 (0.2)67.9 (0.2)97.6 (0.4)
Dentalux (+alcohol)31.7 (0.2)62.0 (0.2)93.7 (0.4)
Eurodont33.7 (0.2)37.4 (0.2)71.1 (0.4)
Saliva53.6 (0.2)31.9 (0.2)85.6 (0.4)
Pure Water72.5 (0.2)46.3 (0.2)118.8 (0.4)
Coca Cola64.1 (0.2)52.7 (0.2)116.8 (0.4)
Orange Juice61.1 (0.2)38.0 (0.2)99.1 (0.4)
Table 4. Wettability energetics parameters, for probe liquid–PMMA systems at T = 22 °C (295 K) derived from dynamic CA data. Experimental uncertainties and standard deviations are given in brackets.
LiquidΘ
[°]
ΘA
[°]
ΘR
[°]
CAH
[°]
Π
[mN m−1]
Xerostom41.7 (1)42.2 (1)12.1 (1)30.7 (2)9.2 (0.4)
Ortho Salvia Dental43.1 (1)55.6 (1)16.7 (1)38.9 (2)15.7 (0.6)
Listerine Cool Mint46.1 (1)65.2 (1)18.7 (1)46.5 (2)19.8 (0.7)
Dentalux (alcohol free)39.2 (1)54.9 (1)13.1 (1)41.8 (2)12.7 (0.5)
Dentalux (+alcohol)31.9 (1)43.9 (1)10.0 (1)23.9 (2)4.9 (0.3)
Eurodont30.2 (1)55.7 (1)22.3 (1)33.4 (2)12.3 (0.5)
Coca Cola36.5 (1)49.2 (1)13.9 (1)35.3 (2)20.3 (0.8)
Apple Juice54.2 (1)58.8 (1)16.9 (1)41.9 (2)23.3 (0.9)
Orange Juice68.8 (1)74.0 (1)25.0 (1)49.0 (2)27.4 (1.1)
Water64.7 (1)76.0 (1)52.0 (1)24.0 (2)26.9 (1.0)
Saliva72.7 (1)88.6 (1)55.3 (1)33.3 (2)29.2 (1.2)
LiquidWA
[mJ m−2]
ΓSV
[mJ m−2]
ΓSVd
[mJ m−2]
ΓSVp
[mJ m−2]
ΓLV cosΘA
[mN m−1]
Xerostom67.3 (1.2)31.5 (1.5)29.3 (1.3)2.2 (0.2)28.7 (0.2)
Ortho Salvia Dental62.5 (1.1)27.8 (1.5)24.5 (1.2)3.3 (0.3)22.6 (0.2)
Listerine Cool Mint53.3 (1.1)22.5 (1.4)18.9 (1.1)3.6 (0.3)15.6 (0.2)
Dentalux (alcohol free)50.4 (1.1)22.4 (1.3)19.9 (1.1)2.5 (0.2)18.4 (0.2)
Dentalux (+alcohol)58.0 (1.2)27.8 (1.5)26.5 (1.4)1.3 (0.1)26.3 (0.2)
Eurodont52.7 (1.1)23.6 (1.4)20.6 (1.1)3.0 (0.3)18.9 (0.2)
Coca Cola106.1 (1.6)48.4 (2.0)43.8 (1.5)4.5 (0.5)41.9 (0.2)
Apple Juice81.0 (1.4)35.4 (1.8)30.7 (1.3)4.6 (0.5)27.6 (0.2)
Orange Juice55.4 (1.1)22.2 (1.5)17.7 (1.0)4.5 (0.5)11.9 (0.2)
Water89.5 (1.4)38.9 (2.0)27.8 (1.3)11.1 (0.7)10.2 (0.2)
Saliva54.9 (1.1)21.7 (1.5)14.1 (1.0)7.6 (0.5)1.3 (0.2)
Table 5. Wettability parameters for Eurodont-PMMA system (T = 22 °C) versus mouthrinse relative concentration c / c 0 ; c 0 —initial product concentration, cmc = 0.032. Experimental uncertainties and standard deviations are given in brackets.
c/c0
(2%)
ΘA [°]
(1°)
ΘR [°]
(1°)
Π
[mN m−1]
WA
[mJ m−2]
ΓSV
[mJ m−2]
ΓSVd
[mJ m−2]
ΓSVp
[mJ m−2]
ΓLV cosΘA
[mN m−1]
155.822.212.3 (0.5)52.7 (1.1)23.6 (1.4)20.6 (1.1)3.0 (0.3)18.9 (0.2)
0.2547.919.38.5 (0.3)51.8 (1.1)23.8 (1.4)21.6 (1.1)2.3 (0.3)21.0 (0.2)
0.12555.924.411.1 (0.5)49.6 (1.0)22.3 (1.4)19.4 (1.0)2.9 (0.4)17.8 (0.2)
0.06362.930.413.1 (0.5)46.9 (1.0)20.6 (1.3)17.1 (0.8)3.5 (0.5)14.6 (0.2)
0.03264.832.313.6 (0.5)46.2 (0.9)20.1 (1.3)16.5 (0.8)3.7 (0.5)13.8 (0.2)
0.01670.234.016.2 (0.6)44.4 (0.8)18.8 (1.2)14.9 (0.6)3.9 (0.6)11.3 (0.1)
0.007873.050.912.0 (0.5)45.7 (0.9)20.2 (1.3)14.8 (0.6)5.4 (0.7)10.3 (0.1)
0.003982.437.327.7 (0.8)47.4 (0.9)18.3 (1.2)13.4 (0.5)4.9 (0.7)5.5 (0.1)
0.0019583.956.322.6 (0.7)55.8 (1.3)23.2 (1.4)15.4 (0.7)7.8 (0.7)5.4 (0.1)
0.0009884.063.519.8 (0.6)64.2 (1.5)27.8 (1.5)17.7 (0.8)10.1 (0.7)6.1 (0.1)
0.0004888.264.325.2 (0.8)64.7 (1.5)27.1 (1.5)16.7 (0.8)10.4 (0.7)2.0 (0.1)
0.0002496.569.032.0 (0.9)60.3 (1.4)23.8 (1.4)13.4 (0.5)10.5 (0.9)−7.7 (0.1)
Table 6. The Γ S L / Γ L V ratio (see Equation (13)) for the surfactant water solution/PMMA interfacial system. Experimental uncertainties and standard deviations are given in brackets.
LiquidΓSLLVRemarks, Data Source
Mouthrinses
Xerostom−1.23 (0.14)c < cmc
Ortho Salvia Dental−0.20 (0.08)c < cmc
Listerine Cool Mint−1.37 (0.19)c < cmc
Dentalux (alcohol free)−1.21 (0.17)c < cmc
Dentalux (+alcohol)−1.14 (0.24)c < cmc
Eurodont−1.49 (0.23) c < cmc−1.81 (0.31) c > cmc
Monocomponent model surfactant water solution
AOT (dioctyl sodium sulfosuccinate), anionic, double alkyl chains−0.85 (0.12)c < cmc [32]
Tween 20 (polyethylene glycol sorbitan monooleate)−0.76 (0.15)c < cmc [39]
SDS (sodium dodecyl sulphate), anionic−0.31 (0.09)c < cmc [39]
CTAB (cetyltrimethylammonium bromide), cationic−0. 34 (0.12)c < cmc [40,41]
Triton TX-100, nonionic−0.17 (0.06)c < cmc [36,41]
Zwitterionic and cationic gemini surfactants (extended surfactants)−0.31 (0.01)(0.34) (0.03)
c < cmcc > cmc
[20][7]
Table 7. Penetration coefficients and Marangoni spreading speeds for selected probe liquid-PMMA systems. Experimental uncertainties are given in brackets.
LiquidXerostomOrtho Salvia DentalListerine Cool MintDentalux (Alcohol Free)Dentalux (+Alcohol)Eurodont
PC
[10−2 m s−1]
9.8 (0.5)8.9 (0.5)6.5 (0.3)7.4 (0.4)7.8 (0.4)7.4 (0.4)
US
[10−2 m s−1]
0.21 (0.1)0.23 (0.1)0.20 (0.1)0.46 (0.2)0.32 (0.1)0.28 (0.1)
LiquidCoca ColaApple JuiceOrange JuicePure waterSaliva-
PC
[10−2 m s−1]
7.2 (0.4)5.8 (0.3)6.2 (0.3)9.8 (0.5)4.3 (0.2)-
US
[10−2 m s−1]
0.41 (0.2)0.64 (0.3)0.43 (0.2)0.80 (0.4)0.39 (0.2)-
Disclaimer/Publisher’s Note: The statements, opinions and data contained in all publications are solely those of the individual author(s) and contributor(s) and not of MDPI and/or the editor(s). MDPI and/or the editor(s) disclaim responsibility for any injury to people or property resulting from any ideas, methods, instructions or products referred to in the content.

