
Process Optimization, Microstructure and Mechanical Properties of Wire Arc Additive Manufacturing of Aluminum Alloy by Using DP-GMAW Based on Response Surface Method

Abstract
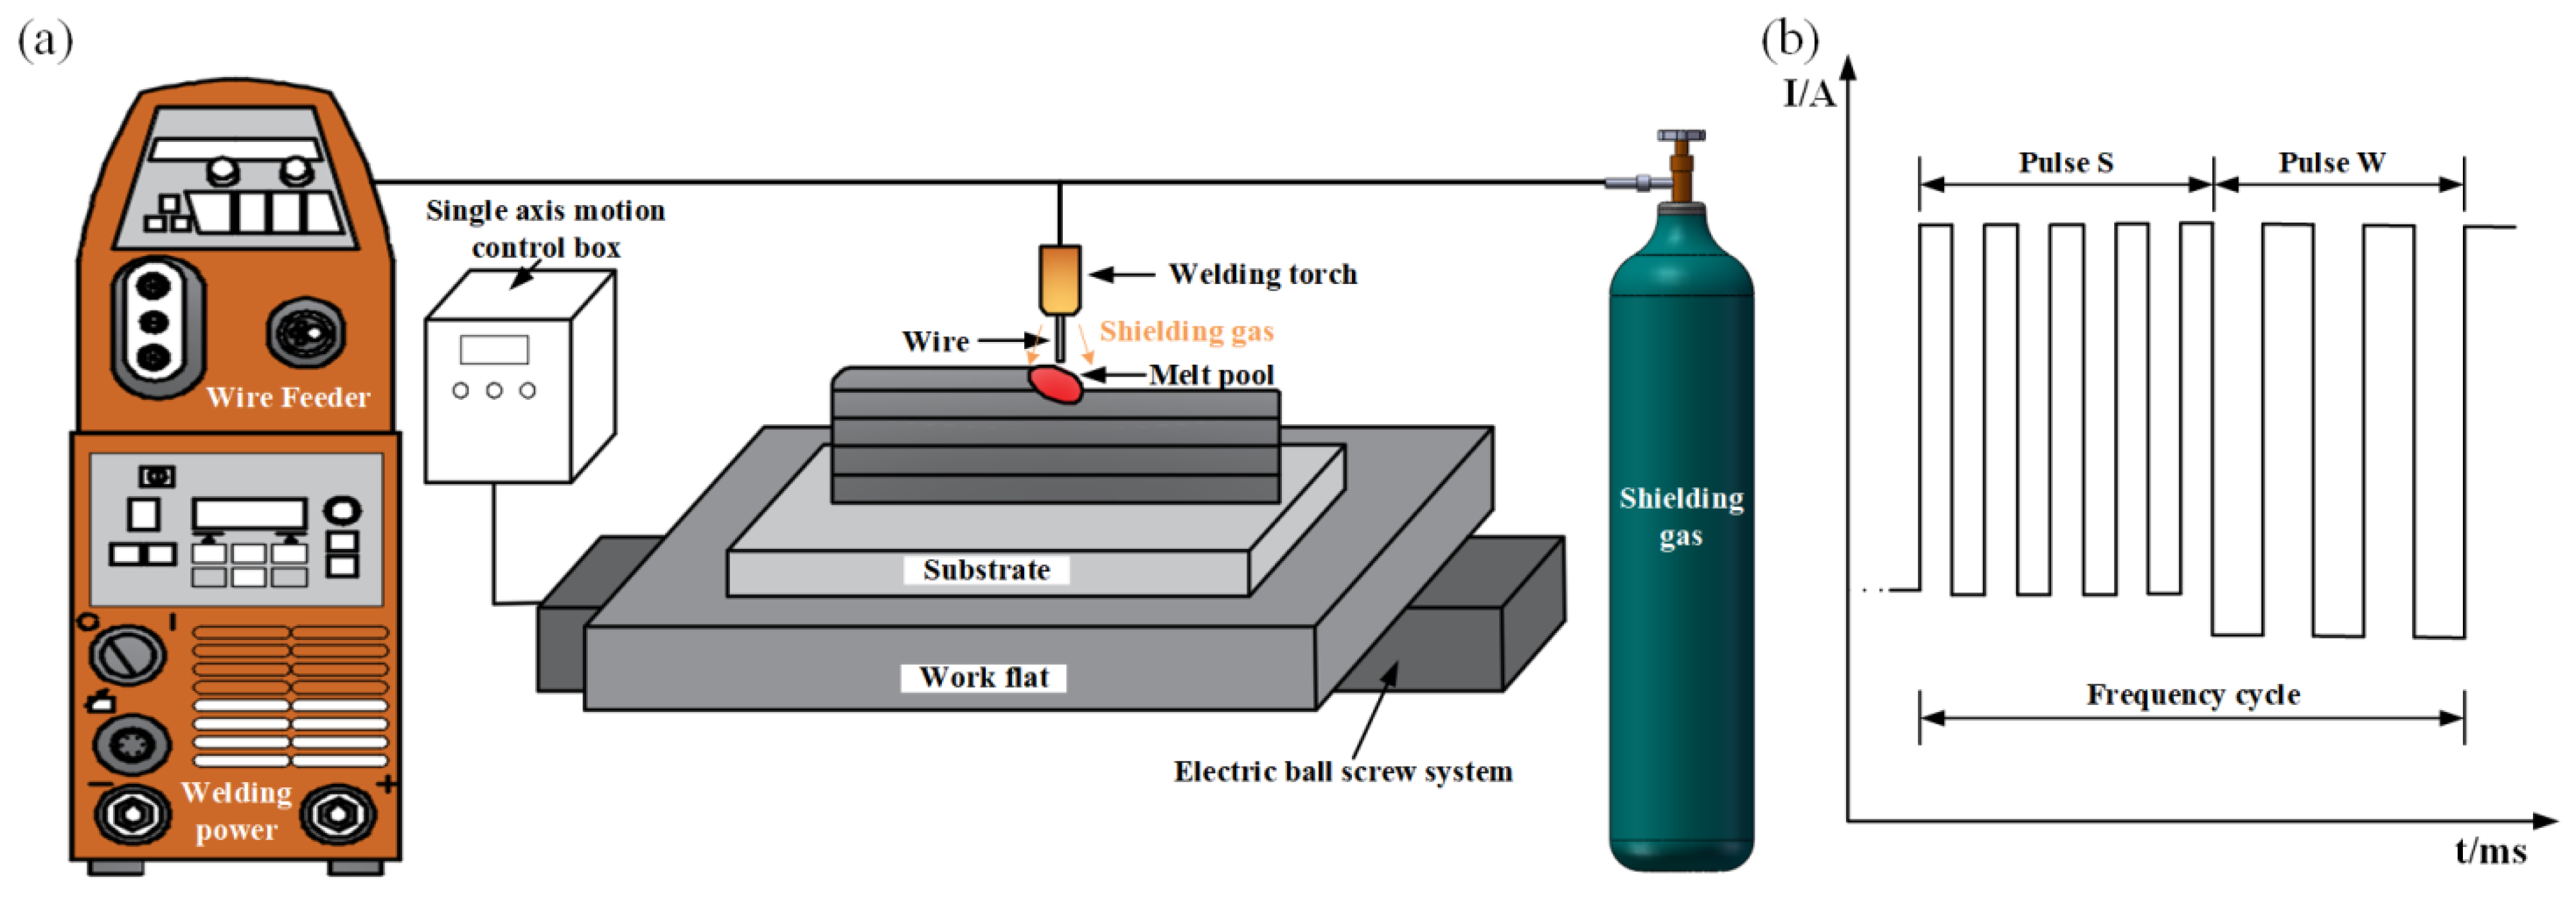
:1. Introduction
2. Materials and Methods
3. Results and Discussion
4. Conclusions
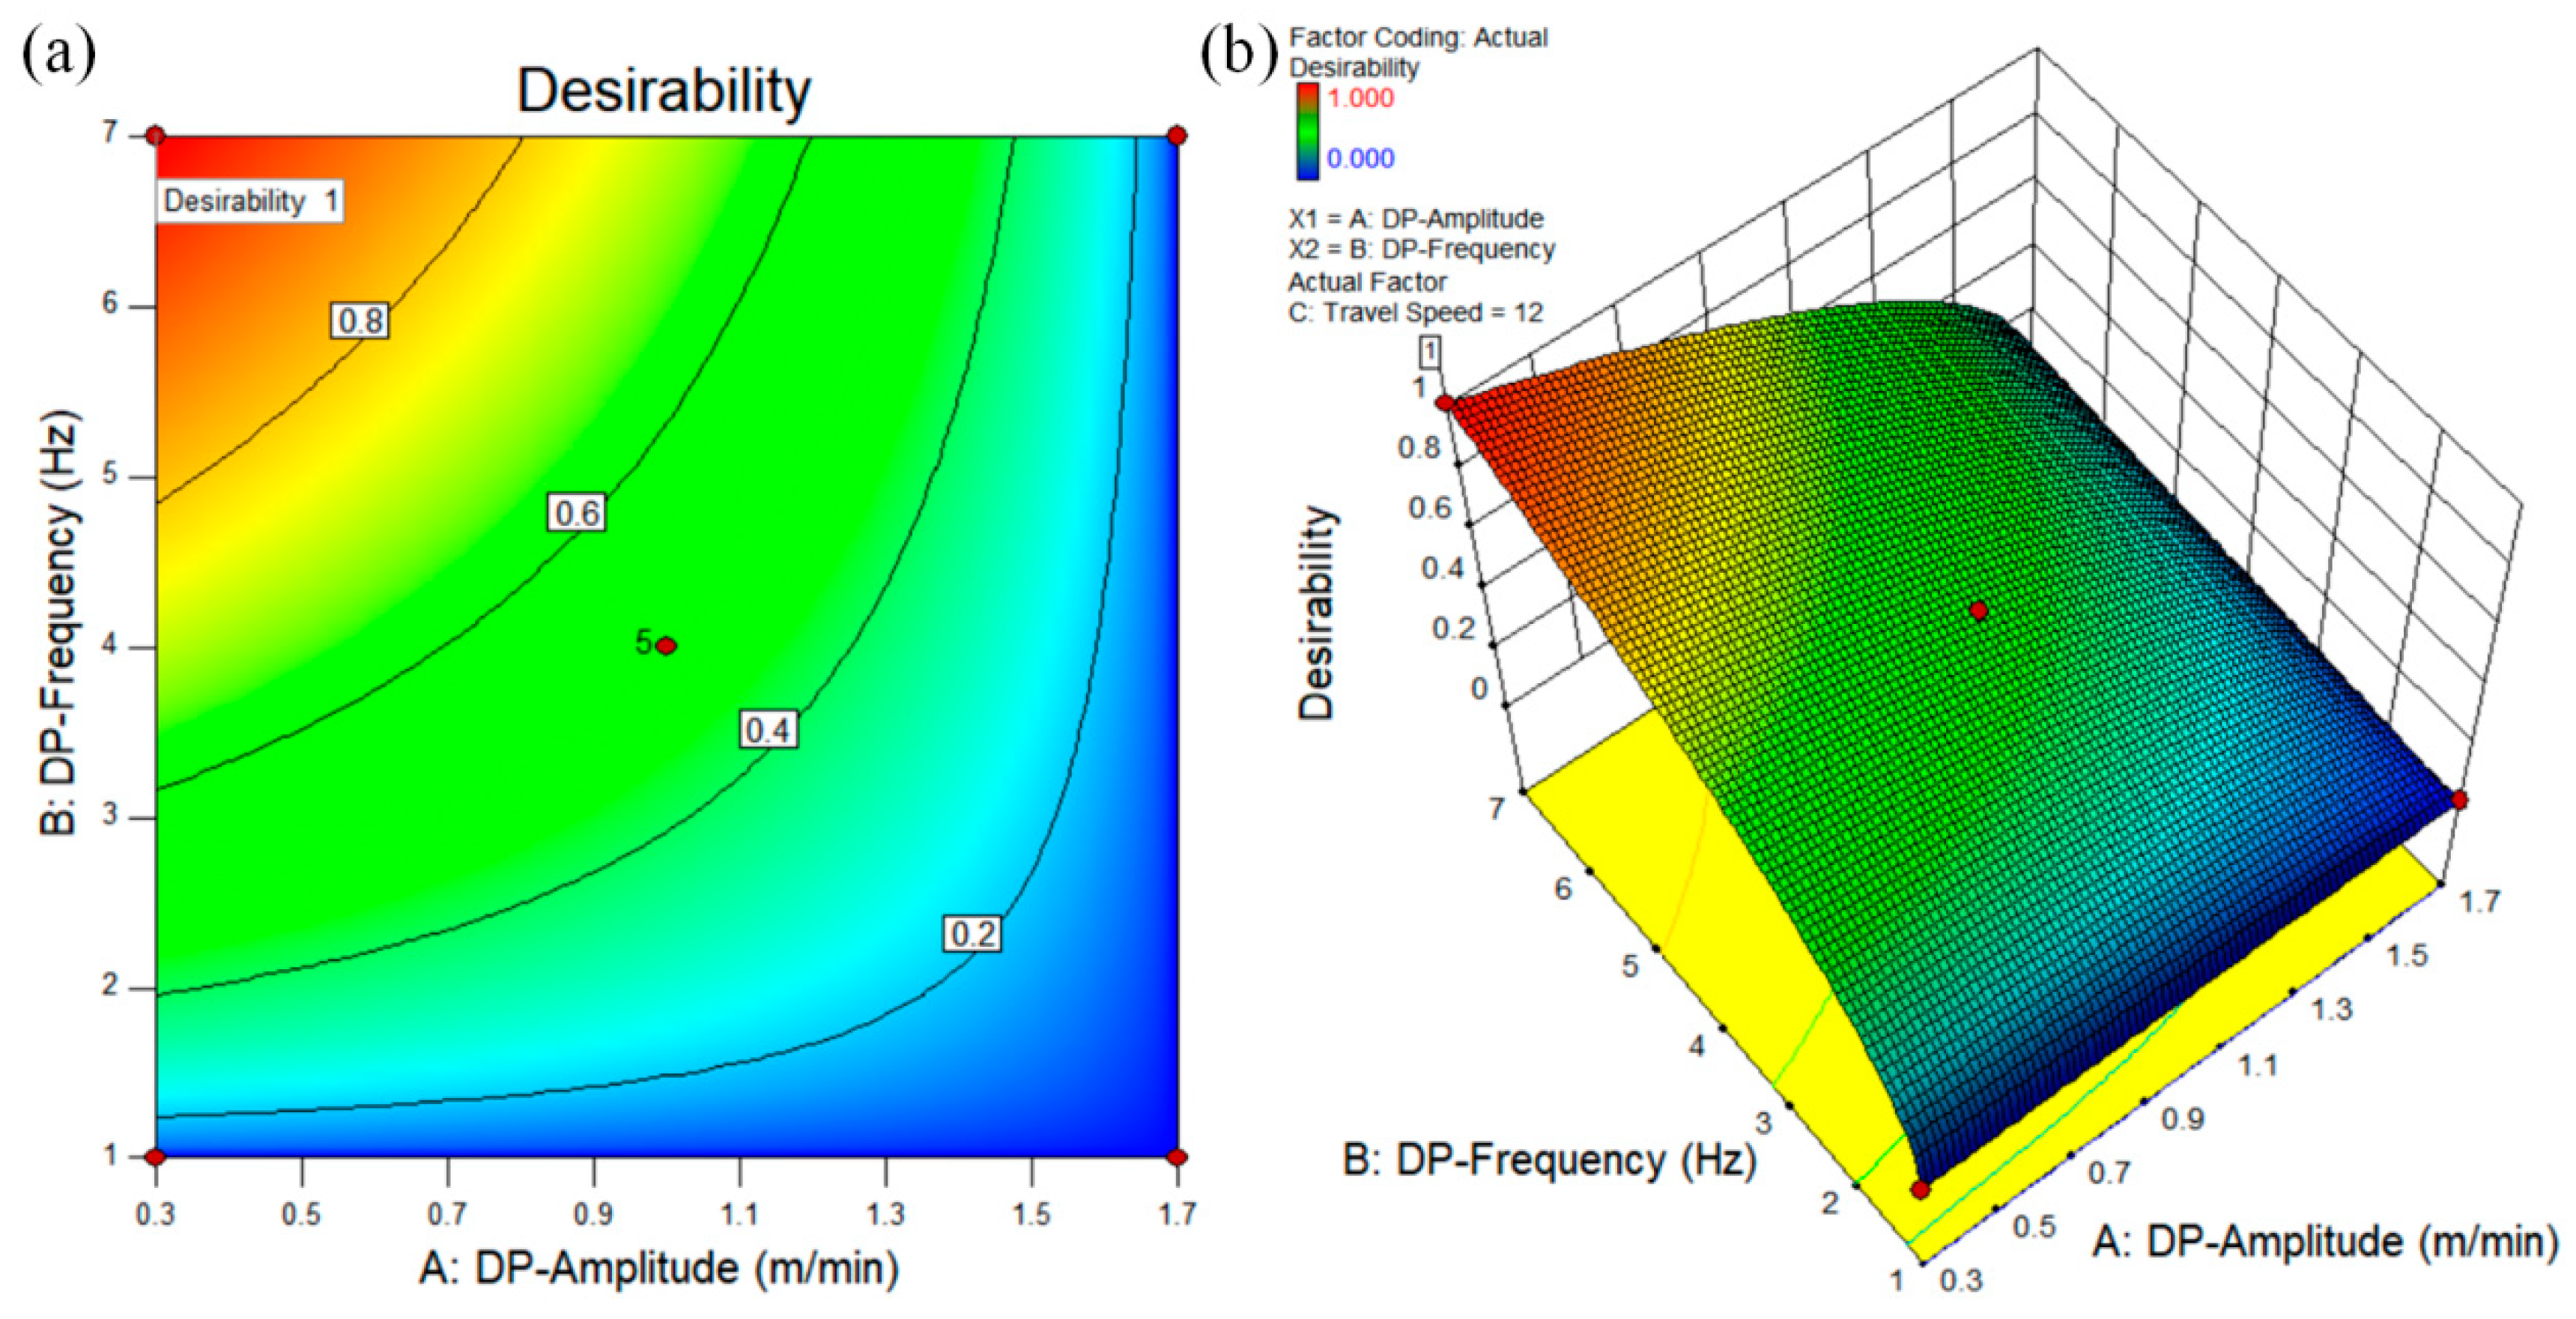
- The models between the variables (travel speed, double-pulse frequency, and amplitude) and the response values (width, height, and fusion depth of the deposition layer) were significant. The models all had signal-to-noise ratios greater than 4, with adequate signal.
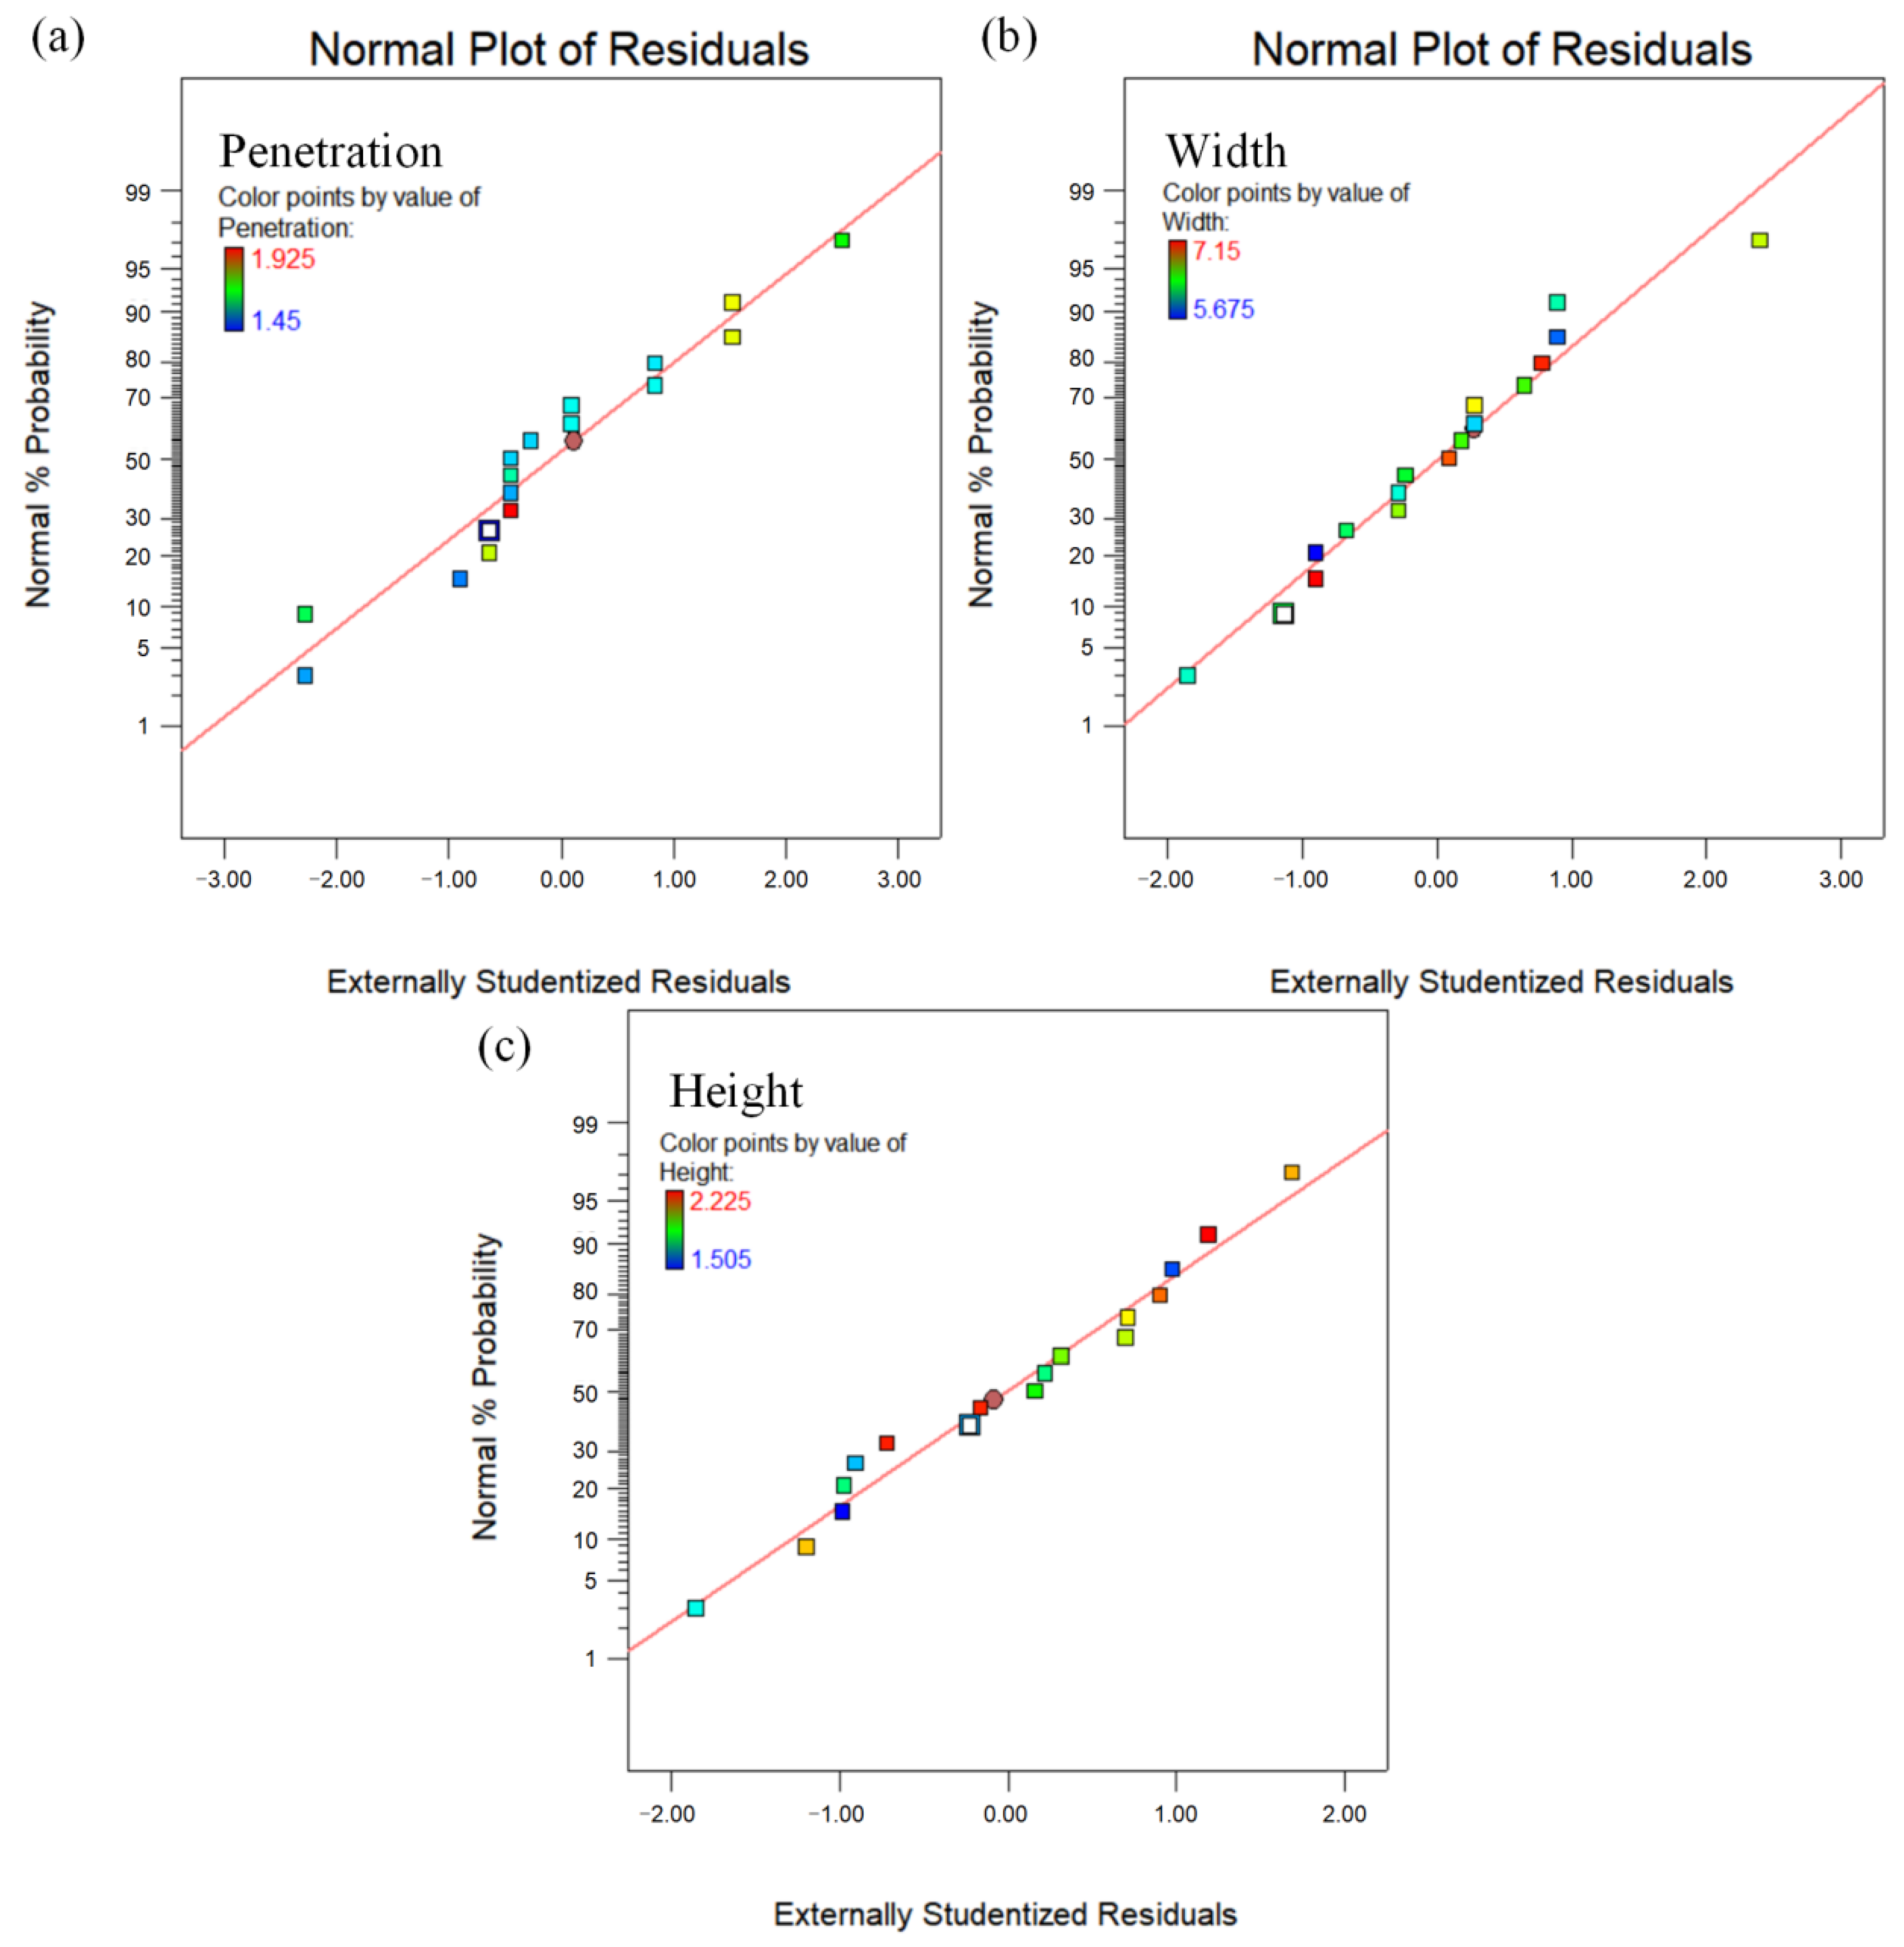
- The residual distributions of all three models were approximately along a straight line and the regression models fitted well. The perturbation diagram shows that the penetration is most strongly perturbed by the travel speed, with a gradual increase in penetration as the travel speed decreases. The width of the layer is most significantly influenced by the double-pulse amplitude, while the height of the layer is influenced by the interaction between the double-pulse amplitude and the travel speed.
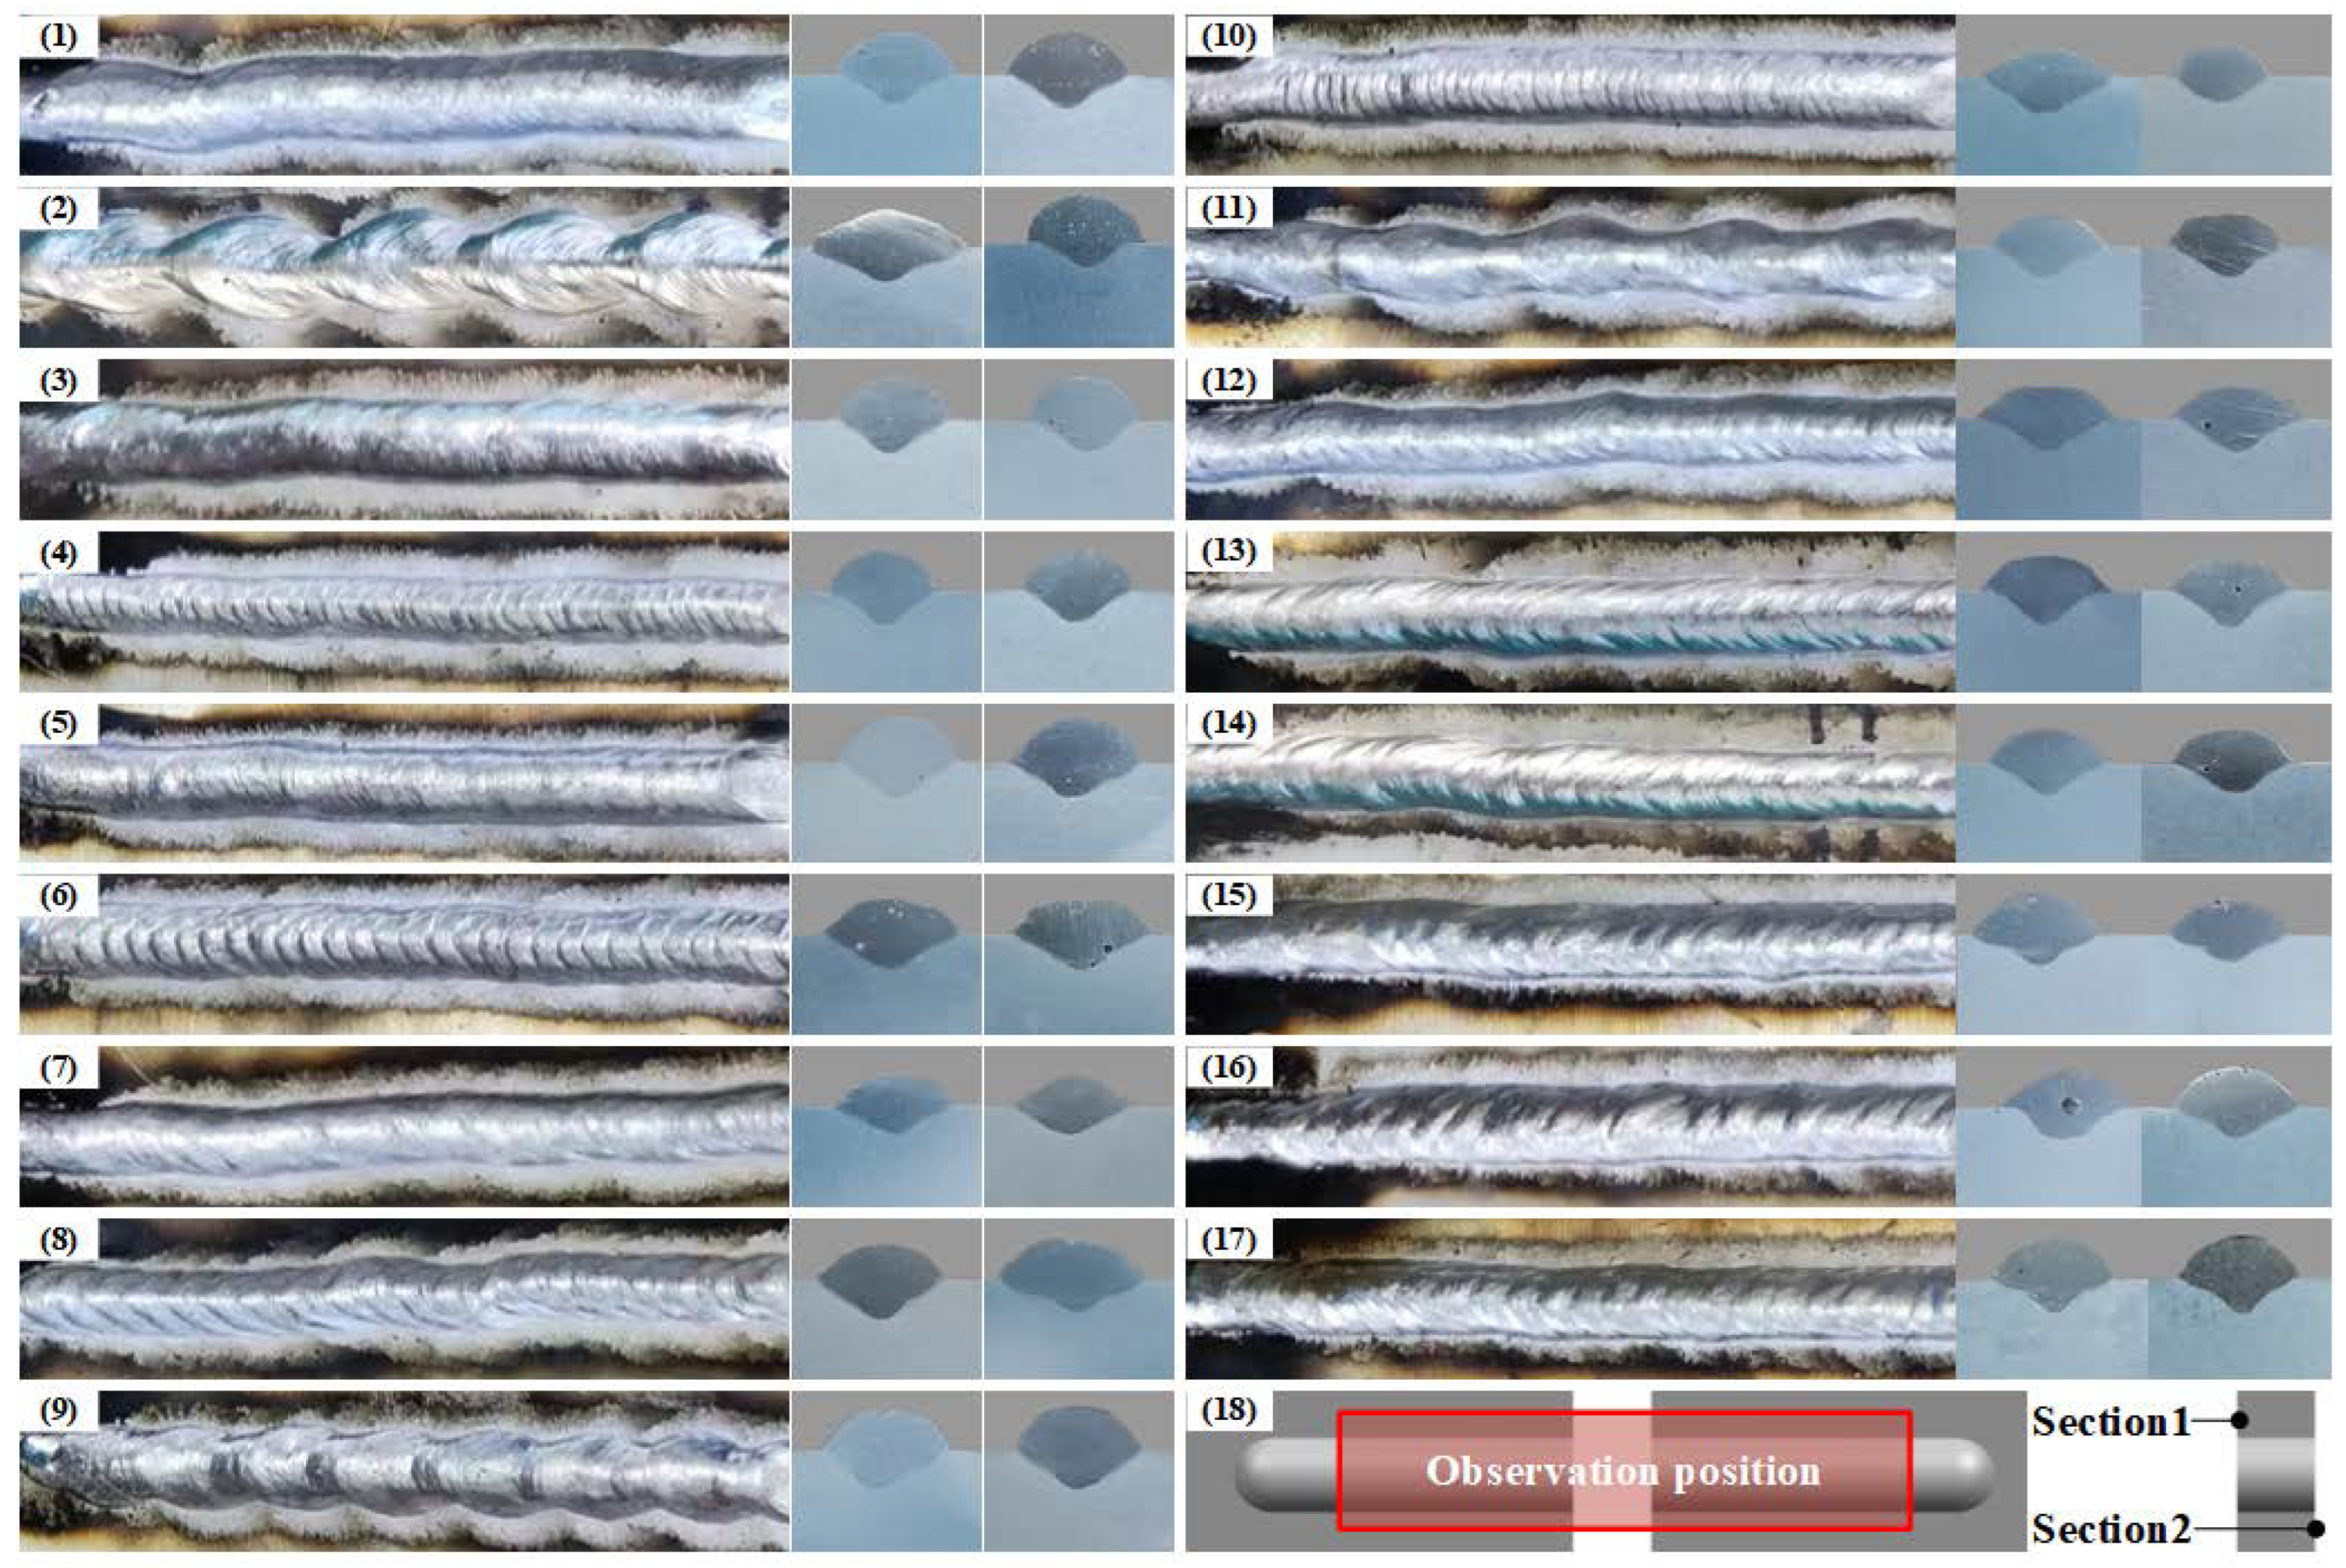
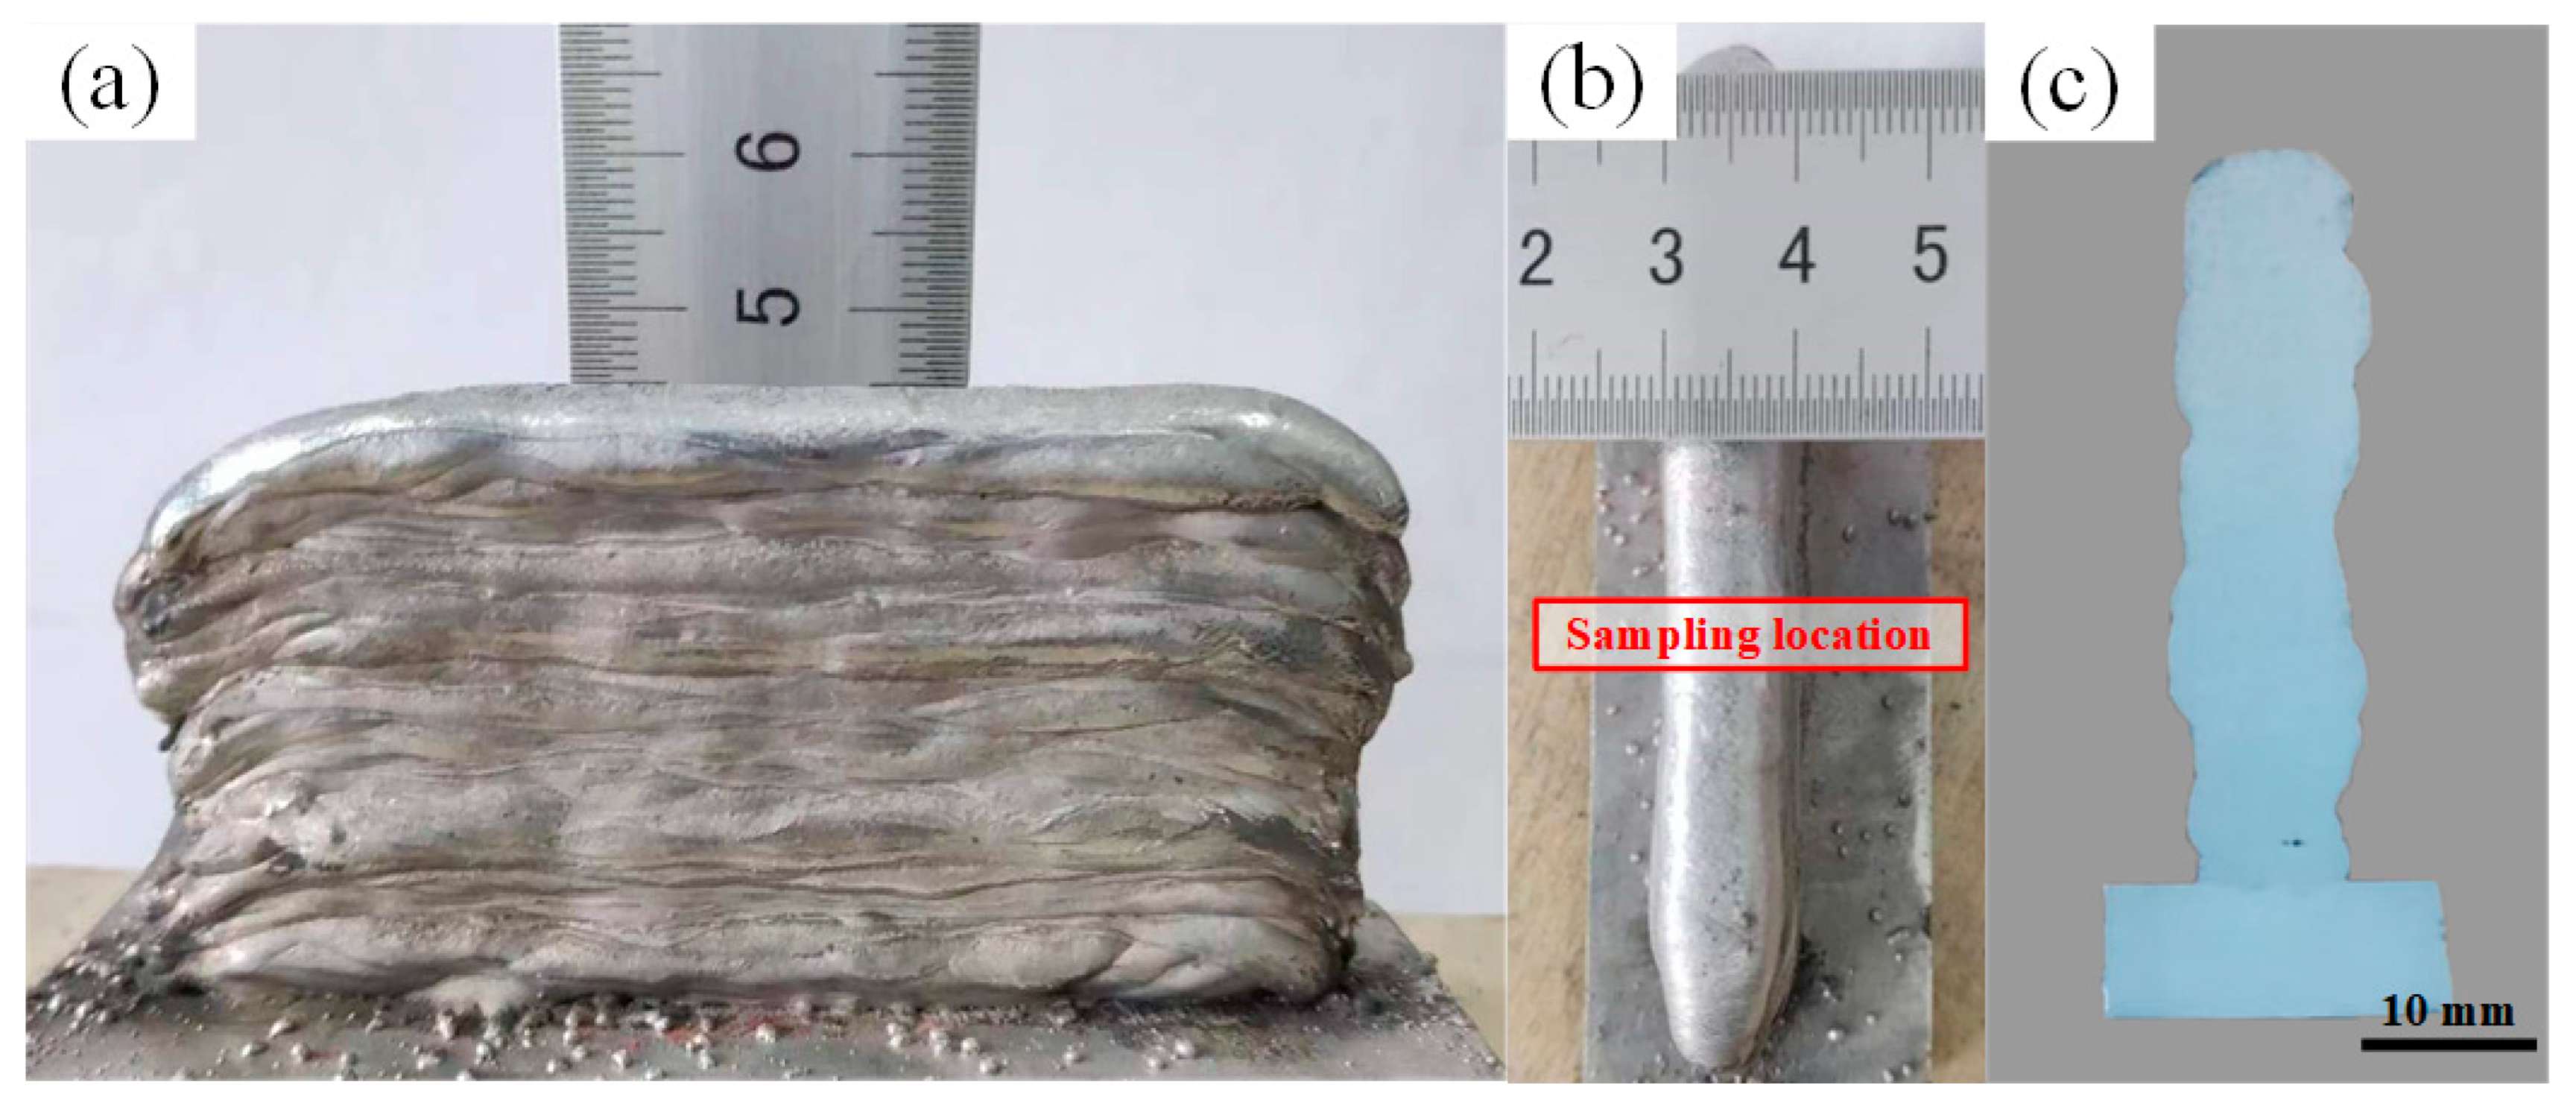
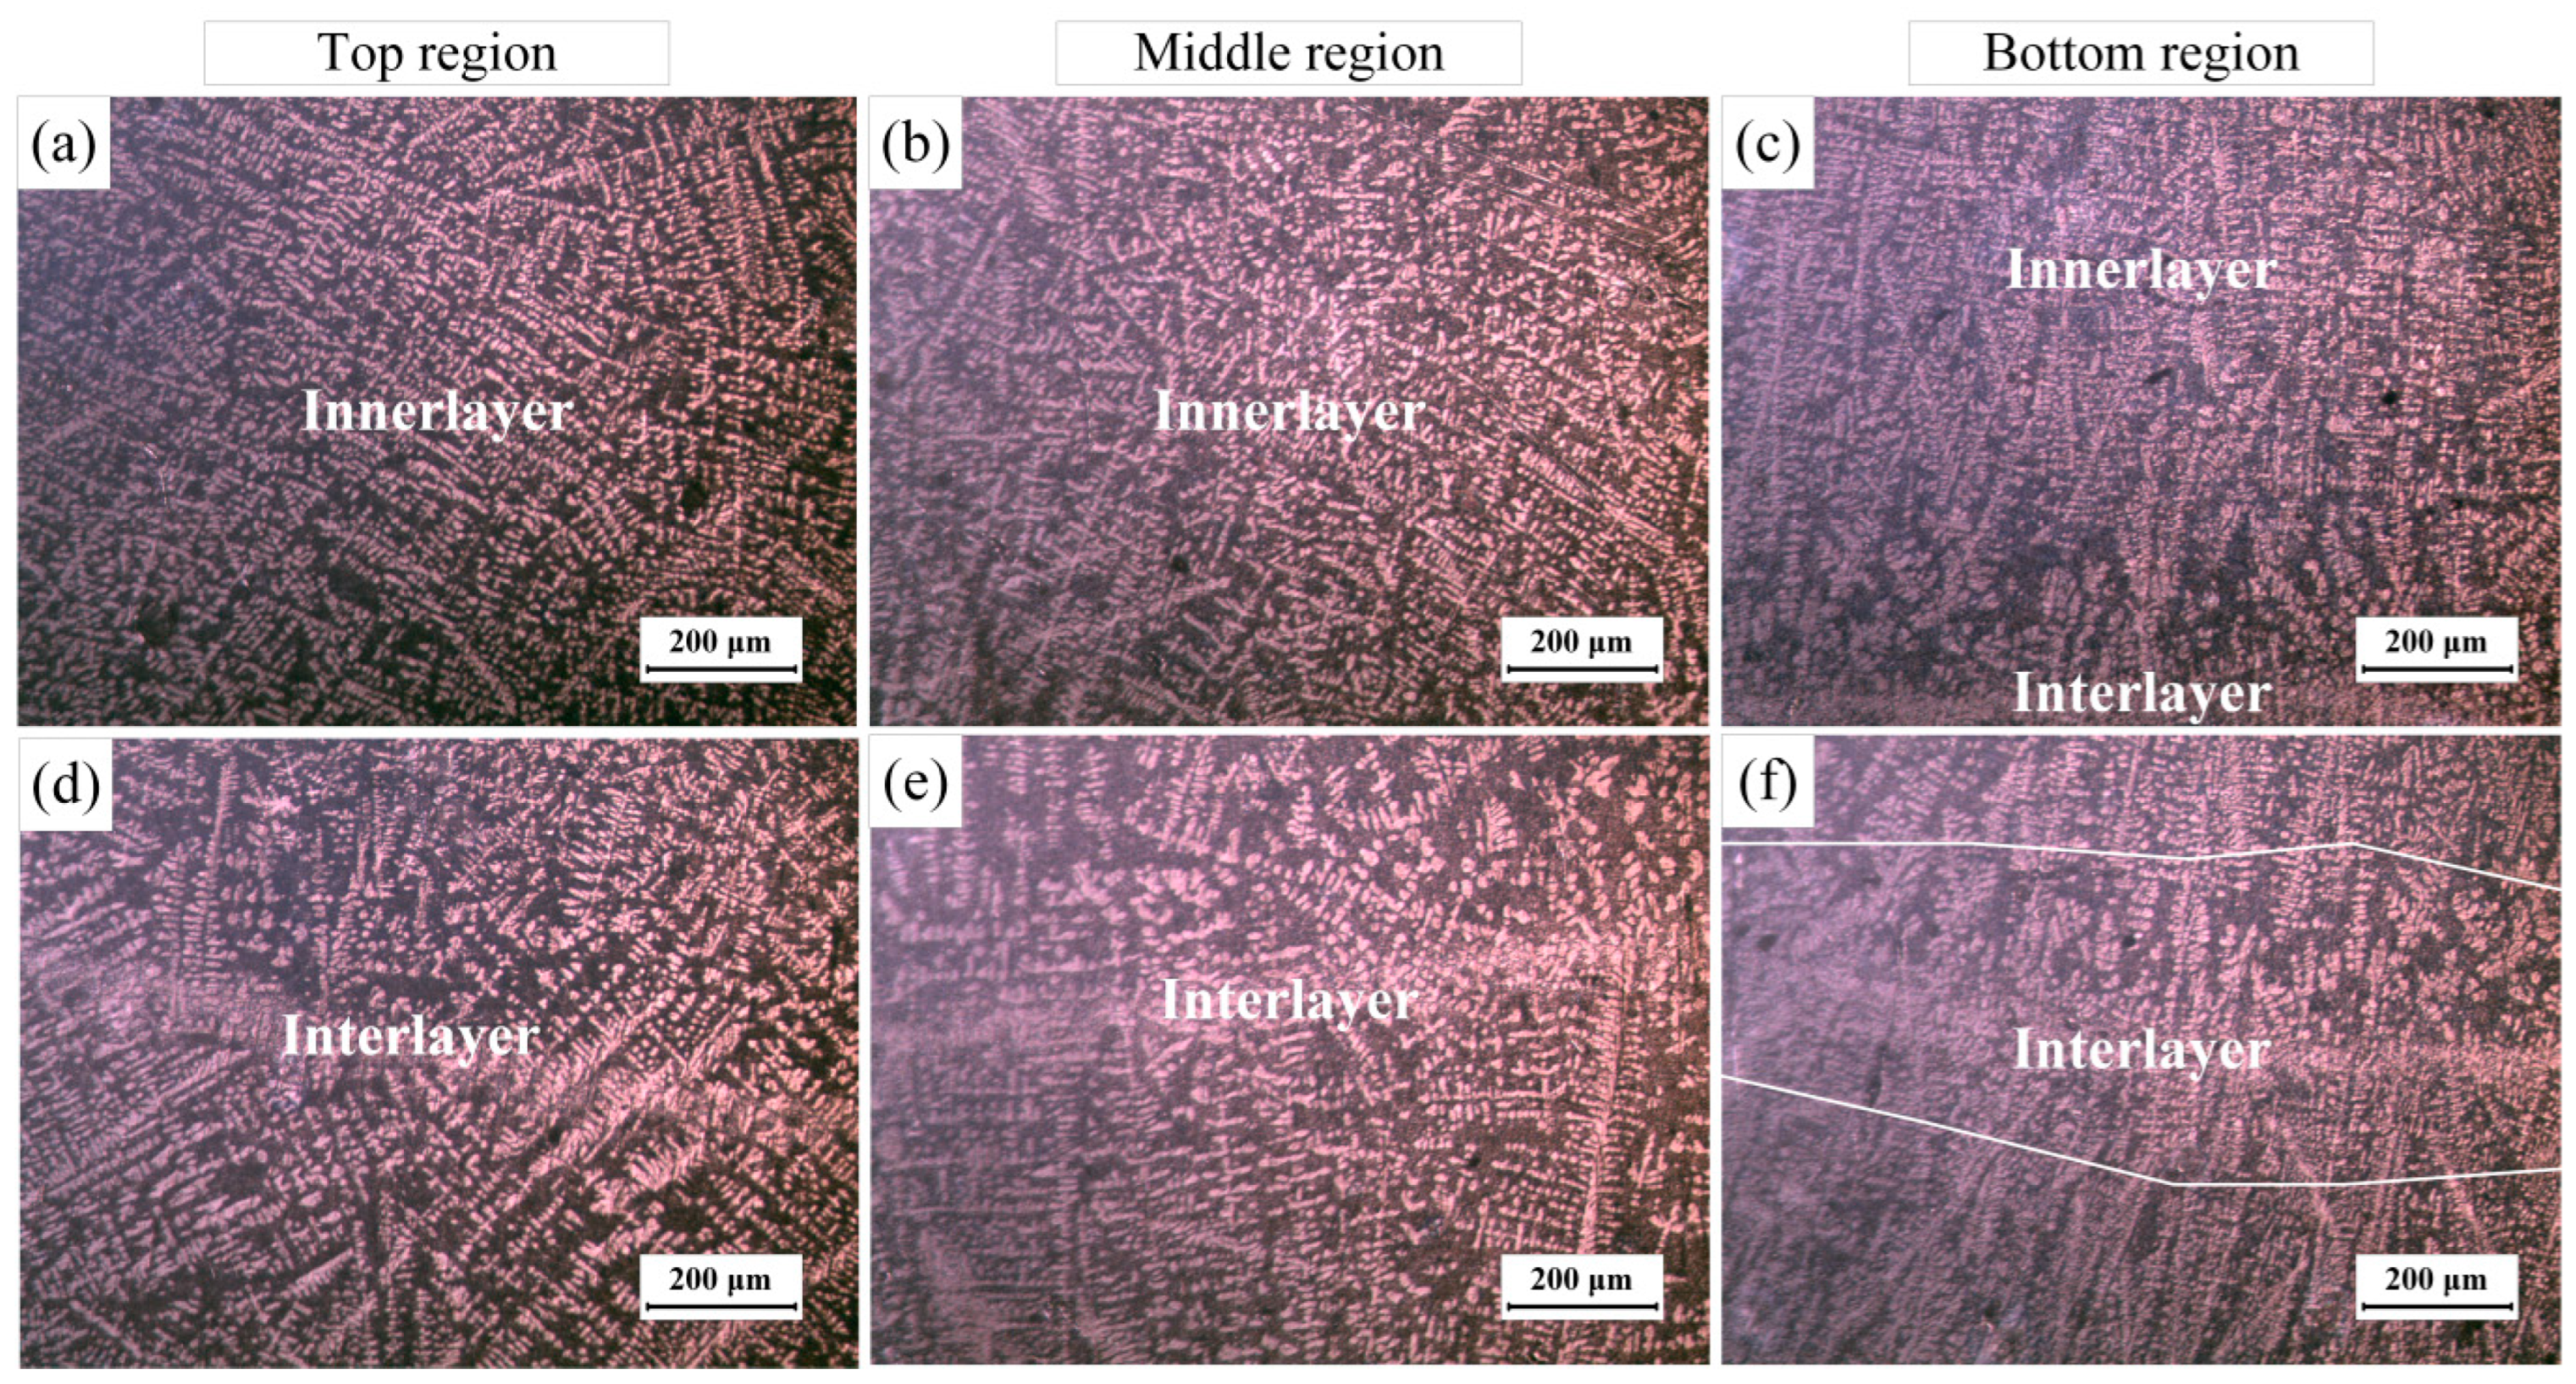
- No macroscopic defects were observed during or after the deposition. The thin-walled parts are well formed with an effective wall width of 8.6 mm. Because of the stirring effect of the double-pulse arc, the growth of some α-Al dendrites within the layers is interrupted and shows a staggered growth pattern. The interlayer microstructure undergoes remelting and differs from the intra-layer microstructure.
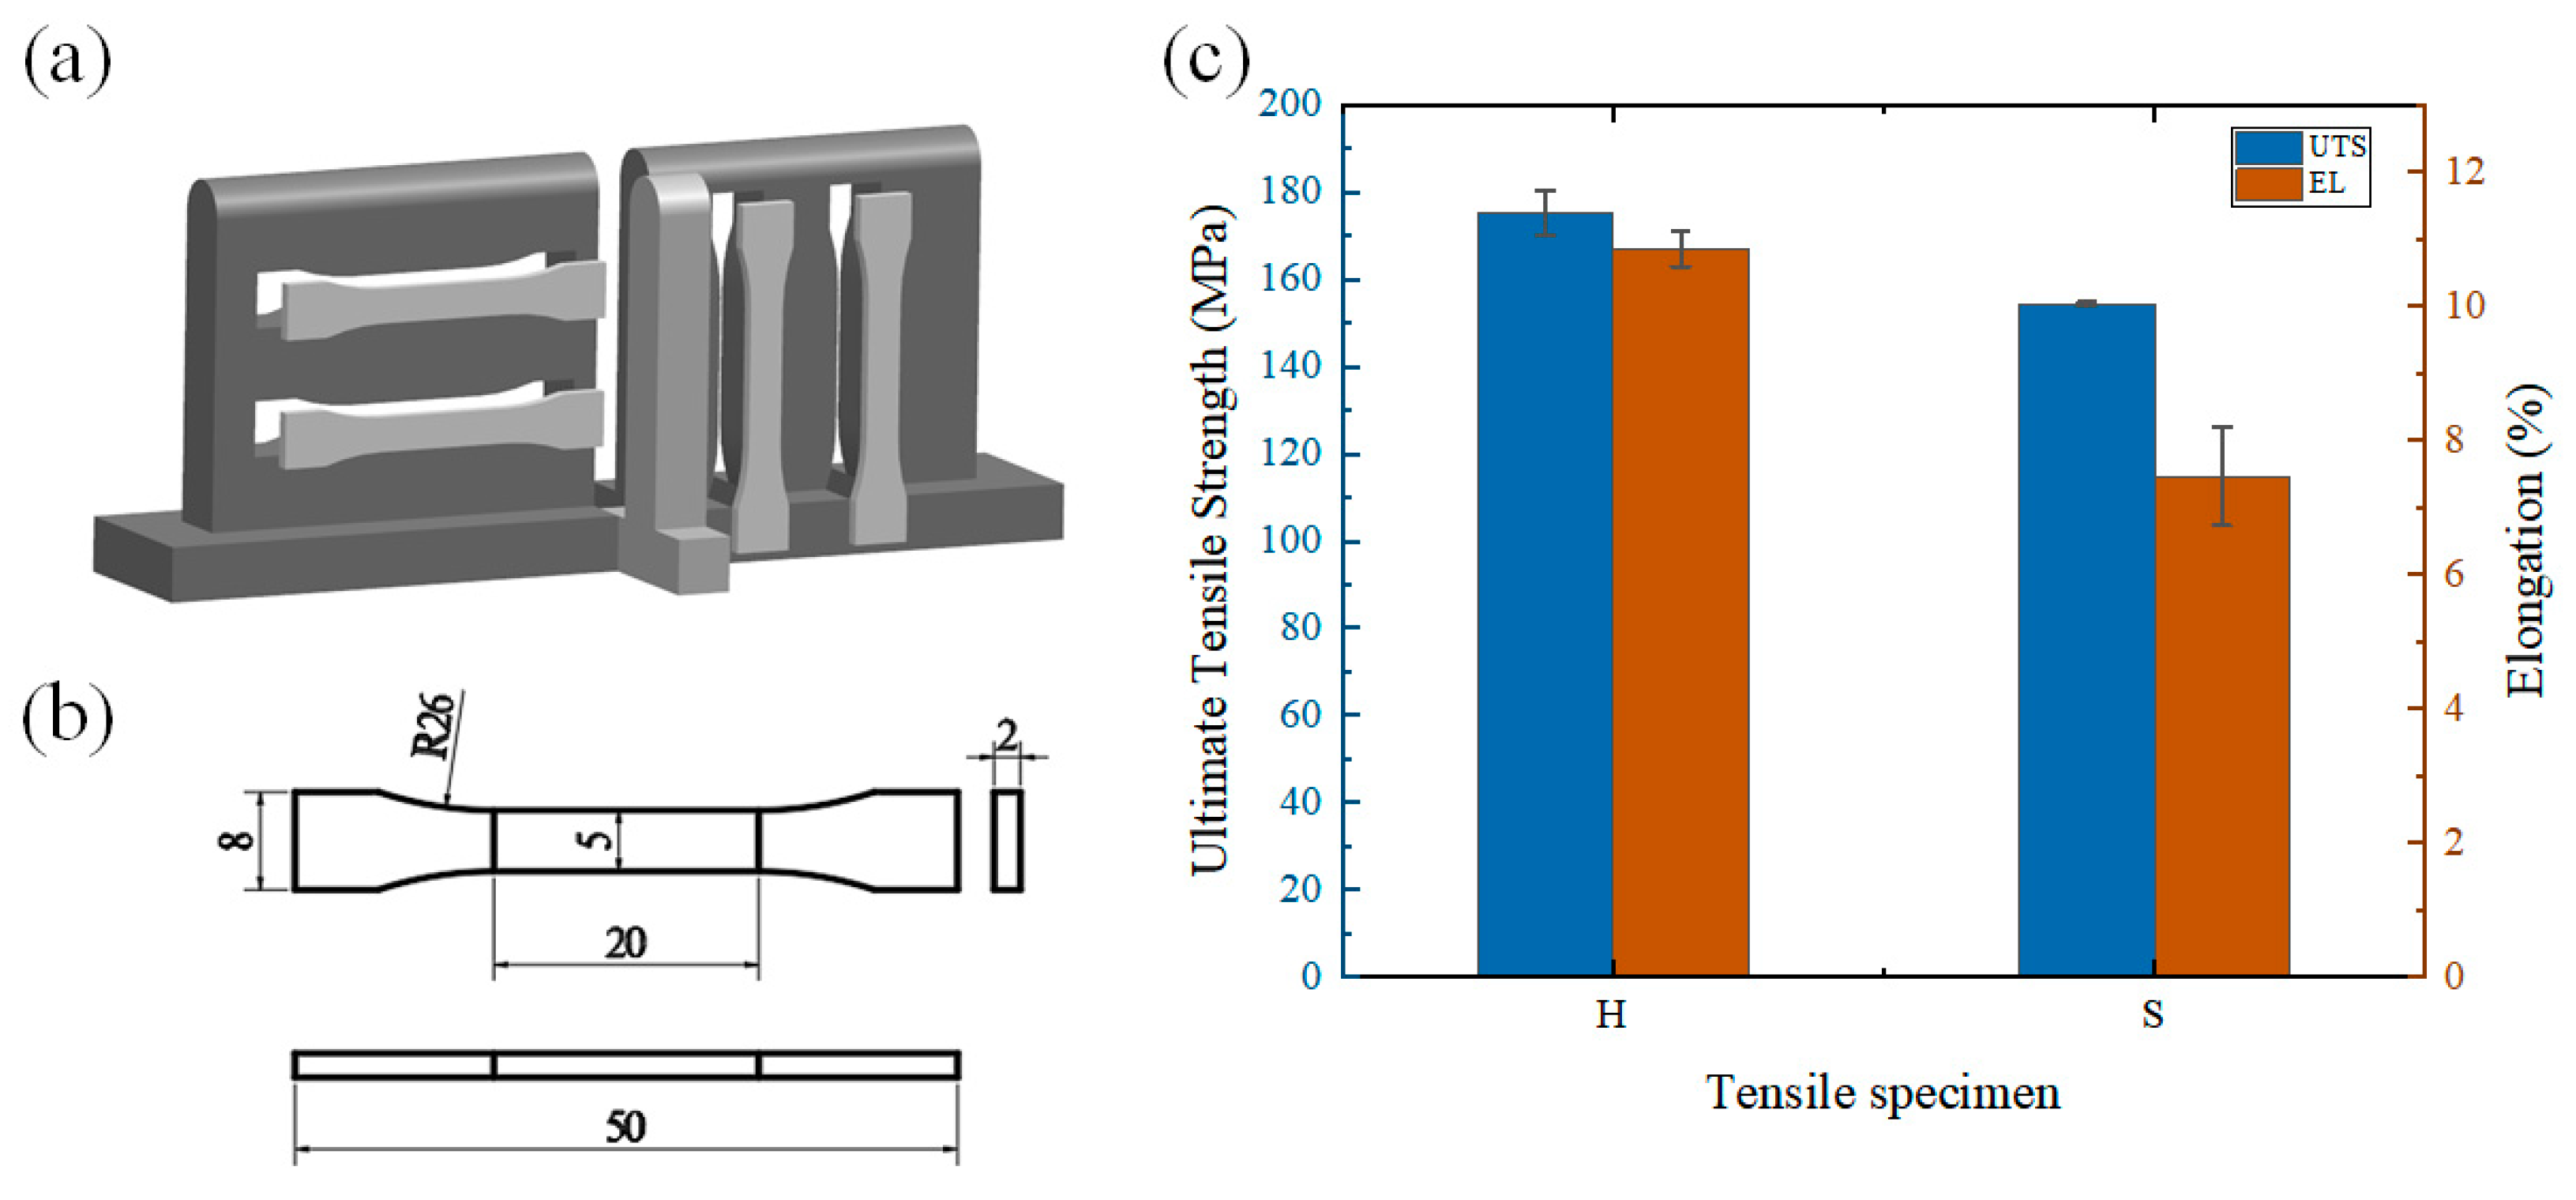
- The mechanical properties show a clear anisotropy. The average ultimate tensile strength of the transverse tensile specimens was 175.2 MPa and the average elongation was 10.355%. The average ultimate tensile strength of the vertical tensile specimens was 154.25 MPa and the average elongation was 7.46%.
Author Contributions
Funding
Institutional Review Board Statement
Informed Consent Statement
Data Availability Statement
Conflicts of Interest
References
- Zhang, J.; Song, B.; Wei, Q.; Bourell, D.; Shi, Y. A review of selective laser melting of aluminum alloys: Processing, microstructure, property and developing trends. J. Mater. Sci. Technol. 2019, 35, 270–284. [Google Scholar] [CrossRef]
- Langelandsvik, G.; Akselsen, O.M.; Furu, T.; Roven, H.J. Review of Aluminum Alloy Development for Wire Arc Additive Manufacturing. Materials 2021, 14, 5370. [Google Scholar] [CrossRef] [PubMed]
- Galy, C.; Le Guen, E.; Lacoste, E.; Arvieu, C. Main defects observed in aluminum alloy parts produced by SLM: From causes to consequences. Addit. Manuf. 2018, 22, 165–175. [Google Scholar] [CrossRef]
- Wu, B.; Pan, Z.; Ding, D.; Cuiuri, D.; Li, H.; Xu, J.; Norrish, J. A review of the wire arc additive manufacturing of metals: Properties, defects and quality improvement. J. Manuf. Process. 2018, 35, 127–139. [Google Scholar] [CrossRef]
- Tomar, B.; Shiva, S.; Nath, T. A review on wire arc additive manufacturing: Processing parameters, defects, quality improvement and recent advances. Mater. Today Commun. 2022, 31, 103739. [Google Scholar] [CrossRef]
- Tawfik, M.M.; Nemat-Alla, M.M.; Dewidar, M.M. Enhancing the properties of aluminum alloys fabricated using wire plus arc additive manufacturing technique-A review. J. Mater. Res. Technol. 2021, 13, 754–768. [Google Scholar] [CrossRef]
- Veiga, F.; Suarez, A.; Aldalur, E.; Artaza, T. Wire arc additive manufacturing of invar parts: Bead geometry and melt pool monitoring. Measurement 2022, 189, 8. [Google Scholar] [CrossRef]
- Aldalur, E.; Suárez, A.; Veiga, F. Metal transfer modes for Wire Arc Additive Manufacturing Al-Mg alloys: Influence of heat input in microstructure and porosity. J. Mater. Process. Technol. 2021, 297, 13. [Google Scholar] [CrossRef]
- Mathivanan, A.; Devakumaran, K.; Kumar, A.S. Comparative Study on Mechanical and Metallurgical Properties of AA6061 Aluminum Alloy Sheet Weld by Pulsed Current and Dual Pulse Gas Metal Arc Welding Processes. Mater. Manuf. Process. 2014, 29, 941–947. [Google Scholar] [CrossRef]
- Wang, L.; Xue, J. Perspective on Double Pulsed Gas Metal Arc Welding. Appl. Sci. 2017, 7, 894. [Google Scholar] [CrossRef]
- Sen, M.; Mukherjee, M.; Singh, S.K.; Pal, T.K. Effect of double-pulsed gas metal arc welding (DP-GMAW) process variables on microstructural constituents and hardness of low carbon steel weld deposits. J. Manuf. Process. 2018, 31, 424–439. [Google Scholar] [CrossRef]
- Wang, L.L.; Wei, H.L.; Xue, J.X.; DebRoy, T. Special features of double pulsed gas metal arc welding. J. Mater. Process. Technol. 2018, 251, 369–375. [Google Scholar] [CrossRef]
- Yao, P.; Tang, H.; Bin, K.; Chen, M.; Zhou, K. Influence of pulse frequency on weld bead formation and mechanical performance of 316L stainless steel by double-wire DP-GMAW process. Int. J. Adv. Manuf. Technol. 2022, 121, 3369–3383. [Google Scholar] [CrossRef]
- Koushki, A.R.; Goodarzi, M.; Paidar, M. Influence of shielding gas on the mechanical and metallurgical properties of DP-GMA-welded 5083-H321 aluminum alloy. Int. J. Miner. Metall. Mater. 2016, 23, 1416–1426. [Google Scholar] [CrossRef]
- Shim, D.-S. Effects of process parameters on additive manufacturing of aluminum porous materials and their optimization using response surface method. J. Mater. Res. Technol. 2021, 15, 119–134. [Google Scholar] [CrossRef]
- Al-Ahmari, A.; Ashfaq, M.; Alfaify, A.; Abdo, B.; Alomar, A.; Dawud, A. Predicting surface quality of γ-TiAl produced by additive manufacturing process using response surface method. J. Mech. Sci. Technol. 2016, 30, 345–352. [Google Scholar] [CrossRef]
- Geng, H.; Xiong, J.; Huang, D.; Lin, X.; Li, J. A prediction model of layer geometrical size in wire and arc additive manufacture using response surface methodology. Int. J. Adv. Manuf. Technol. 2015, 93, 175–186. [Google Scholar] [CrossRef]
- Waheed, R.; Saeed, H.A.; Butt, S.U.; Anjum, B. Framework for Mitigation of Welding Induced Distortion through Response Surface Method and Reinforcement Learning. Coatings 2021, 11, 1127. [Google Scholar] [CrossRef]
- Karganroudi, S.S.; Moradi, M.; Attar, M.A.; Rasouli, S.A.; Ghoreishi, M.; Lawrence, J.; Ibrahim, H. Experimental and Numerical Analysis on TIG Arc Welding of Stainless Steel Using RSM Approach. Metals 2021, 11, 19. [Google Scholar]
- Fu, Y.; Wang, G.; Zhang, H.; Liang, L. Optimization of surface appearance for wire and arc additive manufacturing of Bainite steel. Int. J. Adv. Manuf. Technol. 2016, 91, 301–313. [Google Scholar] [CrossRef]
- Escribano-García, R.; Rodriguez, N.; Zubiri, O.; Piccini, J.; Setien, I. 3D numerical simulation of GMAW Cold Metal Transfer using response surface methodology. J. Manuf. Process. 2022, 76, 656–665. [Google Scholar] [CrossRef]
- Sarathchandra, D.T.; Davidson, M.J.; Visvanathan, G. Parameters effect on SS304 beads deposited by wire arc additive manufacturing. Mater. Manuf. Process. 2020, 35, 852–858. [Google Scholar] [CrossRef]
- Wang, L.L.; Wei, H.L.; Xue, J.X.; DebRoy, T. A pathway to microstructural refinement through double pulsed gas metal arc welding. Scr. Mater. 2017, 134, 61–65. [Google Scholar] [CrossRef]


| Element | Si | Fe | Cu | Mg | Mn | Ti | Zn | Al |
|---|---|---|---|---|---|---|---|---|
| ER4047 | 11~13 | ≤0.6 | ≤0.3 | ≤0.1 | ≤0.15 | ≤0.15 | ≤0.2 | balance |
| 2A12 | ≤0.50 | 0~0.5 | 3.8~4.9 | 1.2~1.8 | 0.30~0.9 | ≤0.15 | ≤0.30 | balance |
| Parameters (Unit) | Optimization Scope | ||
|---|---|---|---|
| −1 | 0 | 1 | |
| A (m/min) | 0.3 | 1 | 1.7 |
| F (Hz) | 1 | 4 | 7 |
| V (mm/s) | 10 | 12 | 14 |
| Std Order | Design Matrix | Input Variables | Responses | ||||||
|---|---|---|---|---|---|---|---|---|---|
| A: Double-Pulse Amplitude/(m/min) | B: Double-Pulse Frequency/(Hz) | C: Travel Speed/(mm/s) | Penetration P/(mm) | Width W/(mm) | Height H/(mm) | ||||
| 1 | −1.00 | −1.00 | 0.00 | 0.3 | 1 | 12 | 1.560 | 6.165 | 2.205 |
| 2 | 1.00 | −1.00 | 0.00 | 1.7 | 1 | 12 | 1.525 | 7.150 | 2.085 |
| 3 | −1.00 | 1.00 | 0.00 | 0.3 | 7 | 12 | 1.575 | 5.825 | 2.225 |
| 4 | 1.00 | 1.00 | 0.00 | 1.7 | 7 | 12 | 1.650 | 5.675 | 2.050 |
| 5 | −1.00 | 0.00 | −1.00 | 0.3 | 4 | 10 | 1.780 | 6.500 | 2.200 |
| 6 | 1.00 | 0.00 | −1.00 | 1.7 | 4 | 10 | 1.800 | 7.025 | 1.775 |
| 7 | −1.00 | 0.00 | 1.00 | 0.3 | 4 | 14 | 1.450 | 6.310 | 1.625 |
| 8 | 1.00 | 0.00 | 1.00 | 1.7 | 4 | 14 | 1.795 | 7.100 | 1.875 |
| 9 | 0.00 | −1.00 | −1.00 | 1 | 1 | 10 | 1.925 | 6.625 | 2.150 |
| 10 | 0.00 | 1.00 | −1.00 | 1 | 7 | 10 | 1.550 | 6.100 | 1.505 |
| 11 | 0.00 | −1.00 | 1.00 | 1 | 1 | 14 | 1.530 | 5.985 | 1.559 |
| 12 | 0.00 | 1.00 | 1.00 | 1 | 7 | 14 | 1.610 | 6.785 | 1.640 |
| 13 | 0.00 | 0.00 | 0.00 | 1 | 4 | 12 | 1.690 | 6.505 | 1.700 |
| 14 | 0.00 | 0.00 | 0.00 | 1 | 4 | 12 | 1.510 | 6.350 | 1.780 |
| 15 | 0.00 | 0.00 | 0.00 | 1 | 4 | 12 | 1.575 | 6.275 | 2.100 |
| 16 | 0.00 | 0.00 | 0.00 | 1 | 4 | 12 | 1.550 | 6.700 | 2.000 |
| 17 | 0.00 | 0.00 | 0.00 | 1 | 4 | 12 | 1.575 | 6.125 | 1.950 |
| Source | Sum of Squares | df | Mean Square | F Value | p-Value P Rob > F | Contribution (%) | |
|---|---|---|---|---|---|---|---|
| Model | 0.23 | 9 | 0.026 | 5.21 | 0.0203 | significant | |
| A-DP-Amplitude | 0.021 | 1 | 0.021 | 4.18 | 0.0802 | 8.281 | |
| B-DP-Frequency | 0.022 | 1 | 0.022 | 4.44 | 0.0732 | 8.796 | |
| C-Travel Speed | 0.056 | 1 | 0.056 | 11.44 | 0.0117 | 22.662 | |
| AB | 0.003025 | 1 | 0.003025 | 0.62 | 0.458 | 1.228 | |
| AC | 0.026 | 1 | 0.026 | 5.38 | 0.0534 | 10.658 | |
| BC | 0.052 | 1 | 0.052 | 10.55 | 0.0141 | 20.899 | |
| A2 | 0.002342 | 1 | 0.002342 | 0.48 | 0.5118 | 0.951 | |
| C2 | 0.042 | 1 | 0.042 | 8.57 | 0.0221 | 16.977 | |
| A2B | 0.024 | 1 | 0.024 | 4.82 | 0.0641 | 9.548 | |
| Residual | 0.034 | 7 | 0.004905 | ||||
| Lack of Fit | 0.016 | 3 | 0.005462 | 1.22 | 0.4118 | not significant | |
| Pure Error | 0.018 | 4 | 0.004488 | ||||
| Cor Total | 0.26 | 16 | |||||
| Std. Dev. | 0.07 | R-Squared | 0.8701 | ||||
| PRESS | 0.33 | Adeq Precision | 8.625 |
| Source | Sum of Squares | df | Mean Square | F Value | p-Value P Rob > F | Contribution (%) | |
|---|---|---|---|---|---|---|---|
| Model | 2.78 | 9 | 0.31 | 8.85 | 0.0045 | significant | |
| A-DP-Amplitude | 0.58 | 1 | 0.58 | 16.58 | 0.0047 | 22.8570 | |
| B-DP-Frequency | 0.019 | 1 | 0.019 | 0.54 | 0.4853 | 0.7444 | |
| C-Travel Speed | 0.0006125 | 1 | 0.0006125 | 0.018 | 0.8983 | 0.0248 | |
| AB | 0.32 | 1 | 0.32 | 9.24 | 0.0188 | 12.7382 | |
| BC | 0.44 | 1 | 0.44 | 12.6 | 0.0094 | 17.3702 | |
| A2 | 0.031 | 1 | 0.031 | 0.9 | 0.374 | 1.2407 | |
| B2 | 0.32 | 1 | 0.32 | 9.05 | 0.0197 | 12.4762 | |
| C2 | 0.28 | 1 | 0.28 | 7.94 | 0.0258 | 10.9460 | |
| A2B | 0.55 | 1 | 0.55 | 15.67 | 0.0055 | 21.6025 | |
| Residual | 0.24 | 7 | 0.035 | ||||
| Lack of Fit | 0.05 | 3 | 0.017 | 0.34 | 0.799 | not significant | |
| Pure Error | 0.19 | 4 | 0.049 | ||||
| Cor Total | 3.02 | 16 | |||||
| Std. Dev. | 0.19 | R-Squared | 0.9192 | ||||
| PRESS | 1.46 | Adeq Precision | 10.302 |
| Source | Sum of Squares | df | Mean Square | F Value | p-Value P Rob > F | Contribution (%) | |
|---|---|---|---|---|---|---|---|
| Model | 0.8 | 9 | 0.089 | 4.25 | 0.0347 | significant | |
| A-DP-Amplitude | 0.028 | 1 | 0.028 | 1.32 | 0.288 | 3.367 | |
| B-DP-Frequency | 0.042 | 1 | 0.042 | 2.01 | 0.1996 | 5.127 | |
| C-Travel Speed | 0.11 | 1 | 0.11 | 5.19 | 0.0569 | 13.238 | |
| AB | 0.0007563 | 1 | 0.0007563 | 0.036 | 0.8545 | 0.092 | |
| AC | 0.11 | 1 | 0.11 | 5.45 | 0.0522 | 13.901 | |
| BC | 0.13 | 1 | 0.13 | 6.31 | 0.0403 | 16.094 | |
| A2 | 0.16 | 1 | 0.16 | 7.68 | 0.0276 | 19.589 | |
| B2 | 0.006737 | 1 | 0.006737 | 0.32 | 0.5879 | 0.816 | |
| C2 | 0.23 | 1 | 0.23 | 10.89 | 0.0131 | 27.776 | |
| Residual | 0.15 | 7 | 0.021 | ||||
| Lack of Fit | 0.04 | 3 | 0.013 | 0.49 | 0.7057 | not significant | |
| Std. Dev. | 0.14 | R-Squared | 0.8454 | ||||
| PRESS | 0.8 | Adeq Precision | 6.952 |
Disclaimer/Publisher’s Note: The statements, opinions and data contained in all publications are solely those of the individual author(s) and contributor(s) and not of MDPI and/or the editor(s). MDPI and/or the editor(s) disclaim responsibility for any injury to people or property resulting from any ideas, methods, instructions or products referred to in the content. |
© 2023 by the authors. Licensee MDPI, Basel, Switzerland. This article is an open access article distributed under the terms and conditions of the Creative Commons Attribution (CC BY) license (https://creativecommons.org/licenses/by/4.0/).
Share and Cite
Du, W.; Sun, G.; Li, Y.; Chen, C. Process Optimization, Microstructure and Mechanical Properties of Wire Arc Additive Manufacturing of Aluminum Alloy by Using DP-GMAW Based on Response Surface Method. Materials 2023, 16, 5716. https://doi.org/10.3390/ma16165716
Du W, Sun G, Li Y, Chen C. Process Optimization, Microstructure and Mechanical Properties of Wire Arc Additive Manufacturing of Aluminum Alloy by Using DP-GMAW Based on Response Surface Method. Materials. 2023; 16(16):5716. https://doi.org/10.3390/ma16165716
Chicago/Turabian StyleDu, Wenbo, Guorui Sun, Yue Li, and Chao Chen. 2023. "Process Optimization, Microstructure and Mechanical Properties of Wire Arc Additive Manufacturing of Aluminum Alloy by Using DP-GMAW Based on Response Surface Method" Materials 16, no. 16: 5716. https://doi.org/10.3390/ma16165716
APA StyleDu, W., Sun, G., Li, Y., & Chen, C. (2023). Process Optimization, Microstructure and Mechanical Properties of Wire Arc Additive Manufacturing of Aluminum Alloy by Using DP-GMAW Based on Response Surface Method. Materials, 16(16), 5716. https://doi.org/10.3390/ma16165716