1. Introduction
Additive manufacturing (AM) technologies, in particular laser powder bed fusion (LPBF), are of extraordinary interest to the aerospace industry. Advantages of these technologies include a large increase in geometrical freedom and potential savings of material and overall production cost [
1,
2,
3,
4].
It is also desirable to use AM technology in load-bearing applications, but standards for part certification and quality assurance are not yet established. Hence, there is currently still a restriction to non-critical parts in aerospace systems [
5,
6]. Part of the work done to gain an understanding of the process–material–property relations needed as a foundation for part qualification is summarized in
Section 1.1.
Section 1.2 explains the contribution of this work to that same understanding.
1.1. Mechanical Properties of LPBF-Processed AlSi Alloys
Different review papers have suggested that there is an extensive number of studies on LPBF processing of materials like Ti-64 [
7,
8,
9,
10,
11], Inconel 718 [
11,
12,
13,
14] or 316L steel [
15,
16,
17,
18,
19]. LPBF-processing of aluminium alloys, however, has only gained importance in recent years [
20,
21,
22,
23,
24,
25]. Aboulkhair et al. found that this is related to the particularly challenging properties of aluminium alloys and aluminium alloy powders for laser processing. The powders are generally characterized by low flowability, which impacts powder layer recoating, and are prone to oxidation, causing porosities. Moreover, the high reflectivity of the common LPBF process wavelength range, low laser absorption and high thermal conductivity result in a need for high laser power [
21].
Nonetheless, LPBF processing of aluminium alloys is interesting, especially for lightweight construction applications, as they are lightweight, strong, corrosion-resistant and highly weldable. Combined with the geometrical freedom enabled by LPBF processing, they are suitable for tailoring parts for numerous purposes within automotive, aerospace and other industries [
21].
The best LPBF-processable alloys are aluminium–silicon-based, and the most commonly-investigated one is AlSi10Mg. The silicon phase in the solidified LPBF material contributes to limit crack initiation and propagation due to the LPBF-typical fine microstructure and improves its tensile strength as compared to the cast material [
4,
24,
26].
In particular, the alloys AlSi10Mg, AlSi12 and AlSi7Mg are considered ‘highly printable’ [
24]. For these materials, ultimate tensile strength (UTS) values between 300 and 450 MPa in as-built condition are reported [
4,
24,
27,
28,
29,
30,
31,
32,
33,
34,
35,
36].
Many publications assess the effect of heat treatment [
30,
31,
33,
36,
37,
38,
39,
40,
41], and there is some work addressing the effect of surface post-processing [
42,
43,
44,
45] or positioning on the build platform [
39,
46] on mechanical properties.
In this section, an overview of recent work on mechanical properties is given. The focus is on investigations on tensile and fatigue behavior of LPBF-processed aluminium alloys, particularly the AlSi7Mg0.6 alloy.
1.1.1. Tensile Properties
Yang et al. investigated the effect of heat treatments on microstructure and mechanical behavior anisotropy for the AlSi7Mg0.6 alloy. They observed the typical LPBF fine microstructure in as-built condition due to the material’s fast cooling rate and a resulting higher strength than the as-cast alloy. Of the heat-treated samples, directly aged (T5) samples showed the highest strength and stress-relieved samples showed the largest elongation at fracture [
31].
Similarly, Rao et al. found better tensile strength in as-built LPBF compared to the as-cast condition and observed that stress relaxation had a negative effect on yield strength (YS) and UTS while causing a slight improvement in ductility. A short solution heat treatment improved ductile behavior, and a longer treatment led to a decrease in YS and ductility [
30].
Pereira et al. compared microstructure and mechanical properties of AlSi7Mg0.6 from LPBF and investment casting. They found that mechanical properties of LPBF can exceed aerospace qualification requirements for heat treated (T6) investment casting parts. They used direct aging heat treatment to improve ductility and hardness of LPBF-processed samples while maintaining a similar tensile strength as compared to as-built samples (e.g., mean UTS (as-built, vertical) of 435 MPa, after heat treatment 431 MPa) [
33].
Zhang et al. looked into the effect of heat treatment for Er-containing AlSi7Mg0.6 and found that tensile properties are superior to the non-Er-containing alloy. The applied heat treatments improved ductility from 8% up to 19% for stress-relieved samples (with reduced tensile strength). Direct aging and T6 heat treatment both resulted in increased YS [
36].
Advantages and disadvantages of different heat treatments compared to as-built ones were discussed by Mauduit et al. Amongst others, they found that the investigated heat treatments soft annealing and T6 resulted in isotropic mechanical properties. Soft annealing reduced tensile strength but removed residual stresses, artificial aging created the best UTS, but samples exhibited anisotropic mechanical properties. As-built samples already reached good mechanical properties but showed anisotropy. However, not applying heat treatment led to shorter production time and was less expensive [
40].
Menezes et al. evaluated the effect of orientation on the build plate for as-built and heat-treated samples. Both conditions showed anisotropic behavior, where vertical specimens had lower YS and higher UTS. Comparing artificially aged and as-built samples, the latter showed lower YS [
47].
Next to vertically (90°) and horizontally built (0°) samples, Denti included specimens built at a 45° angle in their investigation and observed a (slight) tendency for increasing tensile strength and decreasing elongation at fracture for steeper build angles [
48].
In addition to heat treatment, Han et al. looked into the effect of laser surface remelting (LSR) for LPBF-processed AlSi10Mg and found that
(arithmetic mean of profile height variation) can be significantly improved by LSR. For as-built surfaces, they report an
μm that improved to values below 1 µm for LSR-processed samples. In addition, LSR led to increasing micro-hardness. The applied heat treatment led to reduced tensile strength and improved ductility from 6% to 22% [
41].
1.1.2. Fatigue Properties
A full tension–tension loading Wöhler curve assessment with
of the AlSi7Mg0.6 alloy using an endurance limit of
cycles was performed by Bassoli et al. [
49]. They obtained a result of
MPa and found that the alloy’s fatigue performance under the applied processing conditions was slightly lower but still comparable to reported literature values for the AlSi10Mg alloy [
50]. Surface texture parameters were not specified, but they mentioned that the samples had not received any post-treatment.
Grande et al. [
39] investigated the relationship of heat treatment and tensile strength as well as the effect of position on the build platform on fatigue life. They produced specimens with densities > 98.8% and as-built YS of 222 MPa and UTS of 417 MPa. They found that stress relief reduced tensile performance. Their fatigue results suggest that the position on the build platform does not have a significant influence on the endurance limit (at
cycles: 127 MPa internal vs. 137 MPa external regions) of the heat-treated specimens. Fatigue samples were sandblasted to improve surface texture prior to fatigue testing.
Denti and Sola [
43] looked into the effect of different post-processing technologies (e.g., sandblasting, plastic media blasting and laser shock processing) on axial fatigue. They found that the evaluated surface processing techniques improved the areal arithmetic mean surface height deviation
by up to 77%. The lowest
values were achieved by plastic media blasting. The peak stress level at the endurance limit of
was improved by up to 80% with respect to the as-built
of 50 MPa. Fatigue performance was also improved by post-processing techniques not enhancing the surface quality, which led them to the conclusion that both the improvement of surface quality and the introduction of compressive residual stresses can play a role when looking at LPBF-processed aluminium alloy parts.
The impact of sample location on the build platform, orientation and variation between production batches was studied by Cacace et al. [
46]. By analyzing mechanical property data of three batches with randomly allocated sample positions, they found that part position did not have an influence on tensile strength but did affect low cycle fatigue performance.
Nasab et al. [
51] investigated the combined effect of volumetric and surface defects. They looked into as-built surfaces with different contour scans, trying to promote typical defects to show their effect on rotating bending fatigue. The defect depths were analyzed by optical line-of-sight measurement, as well as polished cross-sections. Material removal depths of up to 200 μm were suggested, depending on the surface condition. They state that contact and non-contact surface texture measurements cannot provide information on fatigue-critical surface features as comprehensively as investigations into polished cross-sections.
In previously published work, the authors of this paper evaluated crack initiation behavior and surface fatigue relations for AlSi7Mg0.6 for three different groups of as-built samples. We assessed the applicability of valley depth
and reduced valley depth
and found that
is especially useful when considering coarser as-built surfaces, since they tend to exhibit crack initiation from multiple surface defects [
52].
1.2. Motivation and Objective
Most of the studies summarized deal with the influence of heat treatment and build direction (horizontal/vertical) on tensile properties. While tensile properties are an important starting point in understanding a material’s mechanical behavior and are certainly relevant for various applications, for many aerospace, automotive, biomedical or other industrial purposes, resistance to periodic loading is of interest. In regard to fatigue life, surface texture plays an important role [
4,
6].
The majority of studies including the effect of surface condition on fatigue performance of the LPBF-processed AlSi7Mg0.6 material, as well as other aluminium alloys and other typical LPBF powder materials (e.g., Ti-64, 316L steel or Inconel 718), evaluate the application of different surface post-processing strategies, e.g., [
7,
10,
15,
42,
45,
53,
54,
55].
However, especially when considering complex geometries or parts with inner surfaces that are difficult to access with post-processing tools, it is desirable to produce as-built surfaces (including near-surface regions) good enough to perform reasonably well under cyclic loading. In addition to accessibility issues, using as-built parts saves time and cost due to reducing processing steps, since extensive post-processing becomes unnecessary.
In this paper, the effect of the as-built surface condition on mechanical properties is discussed. The ultimate aim is to create high-quality as-built surfaces.
The first step is to create distinctive as-built surface conditions by varying contour scan parameters (
Section 3.1). Afterwards, the effect of these variations on bulk quality, characterized by density (
Section 3.2) and UTS (
Section 4.1), is investigated. Finally, a first selection of fatigue results is presented, showing the influence of as-built surface condition on fatigue resistance at a load level of 0.5
and the endurance limit (
Section 4.2).
2. Materials and Methods
2.1. Manufacturing
The evaluated samples were manufactured in an LPBF process on a Trumpf TruePrint 1000 from AlSi7Mg0.6 aluminium alloy powder. The powder composition along with mass fractions of alloying elements are shown in
Table 1. Specifications of geometries and manufacturing settings are given subsequently.
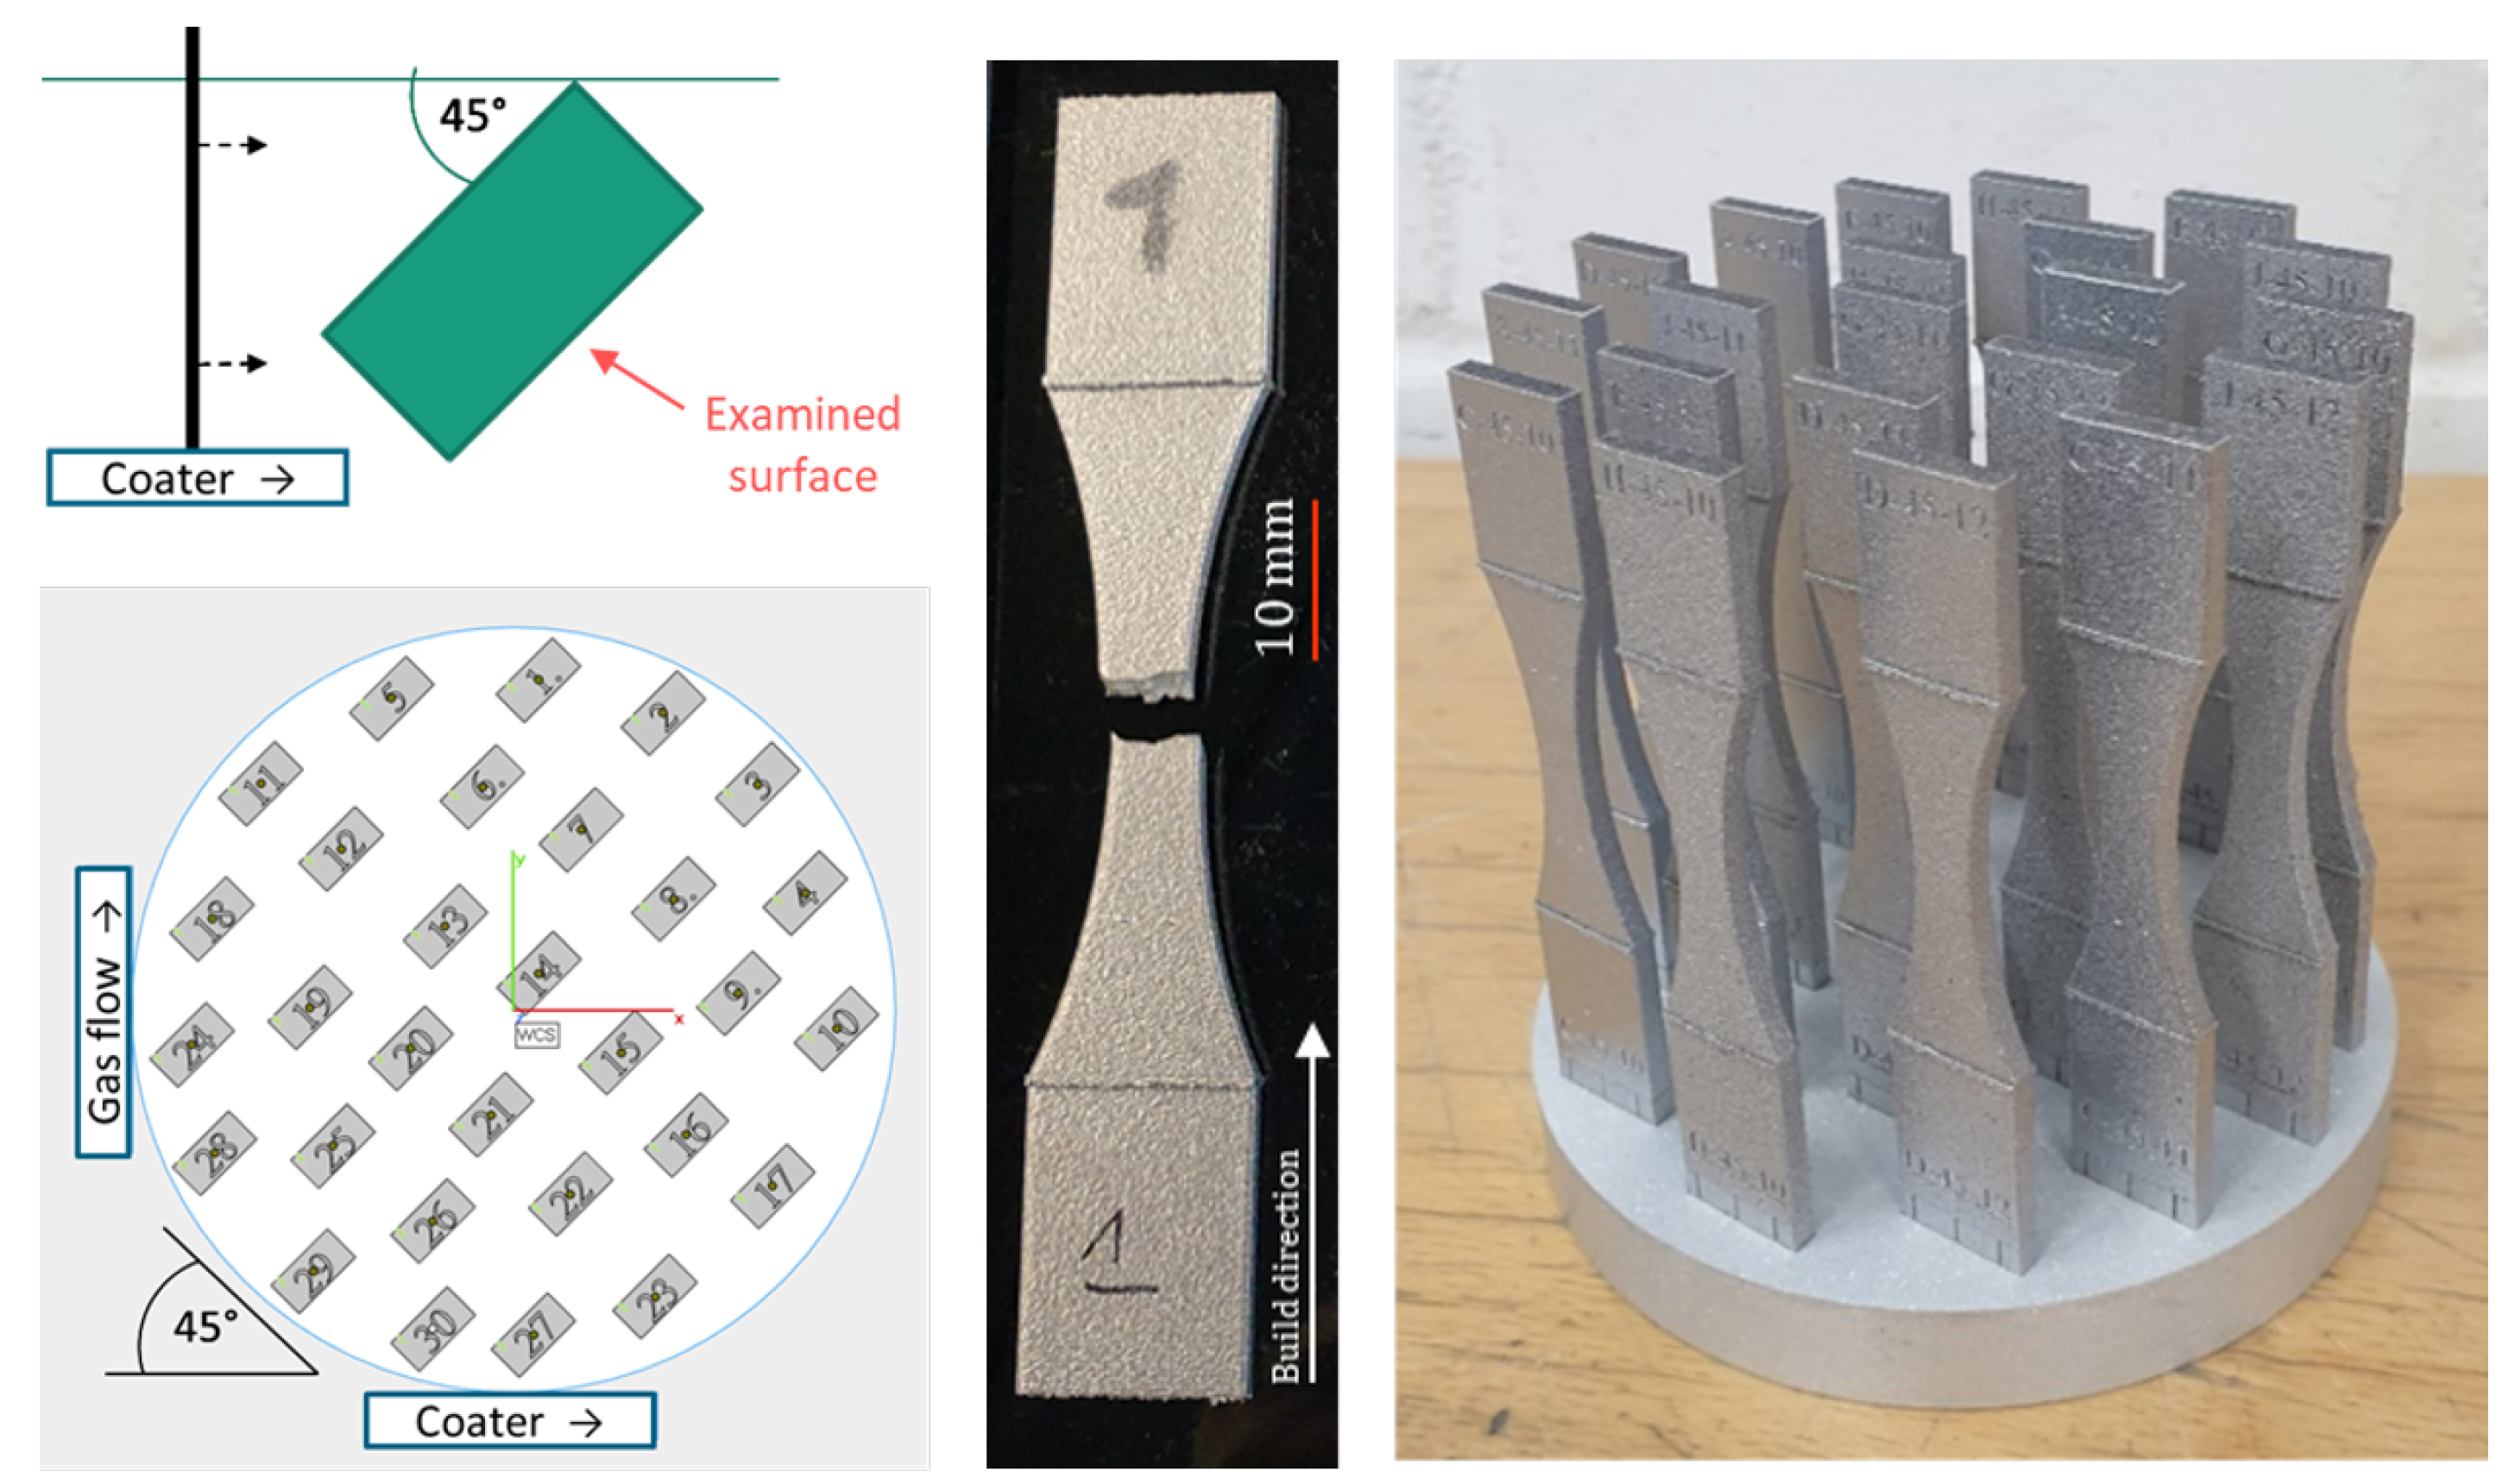
2.1.1. Sample Geometry
Two kinds of samples are used in this work: cuboids (height 10 mm, width 10 mm, thickness 5 mm) and fatigue specimens according to ASTM 466-15 [
56] (height 80 mm, smallest cross section 6 mm, thickness 3 mm). The latter type is shown in
Figure 1.
2.1.2. Manufacturing Parameters
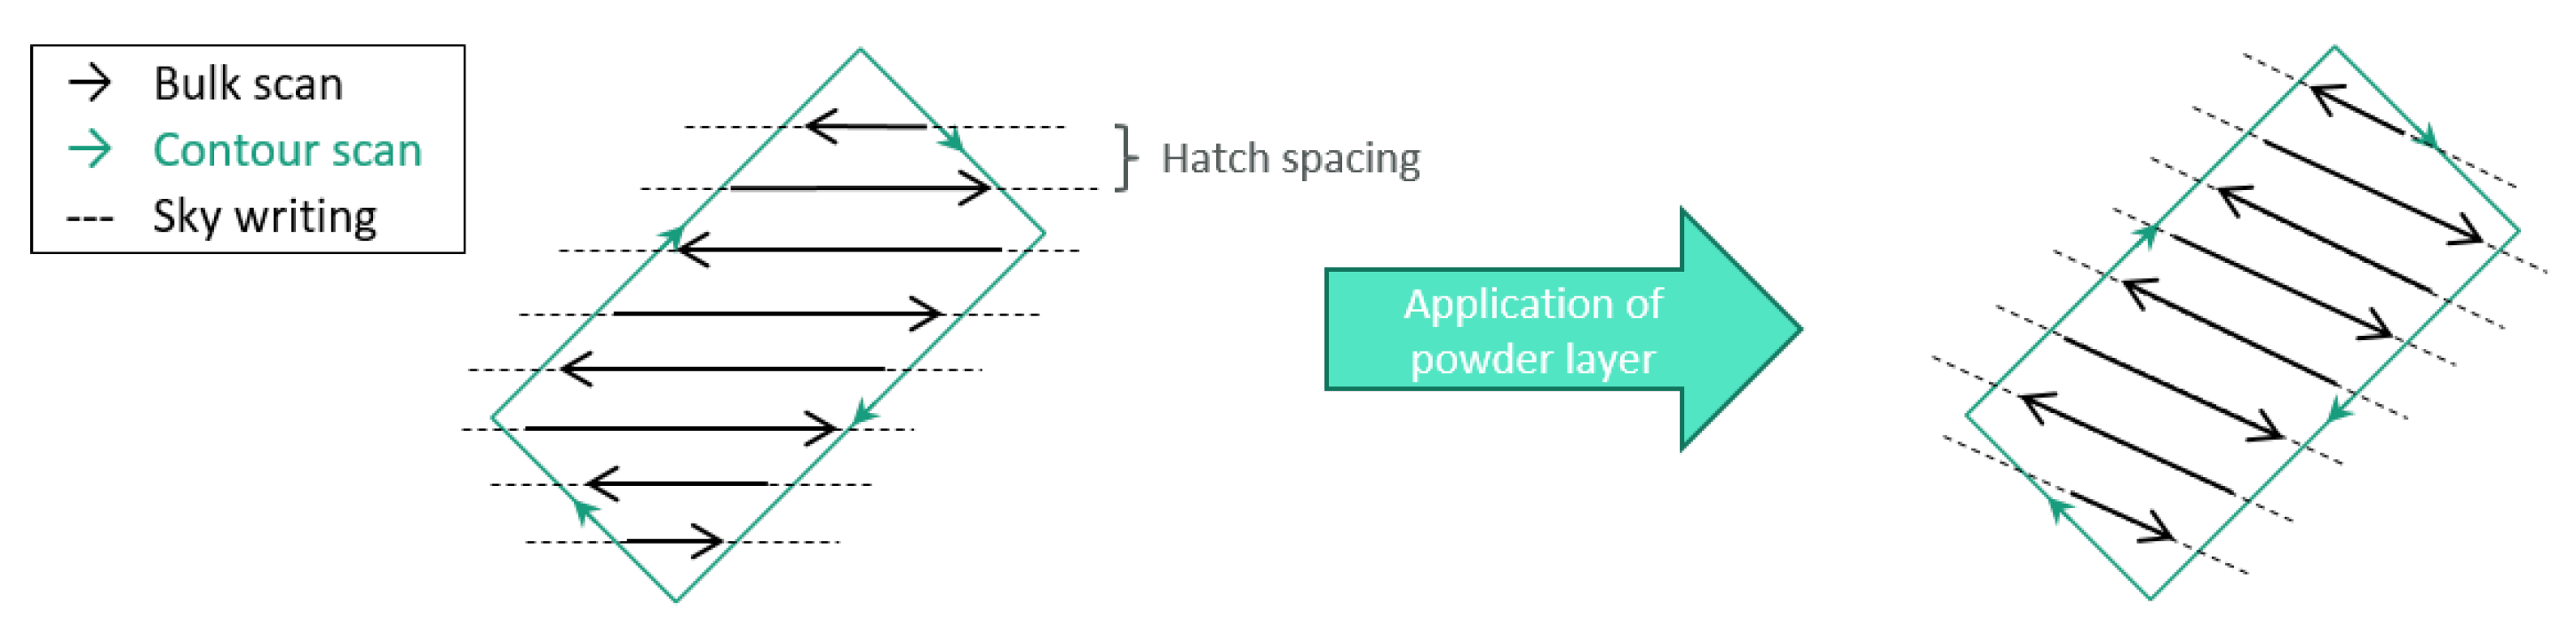
Powder layers were exposed to the laser by a pattern of parallel lines in the bulk, changing direction by 66° after each layer, and a continuous scan of the geometric contour. Sky writing was applied to ensure the laser source was moving at the chosen speed prior to exposure.
The samples were placed on the build platform at a 45° angle with respect to the coater and gas flow, as shown in
Figure 1. This angle was found to be most suitable regarding surface texture. In preliminary studies, comparable surface texture parameter values were found for both sides of the sample, supposedly because the effects of coater and gas flow compensate each other.
Bulk scan parameters were identical for all samples, as specified in
Table 2, and originate from a previous density optimization study.
The contour scan parameters were varied, intending to achieve a variation of surface properties. Maintaining layer thickness, hatch distance and laser power, the scan speed was modified between 300 mm/s and 1800 mm/s, paired with the settings with and without additional pre-sinter at 50% laser power, resulting in a total of 10 manufacturing parameter combinations.
The samples with identical parameter combinations were named with a designated letter according to
Table 4, with consecutive numbering; e.g., A1 → Contour parameter set A (scan speed 300 mm/s, with pre-sinter), mechanical testing sample No. 1.
2.2. Characterization and Testing
2.2.1. Surface Texture
The surfaces were measured using a Keyence VR3200 fringe projection system. The micro camera setting at a magnification of 40× was applied, resulting in a lateral resolution of 7.4 µm. For the cuboid samples, selected ISO 25178 areal parameters were evaluated for a square area with an 8 mm length, measured perpendicular to the build direction on the side facing away from the coater, as indicated in
Figure 1. A linear level operation, an S-filter of 20 µm and an L-filter of 0.25 mm were applied.
The chosen areal surface texture parameters to assess surface quality are
, the arithmetic mean height, and
, the core height from the material ratio curve.
was selected due to its common use in research and industry [
57].
is used because it gives more distinctive information on the surface texture (for details, refer to [
58], p. 56).
The surface fatigue relation is shown using the material ratio curve parameter
, which is the reduced valley depth. The parameter was chosen because it describes the size of the valley population on the considered surface, rather than individual extreme values such as the maximum height
and the maximum valley depth
. More details can be found in [
52].
,
and
are defined in the ISO 25178-2 standard [
59].
2.2.2. Density
The first step toward the assessment of bulk quality was the measurement of part density. For this purpose, the cuboid samples were weighed in air and ethanol using the Mettler Toledo Delta Range XS603S precision balance. The density was calculated according to Archimedes’ principle as specified in ISO 3369 [
60]. Each measurement was performed three times, and the final density result reported per sample is the respective mean value.
2.2.3. Tensile Testing
The tensile strength was tested using a ZWICK/Z050 in accordance with ASTM E8M [
61]. A preloading of 35 N and a speed setting of 0.48 mm/min were selected.
The required cross-sectional areas of the tested specimens were obtained from digital caliper measurements.
2.2.4. Fatigue Testing
Fatigue life was tested on a DYNA-MESS 4S 20kN Z/D system at a frequency of 20 Hz and a stress ratio
. The load levels were defined with respect to the mean value of the UTS for the tested surface conditions,
MPa. Corresponding values are specified in
Table 5.
2.3. Workflow Summary
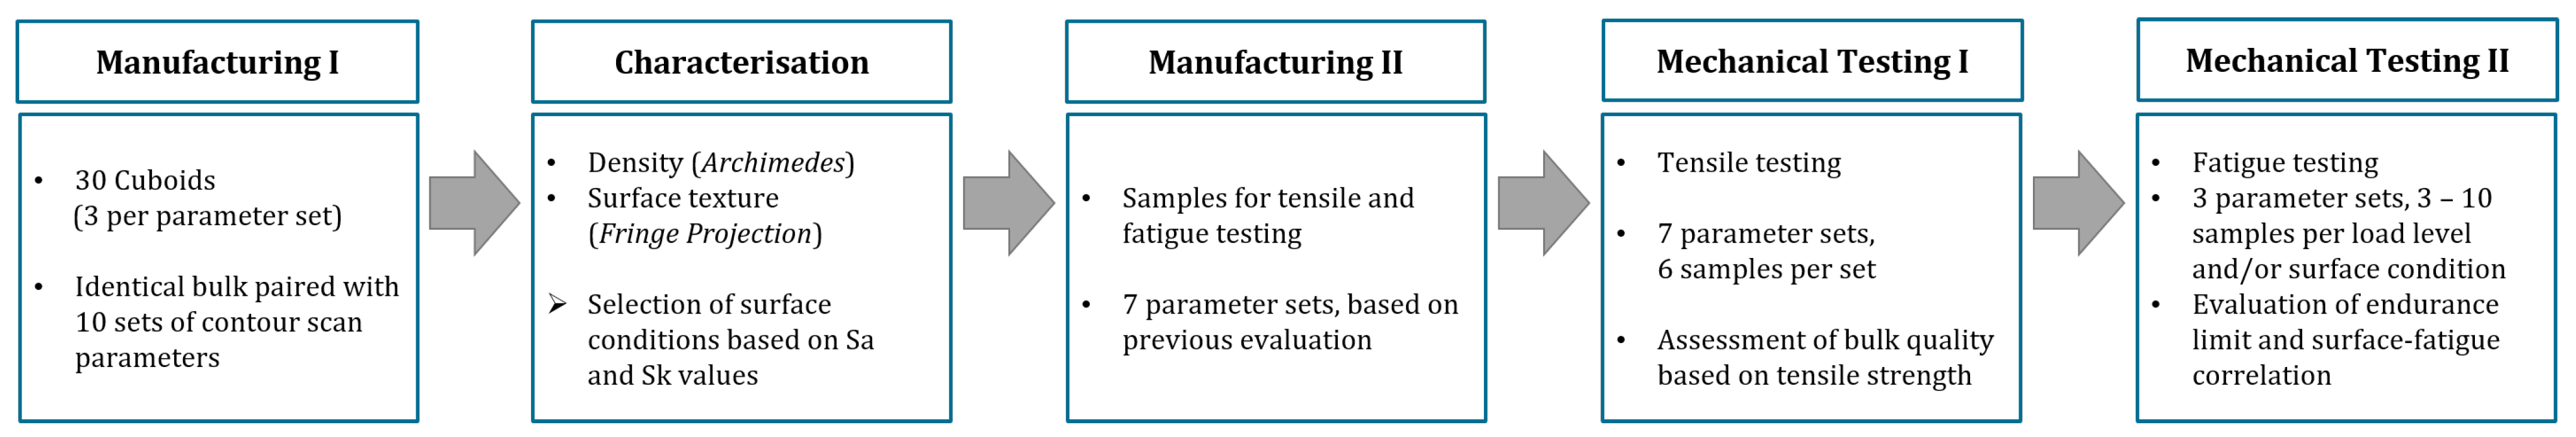
Figure 3 gives an overview of this work’s process steps.
At the first manufacturing stage, 30 cuboid samples were made. All of these were manufactured with identical bulk scan parameters, paired with 10 variations of contour scan parameters, resulting in 3 cuboid samples per parameter set combination.
Afterwards, the cuboids’ densities and surfaces were measured in order to get a first assessment of bulk quality and a rating based on the surface quality. Based on these evaluations, parameter sets were selected to produce samples for mechanical testing.
For seven manufacturing parameter sets chosen based on the cuboid assessment, six samples each were made for tensile testing. Tensile testing according ASTM E8M [
61] was performed.
Finally, fatigue life was tested for a first selection of contour parameter sets, and their relationship with surface texture is discussed.
3. Results and Discussion of Preliminary Findings
The results presented in this section comprise density and surface texture characterization of the cuboid samples. The outcome is a selection of contour scan parameter sets for manufacturing the specimens for mechanical testing.
3.1. Surface Texture
3.1.1. Visual Perception of Surface Quality
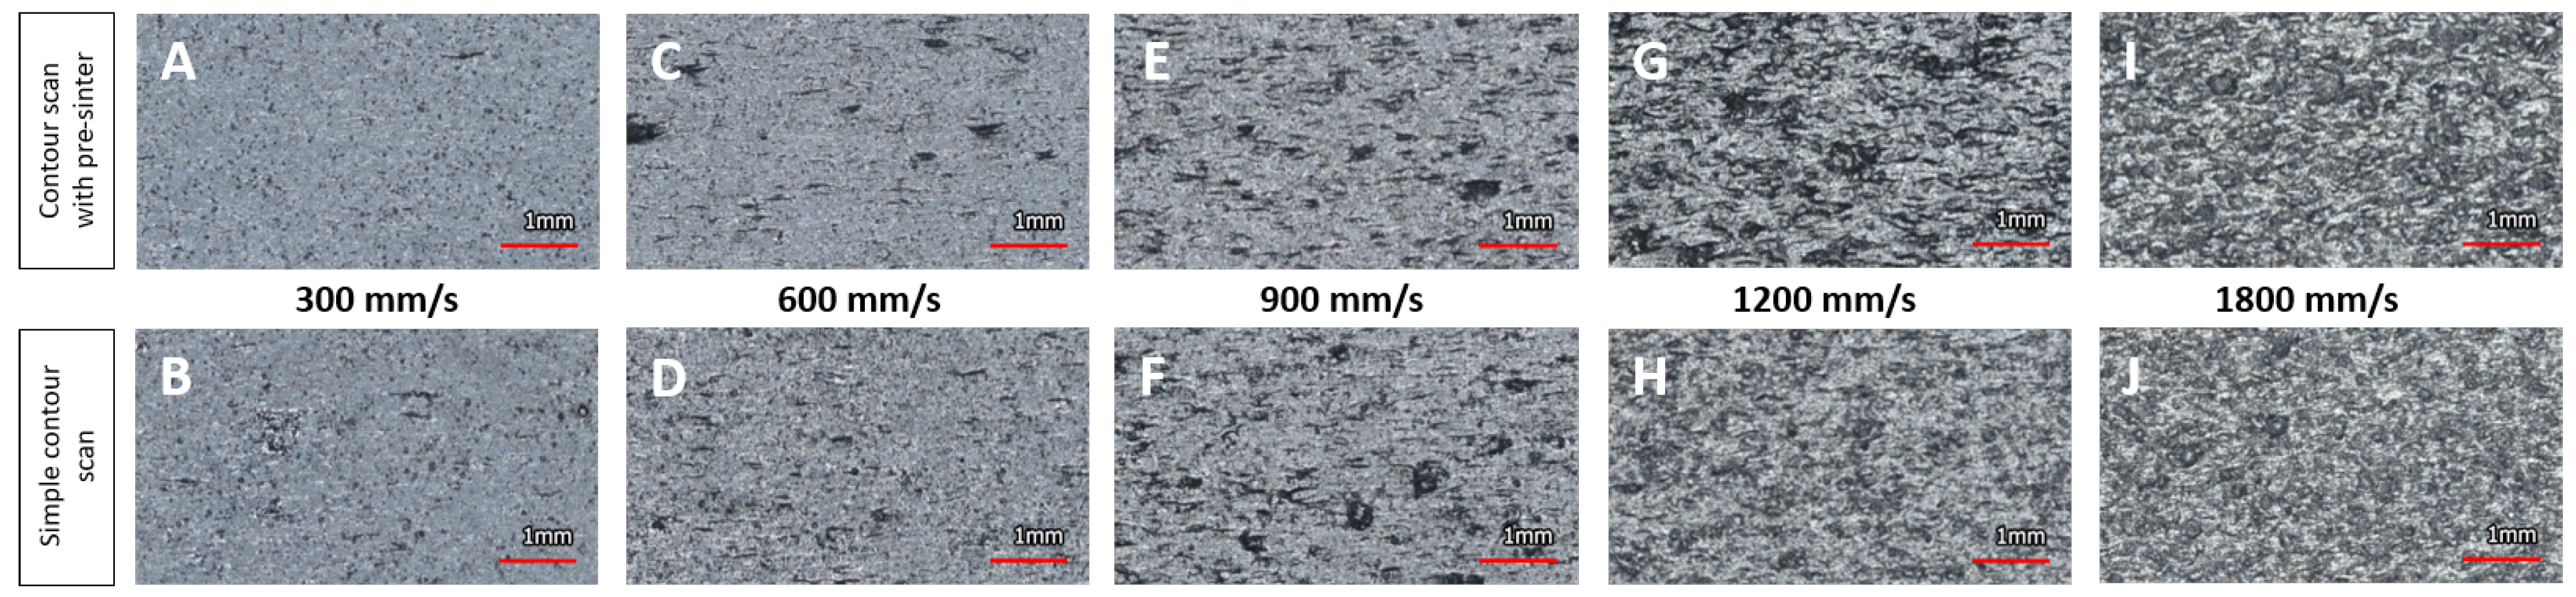
From visual inspection of the microscopic images in
Figure 4, it can be observed that, at first sight, a variety of as-built surface conditions was achieved.
The A and B conditions look mostly smooth with small dots and few linear defects (length below 1 mm, oriented parallel to the layers). Increasing the contour scan speed, surfaces appear to have more and bulkier linear defects (C and D). The D image also seems a little blurry, which is a sign of increasing height variation on the surface. This effect becomes more clear when increasing scan speed even further (E and F). On surface F, there are a few circular shadows present, which may be spatter or local accumulations of powder particles. Surfaces G to J are hardly distinguishable visually. All show circular shadows of different sizes, which are mostly particle agglomerations and accumulations, and an underlying irregular structure. Surface G shows some darker areas, which may be an issue of different lighting conditions or height differences on the surface itself.
With increasing scan speed, the energy absorbed by the powder in the scanned path decreases. Due to the low energy, powder particles are only partially molten and attached to the surface, causing coarse surface quality.
3.1.2. Selection of Contour Variation for Mechanical Testing from Surface Texture
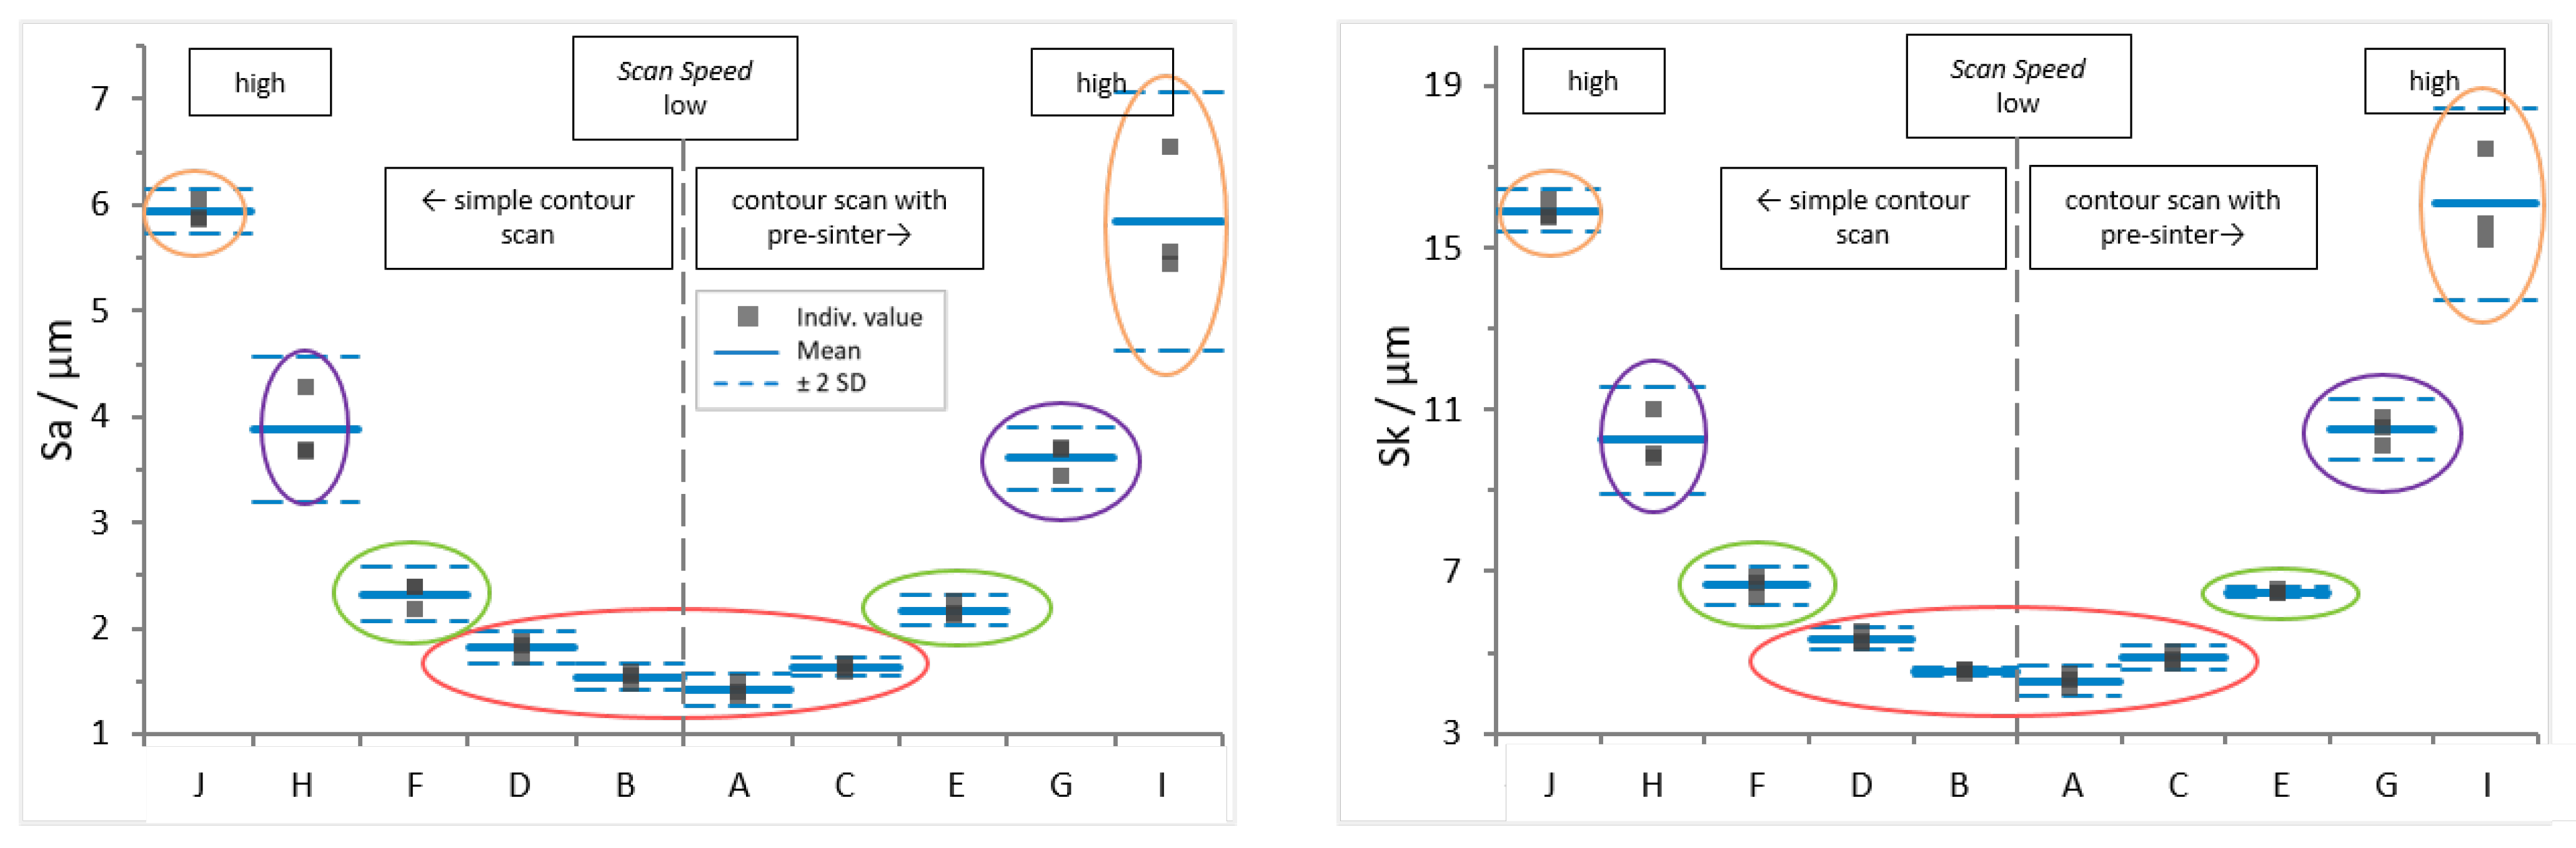
Figure 5 shows
(left) and
(right) values. The surface conditions are sorted by contour scan parameters. To the right, results for sample sets exposed to pre-sinter are presented, while to the left of each graph, results for simple contour scans are shown. The scan speed increases from the middle to the edge.
The graphs give the mean (blue line) ± two standard deviations (SD, dashed blue line). Colors mark the surface conditions that are distinctive per a 95% confidence interval (±2SD) applied to the parameter results for and . The first group (red) includes surface conditions A to D; conditions E and F form the second group (green); conditions G and H (purple) are the third group; and finally, the fourth group (orange) comprises conditions I and J.
A superficial look at the graphs presented in
Figure 5 already confirms that the objective of creating surfaces with varying surface quality was met. This is also supported by the microscopic images in
Figure 4. Numerical values are included in
Table A1.
Based on the graphs, parameter sets to produce specimens for mechanical testing were selected.
From the smooth (red) group including surface conditions A to D, A was chosen as the set with the lowest mean values for
and
. C and D were selected to compare the possible impact of pre-sinter with otherwise identical process settings (see
Table 4). G and H from the purple group are both considered for the same reason as conditions with higher parameter values.
Conditions E and F (green group) show comparable mean values for and , and it was decided to use set E, as it was the original starting parameter set of the contour variation study, and to discard condition F.
Parameter set J is chosen as the set with the highest mean value for . Condition I, as the second coarse texture set (orange group), has a larger SD for both considered surface texture parameters and was discarded.
In summary, the following contour parameter sets are applied to produce the specimens for mechanical testing:
Smooth surface parameter sets A, C and D (red group),
Original parameter set E (green group),
Coarse (purple group) and very coarse (orange group) parameter sets G, H and J.
3.2. Density
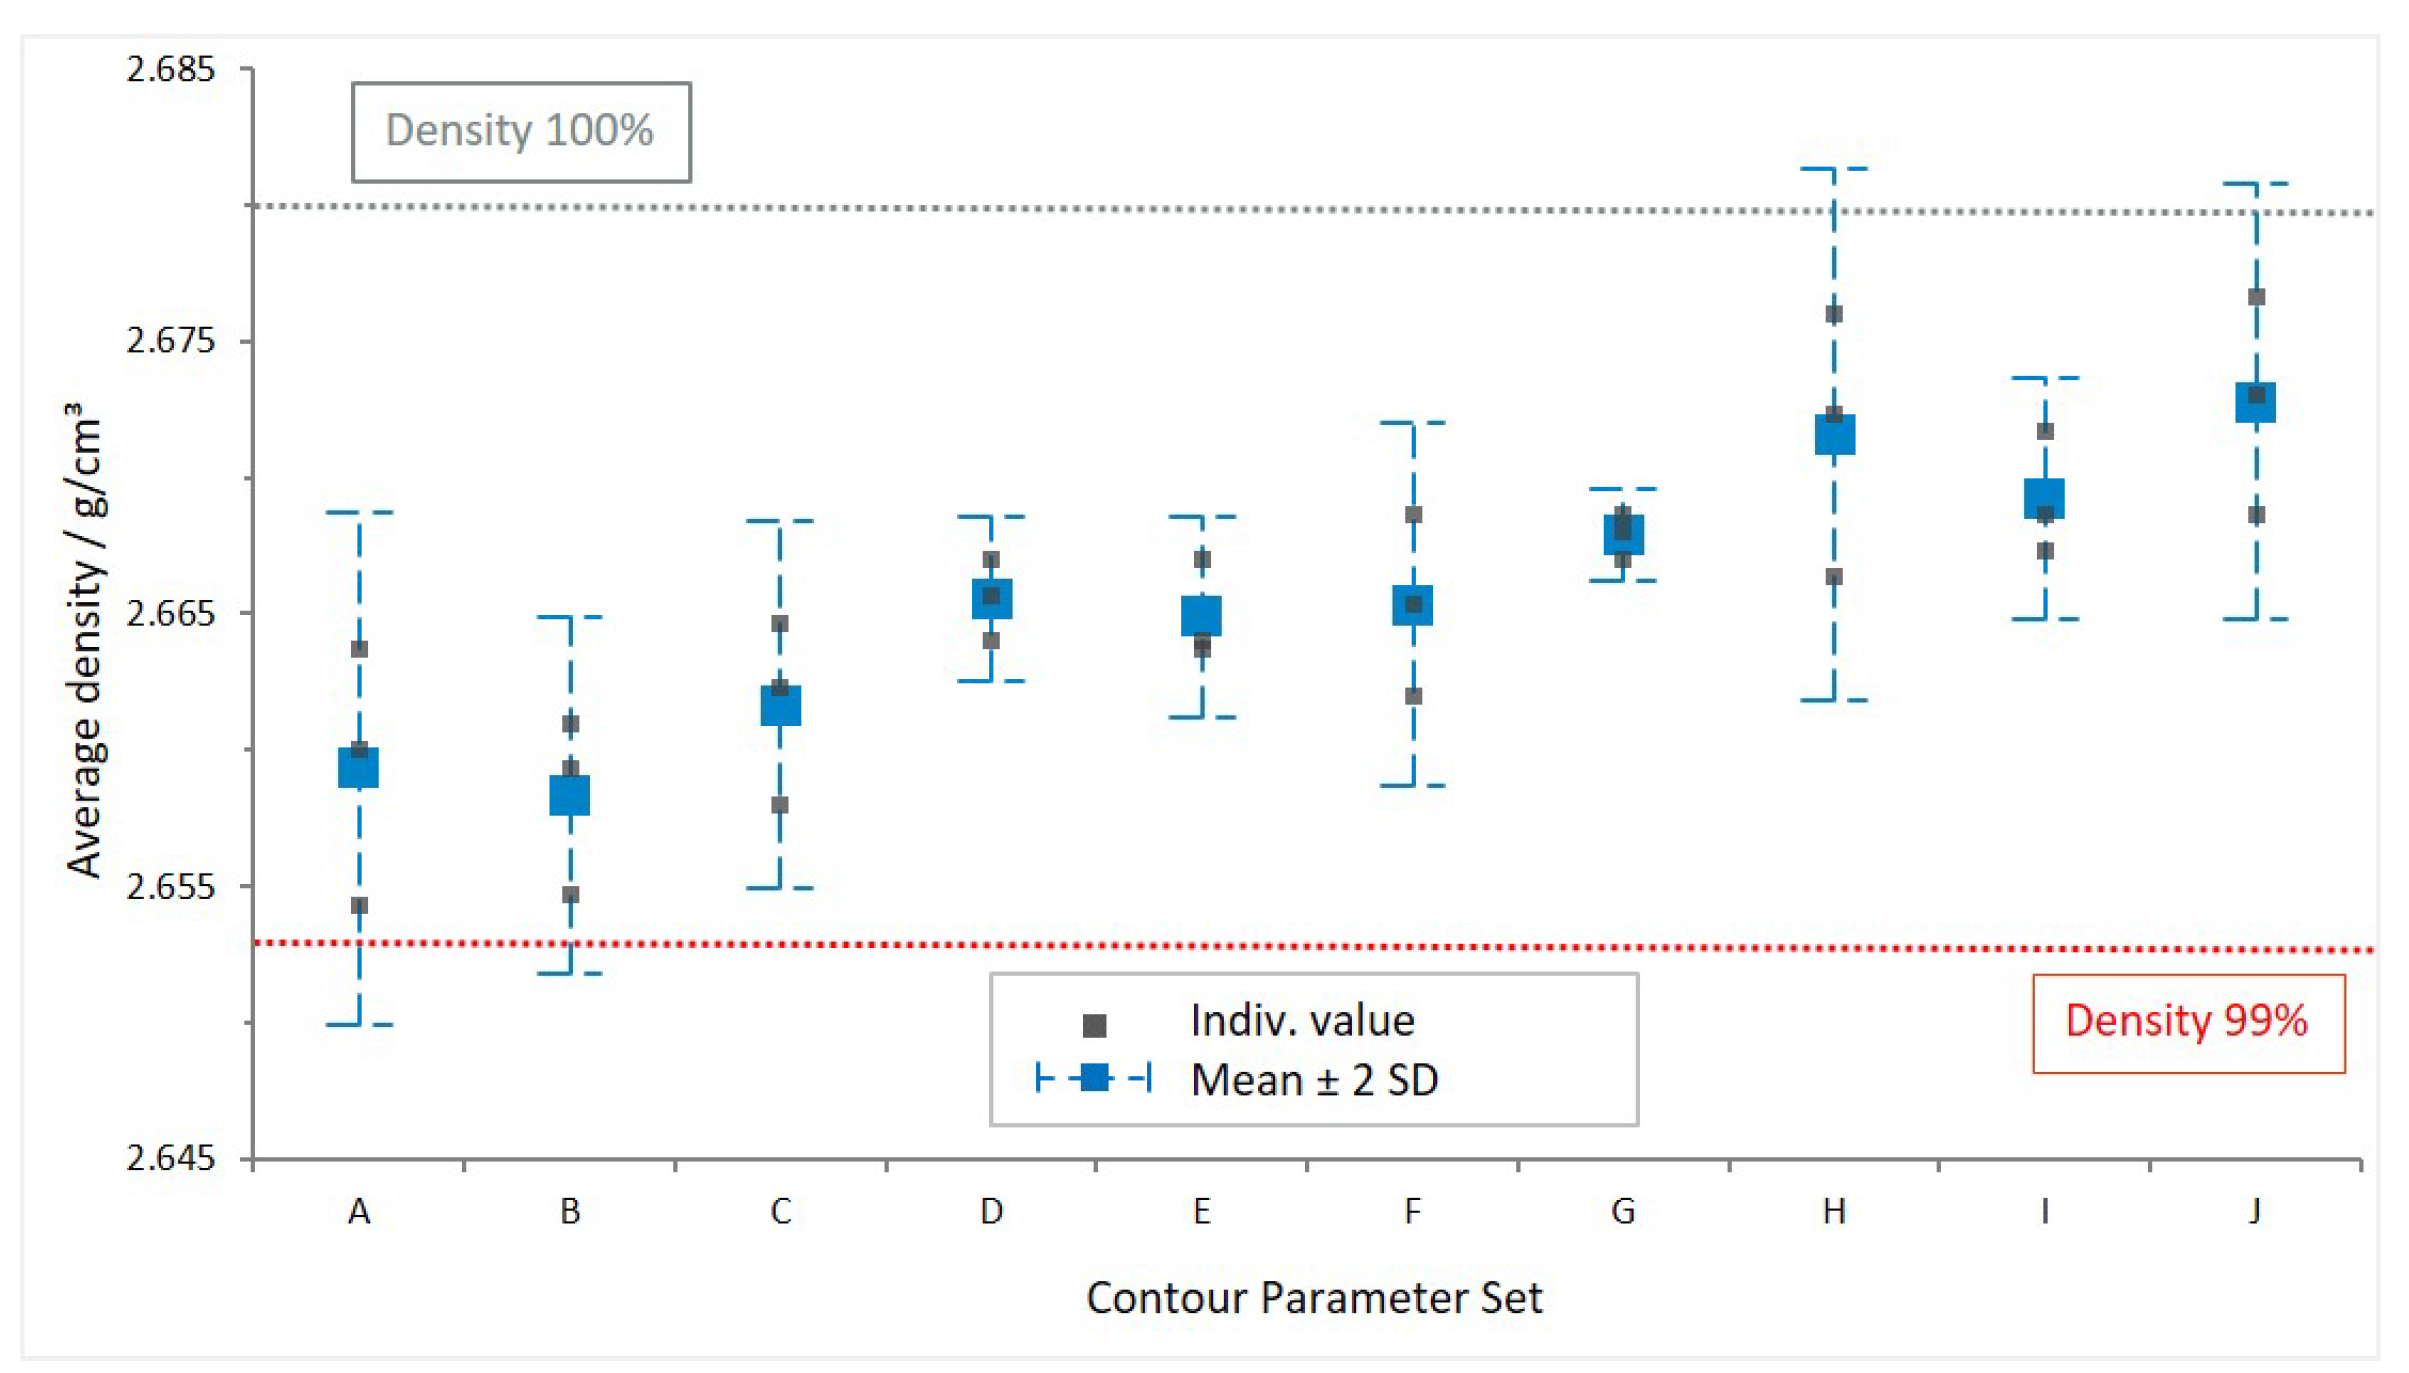
The data shown in
Figure 6 confirm a density of over 99% for all of the measured samples, denoted by the grey squares in the graph, with a reference density of 2.68 g/cm
3 (theoretical maximum).
When taking a 95% confidence interval (2SD), denoted by the dashed blue whiskers, into account, data sets A and B are below that 99% value. Data set A has a lower boundary value at 98.84%, which is also the lowest overall value.
From all data sets, the only statistically distinctive sets considering the depicted 95% confidence interval (2SD) are B and G. However, they cannot be distinguished from the remaining data sets by that requirement.
In
Figure 6, an increasing tendency of density for higher scan speed (A—lowest scan speed to J—highest scan speed) is observed. Supposedly, this is caused by the occurrence of closed porosities that can not be filled with ethanol during weighing. Possibly, the close proximity of the cuboids on the build platform during production plays a role as well, as the trend cannot be observed in the density data of the mechanical testing samples included in
Table A2.
However, the overall mean and %SD including all 90 measured values (3 samples each for 10 contour parameter sets, 3 measurements each) are 99.5% and 0.3%, respectively. The mean and %SD taking individual groups A to J into account amount to 99.5% and 0.17%, respectively.
In conclusion, the evaluated sample sets are considered comparable. It is found from the presented results that the bulk scan parameters predominantly define the part density. Thus, varying contour scan parameters has no statistically significant influence on the density.
4. Results and Discussion of Mechanical Characterization
4.1. Tensile Properties
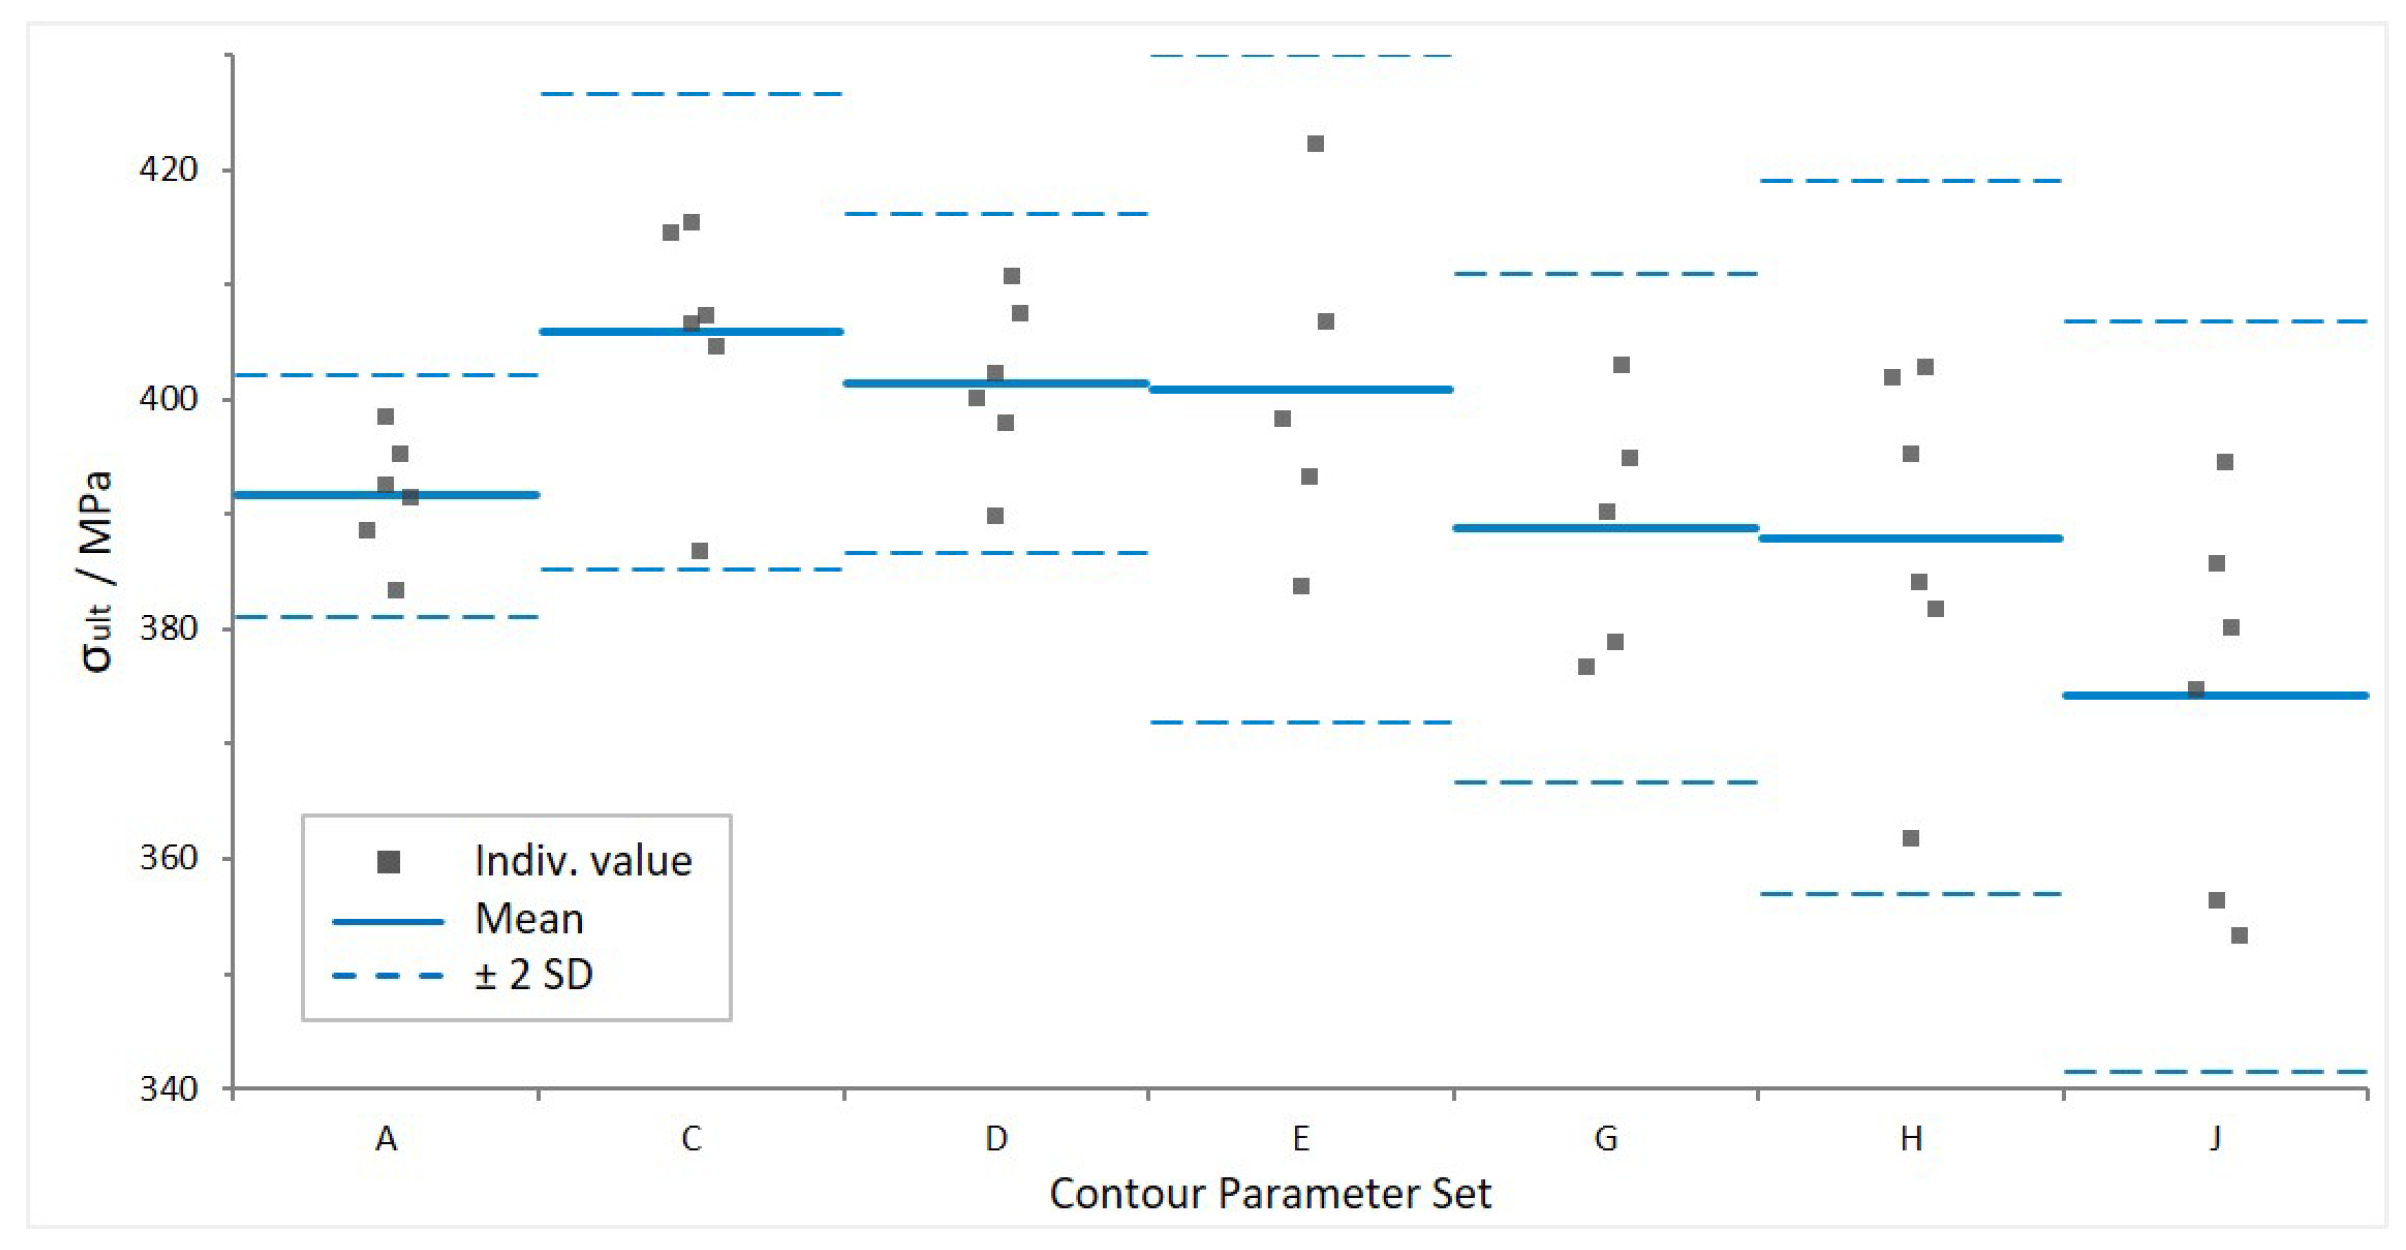
Figure 7 shows the tensile testing results for longitudinal specimens manufactured using the contour parameter sets A, C, D, E, G, H and J. Density values for the mechanical testing samples, along with all numerical data presented in
Figure 7, are included in
Appendix A.
Similar to the results from density determination, there is no statistically significant difference in UTS. The mean values of the individual surface conditions are between 374 and 406 MPa. For context, values reported in the literature for as-built of the same material and build direction vary from 300 MPa [
49] to over 400 MPa [
30,
39,
40]. For the cast alloy with T6 heat treatment, typically values of UTS between 320 and 360 MPa are reported [
30]. Hence, the tested samples perform equally well or better than other as-built LPBF AlSi7Mg0.6 specimens and mostly exceed the strength of the cast material.
From the graph, it can be observed that the standard deviation increases for rougher surface textures. A possible influencing factor is the caliper cross-section measurement, since the UTS depends on the cross-sectional area. The caliper may be locked by protruding features, leading to variation in measured cross-section.
Moreover, the combination of line energy and powder application is a potential explanation. Poor flowability properties affect the homogeneity of powder dispersion within a layer. At higher contour scan speeds, the high reflectivity and fast heat dissipation may lead to irregular density of molten material, causing coarser surface texture and different microstructural properties. The latter will have to be confirmed by a microstructural analysis.
The overall SD of UTS values, including all 40 test results, is low—3.8% (14.94 MPa). The SD within each group (1.3% to 4.4%) is of the same order of magnitude as the SD between the groups (2.5% between mean values). Hence, the sample groups produced with different contour scan parameters are considered comparable with regard to tensile strength.
4.2. Fatigue Properties
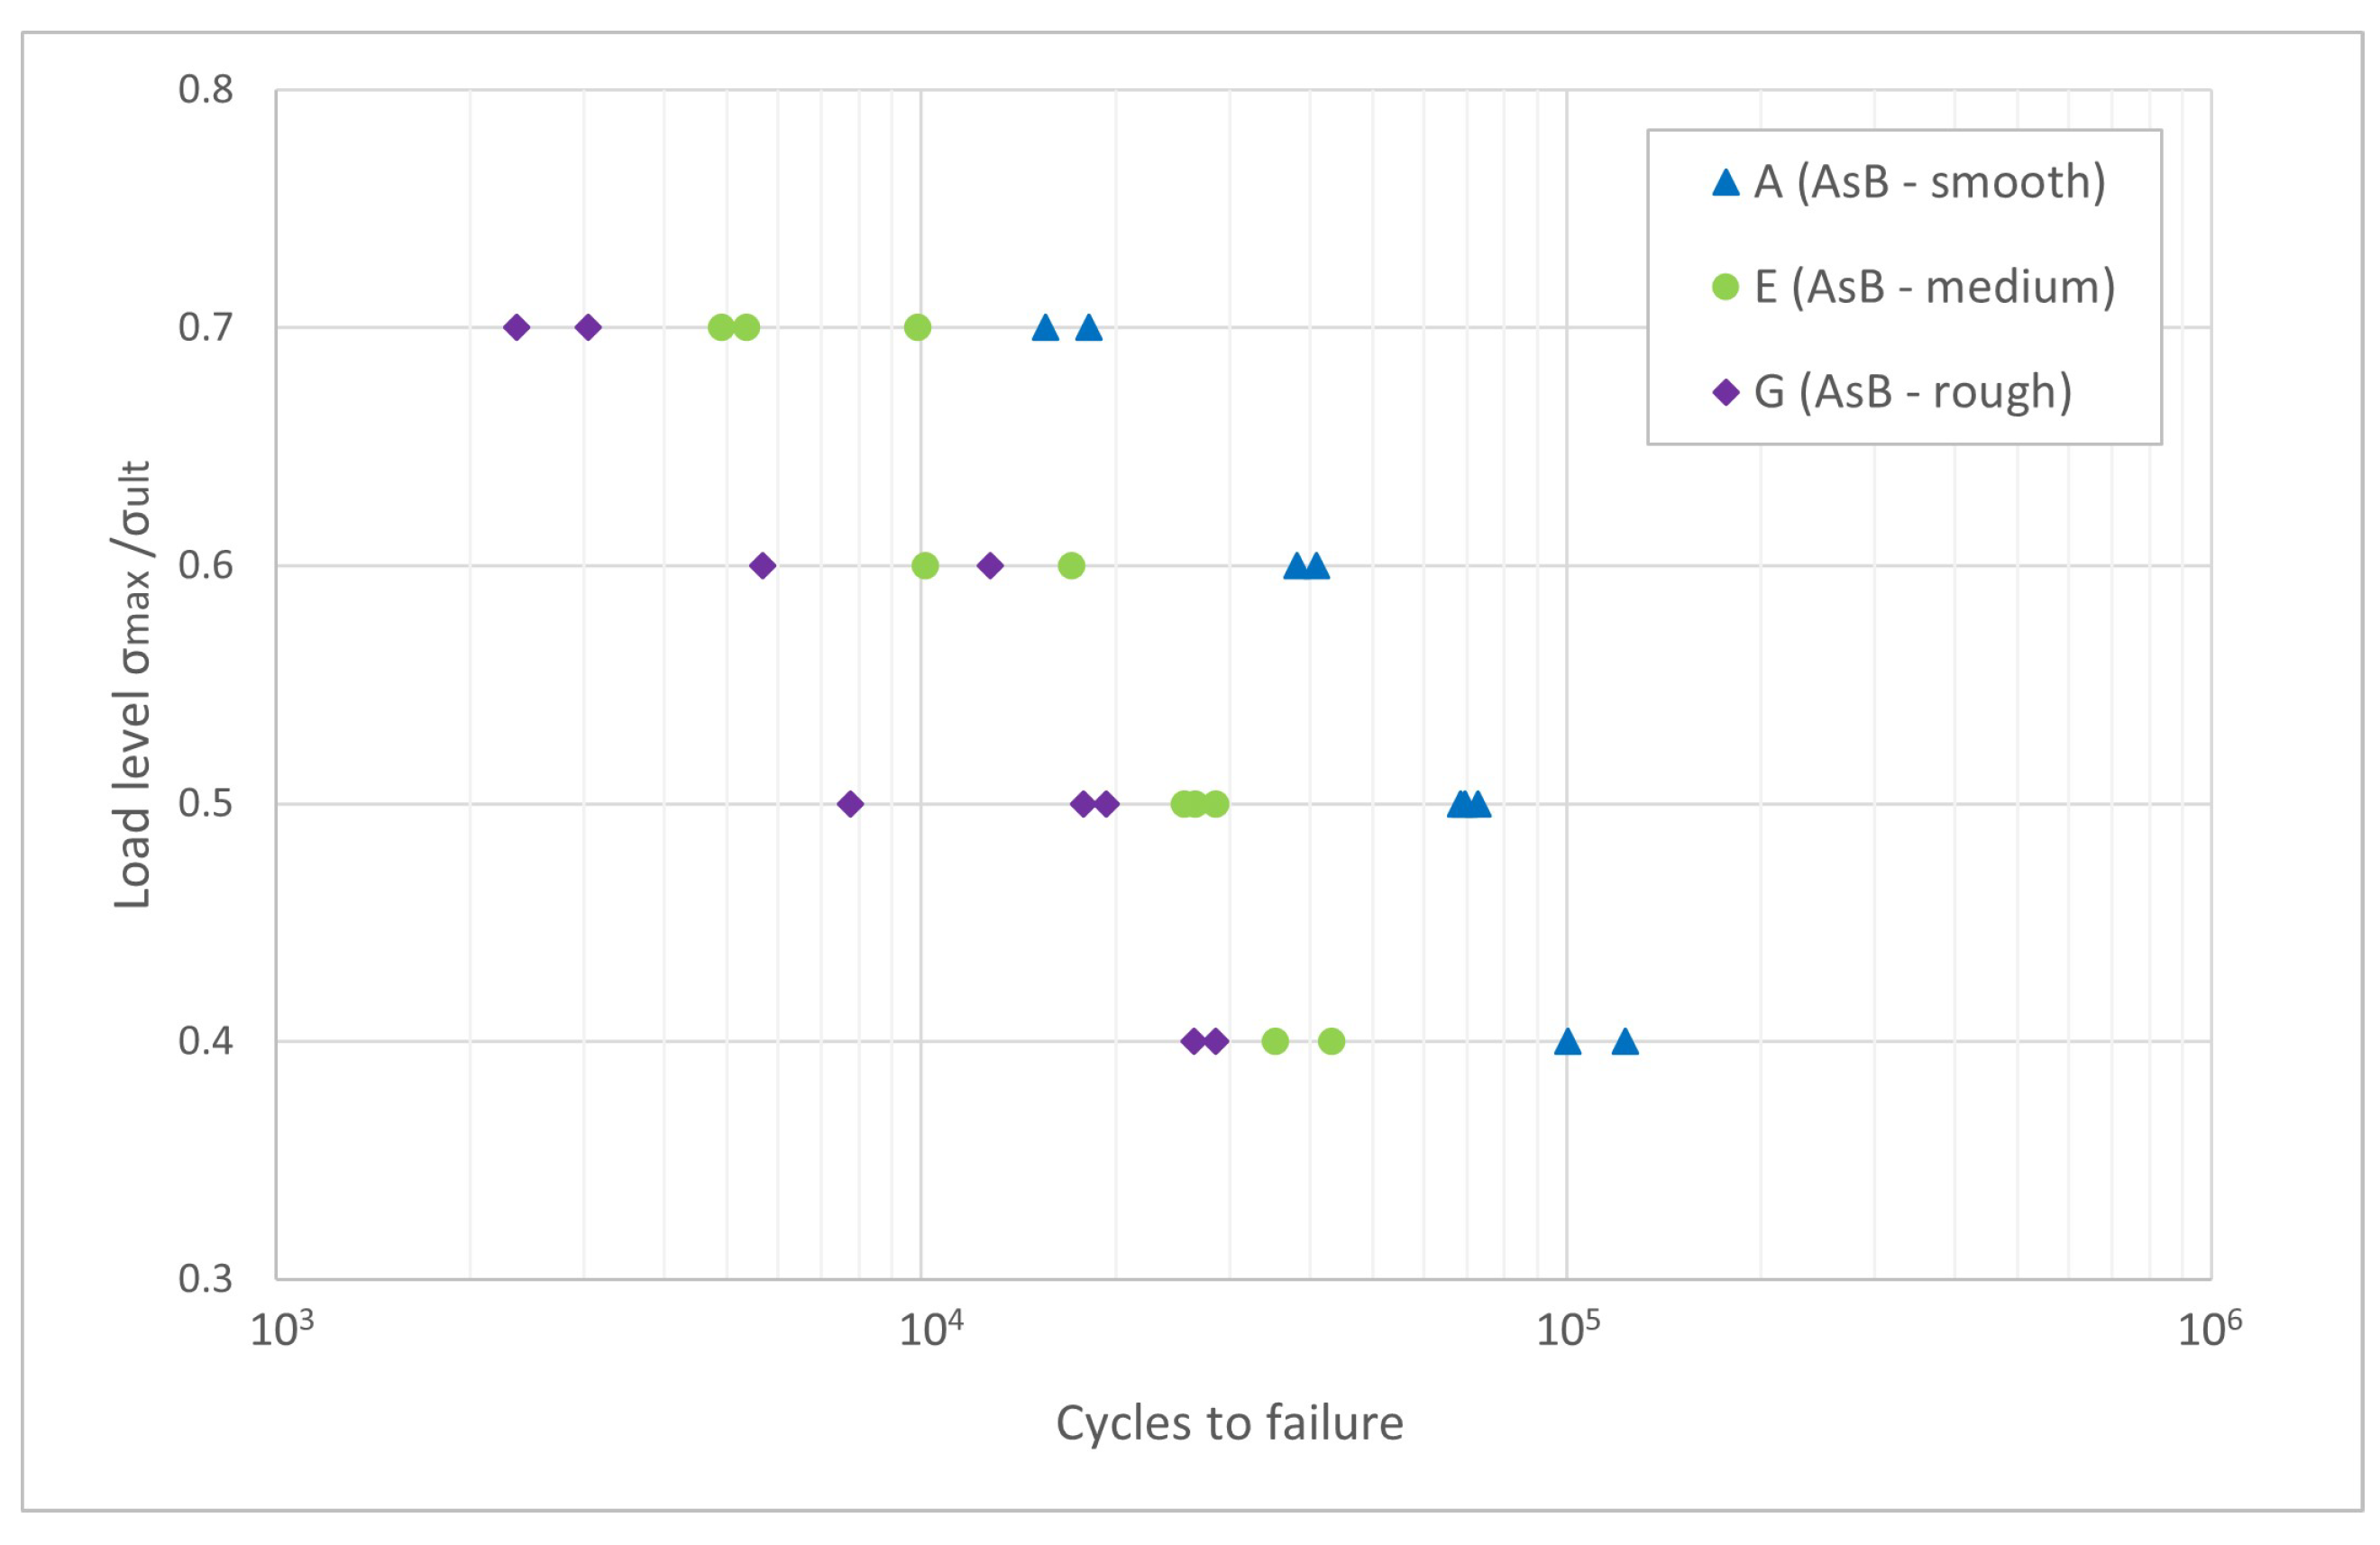
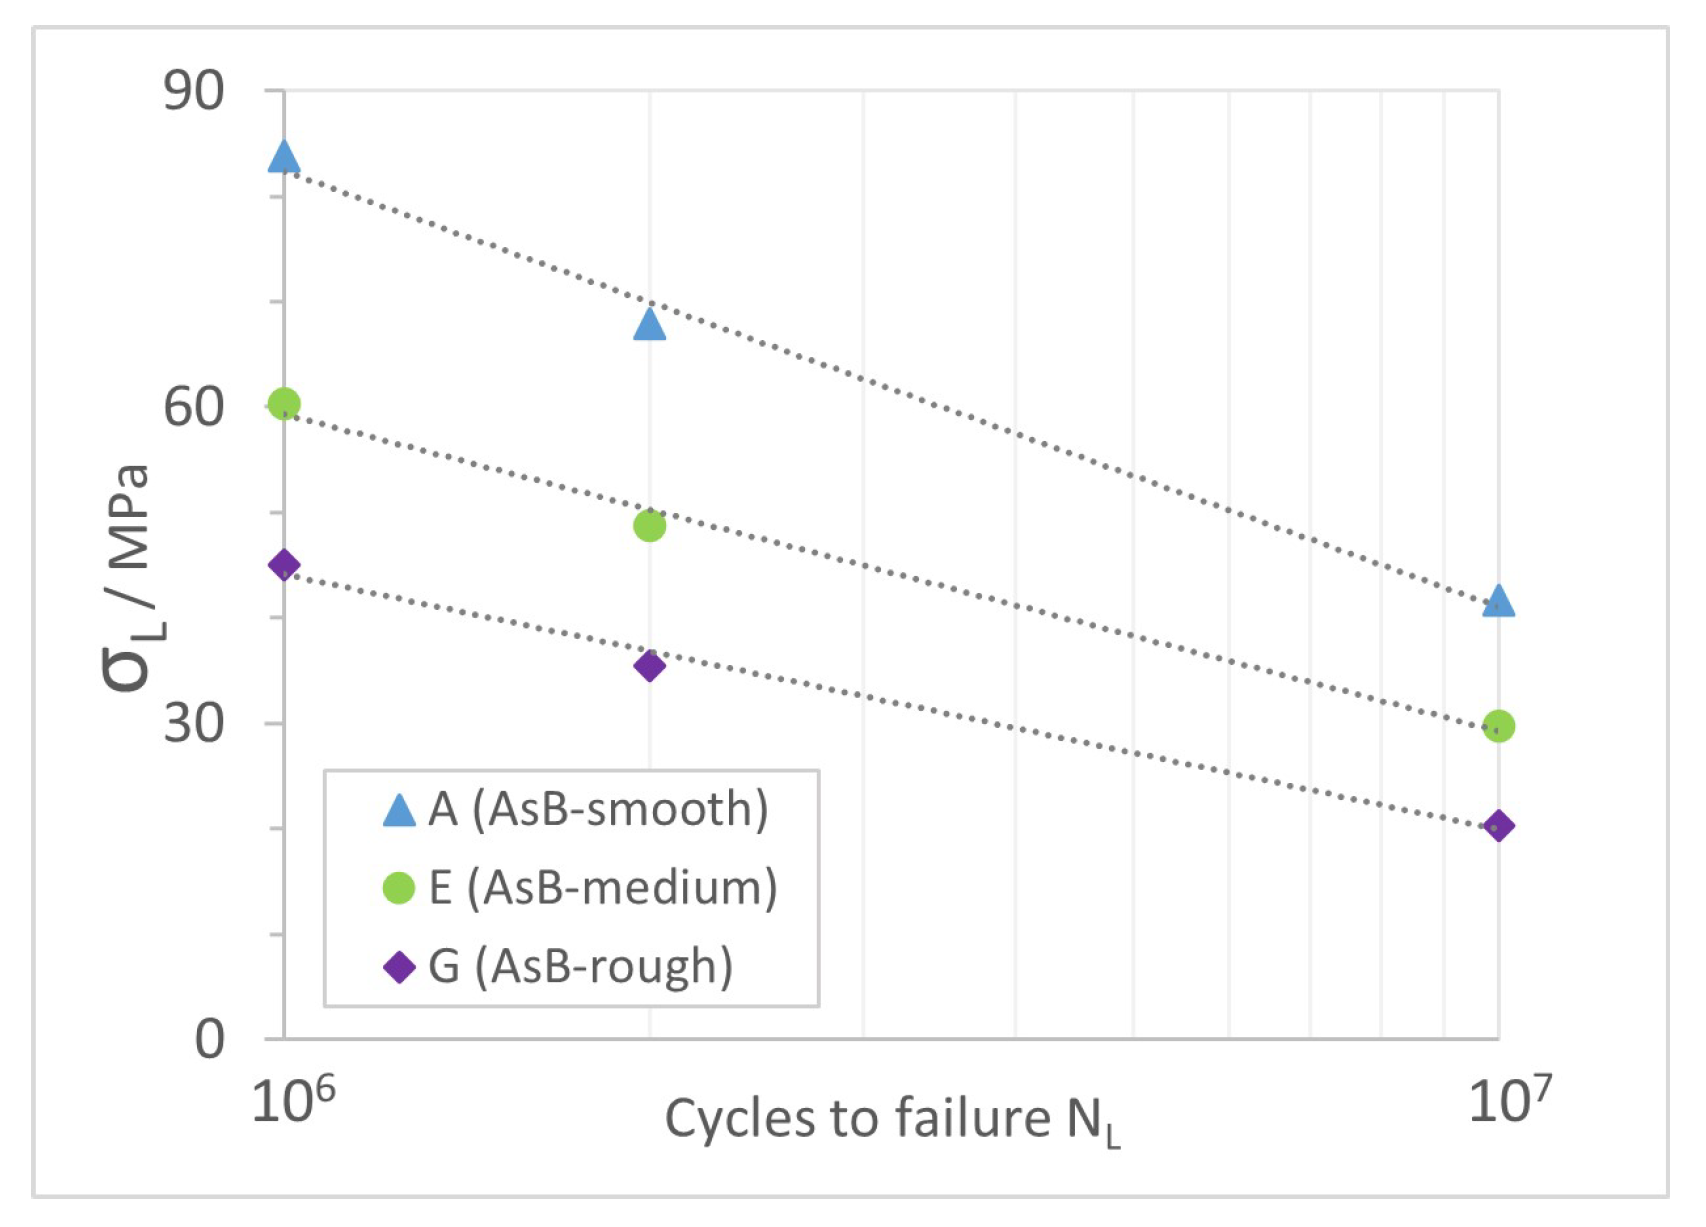
The fatigue testing results for surface conditions A, E and G for load levels
0.4, 0.5, 0.6 and 0.7 are presented in
Figure 8. The smoothest surface condition, A, has the best fatigue performance for all load levels and low scatter, as expected. Even for the highest tested load level, cycle numbers above
are reached. Surface condition E exhibits some scattering for higher load levels, while condition G already shows scatter for load level 0.5
. A clear tendency towards higher fatigue resistance for smoother surfaces is visible. The same is reported in surface fatigue studies that include post-processing [
7,
10,
15,
43,
45,
54]. A possible explanation for the scatter on E and G is that, for these sample groups, the non-linear low cycle regime is reached. On a Wöhler curve, the logarithmic-linear relationship between stress and number of cycles is only valid in the high cycle fatigue regime [
62]. Another reason may be the coarser surface texture caused by lower line energy and the possibly uneven powder distribution, as previously mentioned in
Section 3.1 and
Section 4.1.
The data in
Figure 8 were previously published in [
52], where the following sample naming was used: A—AsB-smooth, E—AsB-medium and G—AsB-rough. In [
52], more detailed evaluations of surface texture and crack initiation are shown.
4.2.1. Comparison with As-Built Surface Data from the Literature
To allow for comparison with surface quality data from the literature [
39,
46,
51],
Table 6 contains surface texture parameters generated with the respective cut-off values for one sample per surface condition.
was determined from a 12 mm line profile, as indicated by Cacace et al. [
46].
and
were calculated from a 3 mm × 20 mm measured area. For measurement details, refer to [
52]. A cut-off L-Filter of 0.8 mm was applied, as applied by Nasab et al. [
51]. Please note that, deviating from Nasab et al., a least squares plane F-operation was used. The difference in F-operation is due to the sample geometries. This study assessed a flat sample geometry, while Nasab et al. evaluated cylindrical specimens.
Similarly to this paper, Nasab et al. [
51] also used different as-built surfaces. However, taking a closer look at their considered surface conditions denoted S01, S05 and S07, they report larger
-values. Their best surface condition is S01 with
µm, having the order of magnitude of the roughest surface considered in this study, G (AsB-rough). S05 with
µm and S07 with
µm largely exceed the values presented in
Table 6. In their work, they induced defects to demonstrate their influence on rotating bending fatigue. They suggested a minimum material removal based on surface texture parameter results to improve surface quality. In contrast, this work was aimed at producing high-quality surfaces (described by
and
) in as-built condition with no intention of surface post-processing.
Additionally, the samples investigated in this work have a smoother surface finish (see
Table 6) in comparison with Cacace et al., who state an as-built
µm. They sandblasted the samples to achieve an
µm, as required for standard fatigue testing. The same holds for Grande et al., who reported an as-built
µm with
µm [
39,
46].
4.2.2. Estimation of Stress at the Endurance Limit
The stress at the endurance limit was estimated based on the horizon method, using the logarithmic-linear equation
as described by Einbock [
62]. For the sample groups A, E and G, the mean values for each load level were used to obtain their respective logarithmic-linear relations. The coefficients per surface condition are given in
Table 7. For condition G, data points for load level 0.7 were in the LCF range with
. They are most likely not on the linear part of the S–N curve and were therefore excluded from this calculation.
From this equation, the stress at endurance limit
was calculated for
,
and
and is presented in
Table 8 and
Figure 9.
to
were chosen to allow for comparison with literature values [
39,
43,
45,
46,
49,
63].
MPa for surface condition E corresponds well with the experimental findings of Denti and Sola [
43] and Gatto et al. [
45], who report mean values of 50 MPa for as-built specimens. Bassoli et al. [
49] found a slightly higher
of 60 MPa, which is in between groups A and E. However, as they did not evaluate surface quality, no direct comparison is possible.
Cacace et al. and Grande et al. [
39,
46] found experimental endurance limit stress values at
between 122 and 137 MPa for different positions on the build platform, being three times as high as found for A, the best performing condition studied here. As previously mentioned, they applied a sandblasting finish to meet the requirement for fatigue testing. Not only did this improve the surface finish, it also introduced compressive residual stresses, which prevent crack propagation [
43,
50].
Compared to the post-processed surface conditions presented by Denti and Sola [
43] and Gatto et al. [
45], the A condition’s endurance stress matches the performance of laser shot processed and metal shot peened (S70) specimens.
Considering conventionally manufactured parts, Dezecot and Brochu estimated a fatigue strength of 73 MPa for as-cast AlSi7Mg0.6 material from investment casting [
63] at
. Surface condition A exceeds this value by 15%. This increased strength is supposedly related to the fine microstructure due to faster solidification of the material in the LPBF process.
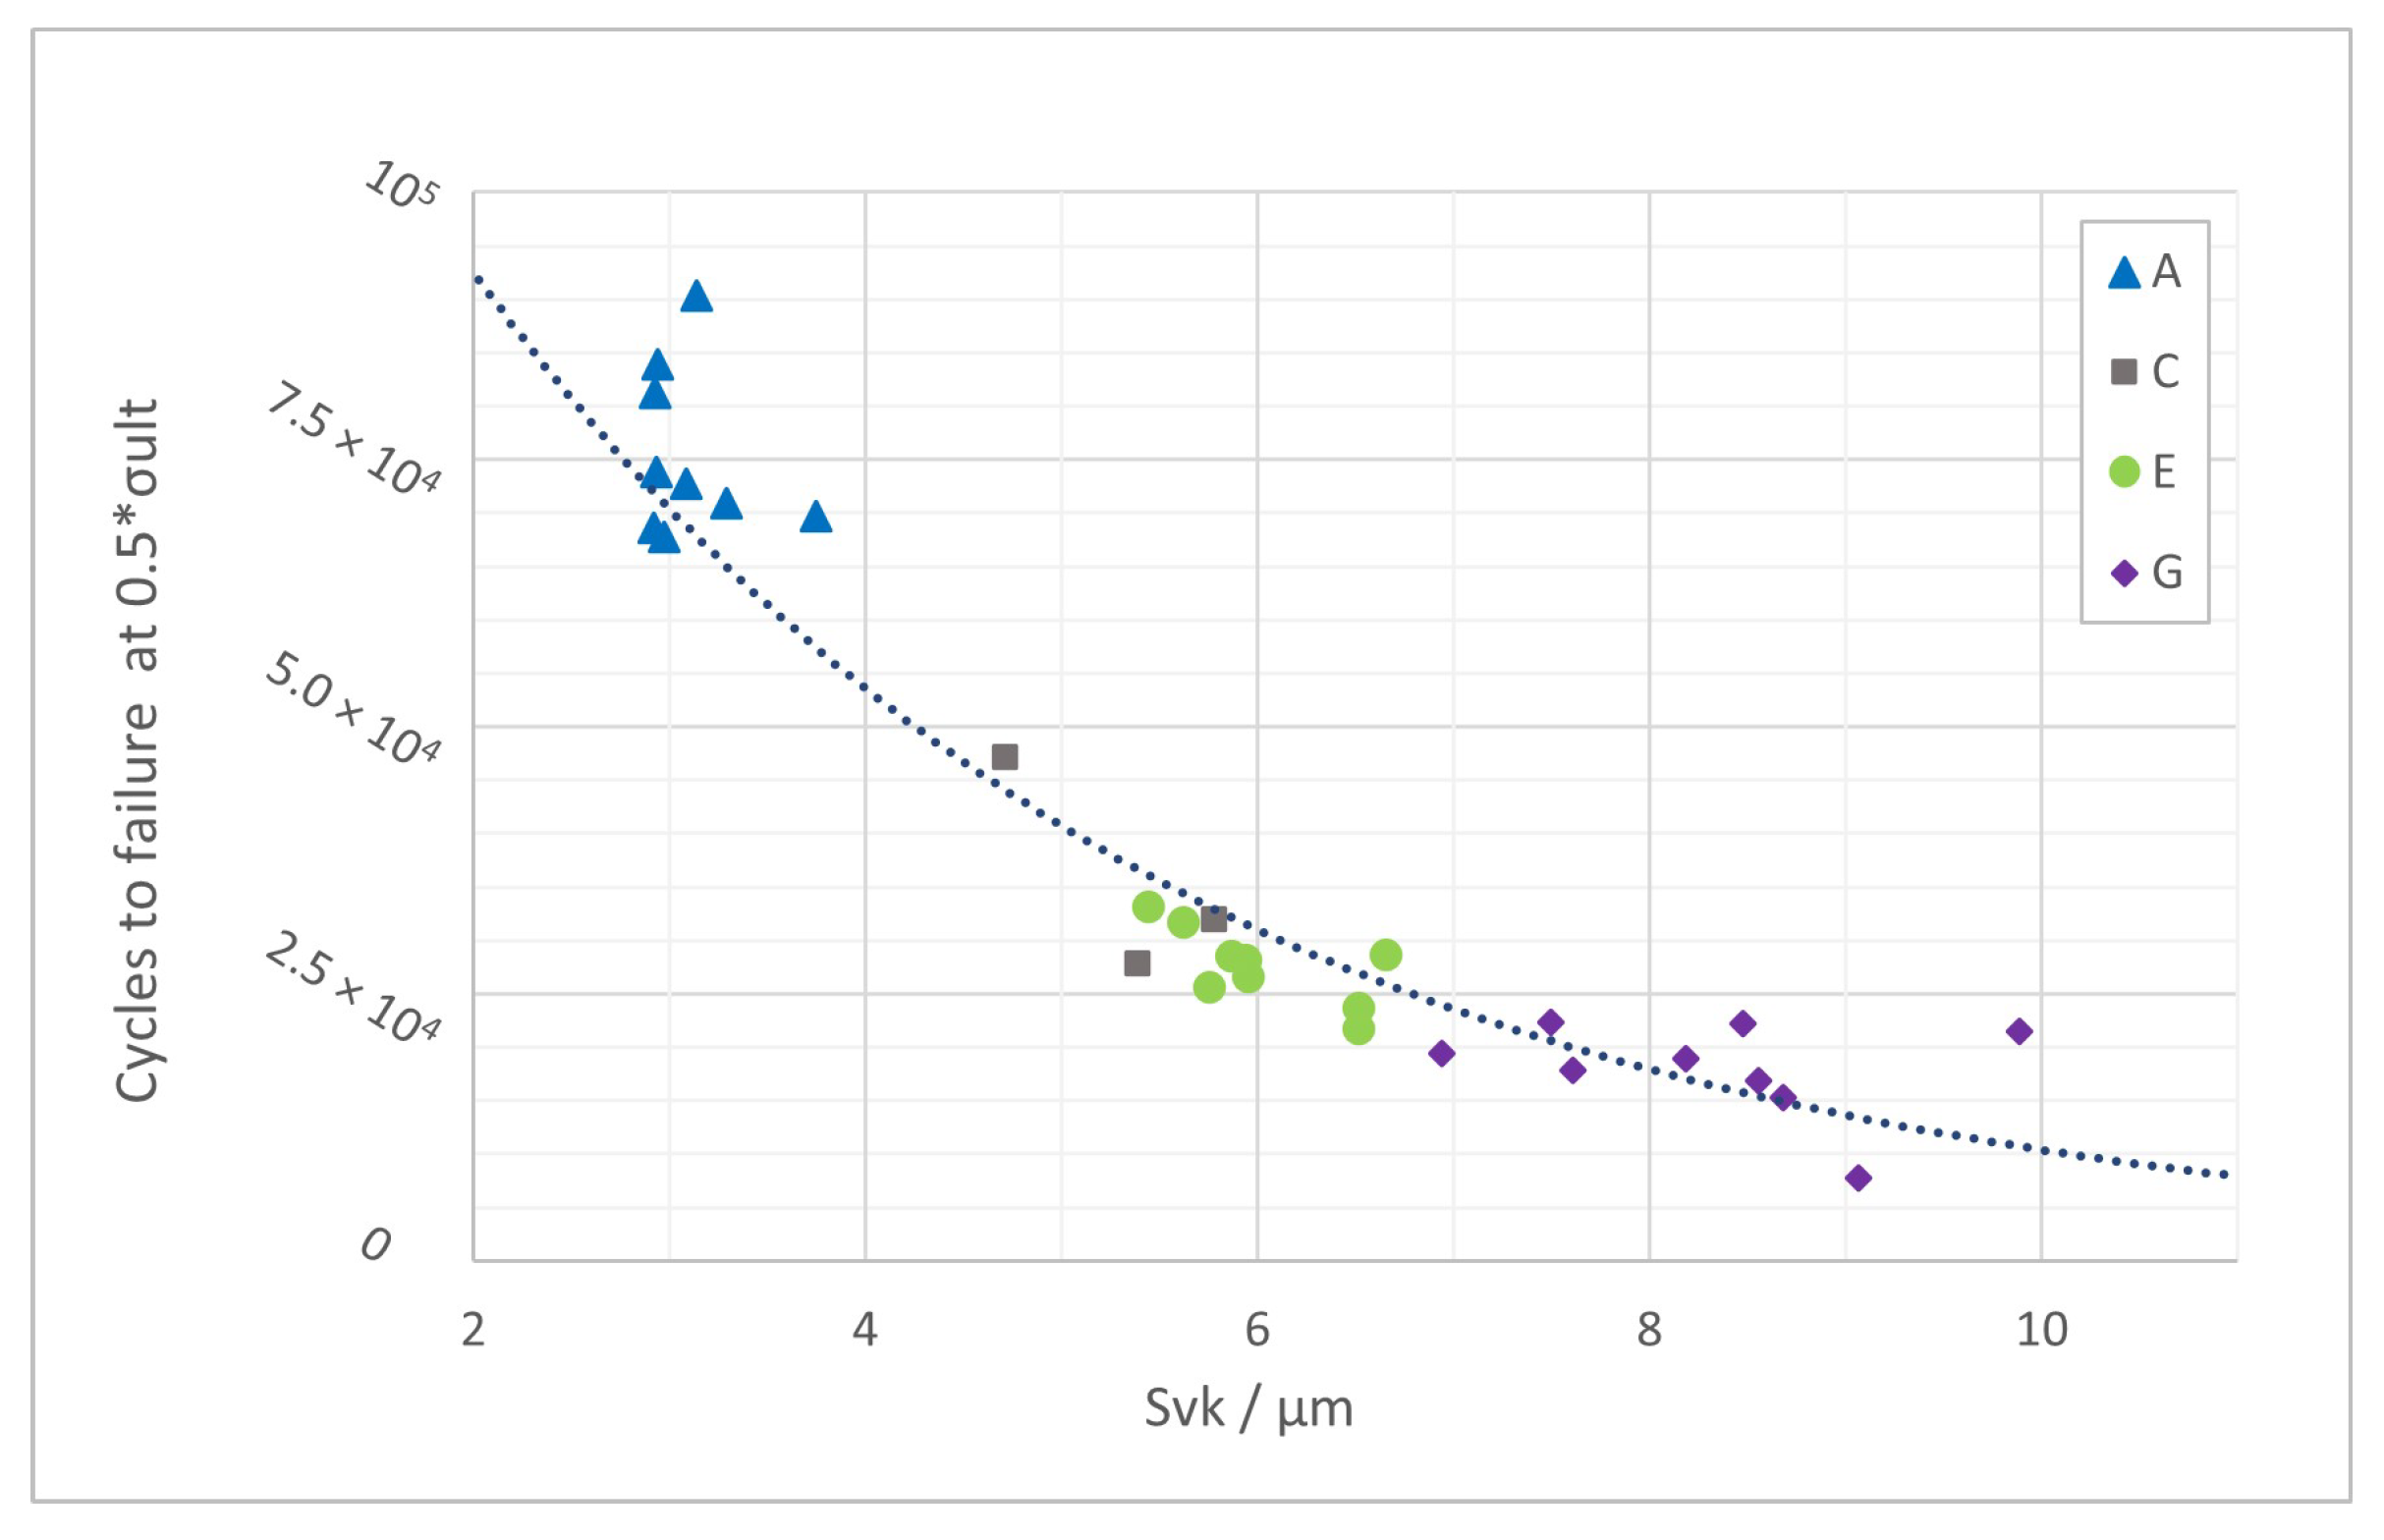
4.2.3. Relationship of Surface Quality and Fatigue
In addition to the surface fatigue relationship shown in [
52] for experimental values, this section presents data factorized to a load level of 0.5
.
The factorization was done based on a linear regression across all data from the tested load levels. The exponential fit of
vs. the number of cycles to failure data in
Figure 10 is described by
with
. Numerical values for
are given in
Table 9. Apart from the previously presented data for the A, E and G groups, there were also a few test results available from surface condition C samples, which were included in this fit.
The reduced valley depth , derived from the material ratio curve, was chosen because it represents the valley population of a sample (within the measured area), as opposed to the common parameters for surface fatigue correlations and , which are individual extreme values and may not be representative of the considered surface.
This parameter choice is confirmed by the data shown in
Table 6 and
Table 8. Surface conditions E and G have comparable
but different
and
. As previously discussed, the fatigue life for both groups clearly differs as well.
Furthermore, especially when looking at rougher surface conditions, cracks tend to start from multiple locations at the surface. Among the tested samples, this was observed for all group G specimens and half of group E specimens (for details, refer to [
52]). Hence, considering the specific nature of typical LPBF-processed surfaces, it makes sense to consider more than just one extreme value per surface.
5. Conclusions
This work aimed to produce samples with identical bulk and different surface quality, including high quality, to assess the impact of as-built surface texture on mechanical properties.
The evaluation of as-built surfaces was motivated by the desire to apply LPBF for complex geometries and inner surfaces, which may be complicated or infeasible to post-process. In addition, achieving the same surface finish and fatigue performance without post-processing saves time and resources.
The variation in surface texture was achieved by varying contour scan speed. The comparability of bulk quality for the different sample groups was confirmed by means of Archimedes’ density and tensile testing. The endurance limit was estimated based on four tested fatigue load levels. The relationship between the reduced valley depth for the different surface quality groups was shown using data factorized to load level 0.5.
The following main conclusions are derived from the presented work:
Distinctive surface conditions with (L-filter 0.25 mm) between 4 µm and 16 µm were produced.
All tested specimens have a density > 99%; thus, the influence of contour scan parameters is considered insignificant regarding density.
The ultimate tensile strength of 393 ± 9.98 MPa was found to be independent of contour scan variation.
Optimized contour scan parameters result in as-built quality superior to some post-processed surfaces, enabling the reduction of processing steps and time.
Condition A reaches a fatigue resistance of 84 MPa at cycles, exceeding values for as-cast and some surface post-processed literature results.
The reduced valley depth results in a good fit across the groups for the factorized surface fatigue relation. Therefore, was found to be a suitable parameter to describe surface quality.
Author Contributions
Conceptualization, T.B.; methodology, T.B., M.A. and H.B.; formal analysis, T.B.; investigation, T.B.; resources, M.A., H.B. and B.M.; data curation, T.B.; writing—original draft preparation, T.B.; writing—review and editing, T.B., M.A., H.B. and B.M.; visualization, T.B.; funding acquisition, M.A., H.B. and B.M. All authors have read and agreed to the published version of the manuscript.
Funding
This research received no external funding.
Data Availability Statement
Data are available from the corresponding author upon request.
Acknowledgments
The authors thank Inga Meyenborg for manufacturing the samples and performing density measurements and Annette Schwingen for performing tensile testing.
Conflicts of Interest
The authors declare no conflict of interest.
Appendix A
Table A1.
and for cuboid samples, 10 surface conditions L-filter 0.25 mm, S-filter 20 µm. With pre-sinter (right), without pre-sinter (left).
Table A1.
and for cuboid samples, 10 surface conditions L-filter 0.25 mm, S-filter 20 µm. With pre-sinter (right), without pre-sinter (left).
| Parameter Set | J | H | F | D | B | A | C | E | G | I |
|---|
| Scan Speed/mm/s | 1800 | 1200 | 900 | 600 | 300 | 300 | 600 | 900 | 1200 | 1800 |
|---|
| /µm, Mean (N = 3) | 5.94 | 3.88 | 2.33 | 1.82 | 1.54 | 1.42 | 1.63 | 2.17 | 3.61 | 5.85 |
| /µm, SD | 0.10 | 0.34 | 0.13 | 0.08 | 0.06 | 0.08 | 0.04 | 0.07 | 0.15 | 0.61 |
| /µm, Mean (N = 3) | 15.93 | 10.25 | 6.66 | 5.35 | 4.53 | 4.30 | 4.88 | 6.49 | 10.50 | 16.09 |
| /µm, SD | 0.26 | 0.67 | 0.24 | 0.15 | 0.05 | 0.18 | 0.15 | 0.06 | 0.37 | 1.18 |
Table A2.
Ultimate tensile strength and relative density of tensile samples. Reference density 2.68 g/cm3. Seven surface conditions.
Table A2.
Ultimate tensile strength and relative density of tensile samples. Reference density 2.68 g/cm3. Seven surface conditions.
| Parameter Set | A | C | D | E | G | H | J |
|---|
| N | 6 | 6 | 6 | 6 | 6 | 5 | 5 |
|---|
| /MPa, Mean | 391.63 | 405.90 | 401.42 | 400.87 | 388.79 | 387.96 | 374.21 |
| /MPa, SD | 5.26 | 10.33 | 7.37 | 14.54 | 11.04 | 15.55 | 16.33 |
| Relative Density/%, Mean | 99.85 | 99.68 | 99.52 | 99.61 | 99.69 | 99.58 | 99.74 |
| Relative Density/%, SD | 0.17 | 0.15 | 0.18 | 0.11 | 0.17 | 0.28 | 0.20 |
References
- Uriondo, A.; Esperon-Miguez, M.; Perinpanayagam, S. The present and future of additive manufacturing in the aerospace sector: A review of important aspects. Proc. Inst. Mech. Eng. Part G J. Aerosp. Eng. 2015, 229, 2132–2147. [Google Scholar] [CrossRef]
- Herzog, D.; Seyda, V.; Wycisk, E.; Emmelmann, C. Additive manufacturing of metals. Acta Mater. 2016, 117, 371–392. [Google Scholar] [CrossRef]
- Manfredi, D.; Bidulskỳ, R. Laser powder bed fusion of aluminum alloys. Acta Metall. Slovaca 2017, 23, 276–282. [Google Scholar] [CrossRef]
- Aboulkhair, N.T.; Simonelli, M.; Parry, L.; Ashcroft, I.; Tuck, C.; Hague, R. 3D printing of Aluminium alloys: Additive Manufacturing of Aluminium alloys using selective laser melting. Prog. Mater. Sci. 2019, 106, 100578. [Google Scholar] [CrossRef]
- O’Brien, M. Existing standards as the framework to qualify additive manufacturing of metals. In Proceedings of the 2018 IEEE Aerospace Conference, Big Sky, MT, USA, 3–10 March 2018; pp. 1–10. [Google Scholar]
- Mohd Yusuf, S.; Cutler, S.; Gao, N. The impact of metal additive manufacturing on the aerospace industry. Metals 2019, 9, 1286. [Google Scholar] [CrossRef]
- Bagehorn, S.; Wehr, J.; Maier, H. Application of mechanical surface finishing processes for roughness reduction and fatigue improvement of additively manufactured Ti-6Al-4V parts. Int. J. Fatigue 2017, 102, 135–142. [Google Scholar] [CrossRef]
- Nicoletto, G.; Konečná, R.; Frkáň, M.; Riva, E. Surface roughness and directional fatigue behavior of as-built EBM and DMLS Ti6Al4V. Int. J. Fatigue 2018, 116, 140–148. [Google Scholar] [CrossRef]
- Frkan, M.; Konecna, R.; Nicoletto, G.; Kunz, L. Microstructure and fatigue performance of SLM-fabricated Ti6Al4V alloy after different stress-relief heat treatments. Transp. Res. Procedia 2019, 40, 24–29. [Google Scholar] [CrossRef]
- Kahlin, M.; Ansell, H.; Basu, D.; Kerwin, A.; Newton, L.; Smith, B.; Moverare, J. Improved fatigue strength of additively manufactured Ti6Al4V by surface post processing. Int. J. Fatigue 2020, 134, 105497. [Google Scholar] [CrossRef]
- Cersullo, N.; Mardaras, J.; Emile, P.; Nickel, K.; Holzinger, V.; Hühne, C. Effect of Internal Defects on the Fatigue Behavior of Additive Manufactured Metal Components: A Comparison between Ti6Al4V and Inconel 718. Materials 2022, 15, 6882. [Google Scholar] [CrossRef]
- Gockel, J.; Sheridan, L.; Koerper, B.; Whip, B. The influence of additive manufacturing processing parameters on surface roughness and fatigue life. Int. J. Fatigue 2019, 124, 380–388. [Google Scholar] [CrossRef]
- Nicoletto, G. Smooth and notch fatigue behavior of selectively laser melted Inconel 718 with as-built surfaces. Int. J. Fatigue 2019, 128, 105211. [Google Scholar] [CrossRef]
- Uriati, F.; Nicoletto, G. A comparison of Inconel 718 obtained with three L-PBF production systems in terms of process parameters, as-built surface quality, and fatigue performance. Int. J. Fatigue 2022, 162, 107004. [Google Scholar] [CrossRef]
- Afkhami, S.; Dabiri, M.; Piili, H.; Björk, T. Effects of manufacturing parameters and mechanical post-processing on stainless steel 316L processed by laser powder bed fusion. Mater. Sci. Eng. A 2021, 802, 140660. [Google Scholar] [CrossRef]
- Obeidi, M.A.; Mhurchadha, S.M.U.; Raghavendra, R.; Conway, A.; Souto, C.; Tormey, D.; Ahad, I.U.; Brabazon, D. Comparison of the porosity and mechanical performance of 316L stainless steel manufactured on different laser powder bed fusion metal additive manufacturing machines. J. Mater. Res. Technol. 2021, 13, 2361–2374. [Google Scholar] [CrossRef]
- Alaimo, G.; Carraturo, M.; Korshunova, N.; Kollmannsberger, S. Numerical evaluation of high cycle fatigue life for additively manufactured stainless steel 316L lattice structures: Preliminary considerations. Mater. Des. Process. Commun. 2021, 3, e249. [Google Scholar] [CrossRef]
- Korshunova, N.; Alaimo, G.; Hosseini, S.B.; Carraturo, M.; Reali, A.; Niiranen, J.; Auricchio, F.; Rank, E.; Kollmannsberger, S. Image-based numerical characterization and experimental validation of tensile behavior of octet-truss lattice structures. Addit. Manuf. 2021, 41, 101949. [Google Scholar] [CrossRef]
- Magarò, P.; Alaimo, G.; Carraturo, M.; Sgambitterra, E.; Maletta, C. A novel methodology for the prediction of the stress–strain response of laser powder bed fusion lattice structure based on a multi-scale approach. Mater. Sci. Eng. A 2023, 863, 144526. [Google Scholar] [CrossRef]
- Sercombe, T.B.; Li, X. Selective laser melting of aluminium and aluminium metal matrix composites. Mater. Technol. 2016, 31, 77–85. [Google Scholar] [CrossRef]
- Aboulkhair, N.T.; Everitt, N.M.; Maskery, I.; Ashcroft, I.; Tuck, C. Selective laser melting of aluminum alloys. MRS Bull. 2017, 42, 311–319. [Google Scholar] [CrossRef]
- DebRoy, T.; Wei, H.; Zuback, J.; Mukherjee, T.; Elmer, J.; Milewski, J.; Beese, A.M.; Wilson-Heid, A.d.; De, A.; Zhang, W. Additive manufacturing of metallic components–process, structure and properties. Prog. Mater. Sci. 2018, 92, 112–224. [Google Scholar] [CrossRef]
- Kusoglu, I.M.; Gökce, B.; Barcikowski, S. Research trends in laser powder bed fusion of Al alloys within the last decade. Addit. Manuf. 2020, 36, 101489. [Google Scholar] [CrossRef]
- Rometsch, P.A.; Zhu, Y.; Wu, X.; Huang, A. Review of high-strength aluminium alloys for additive manufacturing by laser powder bed fusion. Mater. Des. 2022, 219, 110779. [Google Scholar] [CrossRef]
- Kotadia, H.; Gibbons, G.; Das, A.; Howes, P. A review of Laser Powder Bed Fusion Additive Manufacturing of aluminium alloys: Microstructure and properties. Addit. Manuf. 2021, 46, 102155. [Google Scholar] [CrossRef]
- Lathabai, S. Additive manufacturing of aluminium-based alloys and composites. Fundam. Alum. Metall. 2018, 47–92. [Google Scholar] [CrossRef]
- Prashanth, K.G.; Scudino, S.; Klauss, H.J.; Surreddi, K.B.; Löber, L.; Wang, Z.; Chaubey, A.K.; Kühn, U.; Eckert, J. Microstructure and mechanical properties of Al–12Si produced by selective laser melting: Effect of heat treatment. Mater. Sci. Eng. A 2014, 590, 153–160. [Google Scholar] [CrossRef]
- Kimura, T.; Nakamoto, T. Microstructures and mechanical properties of A356 (AlSi7Mg0. 3) aluminum alloy fabricated by selective laser melting. Mater. Des. 2016, 89, 1294–1301. [Google Scholar] [CrossRef]
- Chen, B.; Moon, S.; Yao, X.; Bi, G.; Shen, J.; Umeda, J.; Kondoh, K. Strength and strain hardening of a selective laser melted AlSi10Mg alloy. Scr. Mater. 2017, 141, 45–49. [Google Scholar] [CrossRef]
- Rao, J.H.; Zhang, Y.; Fang, X.; Chen, Y.; Wu, X.; Davies, C.H. The origins for tensile properties of selective laser melted aluminium alloy A357. Addit. Manuf. 2017, 17, 113–122. [Google Scholar] [CrossRef]
- Yang, K.V.; Rometsch, P.; Davies, C.; Huang, A.; Wu, X. Effect of heat treatment on the microstructure and anisotropy in mechanical properties of A357 alloy produced by selective laser melting. Mater. Des. 2018, 154, 275–290. [Google Scholar] [CrossRef]
- Takata, N.; Liu, M.; Kodaira, H.; Suzuki, A.; Kobashi, M. Anomalous strengthening by supersaturated solid solutions of selectively laser melted Al–Si-based alloys. Addit. Manuf. 2020, 33, 101152. [Google Scholar] [CrossRef]
- Pereira, J.C.; Gil, E.; Solaberrieta, L.; San Sebastián, M.; Bilbao, Y.; Rodríguez, P.P. Comparison of AlSi7Mg0.6 alloy obtained by selective laser melting and investment casting processes: Microstructure and mechanical properties in as-built/as-cast and heat-treated conditions. Mater. Sci. Eng. A 2020, 778, 139124. [Google Scholar] [CrossRef]
- Salandari-Rabori, A.; Wang, P.; Dong, Q.; Fallah, V. Enhancing as-built microstructural integrity and tensile properties in laser powder bed fusion of AlSi10Mg alloy using a comprehensive parameter optimization procedure. Mater. Sci. Eng. A 2021, 805, 140620. [Google Scholar] [CrossRef]
- Liu, M.; Takata, N.; Suzuki, A.; Kobashi, M.; Kato, M. Enhancement in strength and ductility of laser powder bed fused Al–12Si alloy by introducing nanoscale precipitates. Addit. Manuf. Lett. 2021, 1, 100008. [Google Scholar] [CrossRef]
- Zhang, B.; Wei, W.; Shi, W.; Guo, Y.; Wen, S.; Wu, X.; Gao, K.; Rong, L.; Huang, H.; Nie, Z. Effect of heat treatment on the microstructure and mechanical properties of Er-containing Al–7Si–0.6 Mg alloy by laser powder bed fusion. J. Mater. Res. Technol. 2022, 18, 3073–3084. [Google Scholar] [CrossRef]
- Uzan, N.E.; Shneck, R.; Yeheskel, O.; Frage, N. Fatigue of AlSi10Mg specimens fabricated by additive manufacturing selective laser melting (AM-SLM). Mater. Sci. Eng. A 2017, 704, 229–237. [Google Scholar] [CrossRef]
- Zhang, C.; Zhu, H.; Liao, H.; Cheng, Y.; Hu, Z.; Zeng, X. Effect of heat treatments on fatigue property of selective laser melting AlSi10Mg. Int. J. Fatigue 2018, 116, 513–522. [Google Scholar] [CrossRef]
- Grande, A.; Cacace, S.; Demir, A.G.; Sala, G. Fracture and fatigue behaviour of AlSi7Mg0.6 produced by Selective Laser Melting: Effects of thermal-treatments. In Proceedings of the 25th International Congress, Rome, Italy, 9–12 September 2019. [Google Scholar]
- Mauduit, A.; Gransac, H.; Auguste, P.; Pillot, S. Study of AlSi7Mg0.6 Alloy by Selective Laser Melting: Mechanical Properties, Microstructure, Heat Treatment. J. Cast. Mater. Eng. 2019, 3, 1. [Google Scholar] [CrossRef]
- Han, Q.; Jiao, Y. Effect of heat treatment and laser surface remelting on AlSi10Mg alloy fabricated by selective laser melting. Int. J. Adv. Manuf. Technol. 2019, 102, 3315–3324. [Google Scholar] [CrossRef]
- Aboulkhair, N.T.; Maskery, I.; Tuck, C.; Ashcroft, I.; Everitt, N.M. Improving the fatigue behaviour of a selectively laser melted aluminium alloy: Influence of heat treatment and surface quality. Mater. Des. 2016, 104, 174–182. [Google Scholar] [CrossRef]
- Denti, L.; Sola, A. On the effectiveness of different surface finishing techniques on A357. 0 parts produced by laser-based powder bed fusion: Surface roughness and fatigue strength. Metals 2019, 9, 1284. [Google Scholar] [CrossRef]
- Hamidi Nasab, M.; Giussani, A.; Gastaldi, D.; Tirelli, V.; Vedani, M. Effect of surface and subsurface defects on fatigue behavior of AlSi10Mg alloy processed by laser powder bed fusion (L-PBF). Metals 2019, 9, 1063. [Google Scholar] [CrossRef]
- Gatto, A.; Bassoli, E.; Denti, L.; Sola, A.; Tognoli, E.; Comin, A.; Porro, J.A.; Cordovilla, F.; Angulo, I.; Ocaña, J.L. Effect of Three Different Finishing Processes on the Surface Morphology and Fatigue Life of A357. 0 Parts Produced by Laser-Based Powder Bed Fusion. Adv. Eng. Mater. 2019, 21, 1801357. [Google Scholar] [CrossRef]
- Cacace, S.; Demir, A.G.; Sala, G.; Grande, A.M. Influence of production batch related parameters on static and fatigue resistance of LPBF produced AlSi7Mg0. 6. Int. J. Fatigue 2022, 165, 107227. [Google Scholar] [CrossRef]
- de Menezes, J.T.O.; Castrodeza, E.M.; Casati, R. Effect of build orientation on fracture and tensile behavior of A357 Al alloy processed by Selective Laser Melting. Mater. Sci. Eng. A 2019, 766, 138392. [Google Scholar] [CrossRef]
- Denti, L. Additive manufactured A357. 0 samples using the laser powder bed fusion technique: Shear and tensile performance. Metals 2018, 8, 670. [Google Scholar] [CrossRef]
- Bassoli, E.; Denti, L.; Comin, A.; Sola, A.; Tognoli, E. Fatigue Behavior of As-Built L-PBF A357.0 Parts. Metals 2018, 8, 634. [Google Scholar] [CrossRef]
- Mower, T.M.; Long, M.J. Mechanical behavior of additive manufactured, powder-bed laser-fused materials. Mater. Sci. Eng. A 2016, 651, 198–213. [Google Scholar] [CrossRef]
- Nasab, M.H.; Romano, S.; Gastaldi, D.; Beretta, S.; Vedani, M. Combined effect of surface anomalies and volumetric defects on fatigue assessment of AlSi7Mg fabricated via laser powder bed fusion. Addit. Manuf. 2020, 34, 100918. [Google Scholar]
- Buchenau, T.; Amkreutz, M.; Brüning, H. Surface texture and high cycle fatigue of as-built metal additive AlSi7Mg0. 6. J. Addit. Manuf. Technol. 2021, 1, 531. [Google Scholar] [CrossRef]
- Greitemeier, D.; Dalle Donne, C.; Syassen, F.; Eufinger, J.; Melz, T. Effect of surface roughness on fatigue performance of additive manufactured Ti–6Al–4V. Mater. Sci. Technol. 2016, 32, 629–634. [Google Scholar] [CrossRef]
- Raab, M.; Bambach, M. Fatigue properties of Scalmalloy® processed by laser powder bed fusion in as-built, chemically and conventionally machined surface condition. J. Mater. Process. Technol. 2023, 311, 117811. [Google Scholar] [CrossRef]
- Buchenau, T.; Cersullo, N.; Mardaras, J.; Emile, P.; Lafue, V.; Brüning, H.; Amkreutz, M.; Hühne, C. Fatigue and surface texture of post-processed metal additive Ti-6Al-4V. In Proceedings of the 17th European Conference on Spacecraft Structures, Materials and Environmental Testing, Toulouse, France, 28–30 March 2023. [Google Scholar]
- ASTM E466-15; Standard Practice for Conducting Force Controlled Constant Amplitude Axial Fatigue Tests of Metallic Materials. ASTM: West Conchhocken, PA, USA, 2015. [CrossRef]
- Townsend, A.; Senin, N.; Blunt, L.; Leach, R.; Taylor, J. Surface texture metrology for metal additive manufacturing: A review. Precis. Eng. 2016, 46, 34–47. [Google Scholar] [CrossRef]
- Steinhilper, W.; Sauer, B.; Feldhusen, J. Konstruktionselemente des Maschinenbaus 1: Grundlagen der Berechnung und Gestaltung von Maschinenelementen; Springer: Berlin/Heidelberg, Germany, 2008. [Google Scholar]
- ISO 25178; Geometric Product Specifications (GPS)—Surface Texture: Areal—Part 2: Terms, Definitions and Surface Texture Parameters. ISO: Geneva, Switzerland, 2022.
- ISO 3369:2006; Impermeable Sintered Metal Materials and Hardmetals—Determination of Density. ISO: Geneva, Switzerland, 2006.
- ASTM E8M; Standard Test Methods for Tension Testing of Metallic Materials. ASTM: West Conchhocken, PA, USA, 2016. [CrossRef]
- Einbock, S. Statistics of Metal Fatigue in Engineering: Planning and Analysis of Metal Fatigue Tests; BoD–Books on Demand: Norderstedt, Germany, 2018. [Google Scholar]
- Dezecot, S.; Brochu, M. Microstructural characterization and high cycle fatigue behavior of investment cast A357 aluminum alloy. Int. J. Fatigue 2015, 77, 154–159. [Google Scholar] [CrossRef]
Figure 1.
Top view: sample orientation with respect to coater (top left); example of build job layout (bottom left); individual tested sample (middle); finished build job on platform (right).
Figure 1.
Top view: sample orientation with respect to coater (top left); example of build job layout (bottom left); individual tested sample (middle); finished build job on platform (right).
Figure 2.
Exposure strategy for bulk and contour scan: bulk scan direction is rotated by 66° (schematic representation, not true to scale) after each powder layer application.
Figure 2.
Exposure strategy for bulk and contour scan: bulk scan direction is rotated by 66° (schematic representation, not true to scale) after each powder layer application.
Figure 3.
Workflow summary.
Figure 3.
Workflow summary.
Figure 4.
Microscopic images of samples with variation of contour scan speed, from lowest (left) to highest (right).
Figure 4.
Microscopic images of samples with variation of contour scan speed, from lowest (left) to highest (right).
Figure 5.
and for samples with different contour scan. L-filter 0.25 mm, S-filter 20 µm. Mean ± 2SD.
Figure 5.
and for samples with different contour scan. L-filter 0.25 mm, S-filter 20 µm. Mean ± 2SD.
Figure 6.
Density per manufacturing parameter set, mean ± 2SD; reference density: 100% = 2.68 g/cm3.
Figure 6.
Density per manufacturing parameter set, mean ± 2SD; reference density: 100% = 2.68 g/cm3.
Figure 7.
Ultimate tensile strength for seven different surface conditions, mean ± 2SD.
Figure 7.
Ultimate tensile strength for seven different surface conditions, mean ± 2SD.
Figure 8.
-curve for surface conditions A (AsB-smooth), E (AsB-medium) and G (AsB-rough), reference stress
MPa. Reproduced from [
52].
Figure 8.
-curve for surface conditions A (AsB-smooth), E (AsB-medium) and G (AsB-rough), reference stress
MPa. Reproduced from [
52].
Figure 9.
Estimated stress for different endurance limit values .
Figure 9.
Estimated stress for different endurance limit values .
Figure 10.
Exponential fit vs. cycles to failure at 0.5.
Figure 10.
Exponential fit vs. cycles to failure at 0.5.
Table 1.
AlSi7Mg0.6 powder composition: mass fraction per alloying element.
Table 1.
AlSi7Mg0.6 powder composition: mass fraction per alloying element.
| Al | Si | Mg | Ti | Fe |
|---|
| 93.13 | 6.15 | 0.6 | 0.09 | 0.05 |
Table 2.
Bulk scan parameters.
Table 2.
Bulk scan parameters.
| Material | Layer Thickness | Hatch Distance | Scan Speed | Laser Power | Pre-Sinter |
|---|
| AlSi7Mg0.6 | 30 µm | 0.12 mm | 1000 mm/s | 195 W | No |
Table 3.
Variation of contour scan parameters.
Table 3.
Variation of contour scan parameters.
| Material | Layer Thickness | Hatch Distance | Scan Speed | Laser Power | Pre-Sinter |
|---|
| | | | 300 mm/s | | |
| | | | 600 mm/s | | Yes |
| AlSi7Mg0.6 | 30 µm | 0.12 mm | 900 mm/s | 195 W | |
| | | | 1200 mm/s | | No |
| | | | 1800 mm/s | | |
Table 4.
Naming of sample groups based on contour scan variation.
Table 4.
Naming of sample groups based on contour scan variation.
| Scan Speed in mm/s | 300 | 600 | 900 | 1200 | 1800 |
| Pre-Sinter | A | C | E | G | I |
| No Pre-Sinter | B | D | F | H | J |
Table 5.
Load levels and stress values for
MPa and
[
52].
Table 5.
Load levels and stress values for
MPa and
[
52].
| Load Level | /MPa | /MPa | /MPa |
|---|
| 0.4 | 156.8 | 15.7 | 86.2 |
| 0.5 | 196.0 | 19.6 | 107.8 |
| 0.6 | 235.2 | 23.5 | 129.4 |
| 0.7 | 274.4 | 27.4 | 150.9 |
Table 6.
Surface texture parameters for comparison with the literature, cut-off 0.8 mm. Evaluated for one specimen per surface condition.
Table 6.
Surface texture parameters for comparison with the literature, cut-off 0.8 mm. Evaluated for one specimen per surface condition.
| Surface Condition | /μm | /μm | /μm |
|---|
| A (AsB-smooth) | 3.153 | 3.478 | 20.09 |
| E (AsB-medium) | 5.649 | 6.987 | 93.78 |
| G (AsB-rough) | 7.362 | 9.316 | 96.57 |
Table 7.
Coefficients of logarithmic-linear equation for three surface conditions.
Table 7.
Coefficients of logarithmic-linear equation for three surface conditions.
| Coefficient | A (AsB-Smooth) | E (AsB-Medium) | G (AsB-Rough) |
|---|
| m | −3.292 | −3.244 | −2.892 |
| c | 3.794 | 3.364 | 3.283 |
Table 8.
Estimated stress for different endurance limit values .
Table 8.
Estimated stress for different endurance limit values .
| Surface Condition | A (AsB-Smooth) | E (AsB-Medium) | G (AsB-Rough) |
|---|
| at /MPa | 84 | 60 | 45 |
| at /MPa | 68 | 49 | 35 |
| at /MPa | 42 | 30 | 20 |
Table 9.
for fatigue-tested samples.
Table 9.
for fatigue-tested samples.
| Surface Condition | Mean µm | SD µm |
|---|
| A | 3.105 | 0.271 |
| C | 5.296 | 0.539 |
| E | 6.028 | 0.431 |
| G | 8.321 | 0.890 |
| Disclaimer/Publisher’s Note: The statements, opinions and data contained in all publications are solely those of the individual author(s) and contributor(s) and not of MDPI and/or the editor(s). MDPI and/or the editor(s) disclaim responsibility for any injury to people or property resulting from any ideas, methods, instructions or products referred to in the content. |
© 2023 by the authors. Licensee MDPI, Basel, Switzerland. This article is an open access article distributed under the terms and conditions of the Creative Commons Attribution (CC BY) license (https://creativecommons.org/licenses/by/4.0/).


