3.2. Mechanism of PEO Formation
The whole PEO process is characterized by the formation of PEO coating, which increases the corrosion protection of metals. For this reason, this type of coating is essential and beneficial for metallic materials, especially light metals. Unfortunately, the pores, which are a typical feature of the structure of PEO coatings, are a major drawback that negatively affects the protective function of the PEO coating [
26].
In
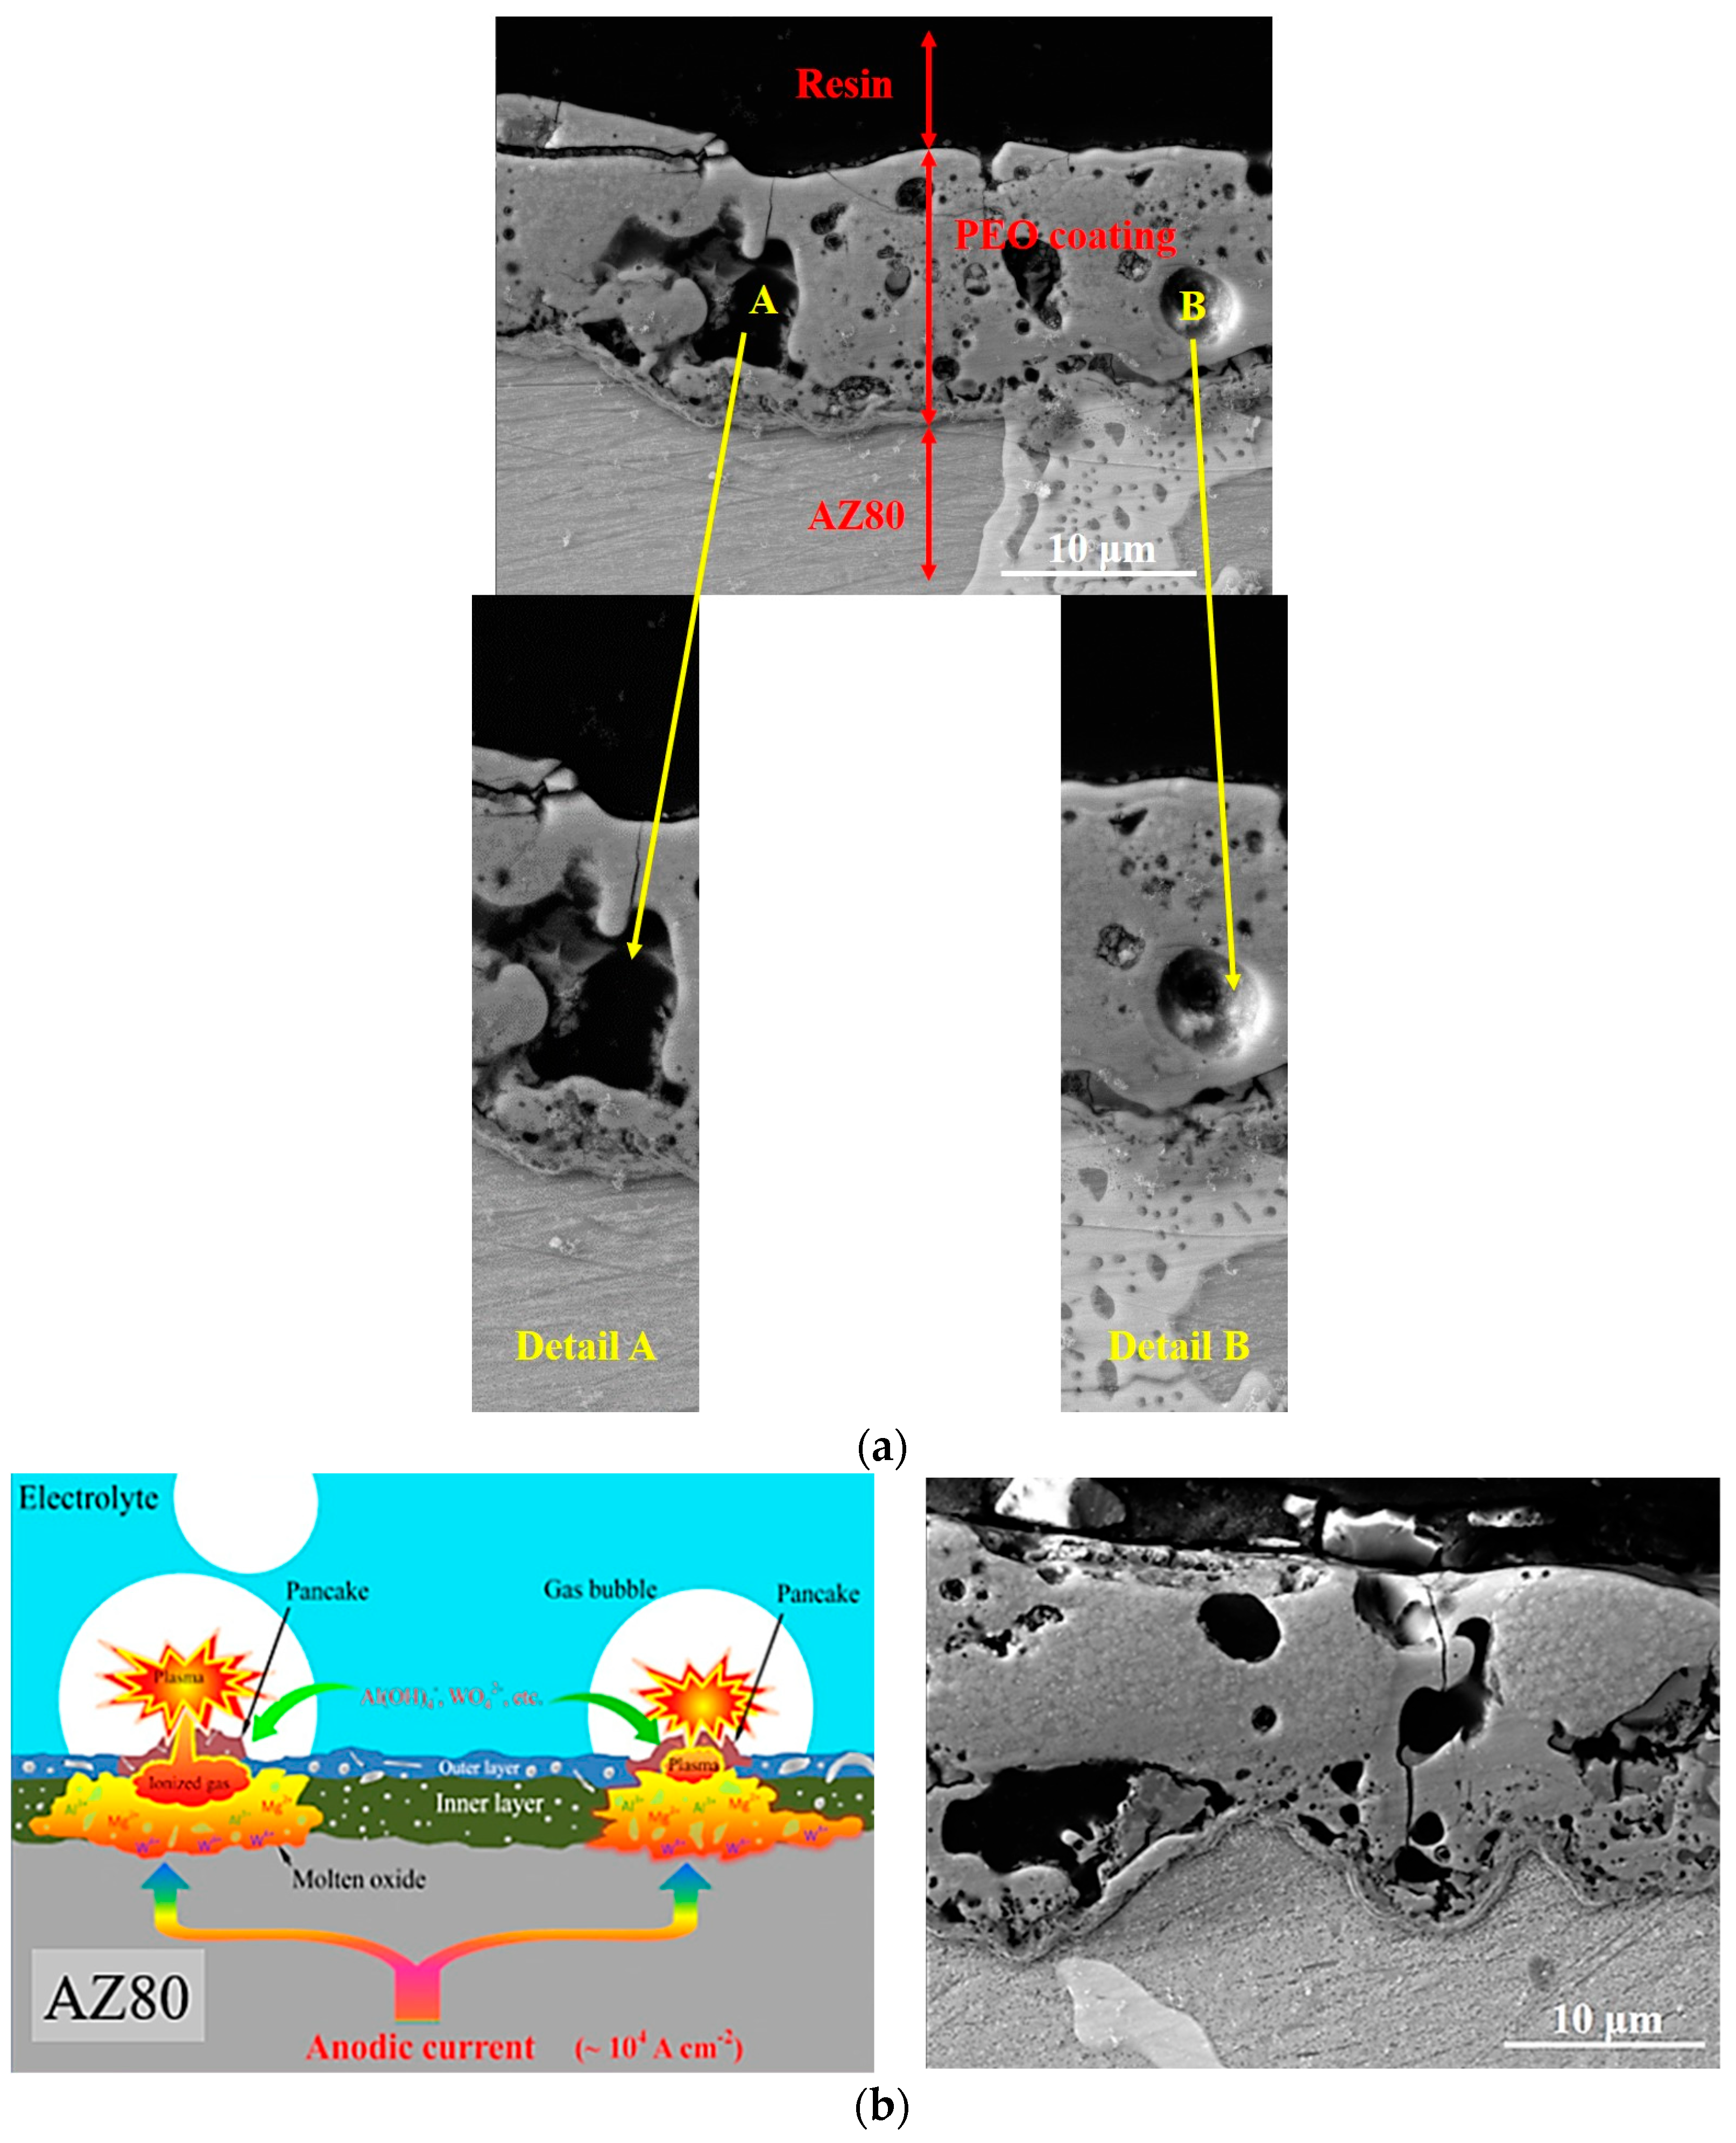
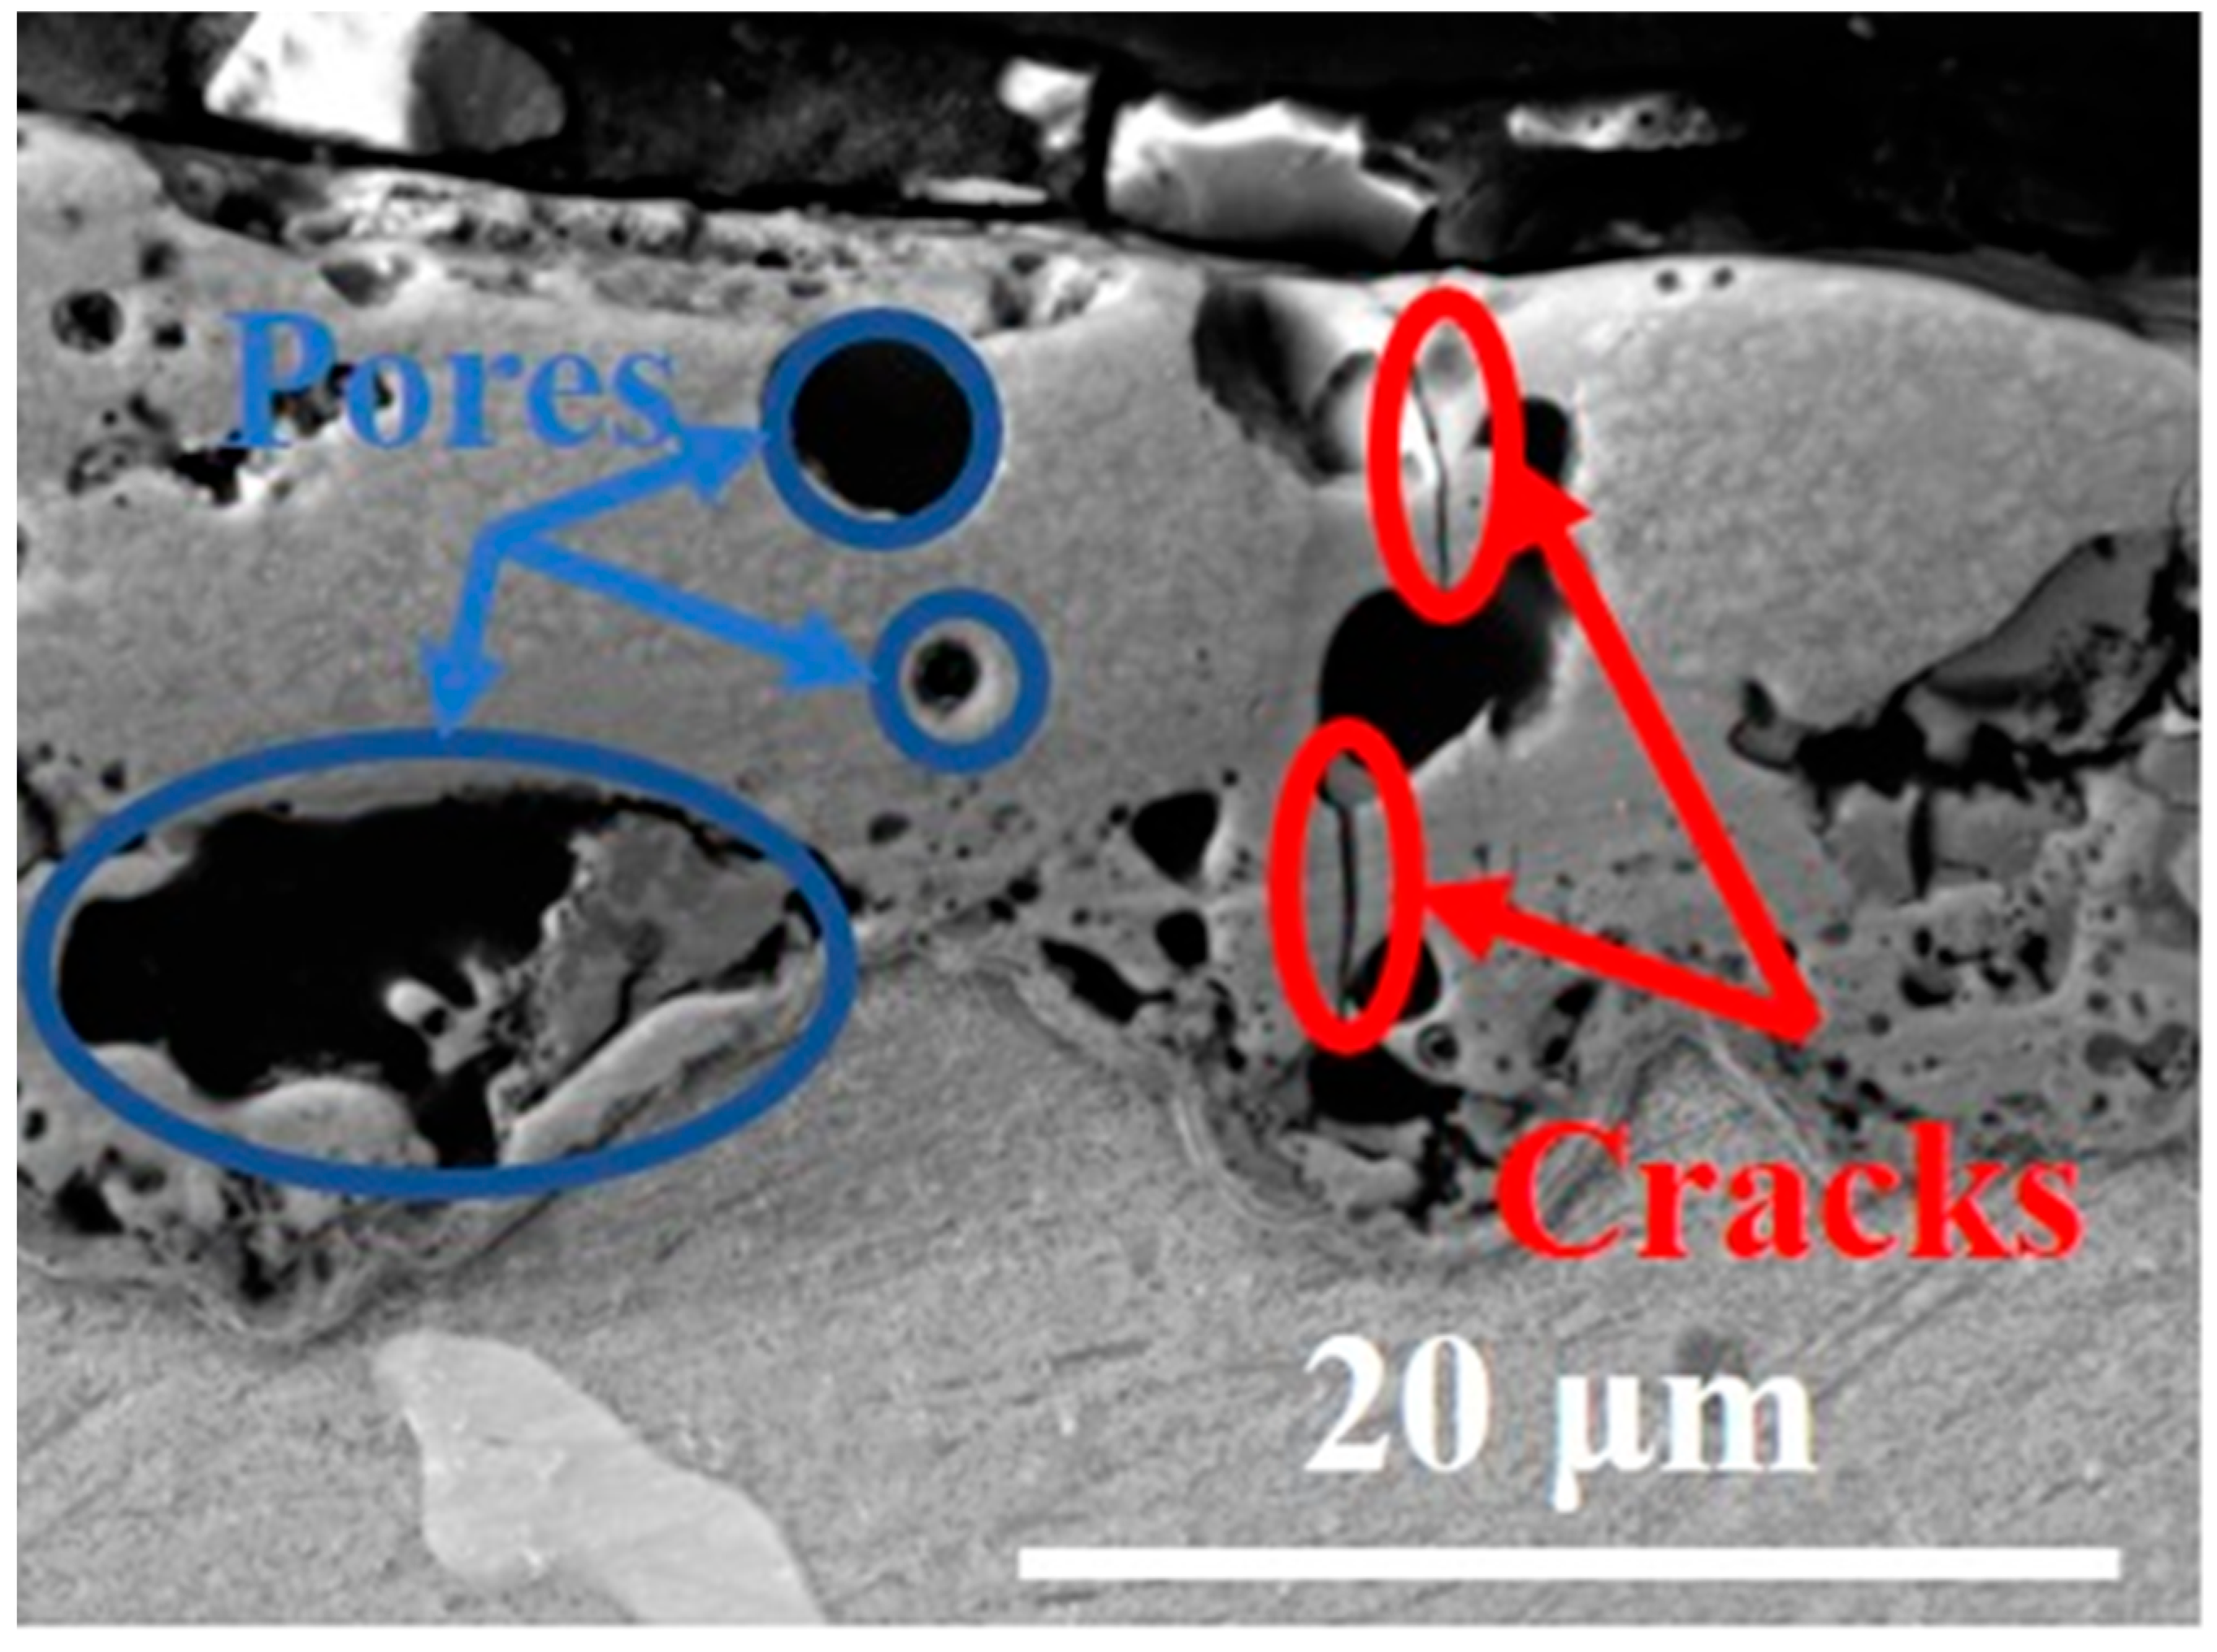
Figure 4b (right one) the mechanism of the PEO formation is shown. The sample is exposed during the process in a PEO bath under the specified conditions (concentration and chemical composition of the electrolyte, exposure time, and values of applied current and voltage). Thanks to these conditions, it is possible to adjust them and achieve the appropriate parameters (thickness and porosity), which are crucial for PEO coating. Due to this, it is inevitable to choose suitable conditions to avoid structural defects or to know how to deal with them or their excessive number and size.
Figure 4a,b shows the cross-sections of various SEM images of PEO coatings, where the defects (pores) of the coatings can be seen. The size of these pores is a function of the discharge density as well as the process time. In the case of magnesium alloys is the size between 0.5 and 50 μm [
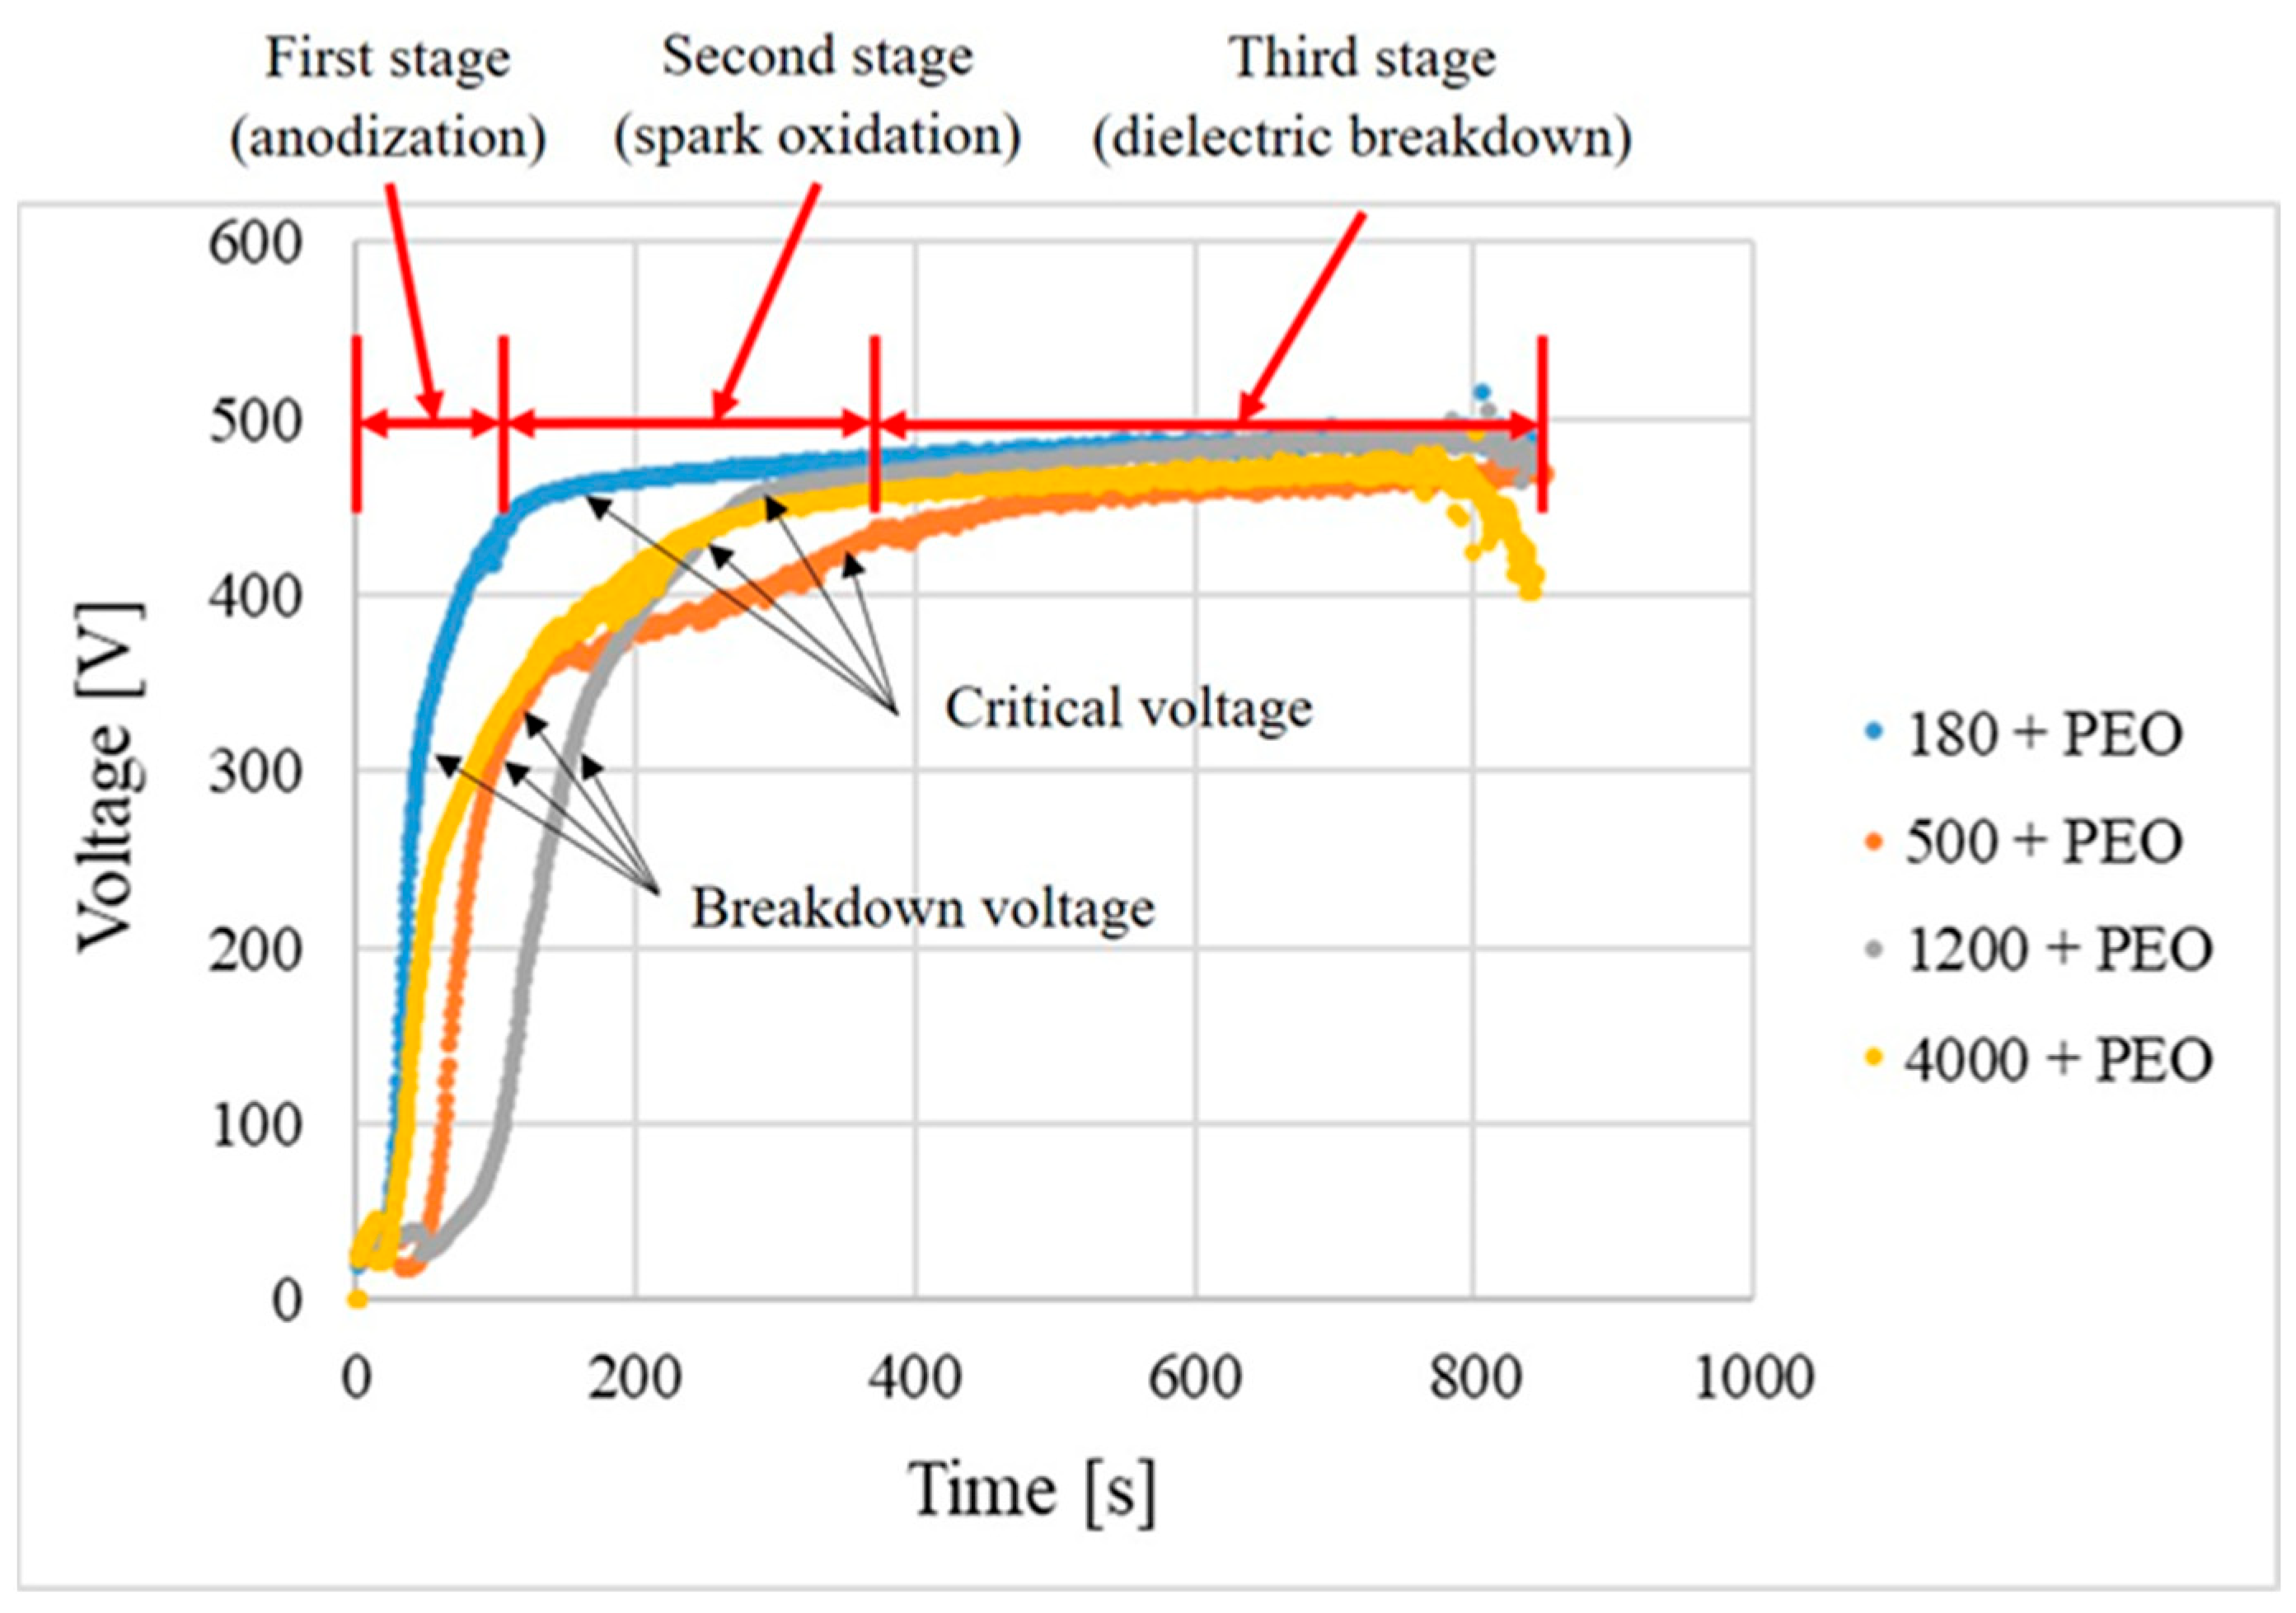
12]. Plasma discharges in PEO processing are limited by the stress behaviour. This fact was demonstrated by Hussein, who found that the PEO process can be divided into four discharge stages. The occurrence of discharges is mainly affected with increasing processing time of PEO [
27,
28]. Considering these discharges, their intensity, and size, they also have a great importance for the pore formation in the case of the experimental material AZ80 (
Figure 4a—detail A and B). While in
Figure 4a Detail A, a larger pore with longitudinal shape and dimensions of 12 μm width and 8 μm length can be seen. On the other hand,
Figure 4a Detail B shows a spherical pore with a diameter of 4 μm in diameter. Therefore, it should be noted that the formation of the resulting pores in the PEO structure is different in terms of the size and amount of these defects.
Figure 4b on the left shows the typical mechanism of PEO formation. The process itself is accompanied by various process characteristics, such as developed voltage breakdown, local melting and oxidation of the substrate, and quenching and recrystallization processes, which have a significant impact on the resulting properties of the coating [
29]. In the
Figure 4b, right, the cross-section of Mg alloy AZ80 after PEO treatment is shown. The result of this mechanism is the porous structure of the PEO coating.
3.4. SEM and EDS Analysis of Magnesium Alloy AZ80 with PEO Coating
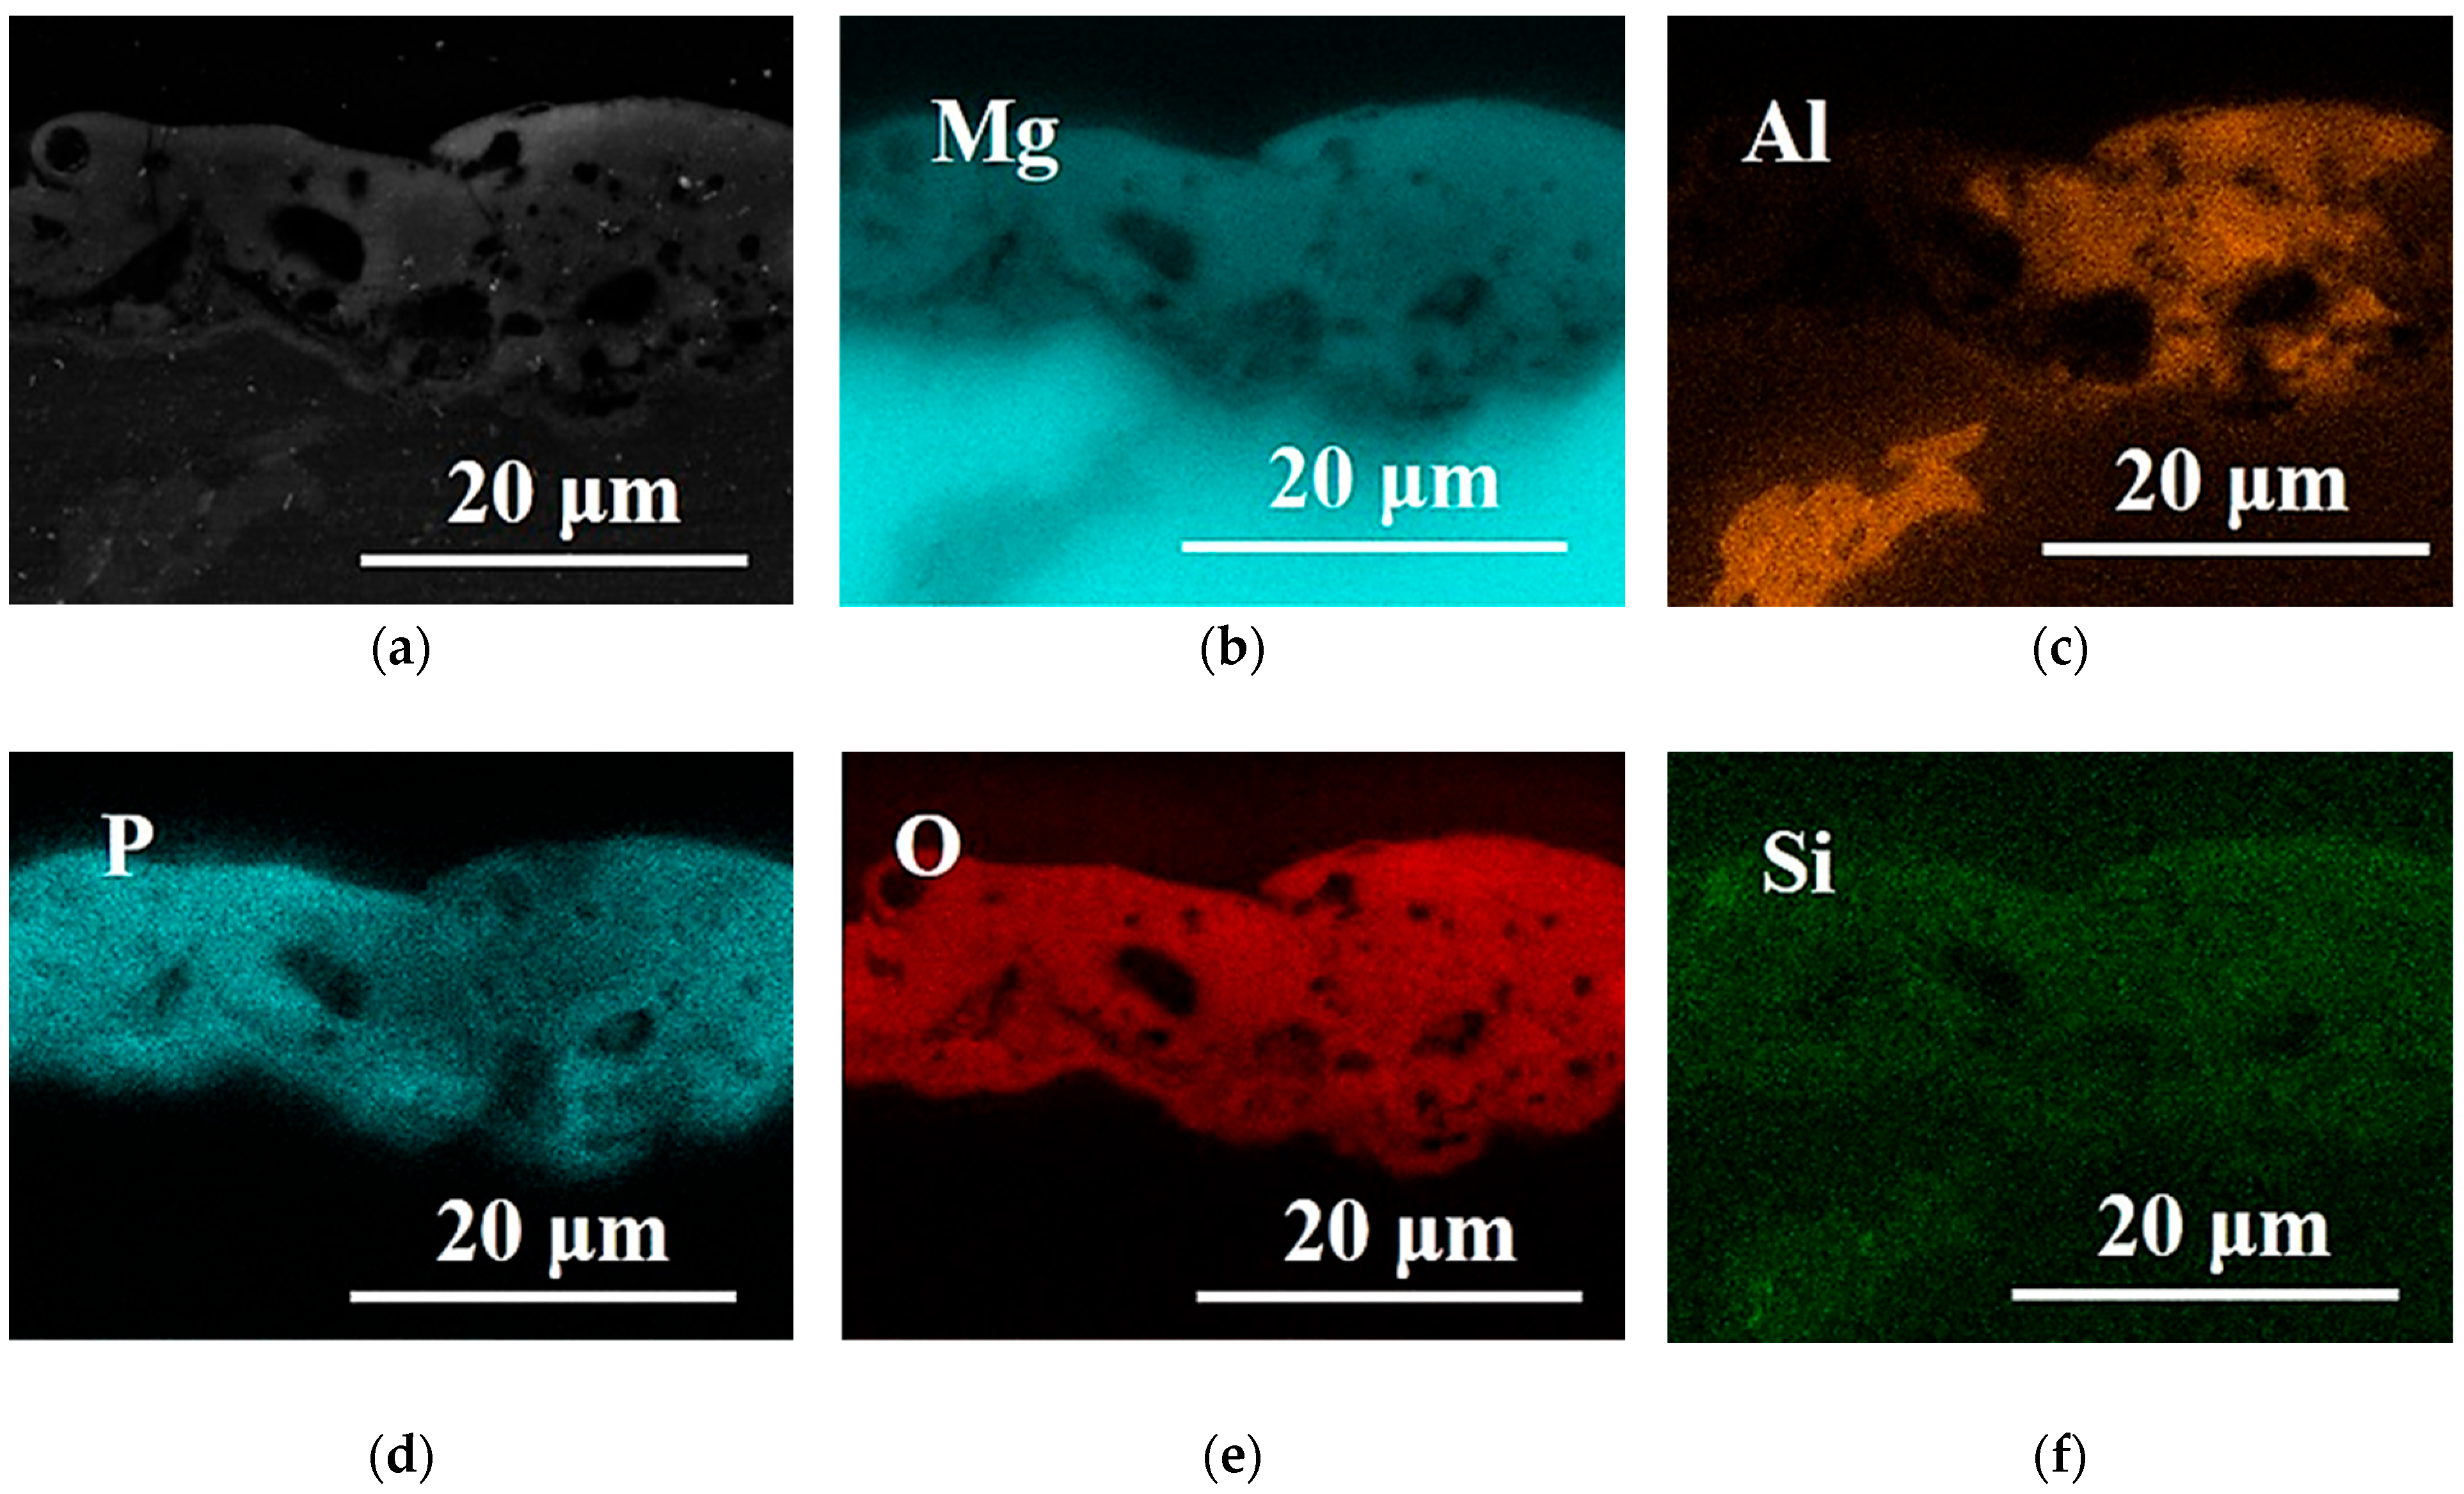
Figure 6a–f shows the EDS analysis of the elements present in the cross-section of AZ80 alloy with PEO coating. From the XRD analysis performed in other articles [
12,
32], it was found that the PEO coating formed in the phosphate electrolyte consists of Mg
3(PO
4)
2 and MgO. This fact was confirmed by the EDS analysis shown in
Figure 6b,d,e where the main elements of the PEO coating were phosphorus, oxygen, and magnesium. Moreover, the amount of phosphorus and oxygen is evenly distributed in the PEO coating.
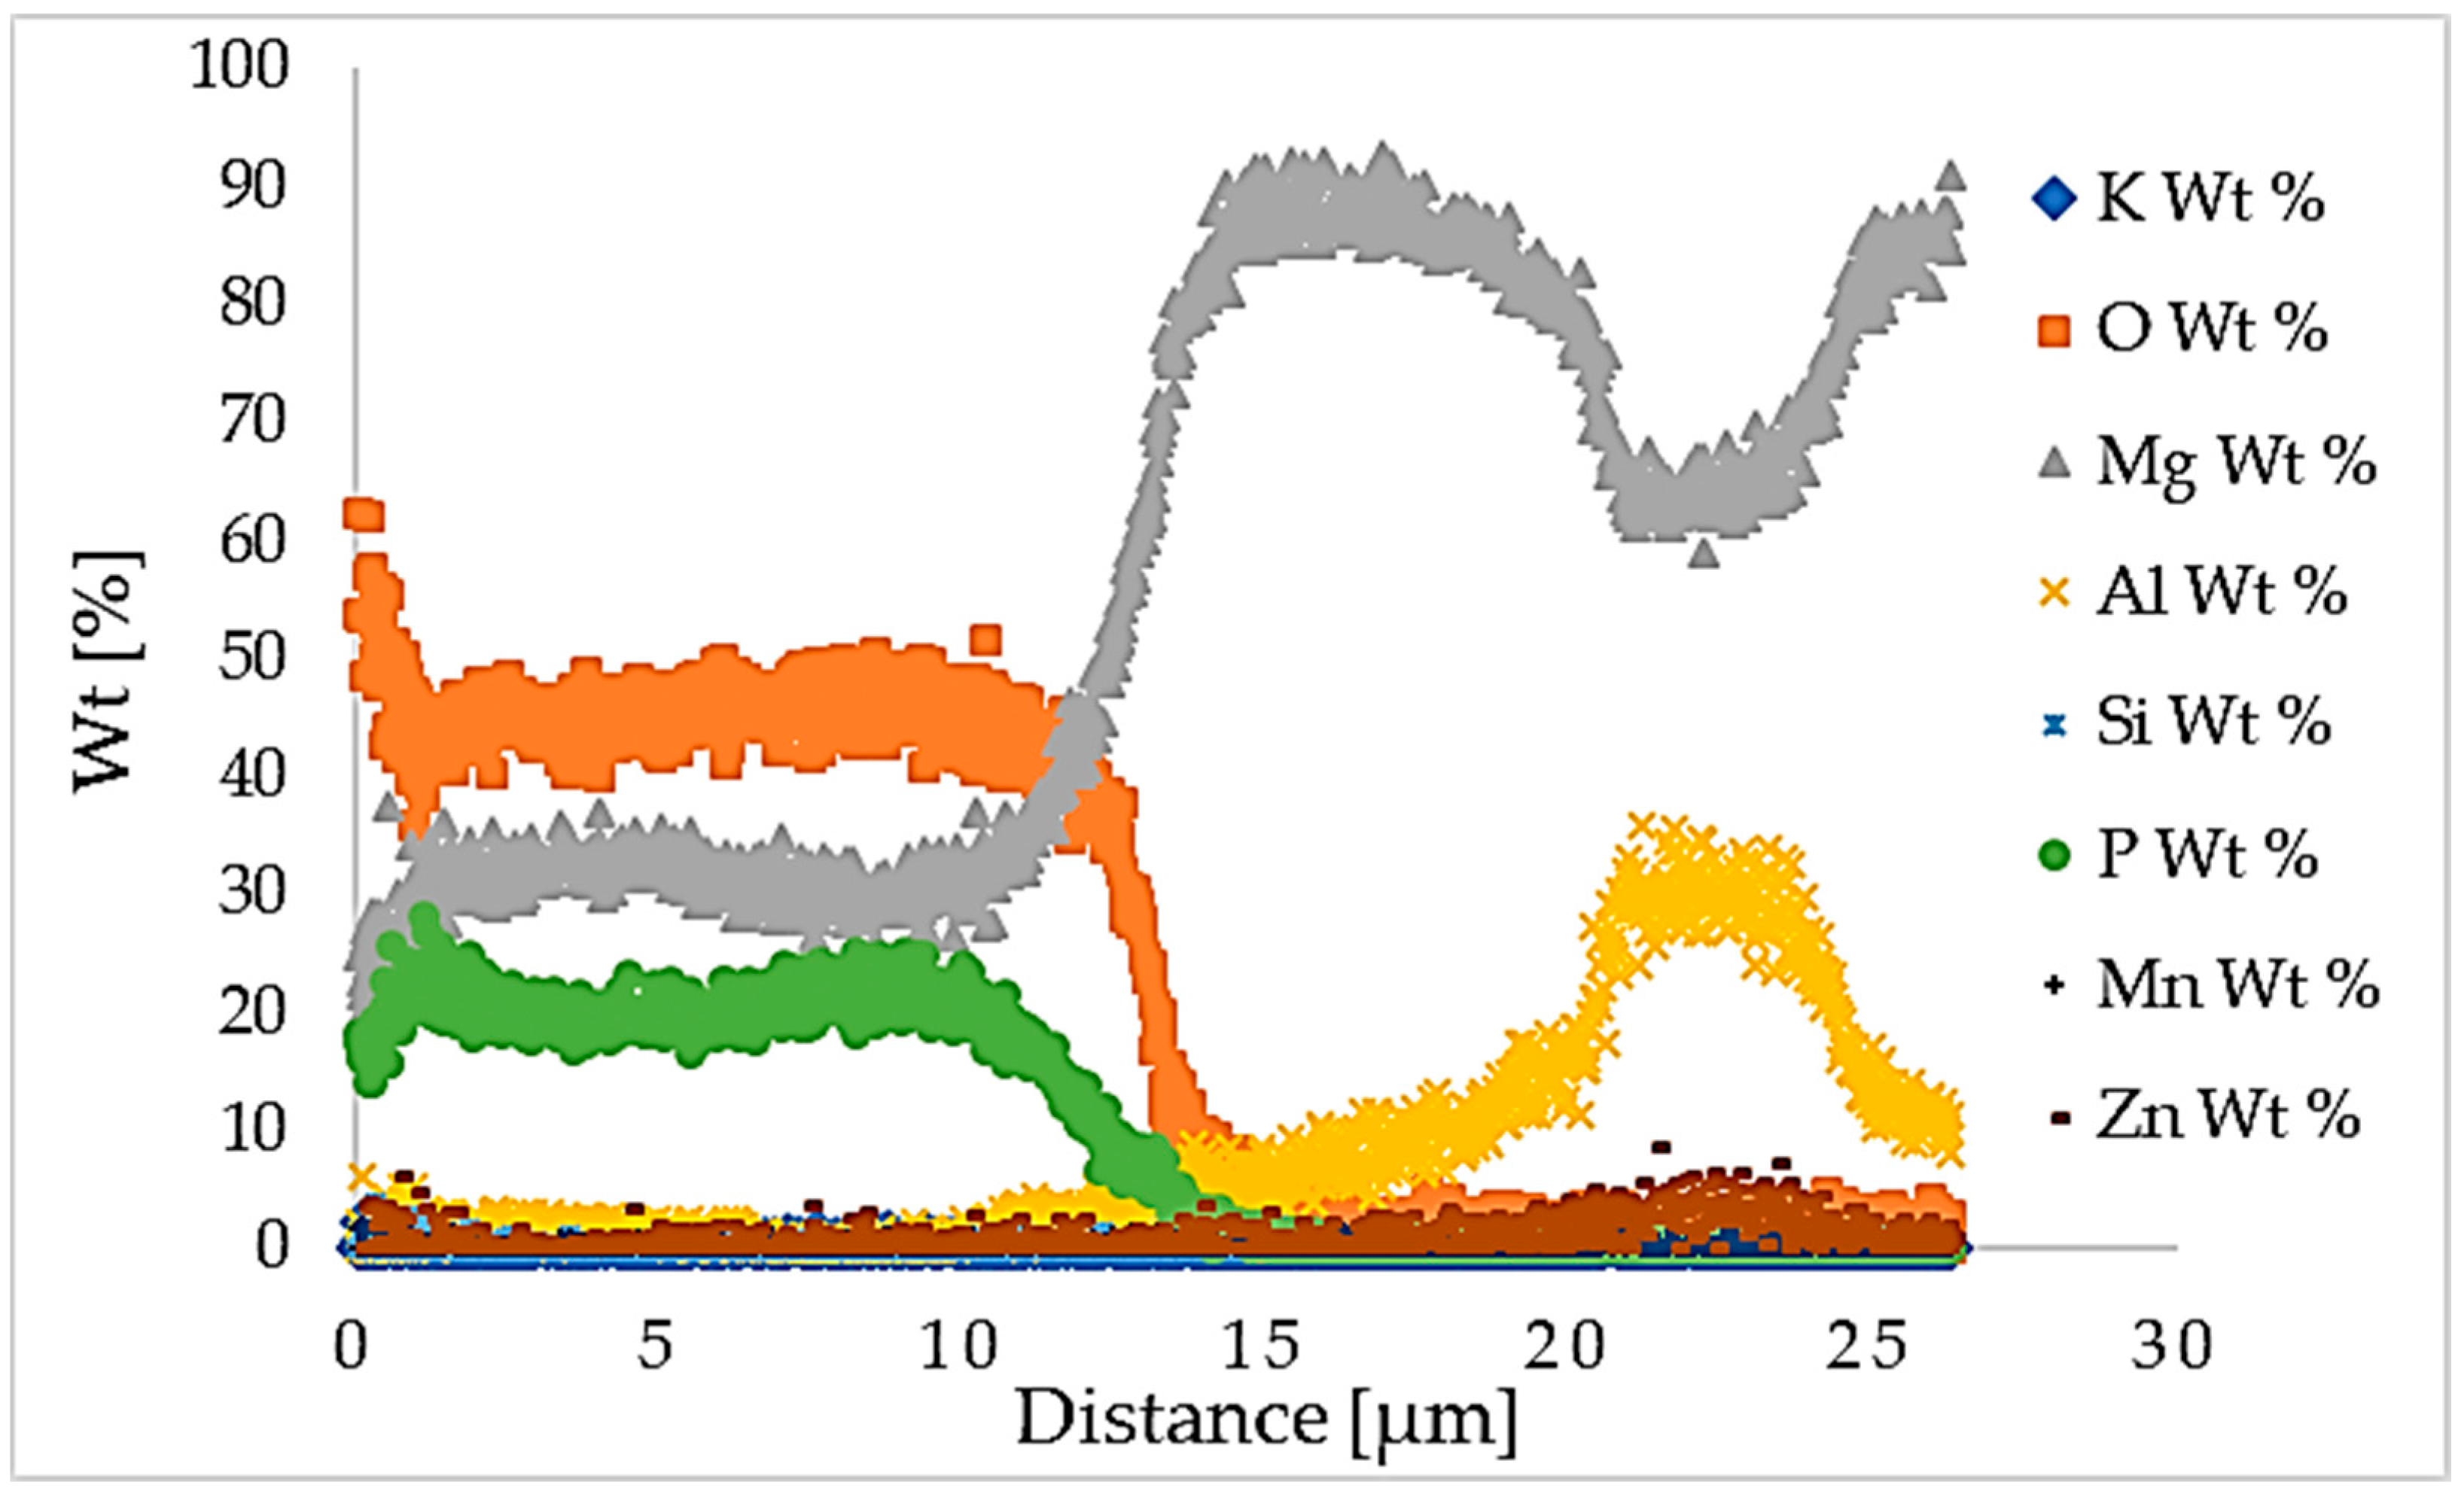
Figure 7 shows the graph of EDS line scan, which represents the total percentage content of elements in the AZ80 Mg alloy with PEO coating. The chemical composition of the PEO coating, with the main elements (oxygen, magnesium, and phosphorus), was confirmed by the weight percentage in the line scan graph.
The porous structure is a typical feature for PEO coatings. Basically, the amount and size of the pores are influenced by various aspects, such as the chemical composition of the coated material, the preparation time, and the concentration of certain elements added to the PEO bath. However, the largest pores are typical for sites consisting of intermetallic phases, which are associated with a higher occurrence of discharges. On the other hand, the presence of molten oxides in the cold electrolyte and the gas bubbles generated during discharges cause the formation of micropores and microcracks [
4,
17].
The average thickness and roughness parameters of PEO coatings are shown in
Table 2. From the average thickness values, it can be seen that sample 1200—PEO has the highest average thickness value. In contrast, sample 4000—PEO has the lowest average thickness value. From the results, it is clear that as the roughness of the base material increased, the thickness of the coating also increased. However, the PEO coating formed on the metal surface is not uniform. Therefore, it is difficult to say exactly whether the roughness parameters R
a and R
z have a significant effect on the coating thickness [
15]. In addition, the roughness parameters R
a and R
z gradually decreased with increasing grain size. This fact was clear even before the actual measurement.
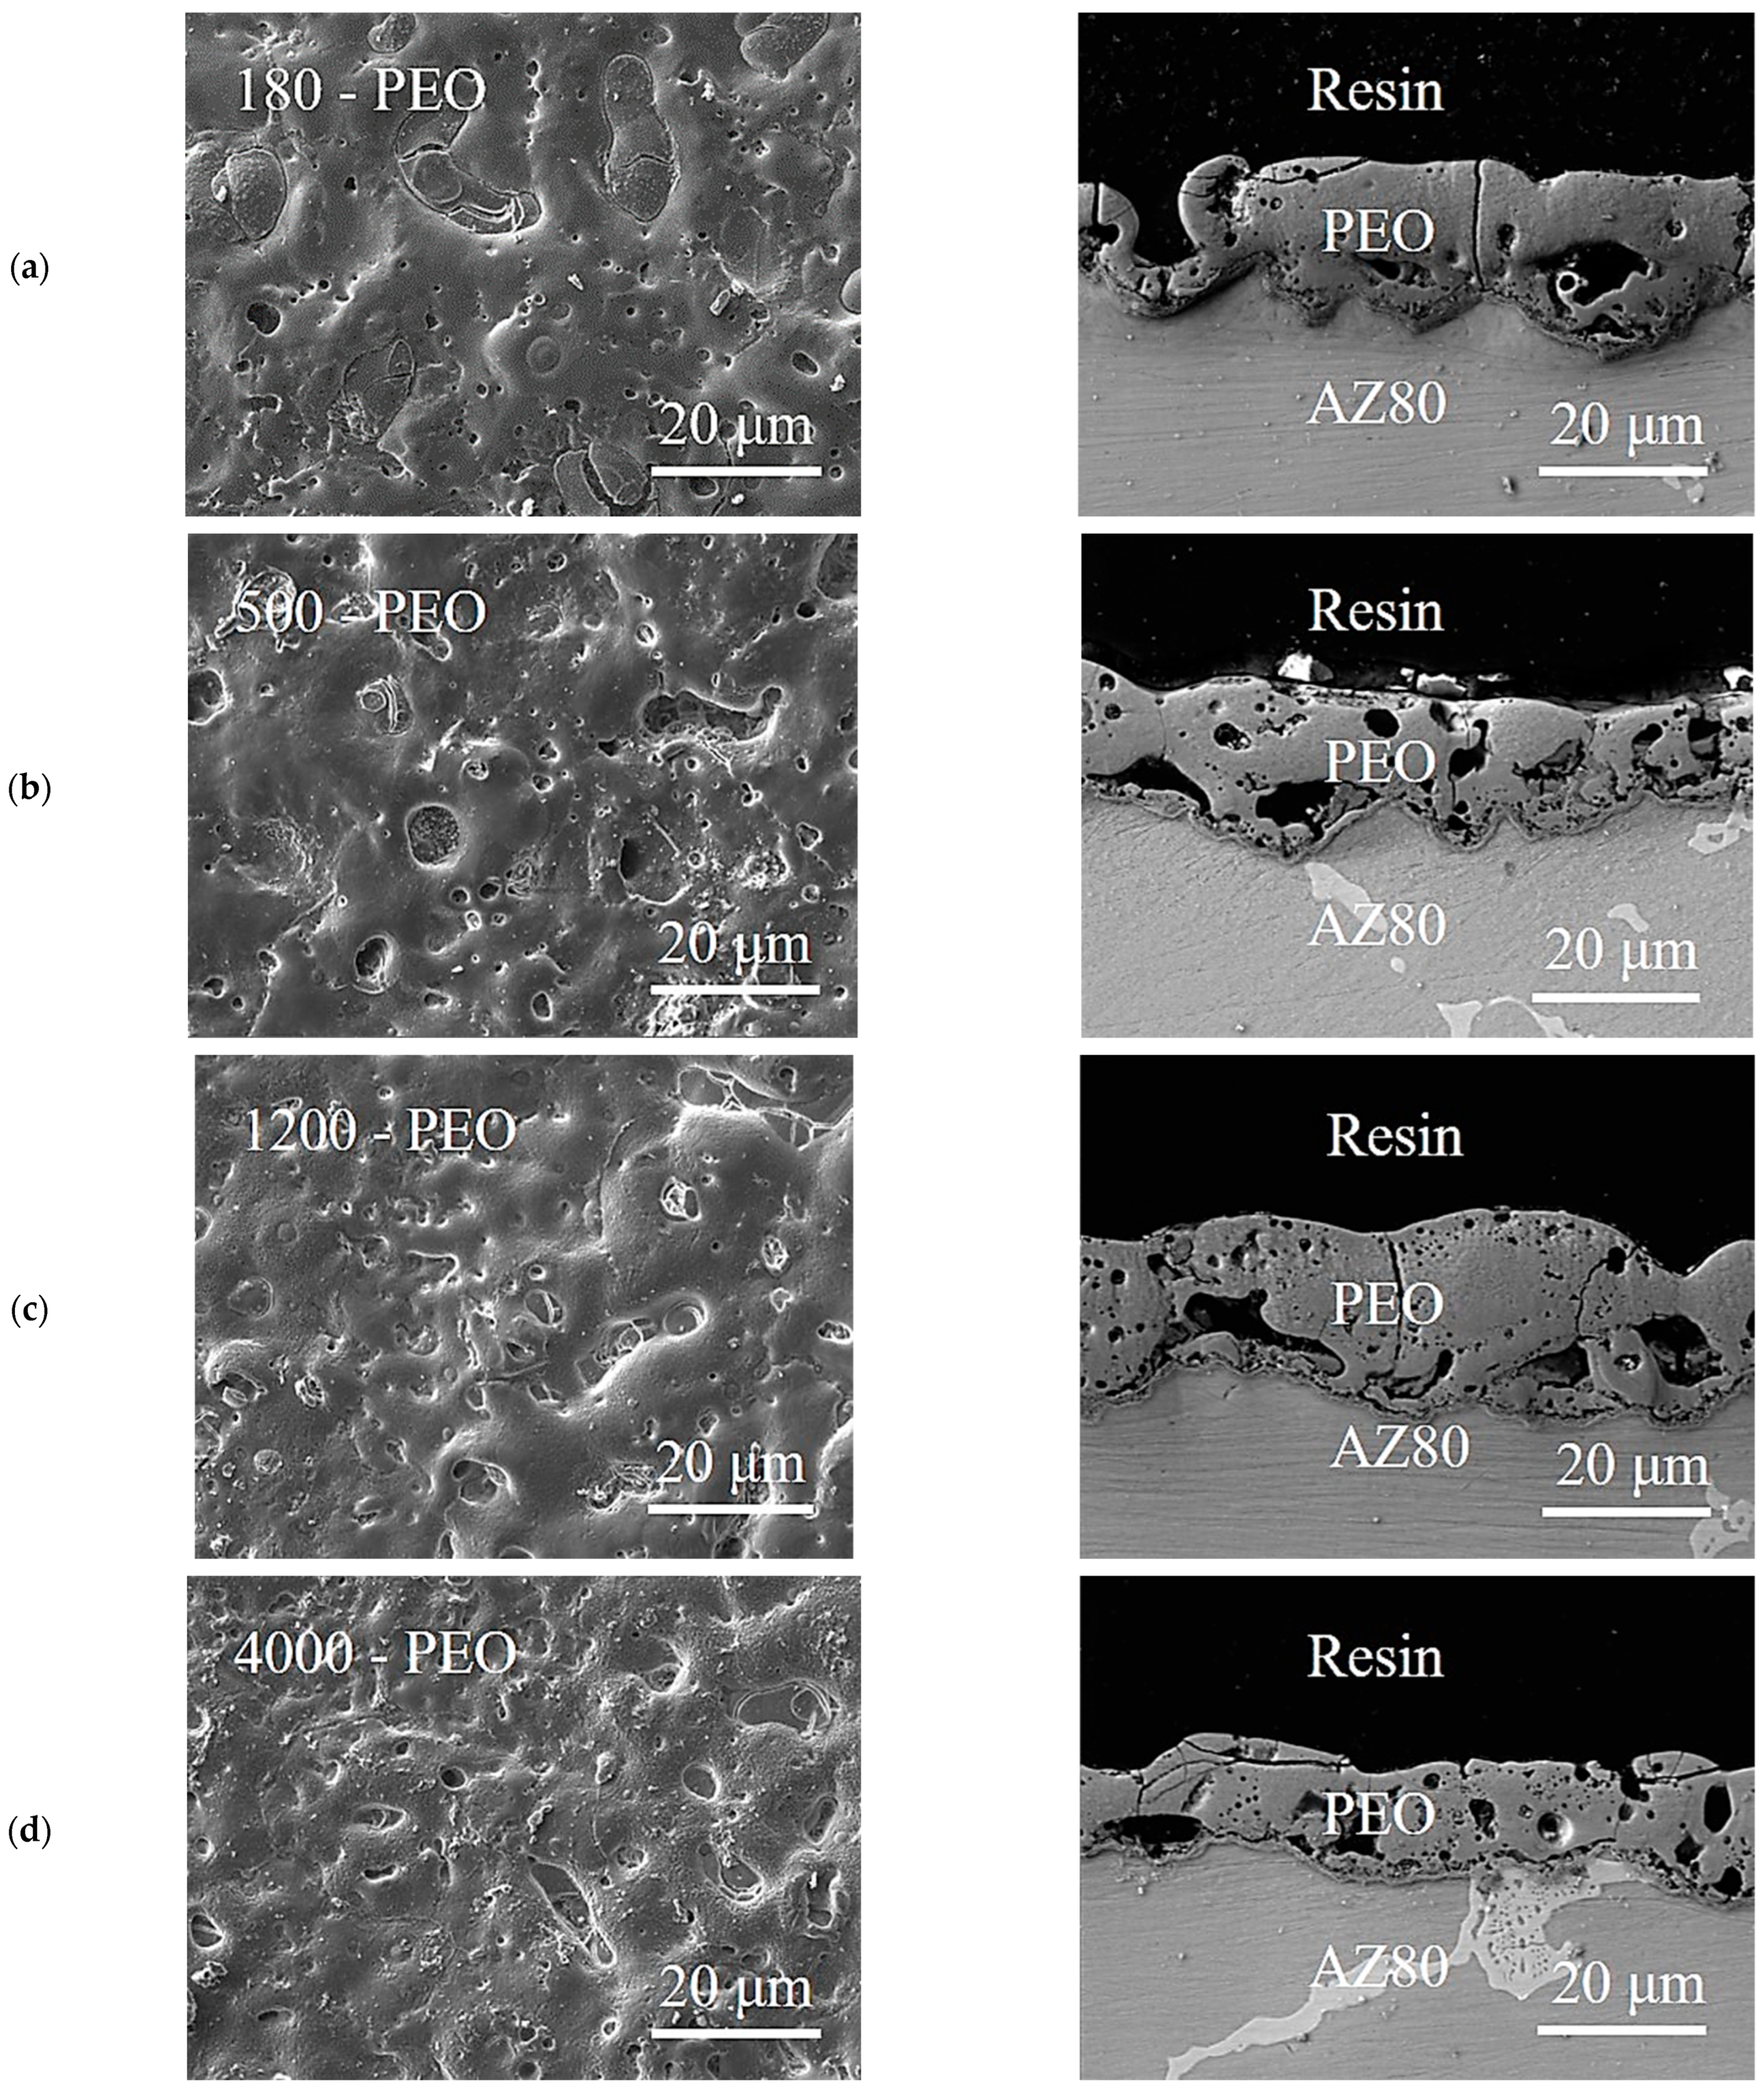
In
Figure 8a–d the surface morphologies and cross-sections of the PEO coatings with different roughnesses of the base material are shown. In both the surface morphologies and the cross-sectional images, pores and microcracks with different dimensions and shapes were observed in all samples. However, it is difficult to say whether the size of these drawbacks increases simultaneously with the surface roughness of AZ80. On the other hand, their formation is a typical feature of the PEO process and is caused by oxygen production, which may be associated with crystallization of amorphous elements in the inner film. In the case of magnesium alloys, it is unlikely that high porosity of PEO coatings can be prevented. The electrical parameters play an important role in PEO formation, so it is very difficult to change them without changing the behavior of the PEO coating [
33]. The pore size is affected by many factors, such as the applied current density, the duration of the PEO bath itself, and the applied voltage also plays an important role [
34]. During the growth of PEO coating on Mg alloys, the main electrochemical reactions (2)–(5), which take place at the interface of the coating using a phosphate electrolyte, form protective compounds Mg(OH
2), MgO, and ions in the form of Mg and
[
35].
One of the main objectives of this research was to determine the effect of mechanical pretreatment on surface roughness and thickness of PEO coatings applied on AZ80 magnesium alloy. According to the results obtained by the SEM images (
Figure 8a–d), it is obvious that the porous structure with a huge amount of pores, cracks, and other defects was present in the case of all samples that were treated with PEO coatings (
Figure 9). The appearance of these defects on the PEO coating itself is a common feature of the PEO process. This is due to the fact that the entire formation of the PEO coating is accompanied by various chemical reactions that are the direct result of the voltage, the applied constant current, and an increasing temperature of the PEO electrolyte. The thickness of the PEO coating also has a great influence on the corrosion behavior of the magnesium alloy. However, the formation of an adhesive oxide ceramic coating is the best way to produce adequate surface protection in the case of magnesium alloys. This finding is basically supported by many studies [
36,
37].
In our case, the PEO coating itself consists of phophate compounds, especially Mg
3(PO
4)
2 and PO
4−3, which tend to deposit on the oxide surface. Thanks to these chemical particles, the corrosion behavior of the magnesium alloy is improved. Moreover, the combinations of compounds such as Mg(OH)
2 and MgO are also involved in the formation of the protective film [
38].
3.5. Corrosion Testing—Electrochemical Impedance Spectroscopy of Variously Pretreated Samples and Samples with PEO Coatings
Before the actual PEO process, the as-cast samples of Mg alloy AZ80 with ground surfaces—p180, p500, p1200 and p4000, respectively—were subjected to electrochemical impedance spectroscopy (EIS) measurements in 0.1 M NaCl solution. The results of electrochemical corrosion characteristics for ground and ground + PEO surfaces are shown in
Figure 10a,b,
Figure 11a,b,
Figure 12a,b and
Figure 13a,b. Analysis of these values was performed using Nyquist plots by a simple Randels circuit with one capacitive loop and a more complex circuit with two capacitive loops.
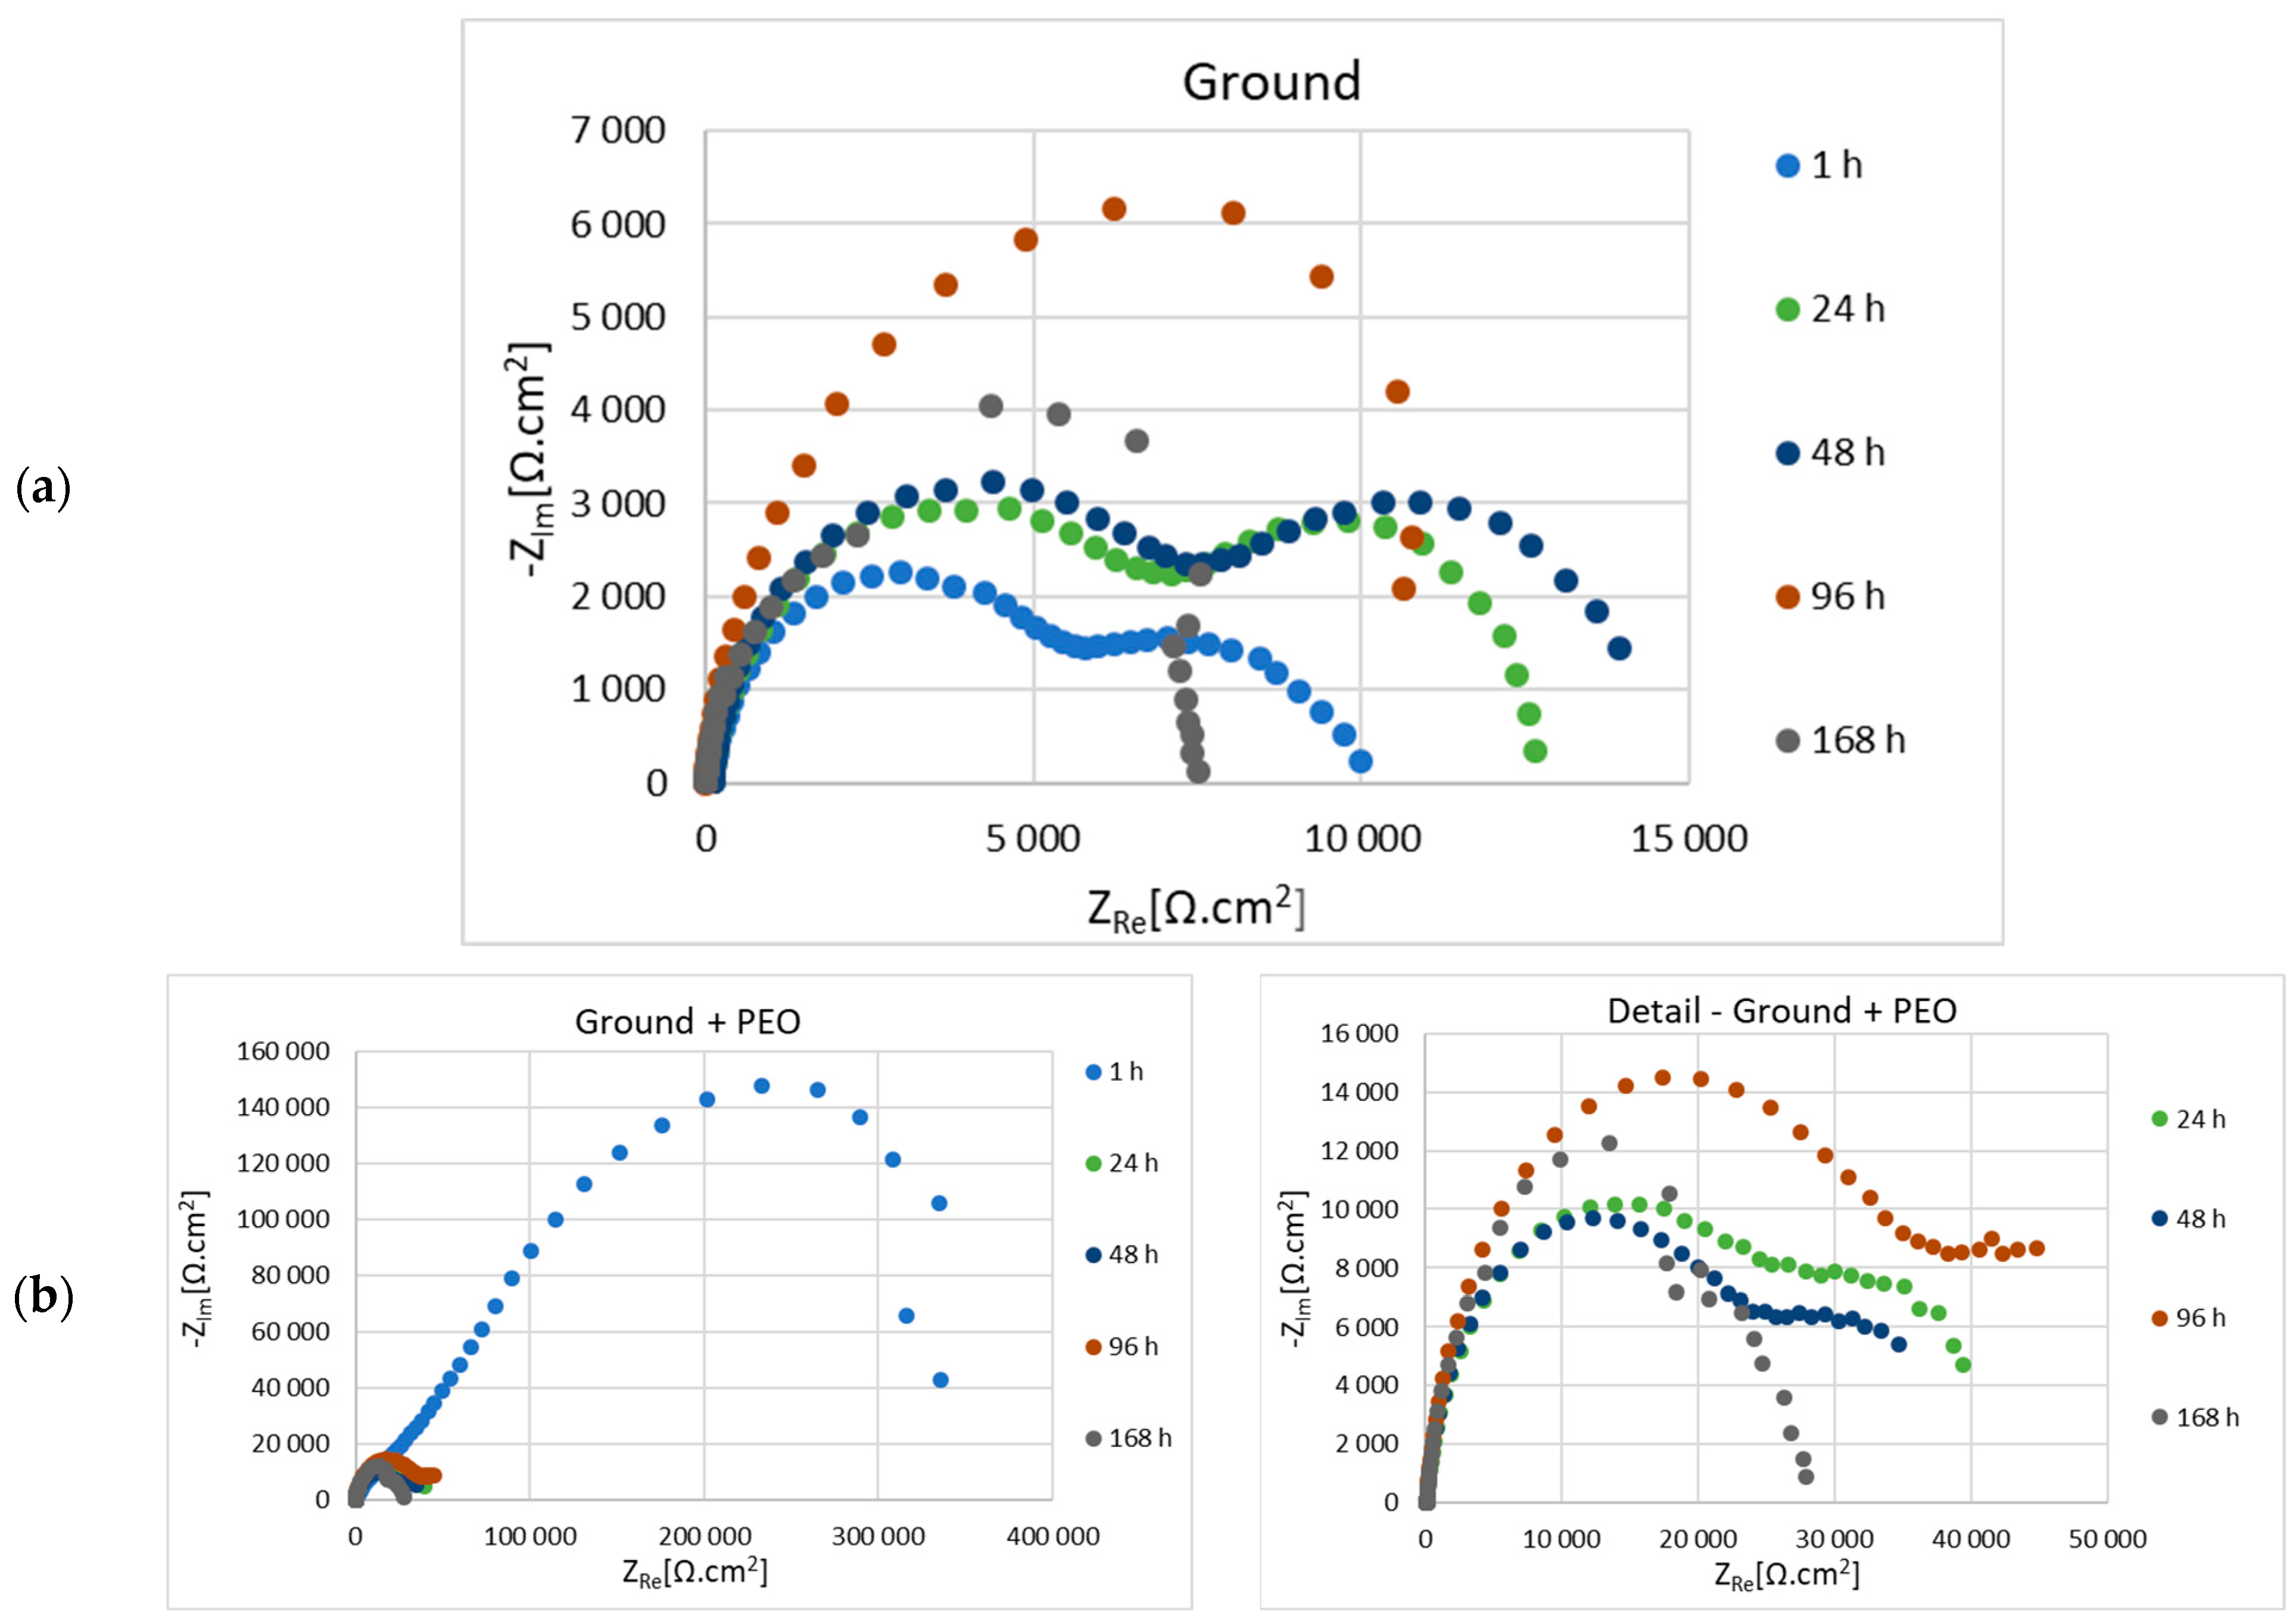
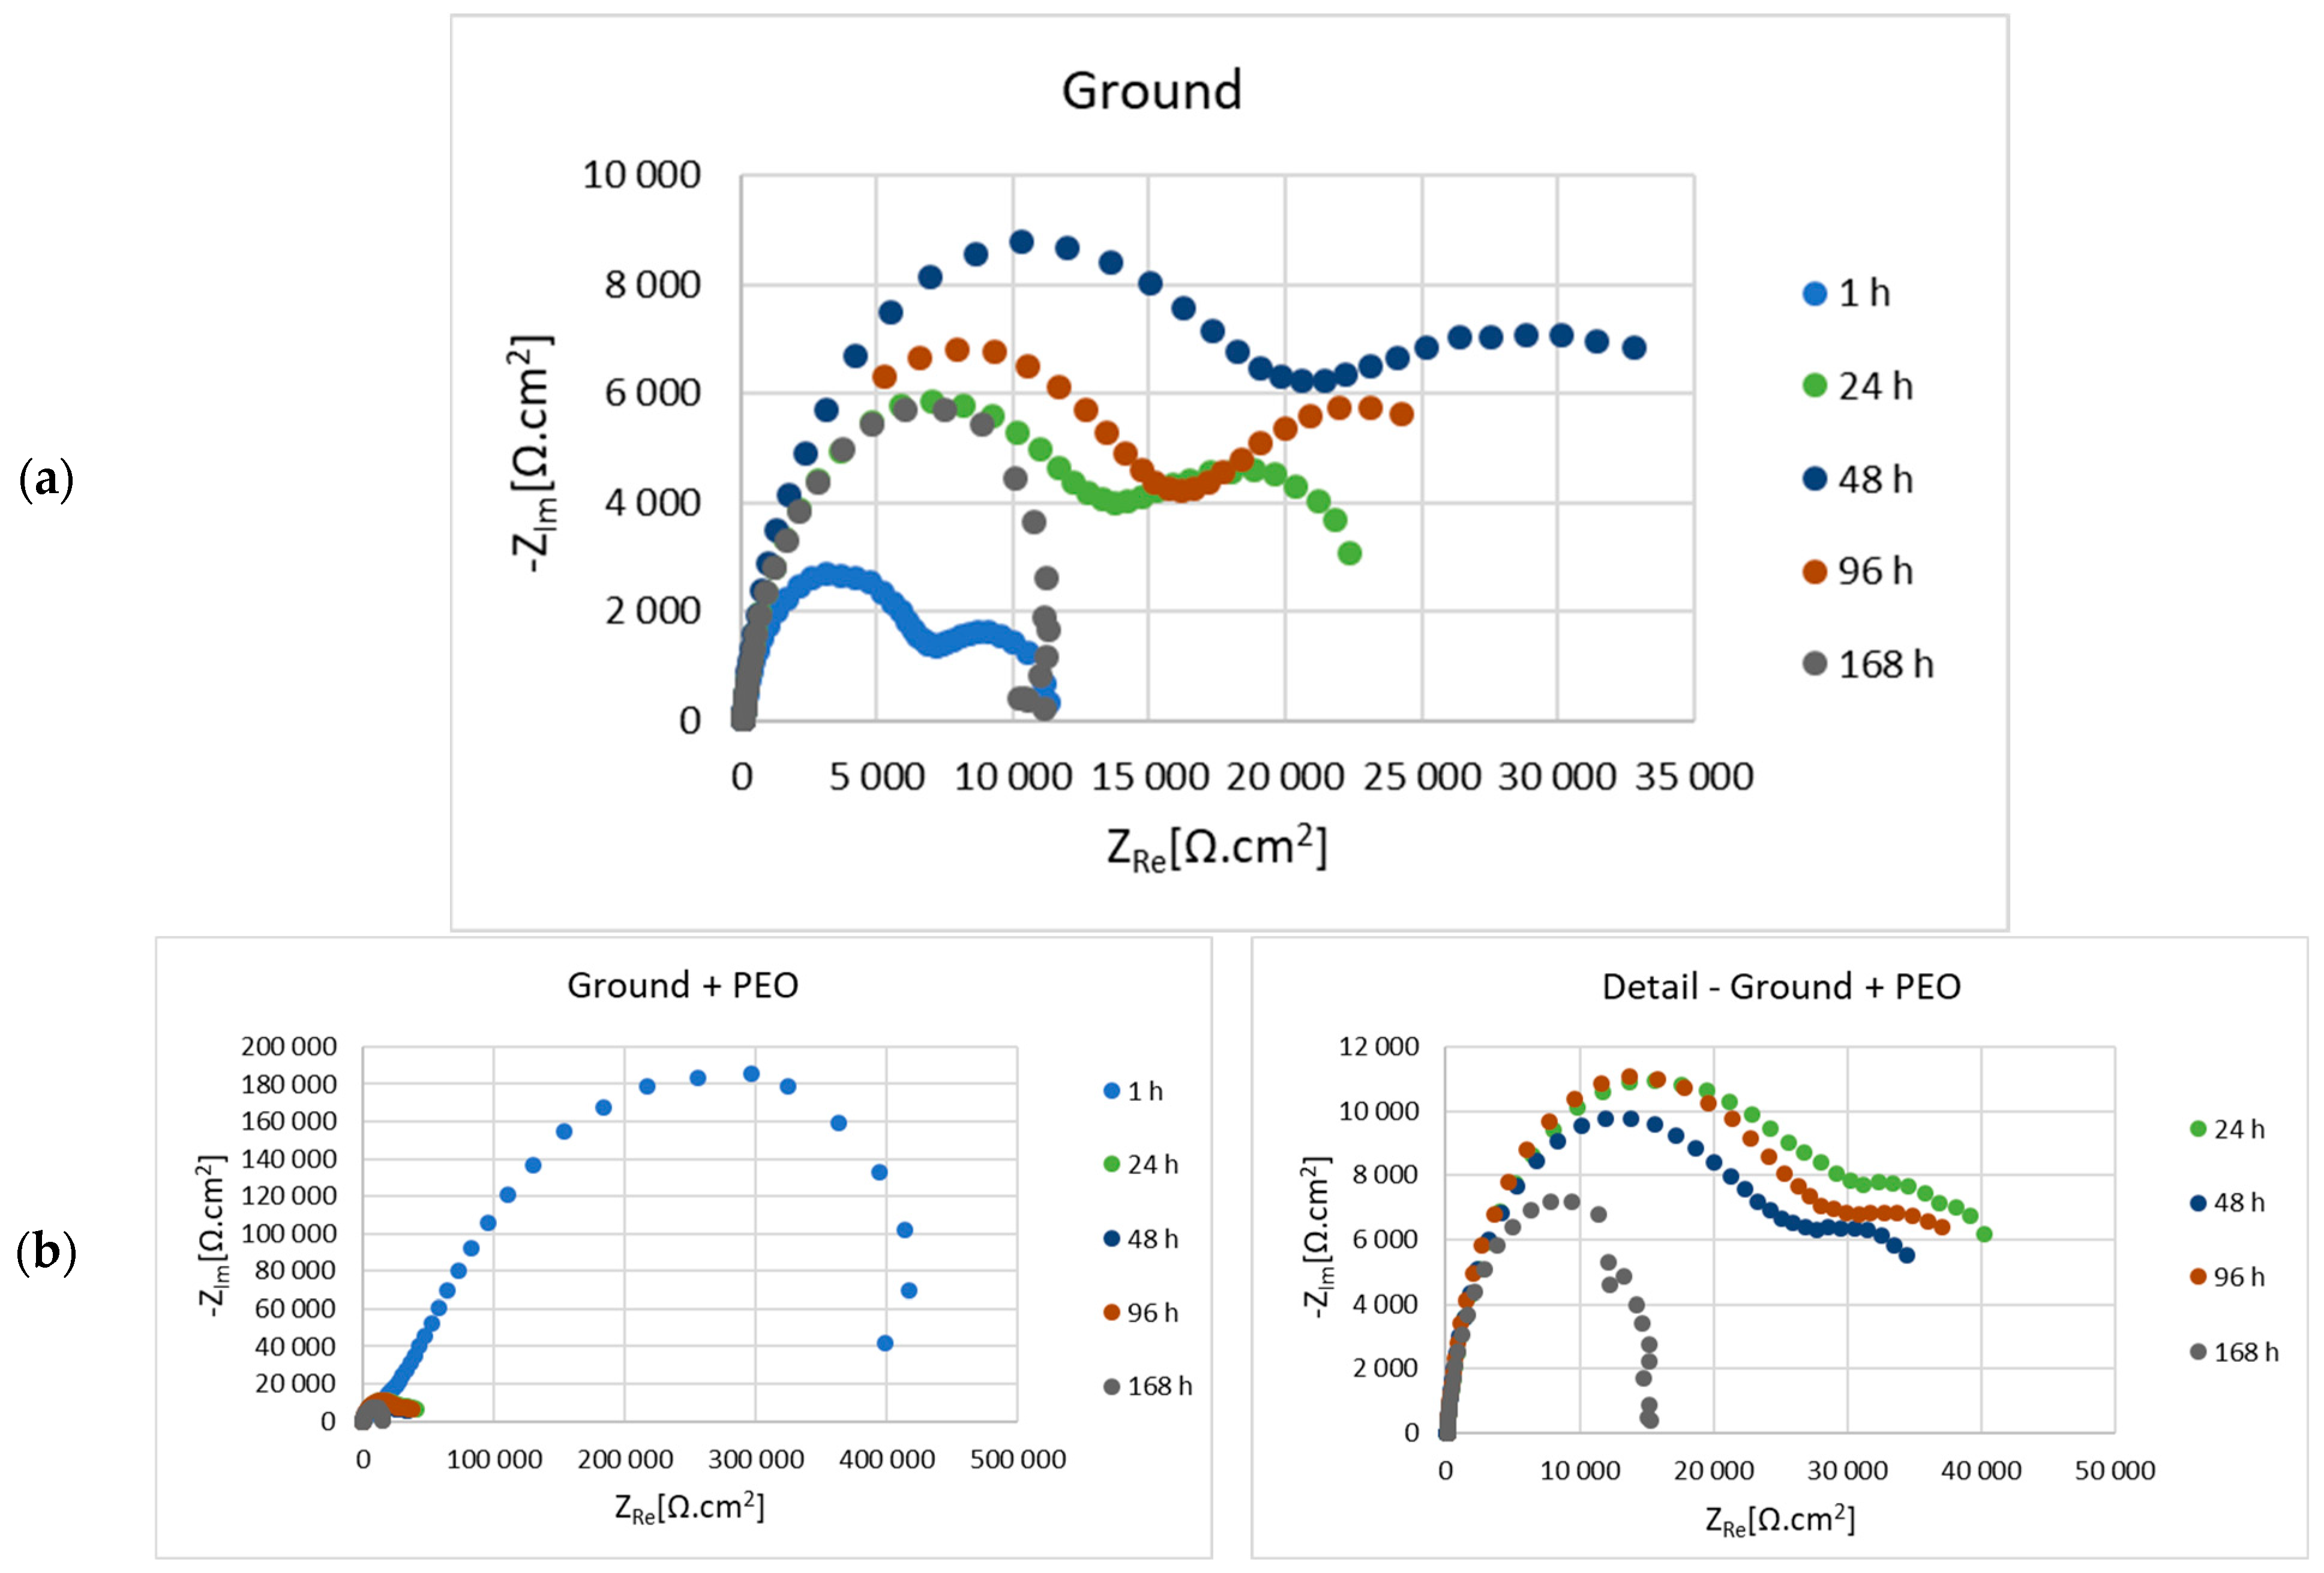
Nyquist diagrams for 180—ground and 180—ground + PEO AZ80 are shown in
Figure 10a,b, and the corresponding values of electrochemical properties are given in
Table 3 and
Table 4. From the comparison of the ground and coated surfaces, the highest value of polarization resistance (Rp) (314,735 Ω.cm
2) was found after 1 h exposure for the surface with PEO coating. Despite this fact, in the following phases, both types of surfaces are represented by increasing and decreasing resistance in a zig-zag shape. Nevertheless, in the last measurement, a higher value of Rp (36,526 Ω.cm
2) was obtained from the coated surface.
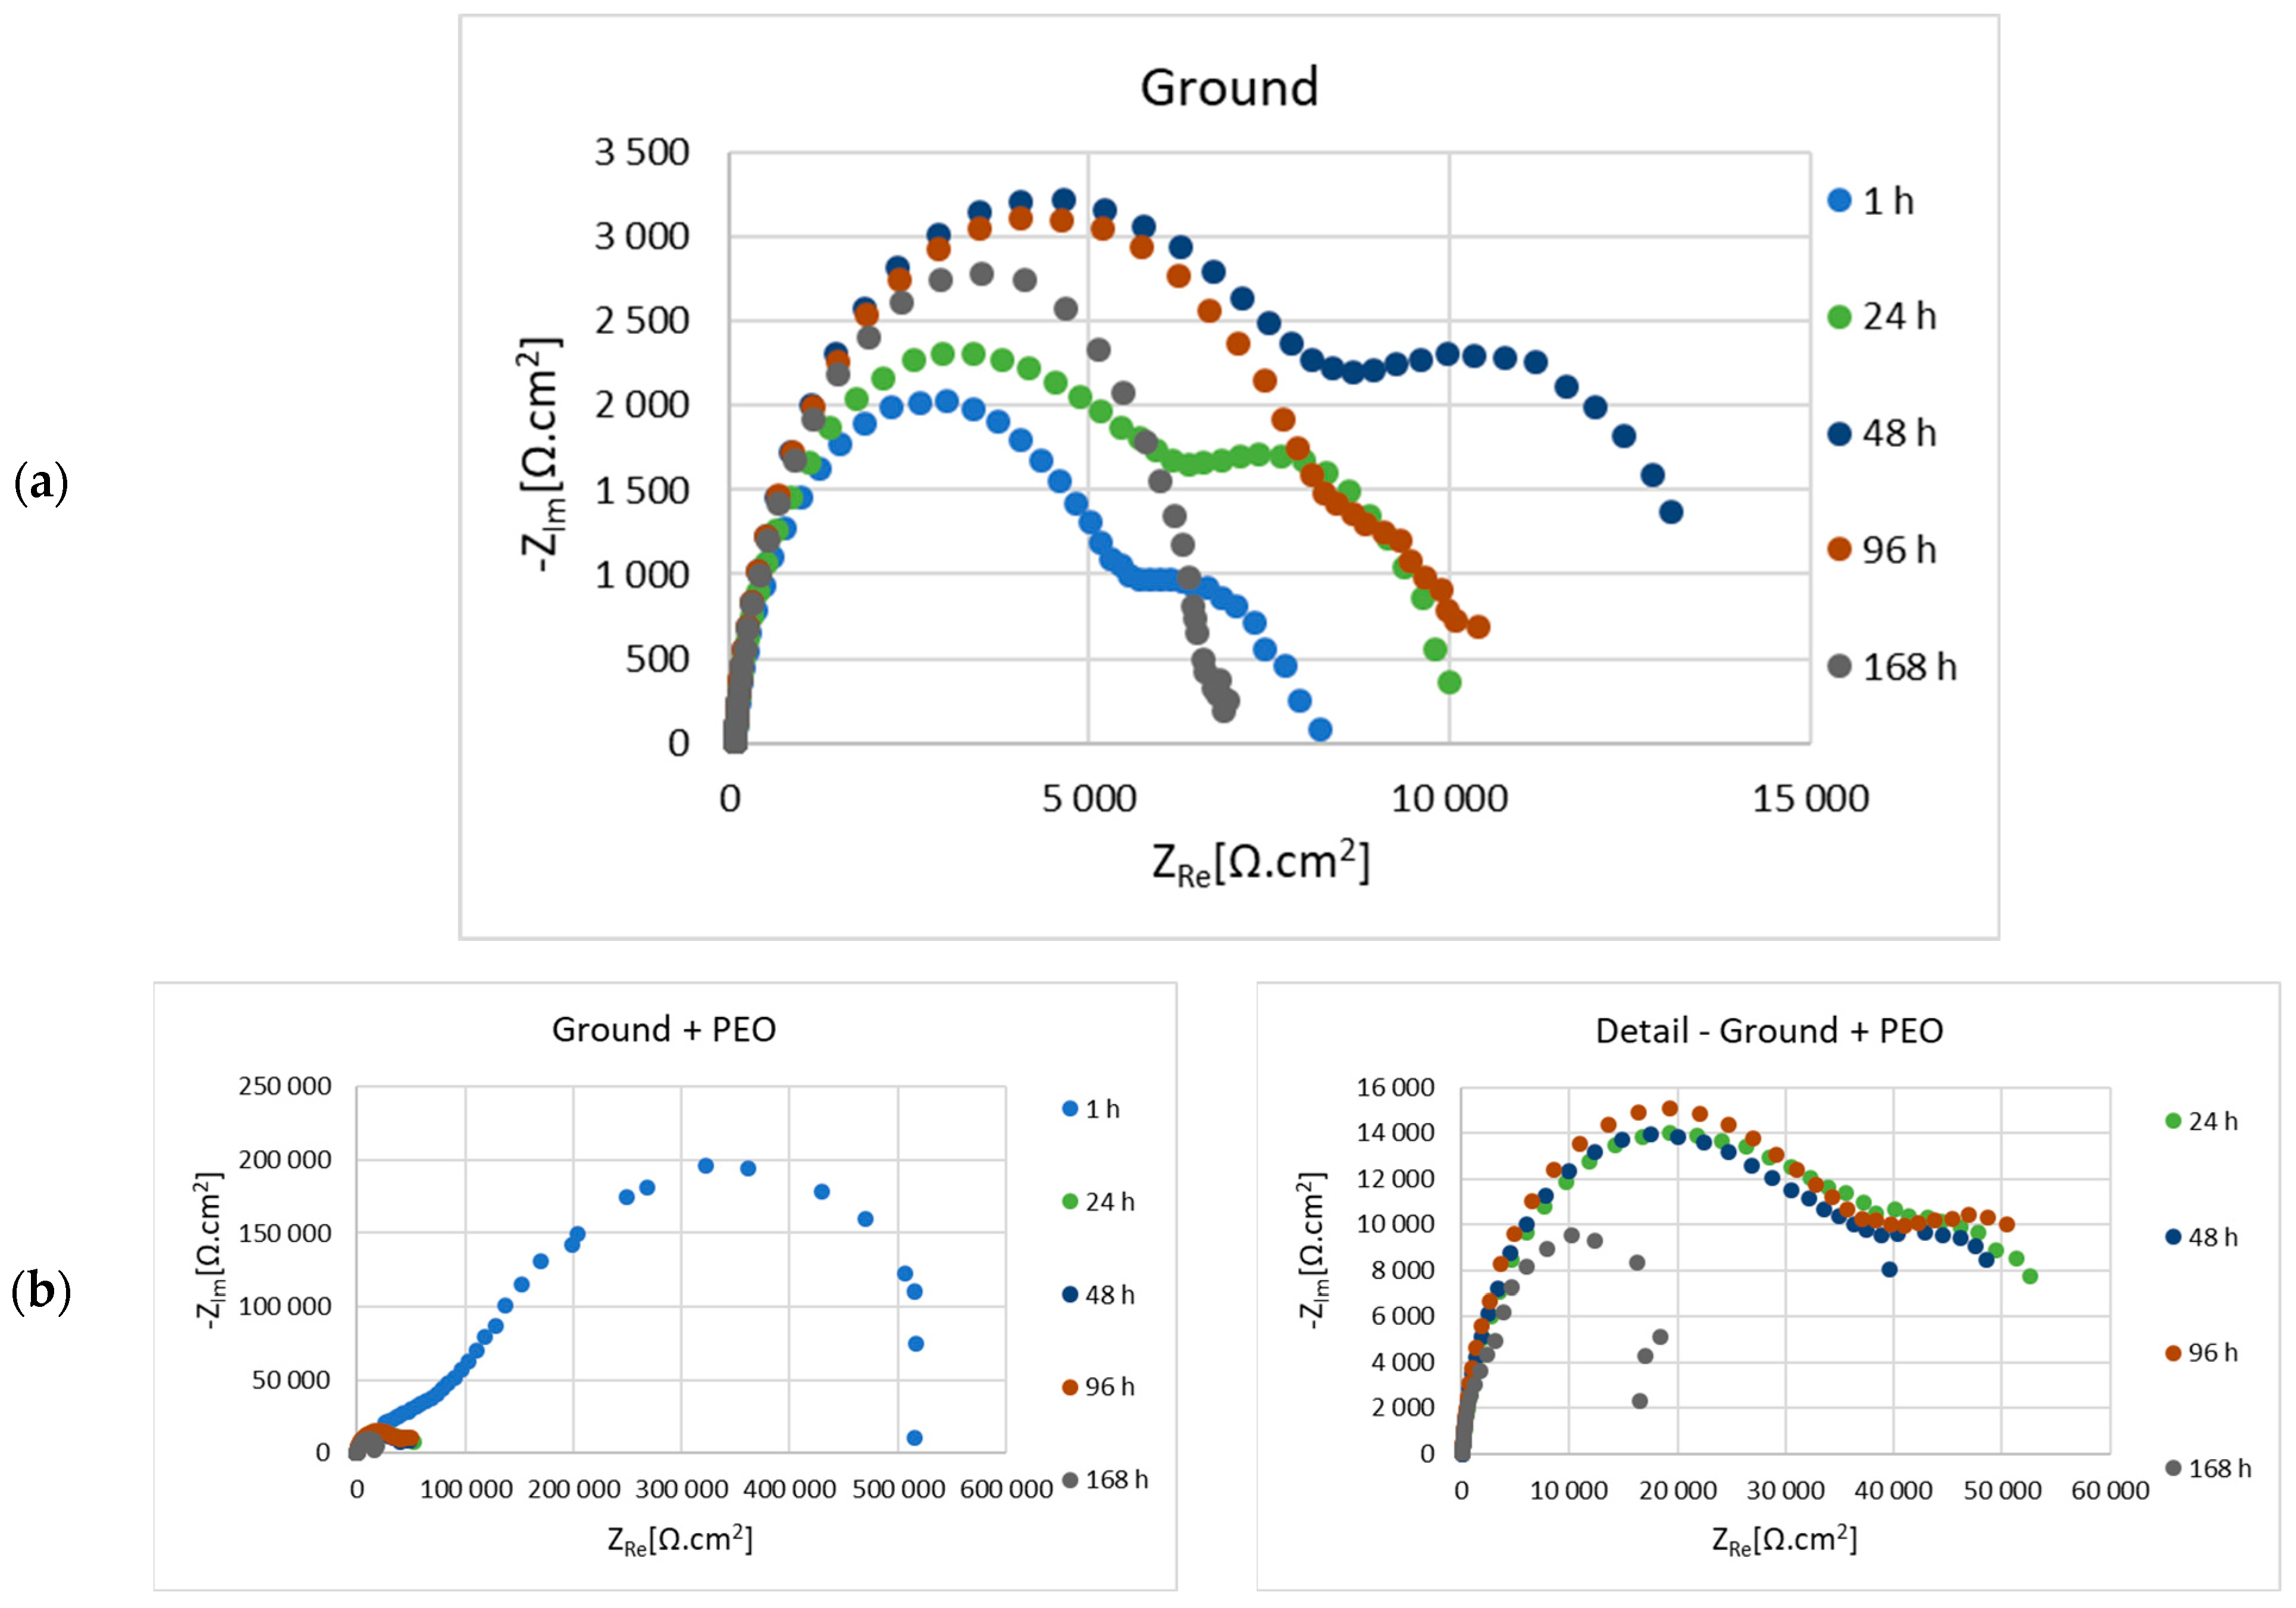
Figure 11a,b shows the Nyquist plots for the 500—ground and 500—ground + PEO samples, and the values of the electrochemical corrosion characteristics are shown in
Table 5 and
Table 6, respectively. The higher value of Rp (463,127 Ω.cm
2) after the initial phase is observed for the sample with PEO coating. The trend of increasing and decreasing resistivity values is also observed in this case. The resulting Rp value was higher for the coated sample (13,376 Ω.cm
2), almost three times higher than the uncoated sample (5483 Ω.cm
2).
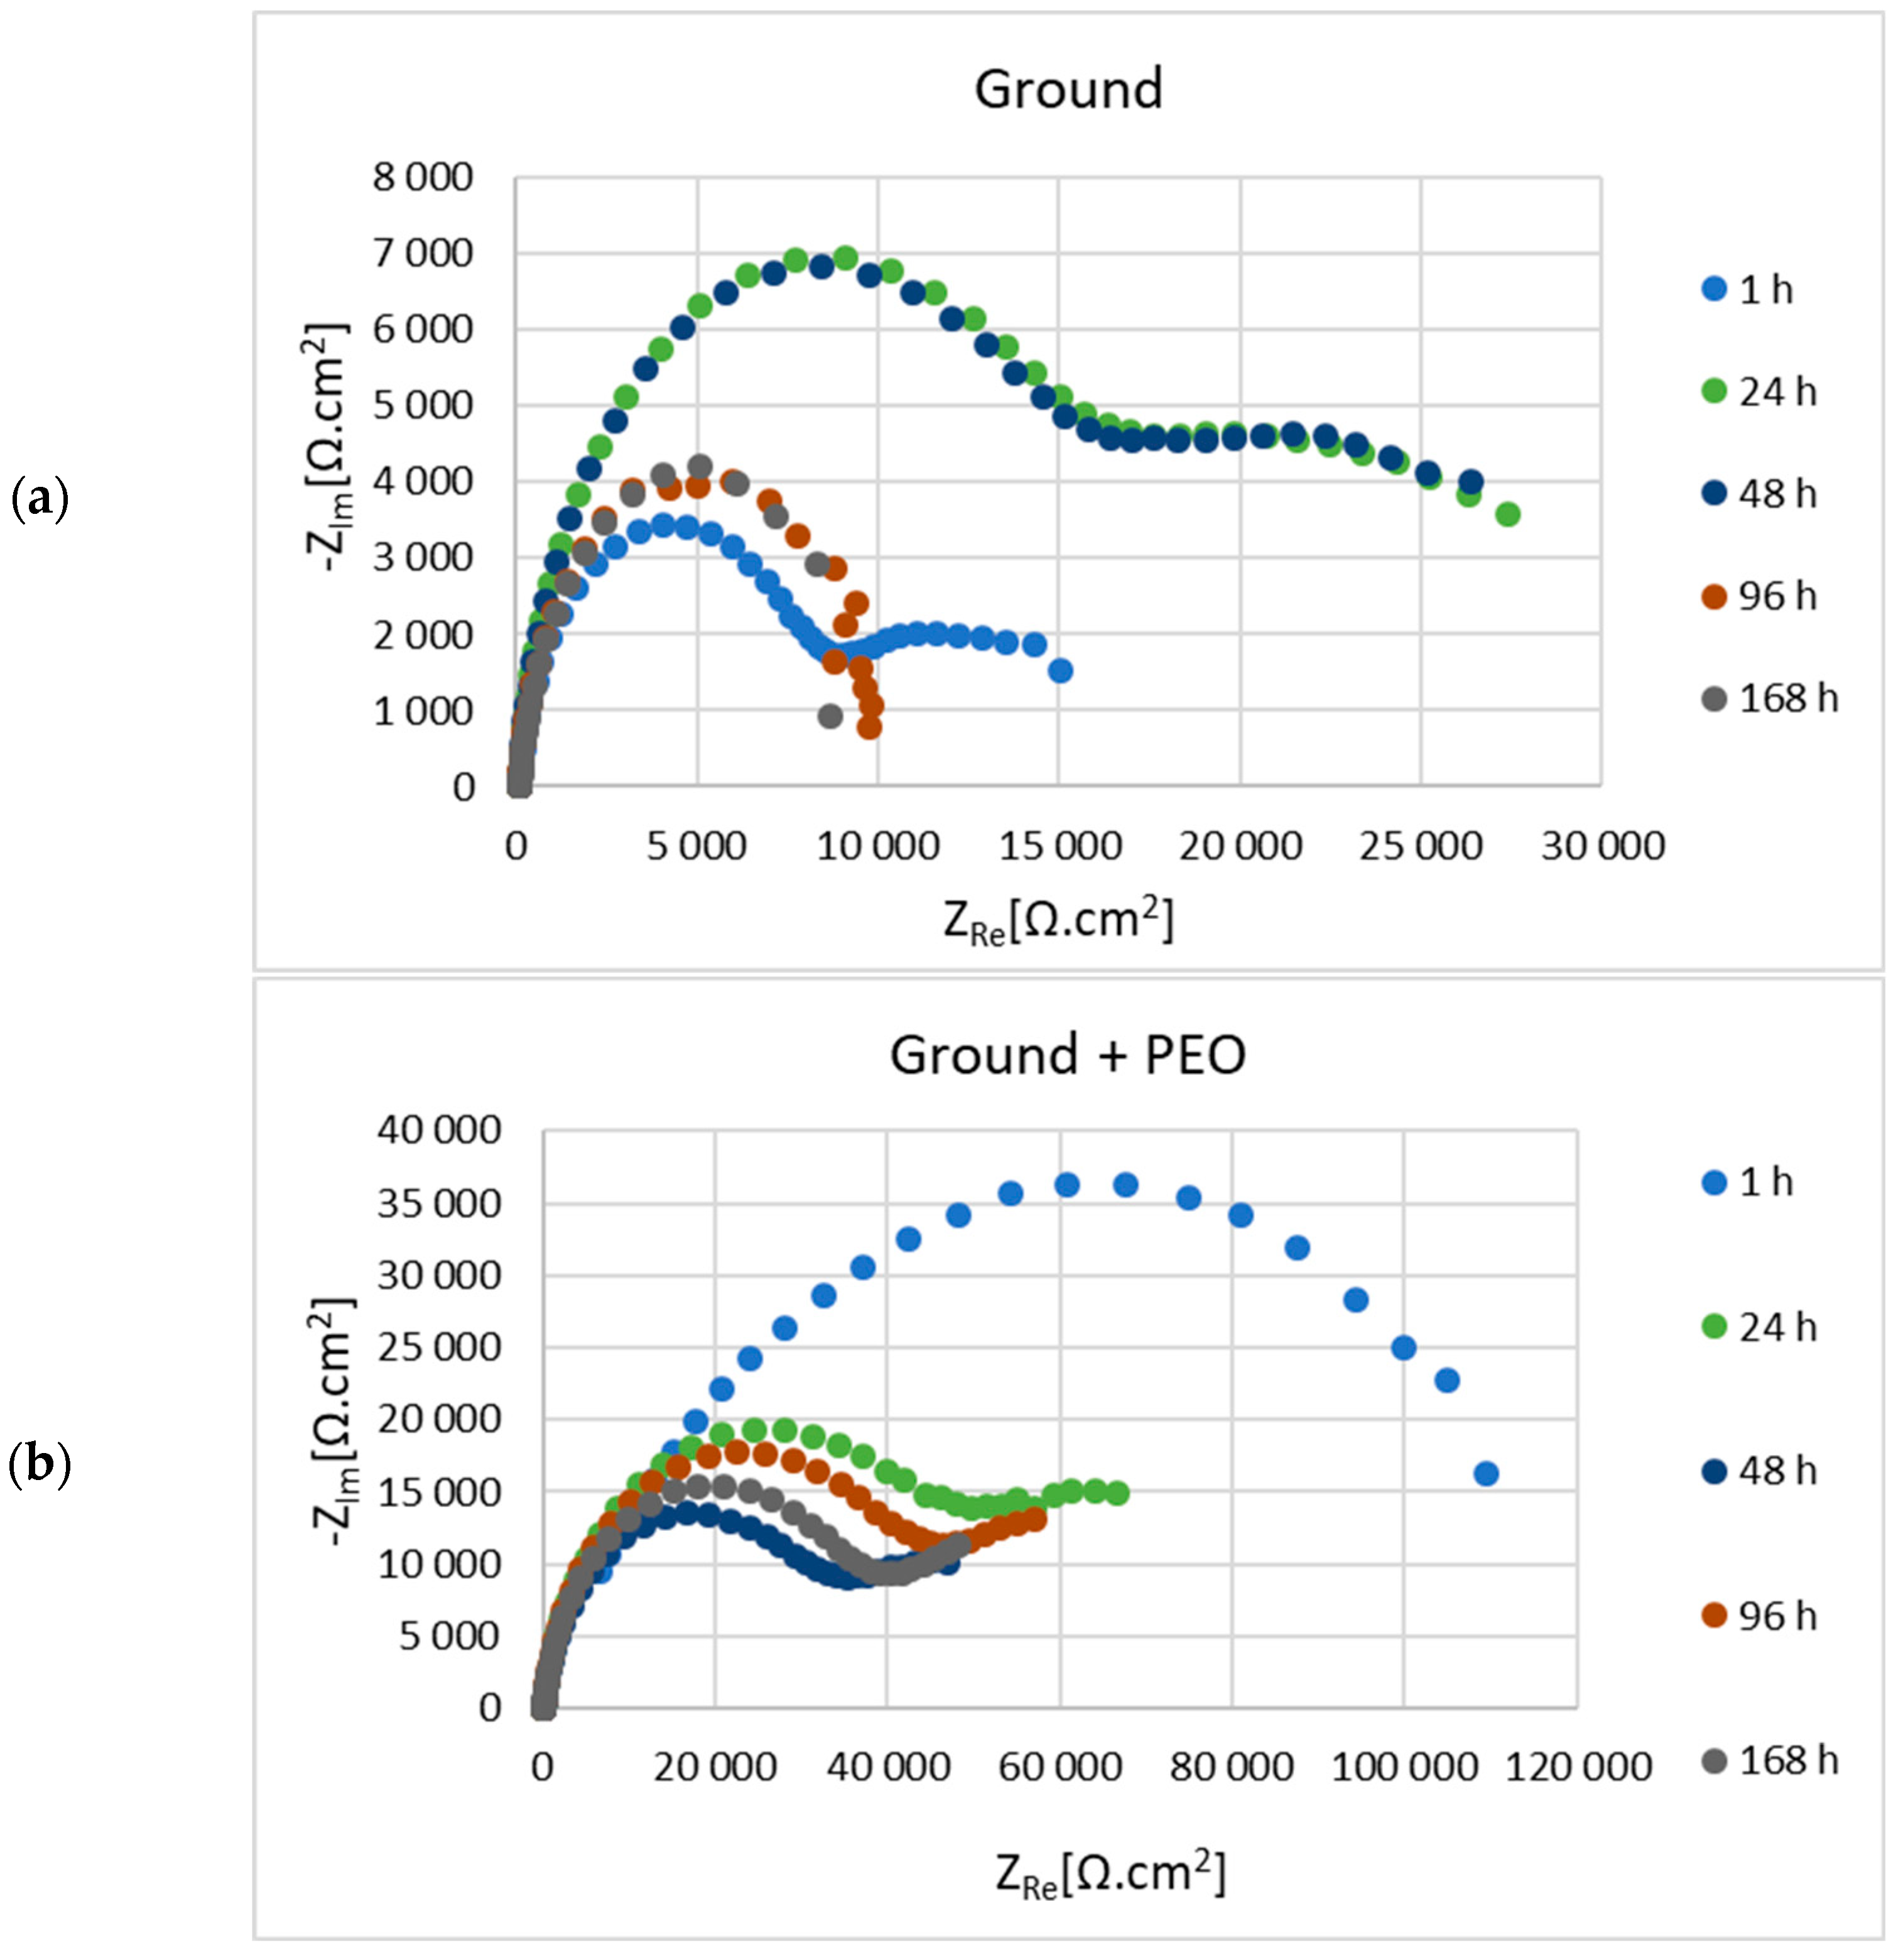
In
Figure 12a,b is shown Nyquist plots for the 1200—ground and 1200—ground + PEO samples, while the values of the evaluated electrochemical properties are listed in
Table 7 and
Table 8. The value of Rp (127,095 Ω.cm
2) is 9 times higher in the case of sample 1200—ground + PEO sample than in the case of 1200—ground (13,537 Ω.cm
2) after 1 h of exposure to 0.1 M NaCl environment. The Rp value is characterized by an increasing and decreasing trend for the uncoated and coated samples, as was observed for the previous samples. However, the final Rp value of the sample 1200—ground + PEO is 52,580 Ω.cm
2, which is 7 times higher than sample 1200—ground.
Figure 13a,b shows the Nyquist plots for the 4000—ground and 4000—ground + PEO samples.
Table 9 and
Table 10 listed the values of the electrochemical corrosion properties. The highest value of Rp = 501,464 Ω.cm
2 was obtained in the initial stage of exposure from sample 4000—ground + PEO. The trend with increasing and decreasing Rp value remained the same. After the last exposure phase, a higher Rp value (13,103 Ω.cm
2) was obtained from sample 4000—ground + PEO.
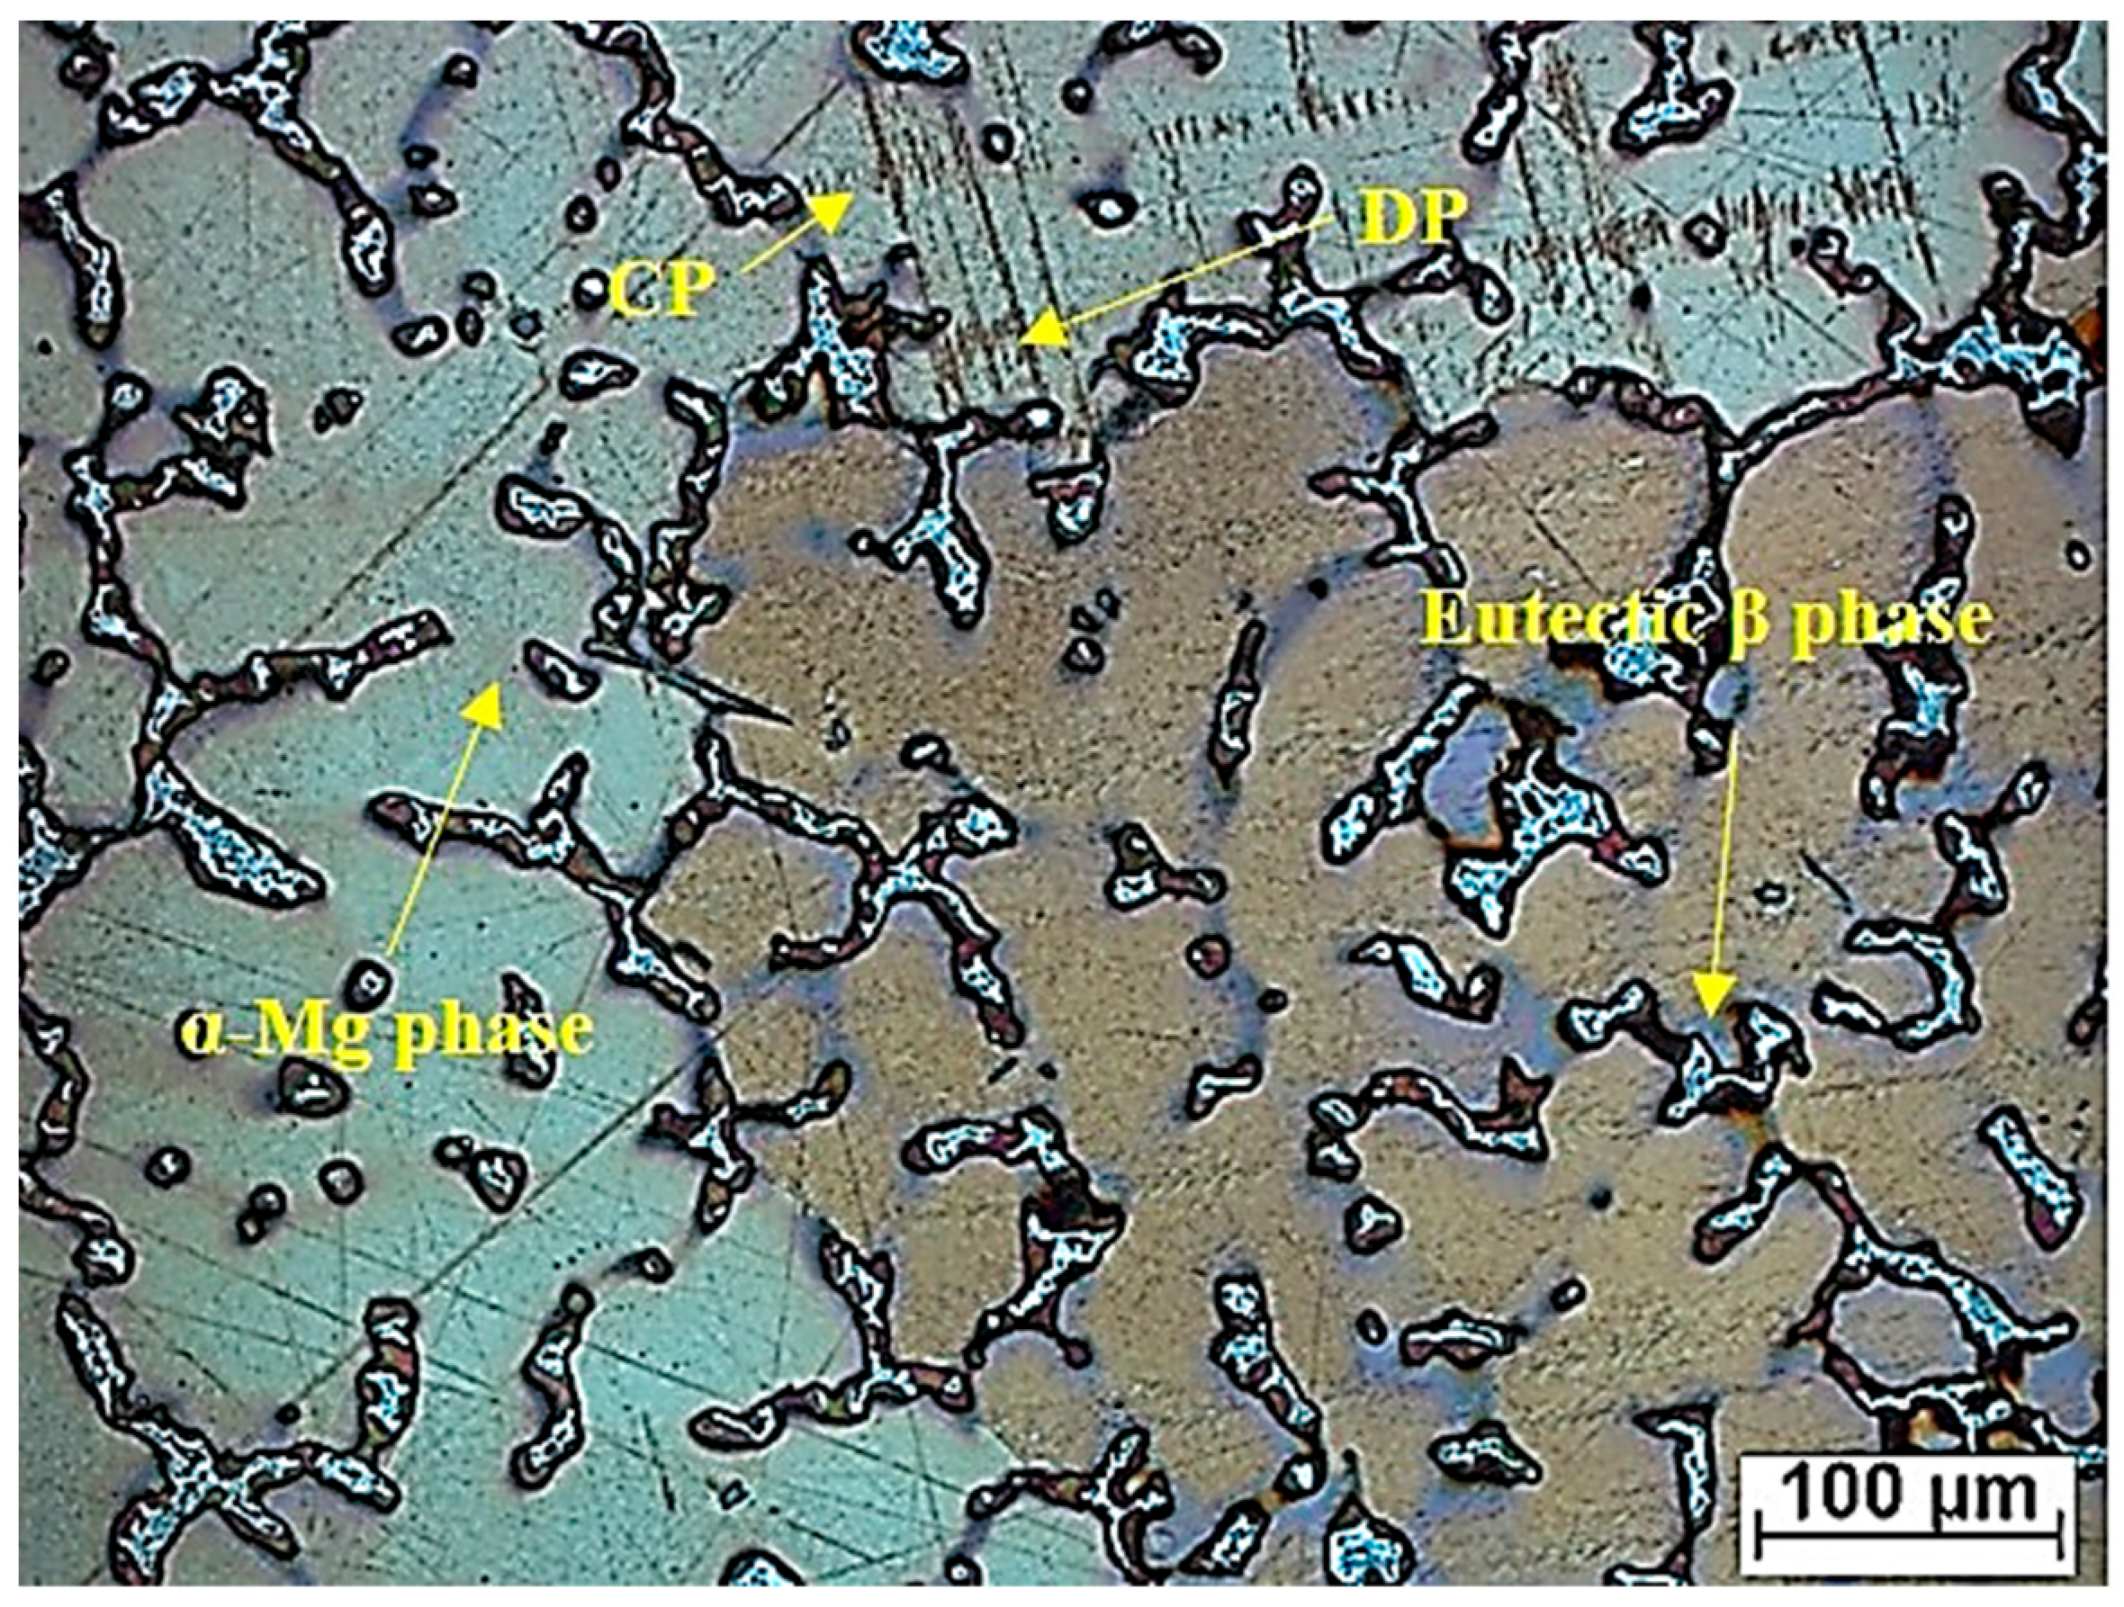
Nowadays the most commonly used magnesium alloys are those alloyed with aluminum, zinc, and manganese. The content of impurities such as Fe, Cu, and Si should not exceed the percentage range of 0.4—0.6% [
39]. The element aluminum plays a very important role in the corrosion resistance of magnesium alloys. This is due to the fact that aluminum forms the intermetallic phase β (Mg
17Al
12) with magnesium. The corrosion resistance of this phase in magnesium alloy is better compared to α-phase. The other type of particles of the second phase, which also has a great influence on the corrosion behavior, is the Mn-Al type. Based on this fact, it is obvious that the corrosion behavior of as-cast alloys is affected by second-phase particles precipitated during casting. Therefore, it is clear that the aluminum content in the chemical composition of the alloy plays an important role in corrosion resistance. Neverheless, the composition of the alloy and the cooling rate during the casting process are the main influences that directly affect the volume fraction and morphology of these particles [
40]. These second phase particles were found to affect not only the corrosion behavior of magnesium alloys, but also their mechanical properties [
41,
42,
43]. Both Mg
17Al
12 and Mn-Al particles behave cathodically over a range of pH values, leading to the formation of galvanic couples and subsequent formation of pits. Pardo et al. suggested that corrosion begins at the matrix interface and propagates through the nucleation and growth of the protective Mg(OH)
2 layer in the next step [
44].
In our case, magnesium alloy AZ80 was used as the experimental material. The effect of the different emery papers on the corrosion resistance of the ground and coated specimens was evaluated in an aggressive (chloride-containing) environment consisting of 0.1 M NaCl. To further assess the effect of the granin size of the emery papers on the corrosion behavior, electrochemical impedance spectroscopy (EIS) was performed for the ground and coated surfaces. From the R
p values shown in
Table 3,
Table 5,
Table 7 and
Table 9, it can be seen that the formation and growth of the corrosion products (MgO, Mg(OH)
2, and MgCl
2) gradually peaked at R
p with increasing exposure time. After 48 h of exposure time to an aggressive cloride environment, the peak values of R
p were reached for samples 180—ground (14,805 Ω.cm
2), 500—ground (14,258 Ω.cm
2), and 4000—ground (31,633 Ω.cm
2). For sample 1200—ground, the peak value of R
p (28,927 Ω.cm
2) was resched after 48 h exposure time. The polarization resistance of samples 180—ground, 500—ground, 1200—ground, and 4000—ground after 168 h exposure time had values of 5730 Ω.cm
2, 5483 Ω.cm
2, 7190 Ω.cm
2, and 8713 Ω.cm
2, respectively. This fact can be attributed to the effect of finer surface texture [
15]. Song et al. found that the protective films formed on the surface of magnesium alloys originate from the alloying elements (Al, Mn, or Zn) with which Mg is alloyed. When the magnesium alloy surface is exposed to the atmosphere, these conditions lead to the formation of secondary phases, such as the Mg-Al phase. The occurrence of these phases supports the formation of a stable passive film. Therefore, the corrosion behavior of the film is influenced by many aspects, such as the chemical composition of the electrolyte and the base material, the exposure time, or various defects [
39]. In contrast to the ground surfaces, the polarization resistance for all coated surfaces had values of 314,735 Ω.cm
2, 463,127 Ω.cm
2, 127,095 Ω.cm
2, and 501,464 Ω.cm
2, respectively, after 1 h of exposure time in 0.1 M NaCl solution (180—ground + PEO, 500—ground + PEO, 1200—ground + PEO, and 4000—ground + PEO) (
Table 4,
Table 6,
Table 8 and
Table 10). Moreover, the R
p values were significantly higher for all coated surfaces compared to the ground surfaces. This fact was also confirmed in the research work of Štrbák et al. [
17]. Although the R
p values decreased with increasing exposure time for all samples, the R
p values of the coated surfaces remained significantly higher than those of the ground surfaces. Throughout the exposure time of the sample in an aggressive environment, the presence of Cl
− ions caused the gradual penetration of the protective Mg
3(PO
4)
2 layer, formed on the base material. However, the values of R
p (
Table 3,
Table 4,
Table 5,
Table 6,
Table 7,
Table 8,
Table 9 and
Table 10) are characterized by a zig-zag behavior in all samples. This type of behavior is caused by the gradual penetration of the aggressive particles of the cloride environment onto the surface of the coated material with the simultaneous formation of passive films (Mg(OH)
2 and MgCl
2). During the exposure period, the size and mass of these defects gradually increase and they have a tendency to form larger voids, which leads to a decrease in the R
p value. Nonetheless, after a certain exposure time, these voids are partially closed by the passive films, leading to an increase in the R
p value [
45]. After 168 h of exposure time (
Table 4,
Table 6,
Table 8 and
Table 10) the polarization resistance of the samples 180—ground + PEO, 500—ground + PEO, 1200—ground + PEO, and 4000—ground + PEO decreased and had values of 36,526 Ω.cm
2, 13,376 Ω.cm
2, 52,580 Ω.cm
2, and 13,103 Ω.cm
2, respectively. The highest R
p value was obtained after 168 h of exposure time for sample 1200—ground + PEO. This could be due to the influence of the condition of the base material on which the PEO coating was formed. On the other hand, the R
p value was significantly lower in the case of sample 4000—ground + PEO. Therefore, a surface condition with insufficient heterogeneity is not suitable for coating.
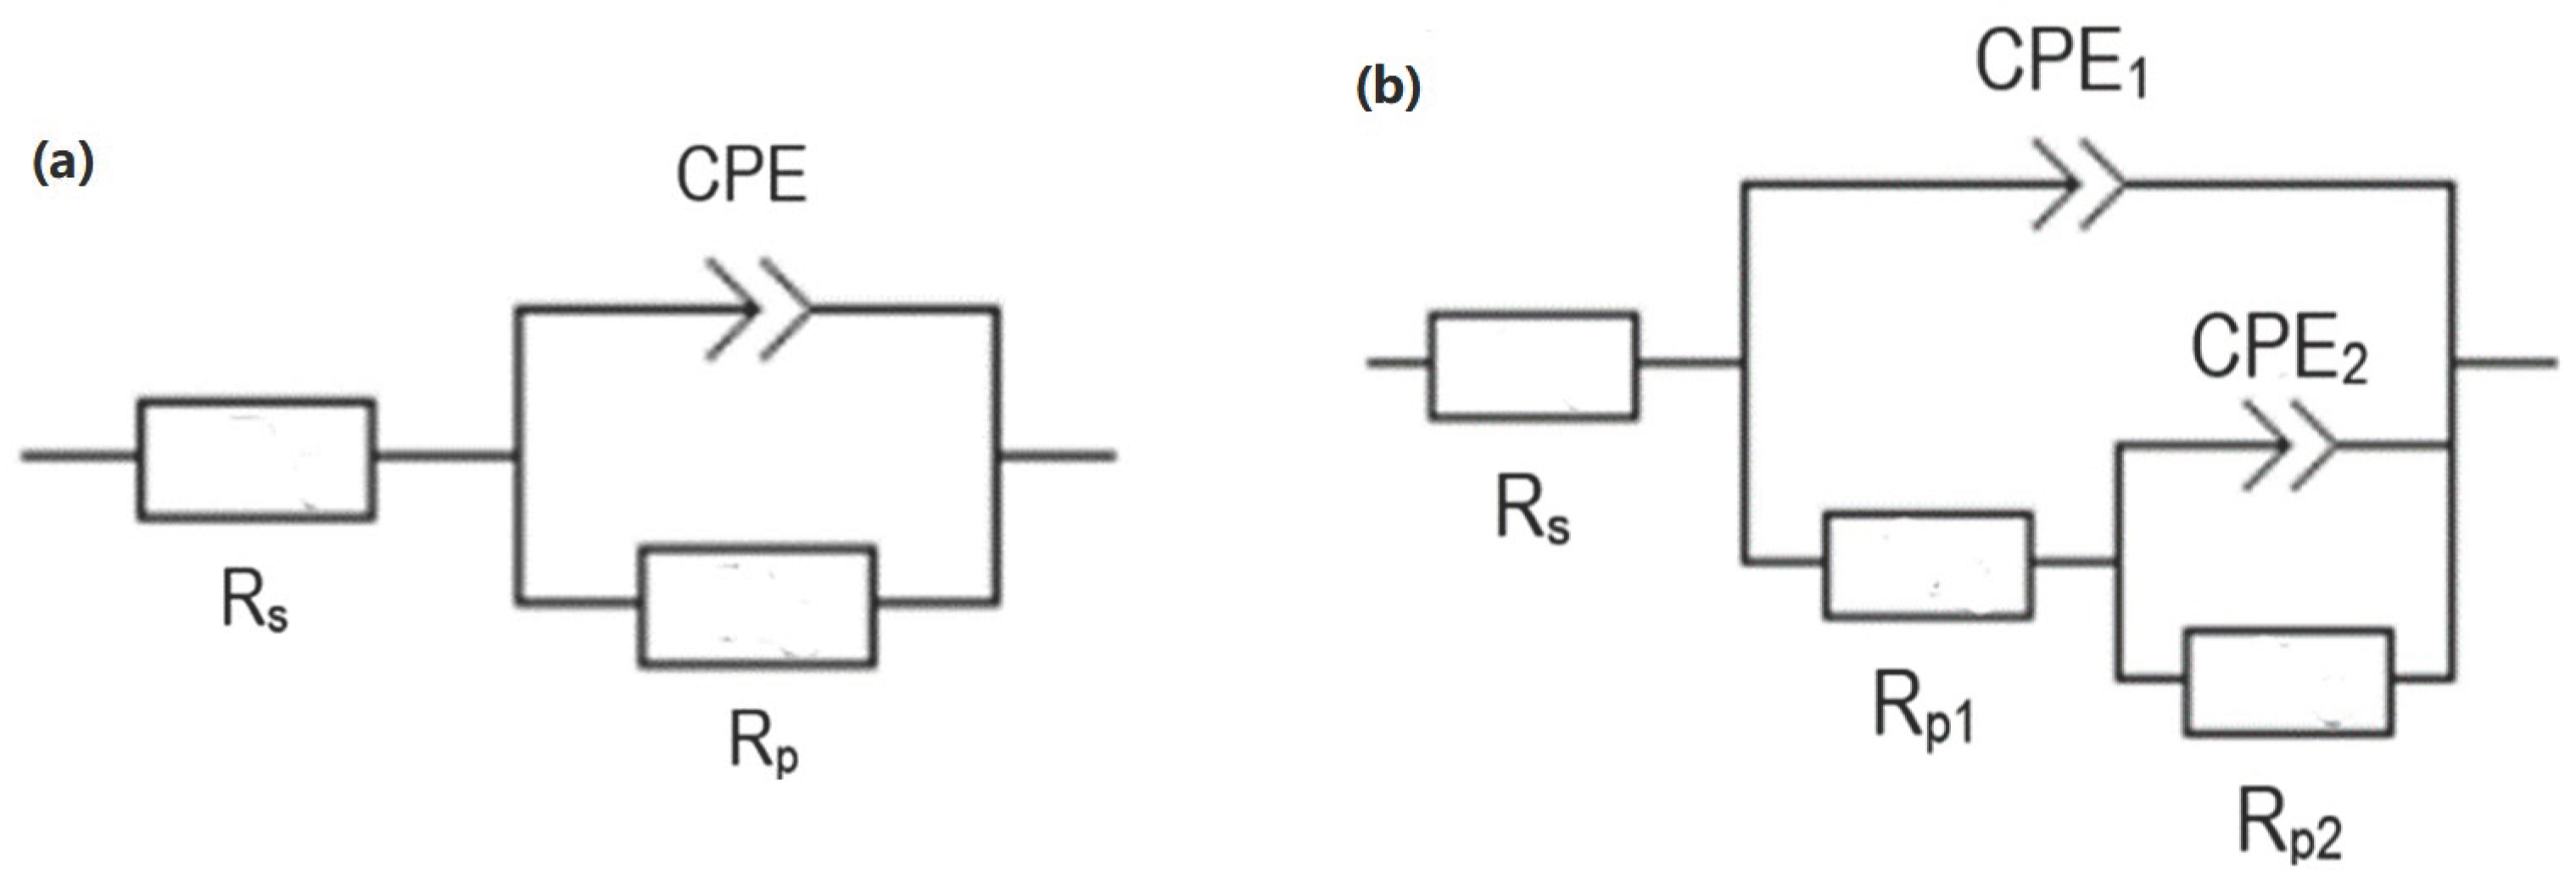
The usual composition of PEO coatings consists of an outer and an inner layer, expressed by the corresponding partial resistances R
1 and R
2. The function of the inner layer is to form an obstacle for the aggressive media and to increase the corrosion resistance [
12]. Based on the results, it is clear that the protection of this layer decreased significantly during the exposure time for all samples. The gradual penetration of the electrolyte through the coating was caused by its lower compactness, which led to chemical dissolution, and consequently, to a decrease in resistance after only 1 h of exposure. For this reason, in the period from 2 to 168 h, R
1 corresponds to the combined response of the outer and inner layers, while R
2 is referred to as the charge transfer resistance [
46]. However, the comparison of corrosion resistance by the inner layer showed that the values of ground + PEO are higher compared to ground samples.
The component n ranges from 0.6 to 1 in
Table 3,
Table 4,
Table 5,
Table 6,
Table 7,
Table 8,
Table 9 and
Table 10 and is attributed to the value of capacitor. Therefore, the element CPE in the equivalent circuit should be replaced by a capacitor with
n = 1 [
47]. The CPE
1 and CPE
2 values of ground and ground + PEO samples increase after each exposure time (
Table 3,
Table 4,
Table 5,
Table 6,
Table 7,
Table 8,
Table 9 and
Table 10), mainly for CPE
2. It can be seen that after 168 h of exposure, the value of CPE
2 increased for the samples 180—ground, 500—ground, 500—ground + PEO, 1200—ground + PEO, and 4000—ground + PEO. This fact was caused by the still ongoing corrosion reactions and enlargement of the active area. Nevertheless, the CPE
1 and CPE
2 values for the other ground and coated samples decreased slightly after 168 h of exposure.
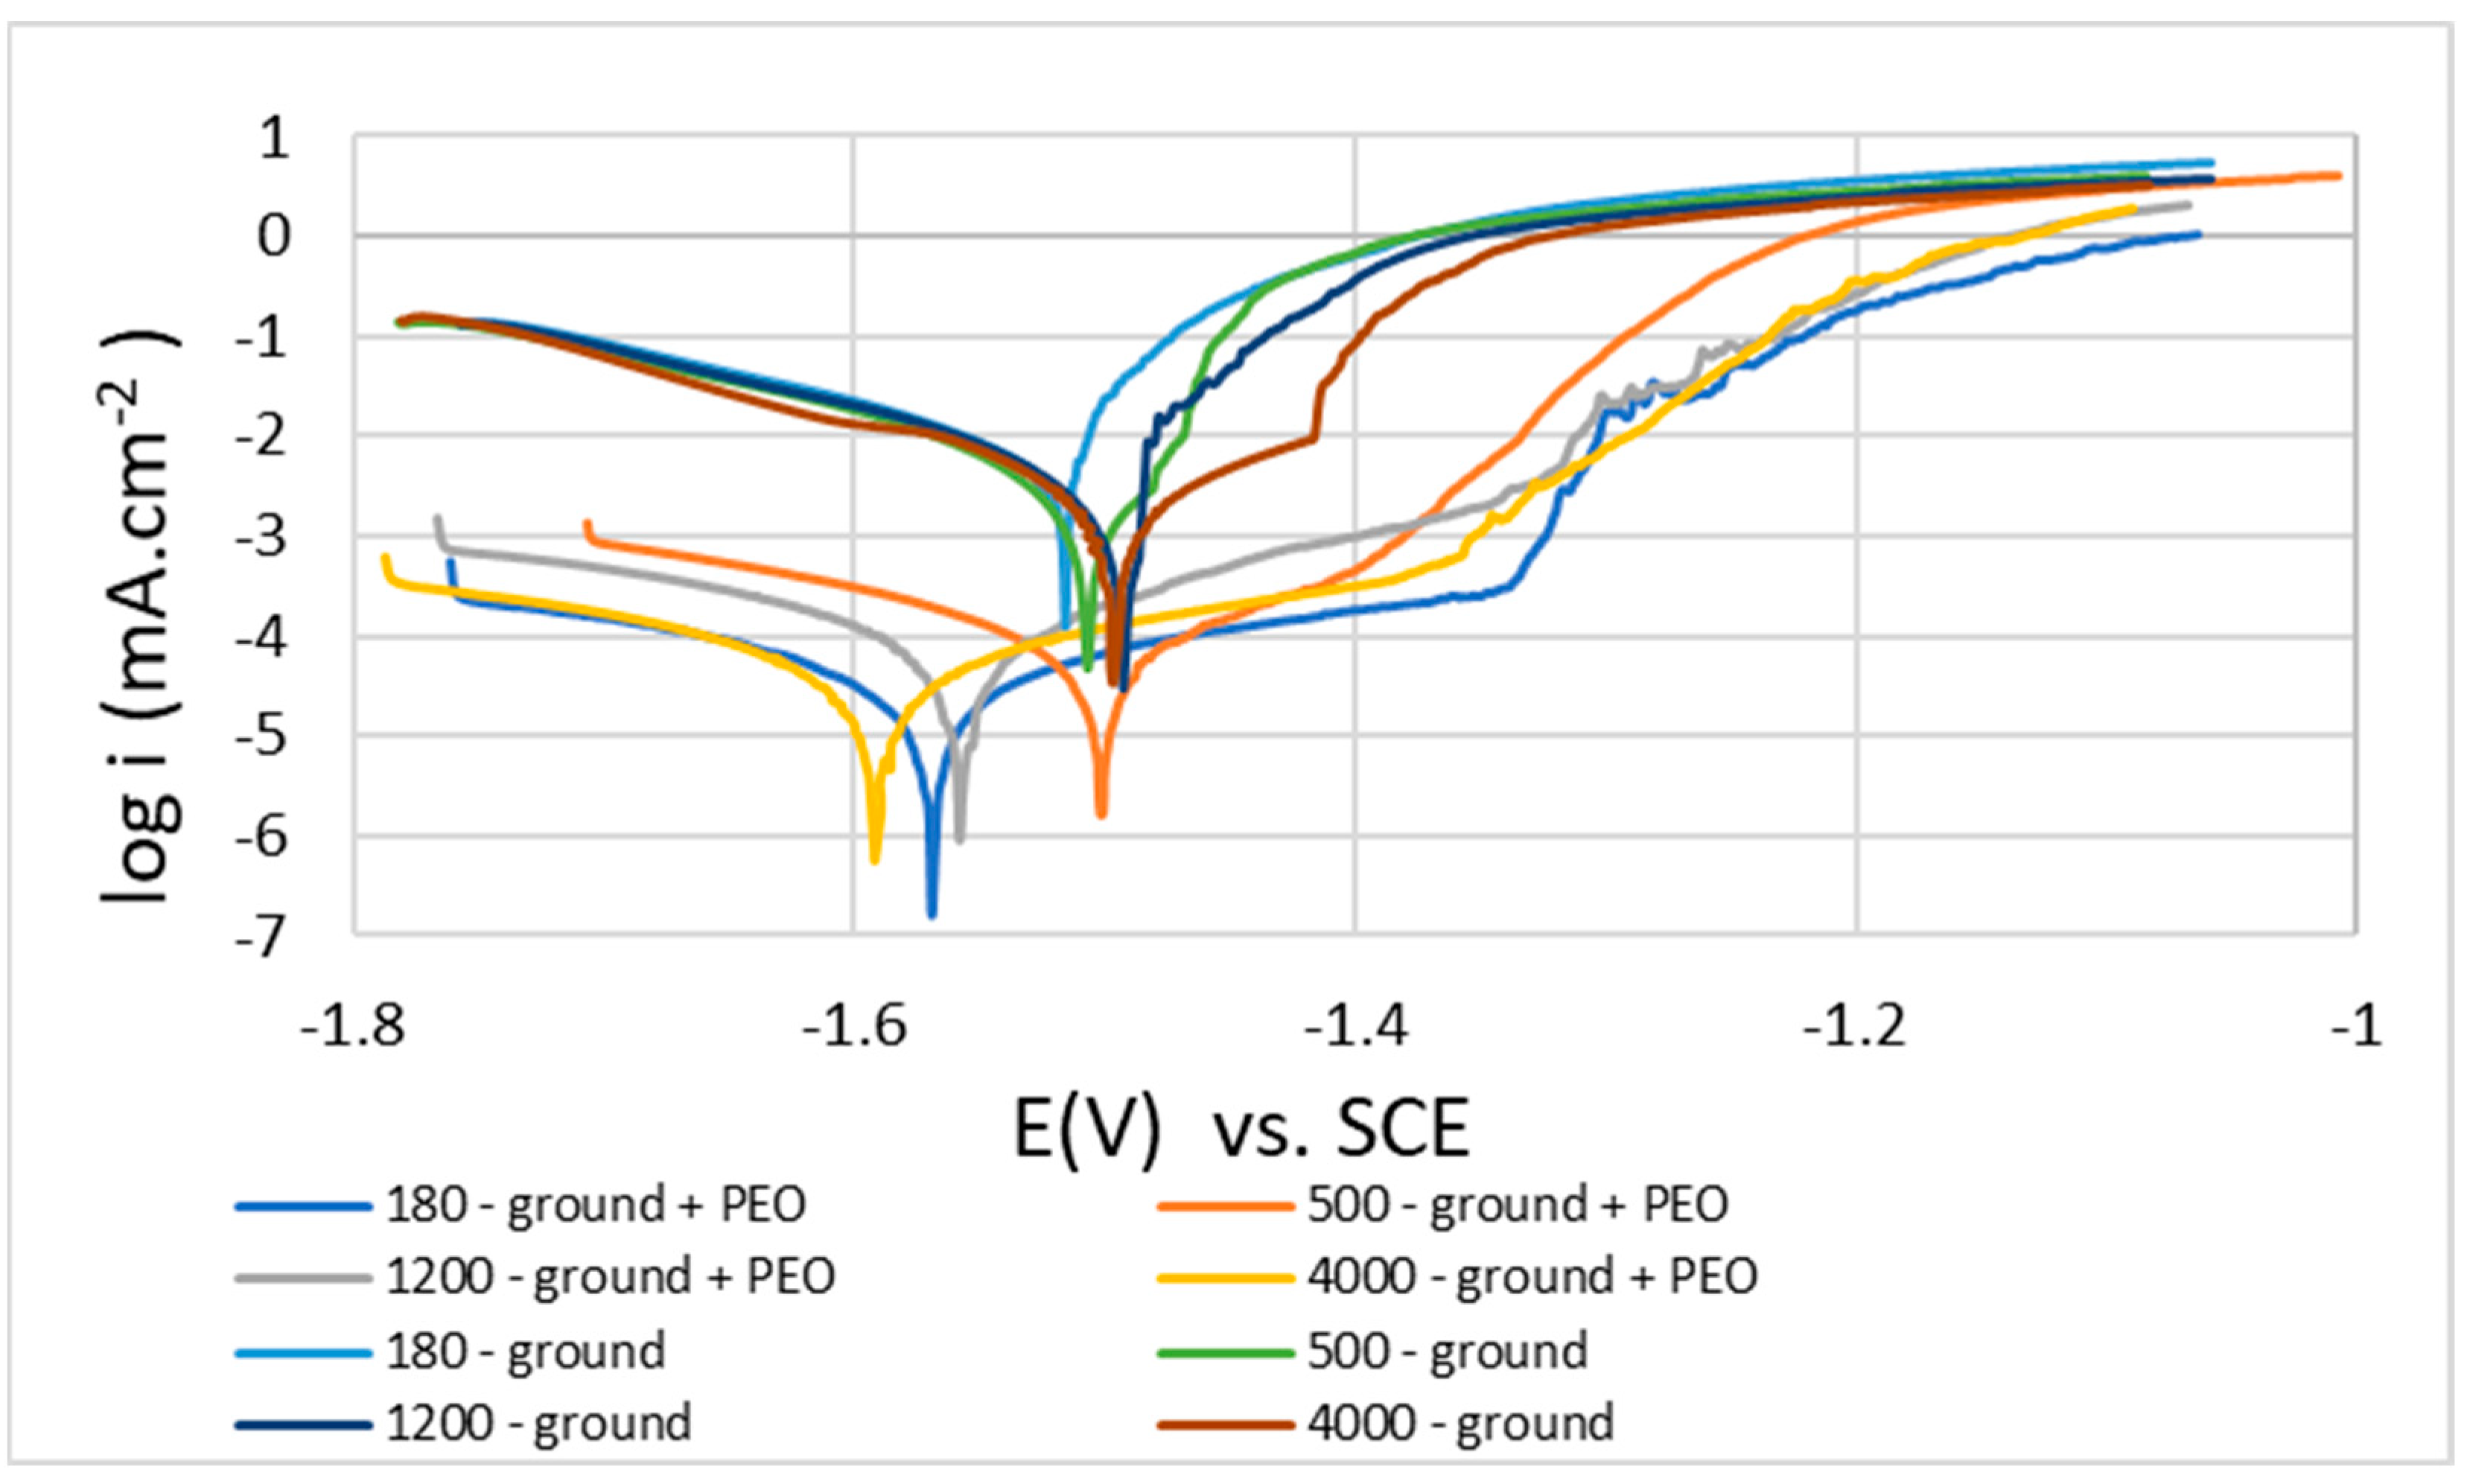
3.6. Evaluation of Potentiodynamic Curves
Figure 14 shows potentiodynamic polarization curves of uncoated and coated samples of Mg alloy AZ80 measured in 0.1 M NaCl solution. The analysis of these curves was performed by the Tafel extrapolation method, and then the curves were plotted on the semi-logarithmic scale. The PDP measurements were repeated three times for each type of surface pretreatment. From these measurements, the values of the following corrosion characteristics were determined: corrosion potential (E
corr), corrosion current density (icorr), corrosion rate (r
corr), and the inclinations of Tafel constants (β
a and β
c), which are shown in
Table 11 and
Table 12. The thermodynamics of the corrosion reaction are described by E
corr, while the kinetic side is described by i
corr and provides information on the rate of corrosion reactions [
17].
Based on the results of the PDP tests (
Table 11 and
Table 12), it can be said that after comparing the ground surfaces with the ground surfaces + PEO coatings, it is obvious that the application of PEO coatings on all surfaces shifted the Ecorr values towards more negative values. This fact is typical for materials that have rougher oxide layers on their surfaces [
15]. The most negative value of Ecorr (−1594 mV) was obtained by the sample 180—ground + PEO. However, for the corrosion current densities (i
corr), the values obtained were significantly lower for all PEO surfaces compared to the ground surfaces. For all samples with PEO coatings, the determined decrease in icorr was two orders of magnitude lower. From the reached results, it can be seen that the most significant decrease in icorr occurred in the sample 180—ground + PEO, namely from 7.07 μA.cm
−2 (180—ground) to 0.06 μA.cm
−2. However, the other changes in the obtained results, namely from 5.12 μA.cm
−2 to 0.08 μA.cm
−2 for 500—ground + PEO, from 4.28 μA.cm
−2 to 0.08 μA.cm
−2 for 1200—ground + PEO, and from 3.56 μA.cm
−2 to 0.06 μA.cm
−2 4000—ground + PEO, were also impressive. From the values of the corrosion rates (r
corr), it can be seen (
Table 11 and
Table 12) that the r
corr is significantly lower in the case of the samples ground + PEO compared to the ground samples. It is obvious that the most significant decrease in r
corr value by almost 163 times was measured in the case of sample 180—ground + PEO, namely from 162 μmpy (180—ground) to 1.28 μmpy. The order of the other results obtained is as follows: from 195 μmpy to 1.86 μmpy for 1200—ground + PEO, from 117 μmpy to 1.83 for 500—ground + PEO, and from 81 μmpy to 1.41 μmpy for 400—ground + PEO.

 ,
, 


