
Quantifying Decay Due to Wet Atmospheric Deposition on Basalt

 ,
,
Abstract
:1. Introduction
2. Materials and Methods
2.1. Analysis of Wet Atmospheric Deposition
2.2. Water Absorption Properties
2.3. Accelerated Weathering
2.4. Ion Chromatography (IC)
2.5. Statistical Analysis
3. Results and Discussion
3.1. Analysis of Wet Atmospheric Deposition
3.2. Water Absorption Properties
3.3. Mass Difference
3.4. Ion Chromatography Used in Analysis of Accelerated Weathering Test Samples
4. Conclusions
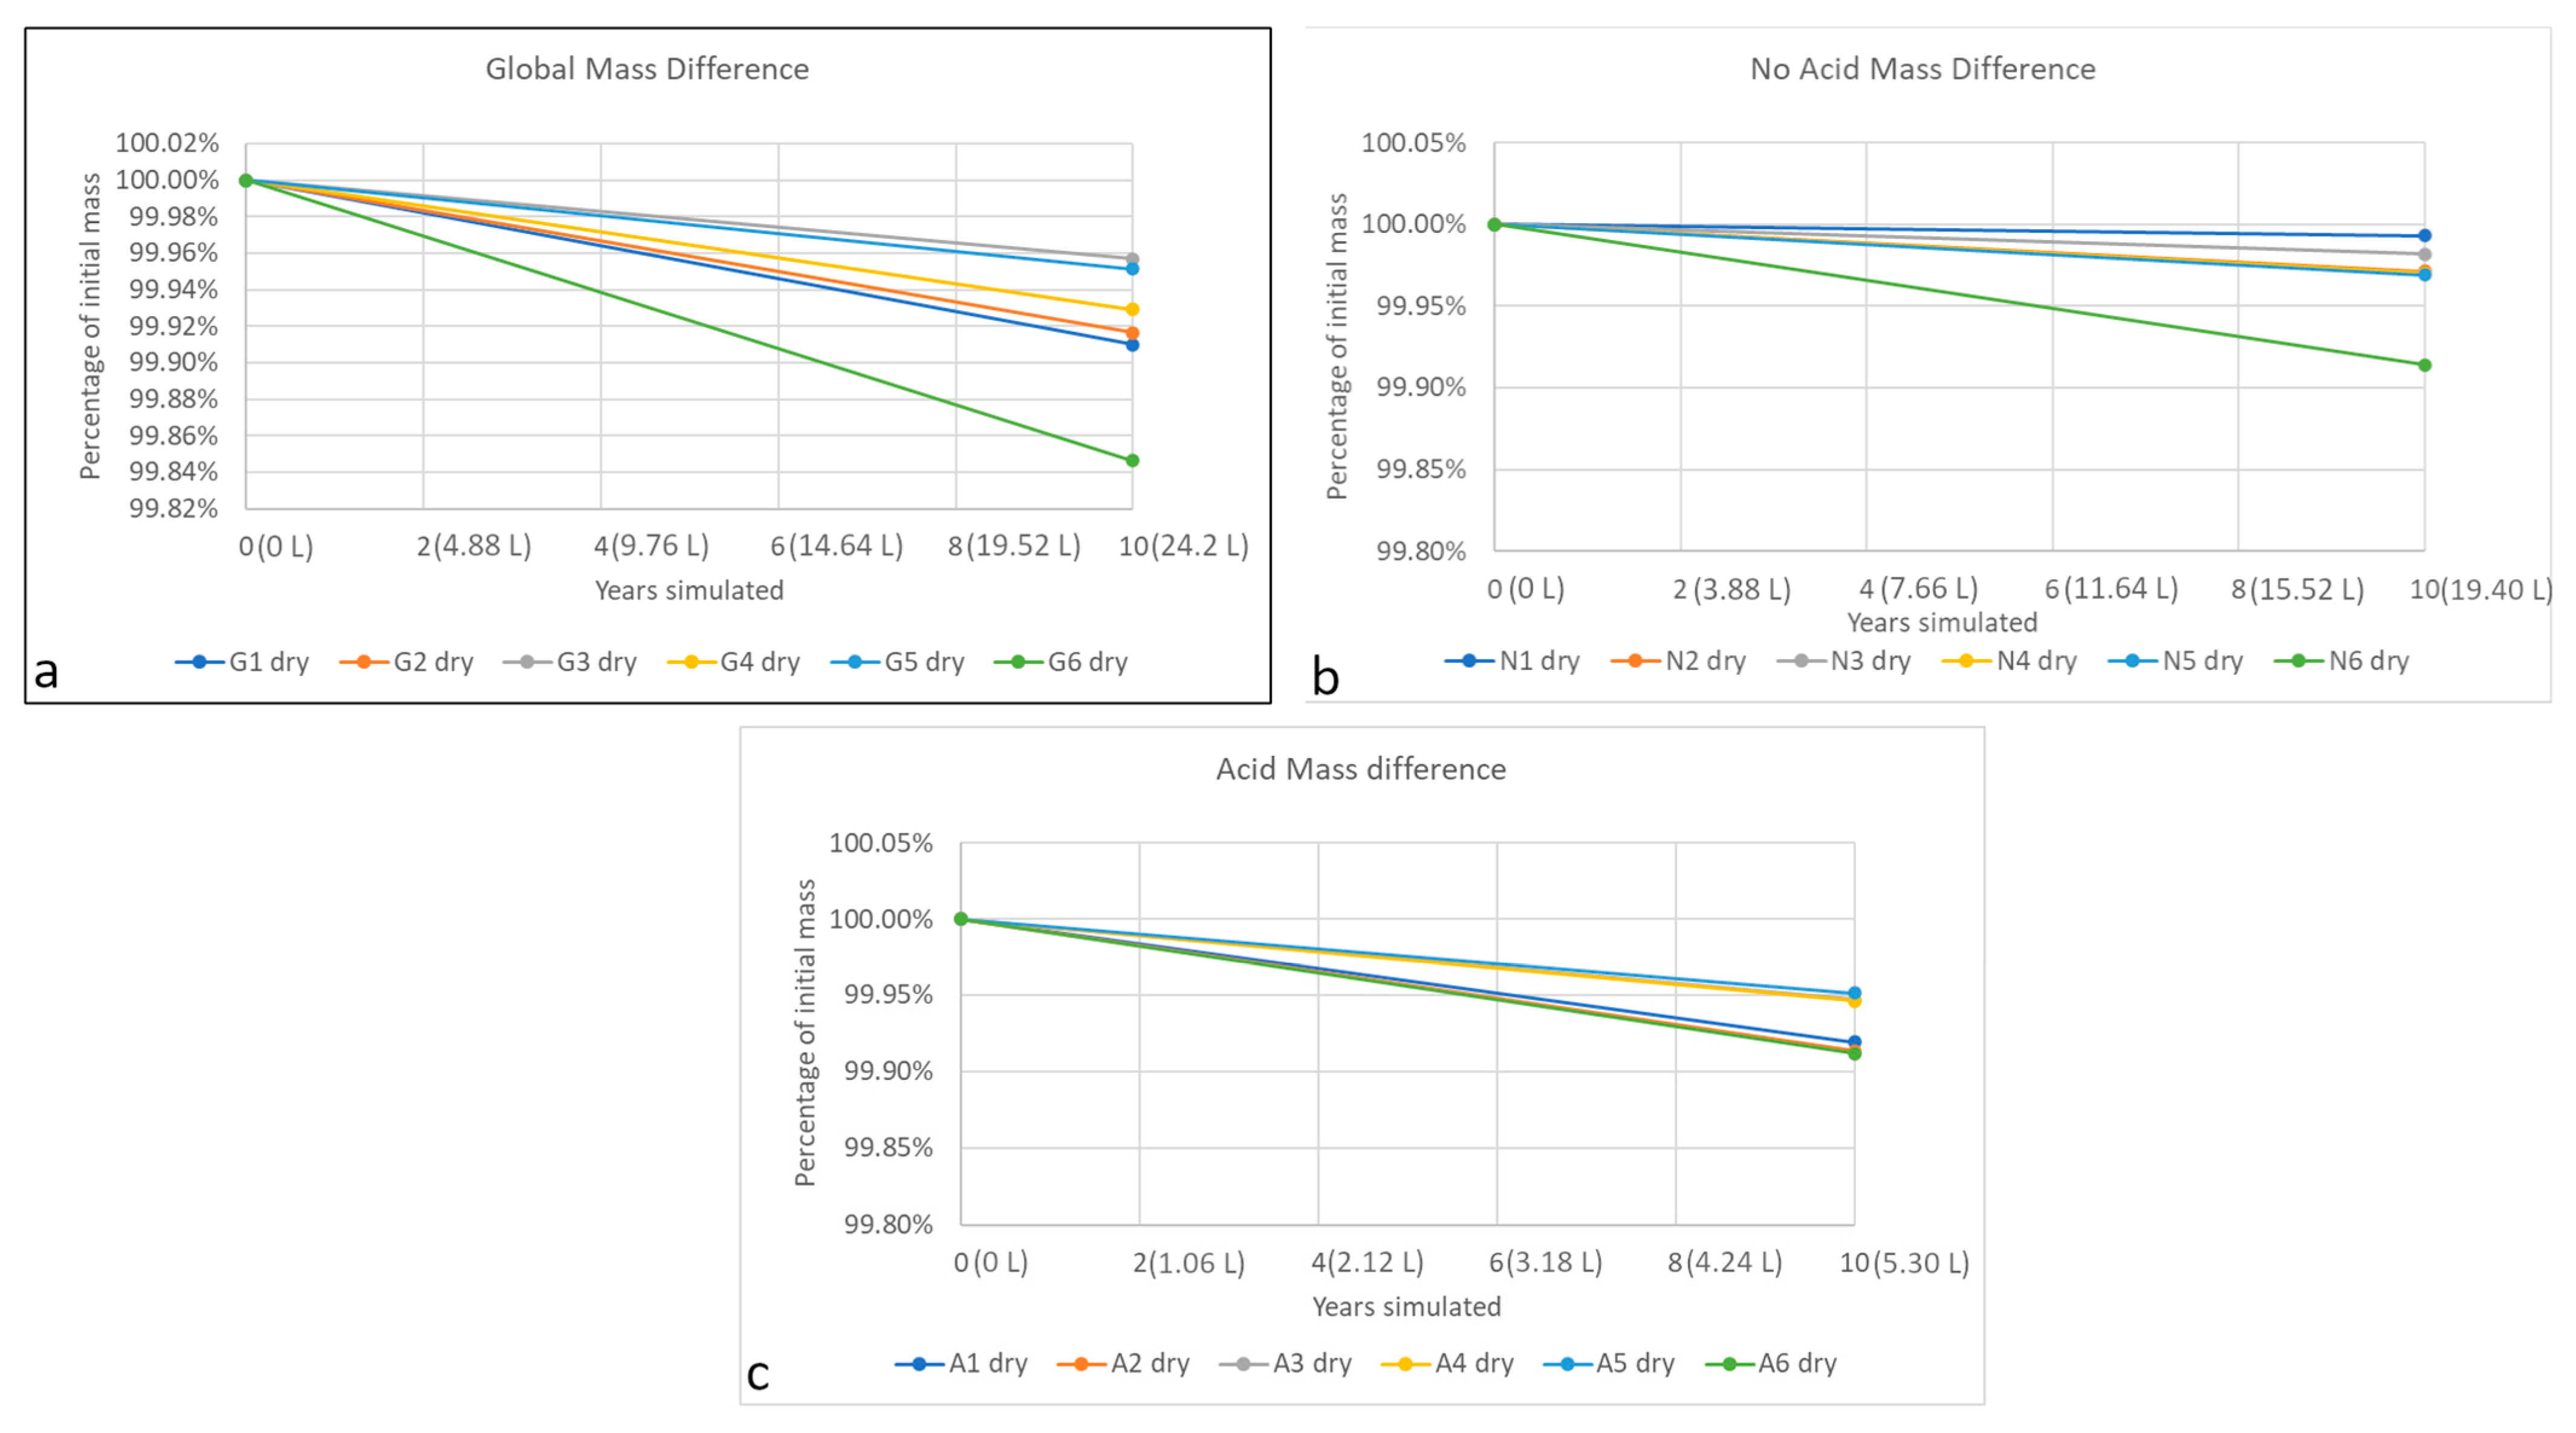
- An accelerated weathering test showed that tezontle, a red basalt commonly used as building material in central Mexico, suffers from decay due to wet atmospheric deposition. The methodology employed is suitable for monitoring decay, although changing specimen dimensions can be changed to diminish the effect of porosity heterogeneity. There was a significant mass loss, caused probably by the washing of non-soluble compounds (most likely clay minerals), dissolution of several compounds (especially Ca-bearing minerals that need to be researched deeper in the future), salt crystallization and cation exchange.
- Water Absorption Capacity and Open Porosity were tested, and although mass difference showed better results, these can be cautiously employed as two in situ variables for monitoring decay when no other test is available.
- Basalt decay was modeled for a period of ten years, and a first approach to decay equations was presented as fifth-degree functions. The main source of decay in the rain is the acidic events, in which mass loss is higher than non-acidic events. However, precipitation produces mass loss regardless of rain pH and volume is indeed the critical variable in wet atmospheric deposition.
- Decay of basalt is not linear, and when modeling it, the use of measurable variables, such as rain volume, instead of arbitrary units (such as years) can help to better forecast decay rates of the building material.
- Volcanic-stone-based heritage is present worldwide, but knowledge on their decay mechanisms and the variables controlling them needs to be enhanced further. Statistical analysis of stone properties is important to model the decay of basalt; however, different methodologies with different time spares, local chemical compositions and precipitation volume should be researched for better forecast.
Author Contributions
Funding
Institutional Review Board Statement
Informed Consent Statement
Data Availability Statement
Acknowledgments
Conflicts of Interest
Appendix A

| Date | Rain Volume (mm) | pH | [H+] | [Na+] | [NH₄+] | [K+] | [Mg2+] | [Ca2+] | [Cl−] | [NO3−] | [SO42−] | [HCO3−] |
|---|---|---|---|---|---|---|---|---|---|---|---|---|
| 7 May 2014 | 27.9 | 6.8 | 0.2 | 10.7 | 199.8 | 7.4 | 6.7 | 133.7 | 14.5 | 92.5 | 163.2 | 54.2 |
| 13 May 2014 | 15.2 | 6.1 | 0.8 | 9.5 | 126.4 | 3.7 | 1.6 | 65.2 | 22.3 | 77.9 | 93.9 | 8.0 |
| 20 May 2014 | 15.2 | 6.4 | 0.4 | 7.0 | 106.4 | 2.2 | 5.8 | 41.8 | 8.5 | 44.3 | 94.5 | 22.7 |
| 27 May 2014 | 22.1 | 6.5 | 0.3 | 8.7 | 115.1 | 4.6 | 1.6 | 78.1 | 13.0 | 55.2 | 94.9 | 47.2 |
| 3 June 2014 | 27.7 | 6.6 | 0.2 | 18.1 | 141.6 | 5.9 | 13.2 | 52.6 | 54.7 | 77.6 | 87.1 | 31.7 |
| 10 June 2014 | 30.3 | 6.6 | 0.2 | 5.1 | 65.5 | 1.7 | 1.6 | 21.3 | 10.2 | 16.9 | 31.1 | 31.2 |
| 17 June 2014 | 50.1 | 7.0 | 0.1 | 7.9 | 100.4 | 2.6 | 1.6 | 71.9 | 5.7 | 35.6 | 61.3 | 63.0 |
| 1 July 2014 | 140.7 | 5.8 | 1.8 | 0.9 | 113.8 | 0.9 | 1.6 | 35.1 | 13.3 | 51.6 | 75.1 | 5.2 |
| 1 July 2014 | 76.6 | 5.8 | 1.5 | 5.7 | 67.6 | 0.9 | 1.6 | 14.0 | 4.5 | 30.7 | 45.0 | 5.1 |
| 8 July 2014 | 100.3 | 6.2 | 0.7 | 4.0 | 88.4 | 0.9 | 1.6 | 24.0 | 6.8 | 24.8 | 47.6 | 35.5 |
| 15 July 2014 | 29.4 | 6.7 | 0.2 | 3.5 | 88.8 | 0.9 | 1.6 | 28.2 | 5.0 | 30.4 | 34.0 | 39.9 |
| 22 July 2014 | 73.2 | 5.0 | 9.3 | 2.1 | 88.3 | 0.9 | 1.6 | 26.2 | 7.7 | 51.2 | 55.6 | |
| 29 July 2014 | 30.6 | 6.0 | 1.0 | 4.7 | 127.1 | 2.6 | 1.6 | 66.8 | 24.3 | 75.0 | 87.6 | 9.1 |
| 12 August 2014 | 72.9 | 5.2 | 7.1 | 0.9 | 79.5 | 0.9 | 1.6 | 17.3 | 11.4 | 43.8 | 61.2 | |
| 19 August 2014 | 59.4 | 5.5 | 3.5 | 15.1 | 73.4 | 2.6 | 1.6 | 38.9 | 14.2 | 36.2 | 70.0 | |
| 2 September 2014 | 77.8 | 6.2 | 0.7 | 3.4 | 90.9 | 1.8 | 1.6 | 23.0 | 5.6 | 30.6 | 37.7 | 41.0 |
| 9 September 2014 | 39.5 | 6.9 | 0.1 | 12.4 | 137.9 | 4.9 | 1.6 | 74.6 | 9.7 | 78.3 | 79.7 | 66.2 |
| 9 September 2014 | 48.6 | 6.0 | 1.1 | 3.3 | 55.8 | 1.8 | 1.6 | 21.1 | 4.2 | 24.4 | 45.0 | 5.5 |
| 17 September 2014 | 22.8 | 6.4 | 0.4 | 9.2 | 113.1 | 2.9 | 1.6 | 58.7 | 10.4 | 51.0 | 44.1 | 68.2 |
| 23 September 2014 | 20.2 | 7.0 | 0.1 | 10.6 | 91.1 | 4.3 | 1.6 | 72.5 | 8.1 | 46.2 | 48.3 | 63.0 |
| 30 September 2014 | 26.5 | 7.0 | 0.1 | 2.6 | 85.9 | 3.8 | 11.9 | 90.8 | 5.9 | 23.7 | 31.0 | 62.6 |
| 7 October 2014 | 139.8 | 4.9 | 14.1 | 1.6 | 45.3 | 0.9 | 1.6 | 10.1 | 11.4 | 18.3 | 49.8 | |
| 14 October 2014 | 59.1 | 4.8 | 14.5 | 8.0 | 121.1 | 0.9 | 11.7 | 61.9 | 31.5 | 74.2 | 118.7 | |
| 21 October 2014 | 54.1 | 6.7 | 0.2 | 2.6 | 38.8 | 0.9 | 1.6 | 31.2 | 1.1 | 10.8 | 21.9 | 46.1 |
| 15 July 2014 | 29.4 | 6.7 | 0.2 | 3.5 | 88.8 | 28.2 | 5.0 | 30.4 | 34.0 | 39.9 | ||
| 22 July 2014 | 73.2 | 5.0 | 9.3 | 2.1 | 88.3 | 26.2 | 7.7 | 51.2 | 55.6 | |||
| 29 July 2014 | 30.6 | 6.0 | 1.0 | 4.7 | 127.1 | 2.6 | 66.8 | 24.3 | 75.0 | 87.6 | 9.1 | |
| 12 August 2014 | 72.9 | 5.2 | 7.1 | 79.5 | 17.3 | 11.4 | 43.8 | 61.2 | ||||
| 19 August 2014 | 59.4 | 5.5 | 3.5 | 15.1 | 73.4 | 2.6 | 38.9 | 14.2 | 36.2 | 70.0 | ||
| 2 September 2014 | 77.8 | 6.2 | 0.7 | 3.4 | 90.9 | 1.8 | 23.0 | 5.6 | 30.6 | 37.7 | 41.0 | |
| 9 September 2014 | 39.5 | 6.9 | 0.1 | 12.4 | 137.9 | 4.9 | 74.6 | 9.7 | 78.3 | 79.7 | 66.2 | |
| 17 September 2014 | 22.8 | 6.4 | 0.4 | 9.2 | 113.1 | 2.9 | 58.7 | 10.4 | 51.0 | 44.1 | 68.2 | |
| 23 September 2014 | 20.2 | 7.0 | 0.1 | 10.6 | 91.1 | 4.3 | 72.5 | 8.1 | 46.2 | 48.3 | 63.0 | |
| 30 September 2014 | 26.5 | 7.0 | 0.1 | 2.6 | 85.9 | 3.8 | 11.9 | 90.8 | 5.9 | 23.7 | 31.0 | 62.6 |
| 7 October 2014 | 139.8 | 4.9 | 14.1 | 1.6 | 45.3 | 10.1 | 11.4 | 18.3 | 49.8 | |||
| 14 October 2014 | 59.1 | 4.8 | 14.5 | 8.0 | 121.1 | 11.7 | 61.9 | 31.5 | 74.2 | 118.7 | ||
| 21 October 2014 | 54.1 | 6.7 | 0.2 | 2.6 | 38.8 | 31.2 | 10.8 | 21.9 | 46.1 | |||
| 12 May 2015 | 35.0 | 6.8 | 0.2 | 6.7 | 110.4 | 2.3 | 9.7 | 48.7 | 9.6 | 38.5 | 70.2 | 42.1 |
| 19 May 2015 | 40.6 | 5.9 | 1.3 | 8.0 | 154.7 | 4.1 | 5.8 | 74.1 | 19.0 | 67.7 | 148.9 | 10.1 |
| 26 May 2015 | 48.9 | 6.9 | 0.1 | 7.7 | 160.2 | 3.3 | 7.8 | 103.1 | 8.0 | 77.2 | 126.4 | 58.2 |
| 2 June 2015 | 37.5 | 4.3 | 45.7 | 3.7 | 121.6 | 1.4 | 2.5 | 35.3 | 36.7 | 56.9 | 103.0 | |
| 9 June 2015 | 27.5 | 6.6 | 0.3 | 7.4 | 231.2 | 4.0 | 10.7 | 180.3 | 9.9 | 120.8 | 230.2 | 32.5 |
| 16 June 2015 | 8.2 | 6.7 | 0.2 | 13.3 | 182.0 | 7.6 | 19.7 | 144.9 | 12.8 | 121.8 | 183.3 | 55.8 |
| 23 June 2015 | 29.0 | 6.7 | 0.2 | 9.0 | 124.0 | 2.4 | 8.3 | 66.7 | 9.1 | 70.8 | 83.4 | 30.4 |
| 30 June 2015 | 75.4 | 4.6 | 24.0 | 0.9 | 95.1 | 1.6 | 2.5 | 26.0 | 8.0 | 56.3 | 70.5 | |
| 7 July 2015 | 18.9 | 5.1 | 7.4 | 6.3 | 198.0 | 0.6 | 9.1 | 67.9 | 19.6 | 108.1 | 138.1 | |
| 21 July 2015 | 20.8 | 6.6 | 0.2 | 0.9 | 91.7 | 0.6 | 2.5 | 34.9 | 5.1 | 40.6 | 42.0 | 40.5 |
| 28 July 2015 | 40.0 | 4.5 | 30.2 | 9.6 | 155.7 | 3.5 | 8.3 | 74.4 | 35.9 | 67.8 | 169.2 | |
| 4 August 2015 | 22.7 | 7.2 | 0.1 | 24.7 | 131.3 | 6.8 | 10.9 | 91.7 | 16.1 | 60.6 | 72.7 | 107.4 |
| 11 August 2015 | 8.1 | 6.4 | 0.4 | 17.8 | 112.1 | 4.8 | 17.4 | 88.8 | 37.7 | 58.1 | 98.7 | 30.0 |
| 18 August 2015 | 32.6 | 6.5 | 0.3 | 2.4 | 110.4 | 2.3 | 6.4 | 54.9 | 12.7 | 48.5 | 80.8 | 17.9 |
| 25 August 2015 | 19.4 | 4.4 | 40.7 | 15.0 | 96.1 | 1.4 | 2.5 | 15.4 | 15.9 | 67.0 | 91.9 | |
| 1 September 2015 | 14.1 | 6.9 | 0.1 | 0.9 | 82.8 | 0.6 | 2.5 | 49.3 | 4.0 | 27.4 | 38.9 | 61.5 |
| 8 September 2015 | 112.2 | 6.0 | 1.0 | 0.9 | 127.9 | 17.0 | 2.5 | 35.2 | 9.4 | 44.1 | 83.6 | 43.5 |
| 15 September 2015 | 11.3 | 4.5 | 30.2 | 13.1 | 199.5 | 4.0 | 13.3 | 53.3 | 21.7 | 87.3 | 187.8 | |
| 22 September 2015 | 50.8 | 5.9 | 1.2 | 3.0 | 146.9 | 1.8 | 2.5 | 41.4 | 10.2 | 88.1 | 64.3 | 17.8 |
| 29 September 2015 | 39.8 | 6.7 | 0.2 | 2.8 | 102.6 | 1.5 | 2.5 | 20.0 | 2.3 | 43.1 | 45.8 | 39.5 |
| 28 October 2015 | 10.2 | 6.6 | 0.2 | 2.3 | 84.8 | 3.6 | 11.5 | 47.9 | 1.1 | 61.1 | 54.8 | 14.9 |
| 4 November 2015 | 7.4 | 6.3 | 0.5 | 8.1 | 104.3 | 3.1 | 6.7 | 48.1 | 6.6 | 67.1 | 76.6 | 8.4 |
| 14 July 2016 | 15.3 | 5.7 | 1.8 | 22.9 | 93.9 | 2.5 | 2.5 | 79.8 | 25.4 | 61.6 | 100.0 | 8.7 |
| 11 May 2016 | 7.1 | 6.8 | 0.2 | 28.8 | 287.2 | 21.4 | 23.5 | 262.0 | 29.1 | 179.7 | 285.5 | 120.7 |
| 17 May 2016 | 17.5 | 6.5 | 0.3 | 5.0 | 231.2 | 4.7 | 7.7 | 56.7 | 9.9 | 96.1 | 162.2 | 25.7 |
| 24 May 2016 | 5.8 | 6.9 | 0.1 | 16.0 | 284.9 | 14.5 | 20.6 | 249.0 | 22.6 | 237.6 | 256.3 | 112.8 |
| 31 May 2016 | 41.9 | 6.3 | 0.5 | 15.1 | 121.8 | 7.4 | 5.9 | 46.5 | 5.8 | 60.7 | 93.4 | 41.3 |
| 7 June 2016 | 38.9 | 4.9 | 11.5 | 5.7 | 147.8 | 3.5 | 6.3 | 55.6 | 5.1 | 67.9 | 148.9 | |
| 14 June 2016 | 37.1 | 4.8 | 15.8 | 11.7 | 150.0 | 3.7 | 13.7 | 75.1 | 18.1 | 115.3 | 148.9 | |
| 21 June 2016 | 13.0 | 5.7 | 1.9 | 2.1 | 54.1 | 23.8 | 4.0 | 20.2 | 53.2 | 5.4 | ||
| 28 June 2016 | 60.2 | 6.1 | 0.7 | 6.4 | 89.0 | 2.3 | 15.1 | 8.2 | 35.8 | 62.5 | 15.6 | |
| 5 July 2016 | 66.5 | 6.5 | 0.3 | 6.7 | 77.8 | 2.2 | 40.4 | 7.1 | 48.1 | 49.6 | 32.2 | |
| 12 July 2016 | 41.4 | 6.1 | 0.8 | 5.0 | 111.7 | 39.9 | 9.0 | 33.1 | 99.3 | 15.0 | ||
| 19 July 2016 | 51.8 | 6.6 | 0.3 | 4.0 | 95.6 | 1.9 | 46.7 | 6.5 | 29.5 | 70.8 | 35.8 | |
| 26 July 2016 | 67.1 | 6.7 | 0.2 | 4.8 | 66.6 | 33.9 | 7.9 | 22.6 | 28.7 | 52.2 | ||
| 2 August 2016 | 17.5 | 6.2 | 0.6 | 6.1 | 102.3 | 3.6 | 51.6 | 5.4 | 54.4 | 70.4 | 22.7 | |
| 10 August 2016 | 28.7 | 6.4 | 0.4 | 37.9 | 59.3 | 9.1 | 5.8 | 51.4 | 18.6 | 23.1 | 52.1 | 60.1 |
| 16 August 2016 | 9.4 | 6.7 | 0.2 | 17.1 | 105.6 | 5.1 | 11.8 | 160.8 | 11.8 | 97.4 | 134.6 | 60.4 |
| 23 August 2016 | 35.8 | 5.7 | 2.1 | 6.5 | 94.4 | 3.0 | 7.7 | 46.0 | 16.5 | 35.2 | 96.6 | 3.7 |
| 30 August 2016 | 73.4 | 6.5 | 0.4 | 6.6 | 96.3 | 2.4 | 5.3 | 52.1 | 9.7 | 52.9 | 58.8 | 34.5 |
| 6 September 2016 | 3.3 | 7.0 | 0.1 | 8.4 | 131.8 | 5.1 | 39.3 | 21.2 | 43.1 | 43.7 | 99.4 | |
| 13 September 2016 | 29.5 | 7.0 | 0.1 | 3.0 | 99.0 | 3.0 | 7.4 | 110.4 | 2.8 | 29.7 | 58.5 | 112.4 |
| 21 September 2016 | 8.1 | 6.7 | 0.2 | 5.7 | 116.1 | 5.4 | 76.2 | 16.5 | 35.4 | 93.9 | 49.9 | |
| 27 September 2016 | 27.2 | 5.5 | 3.2 | 3.5 | 64.0 | 2.6 | 29.0 | 4.4 | 22.9 | 66.8 | ||
| 4 October 2016 | 61.5 | 6.2 | 0.6 | 4.6 | 77.2 | 37.8 | 10.5 | 24.8 | 64.3 | 18.3 | ||
| 18 October 2016 | 15.5 | 6.8 | 0.2 | 12.0 | 31.5 | 8.6 | 53.9 | 6.7 | 11.8 | 13.7 | 66.1 | |
| 16 May 2017 | 5.6 | 6.7 | 0.2 | 14.4 | 304.8 | 12.7 | 24.4 | 173.2 | 6.5 | 143.7 | 278.4 | 53.7 |
| 23 May 2017 | 6.9 | 6.7 | 0.2 | 165.0 | 9.2 | 13.9 | 131.8 | 9.8 | 61.9 | 131.8 | 71.4 | |
| 30 May 2017 | 32.0 | 6.8 | 0.2 | 9.3 | 156.8 | 5.9 | 12.3 | 64.4 | 4.5 | 60.8 | 98.9 | 67.3 |
| 7 June 2017 | 3.6 | 6.9 | 0.1 | 63.2 | 258.2 | 18.3 | 37.5 | 464.8 | 53.6 | 161.1 | 349.4 | 305.7 |
| 13 June 2017 | 44.7 | 6.6 | 0.3 | 91.8 | 3.1 | 6.5 | 42.3 | 4.4 | 29.2 | 72.6 | 33.1 | |
| 20 June 2017 | 25.9 | 7.0 | 0.1 | 52.2 | 5.5 | 13.5 | 91.0 | 5.6 | 18.0 | 14.4 | 95.7 | |
| 5 July 2017 | 70.4 | 5.9 | 1.4 | 7.8 | 82.7 | 3.1 | 19.9 | 11.7 | 33.3 | 76.5 | ||
| 12 July 2017 | 85.1 | 6.3 | 0.6 | 3.6 | 66.6 | 4.4 | 39.4 | 6.3 | 29.6 | 41.5 | 12.4 | |
| 18 July 2017 | 15.0 | 5.8 | 1.7 | 6.7 | 136.2 | 4.3 | 5.0 | 58.5 | 28.8 | 63.1 | 108.7 | 3.1 |
| 26 July 2017 | 38.8 | 6.0 | 0.9 | 170.7 | 3.4 | 6.4 | 51.4 | 25.2 | 89.8 | 120.7 | 13.1 | |
| 1 August 2017 | 5.3 | 6.7 | 0.2 | 132.0 | 6.2 | 7.4 | 155.5 | 8.6 | 72.4 | 103.0 | 95.5 | |
| 8 August 2017 | 5.8 | 7.0 | 0.1 | 16.6 | 192.7 | 8.2 | 51.4 | 12.9 | 67.6 | 61.5 | 70.5 | |
| 15 August 2017 | 28.7 | 6.5 | 0.3 | 62.9 | 2.5 | 33.1 | 6.9 | 19.5 | 36.2 | 47.4 | ||
| 23 August 2017 | 87.1 | 6.5 | 0.3 | 46.5 | 2.1 | 4.9 | 13.7 | 3.9 | 18.2 | 23.4 | 19.0 | |
| 29 August 2017 | 70.9 | 6.2 | 0.7 | 87.7 | 26.0 | 7.1 | 26.2 | 64.4 | 9.3 | |||
| 5 September 2017 | 94.2 | 5.8 | 1.5 | 2.9 | 52.9 | 14.1 | 4.2 | 18.5 | 41.4 | 8.0 | ||
| 12 September 2017 | 25.4 | 6.6 | 0.2 | 9.0 | 65.0 | 1.7 | 4.7 | 18.4 | 5.7 | 16.6 | 25.1 | 43.5 |
| 19 September 2017 | 25.4 | 6.4 | 0.4 | 2.3 | 42.6 | 1.6 | 16.0 | 3.4 | 9.1 | 20.3 | 24.9 | |
| 24 October 2017 | 6.6 | 6.5 | 0.4 | 15.9 | 172.6 | 7.0 | 13.7 | 154.5 | 12.6 | 58.9 | 112.2 | 111.7 |
| 7 November 2017 | 8.6 | 5.7 | 1.8 | 15.8 | 304.8 | 5.0 | 10.7 | 107.1 | 14.5 | 233.3 | 186.5 | 9.4 |
| 10 May 2018 | 33.3 | 6.5 | 0.3 | 0.4 | 88.8 | 1.9 | 0.2 | 42.4 | 6.5 | 29.0 | 78.6 | 25.4 |
| 17 May 2018 | 1.1 | 7.6 | 0.0 | 15.7 | 535.5 | 37.3 | 72.7 | 1209.7 | 50.8 | 564.0 | 750.8 | 409.5 |
| 24 May 2018 | 30.3 | 7.0 | 0.1 | 0.4 | 141.9 | 7.5 | 14.0 | 102.4 | 5.7 | 54.5 | 121.7 | 105.9 |
| 14 June 2018 | 78.2 | 6.0 | 0.9 | 3.2 | 67.0 | 1.8 | 20.4 | 2.1 | 33.2 | 39.2 | 10.4 | |
| 21 June 2018 | 60.8 | 5.8 | 1.5 | 1.6 | 118.1 | 20.4 | 39.8 | 2.5 | 74.9 | 55.7 | 27.5 | |
| 28 June 2018 | 49.2 | 6.5 | 0.3 | 2.5 | 114.2 | 1.4 | 45.7 | 4.5 | 63.9 | 53.9 | 27.6 | |
| 5 July 2018 | 22.3 | 6.9 | 0.1 | 21.8 | 101.1 | 4.0 | 6.7 | 105.5 | 9.7 | 54.4 | 45.2 | 128.4 |
| 12 July 2018 | 33.2 | 6.7 | 0.2 | 6.0 | 81.1 | 1.9 | 1.6 | 46.1 | 9.4 | 35.2 | 36.3 | 59.3 |
| 19 July 2018 | 47.7 | 6.9 | 0.1 | 4.7 | 83.4 | 2.3 | 41.3 | 3.6 | 30.8 | 29.9 | 69.3 | |
| 26 July 2018 | 25.7 | 6.8 | 0.2 | 9.0 | 45.8 | 3.5 | 5.6 | 71.8 | 5.6 | 18.9 | 29.3 | 80.4 |
| 2 August 2018 | 12.5 | 7.1 | 0.1 | 19.1 | 149.1 | 4.6 | 7.0 | 128.0 | 14.9 | 81.8 | 92.0 | 116.8 |
| 9 August 2018 | 40.3 | 6.9 | 0.1 | 19.4 | 116.5 | 2.2 | 3.5 | 45.7 | 9.4 | 34.4 | 47.5 | 63.0 |
| 16 August 2018 | 49.5 | 5.9 | 1.2 | 1.6 | 72.9 | 1.1 | 2.5 | 28.1 | 5.8 | 44.9 | 51.2 | 3.5 |
| 23 August 2018 | 11.9 | 7.1 | 0.1 | 10.5 | 133.6 | 2.4 | 2.1 | 96.1 | 14.9 | 65.3 | 61.9 | 102.9 |
| 6 September 2018 | 32.7 | 6.4 | 0.4 | 1.7 | 88.9 | 0.9 | 1.6 | 21.8 | 3.8 | 25.5 | 53.6 | 25.4 |
| 13 September 2018 | 29.3 | 4.7 | 19.1 | 1.2 | 105.3 | 0.1 | 28.8 | 2.9 | 41.2 | 109.4 | ||
| 20 September 2018 | 18.6 | 4.9 | 12.3 | 12.2 | 192.3 | 3.7 | 57.0 | 18.4 | 116.5 | 131.8 | ||
| 27 September 2018 | 68.8 | 6.8 | 0.2 | 0.5 | 69.7 | 1.4 | 2.1 | 35.2 | 2.5 | 25.8 | 28.6 | 44.5 |
| 4 October 2018 | 3.7 | 7.3 | 0.1 | 10.0 | 169.7 | 4.7 | 9.0 | 229.2 | 11.3 | 84.8 | 104.5 | 190.3 |
| 11 October 2018 | 18.9 | 6.7 | 0.2 | 8.3 | 182.2 | 2.9 | 3.9 | 110.8 | 8.9 | 103.6 | 66.1 | 111.2 |
| 18 October 2018 | 7.9 | 6.9 | 0.1 | 4.5 | 153.5 | 2.0 | 1.4 | 59.6 | 6.3 | 62.3 | 55.2 | 89.8 |
| 25 October 2018 | 2.8 | 7.0 | 0.1 | 3.2 | 104.7 | 1.7 | 3.6 | 70.1 | 22.3 | 34.8 | 32.1 | 97.4 |
| 8 November 2018 | 68.8 | 6.8 | 0.2 | 5.0 | 138.4 | 2.2 | 5.7 | 74.3 | 6.6 | 67.9 | 84.2 | 81.4 |
| 15 November 2018 | 20.0 | 5.5 | 3.4 | 3.8 | 75.2 | 1.1 | 2.1 | 33.6 | 5.0 | 18.9 | 99.3 | |
| 3 May 2019 | 12.2 | 7.6 | 0.0 | 30.7 | 340.3 | 27.3 | 48.1 | 550.0 | 44.9 | 247.7 | 318.2 | 414.7 |
| 16 May 2019 | 22.9 | 6.8 | 0.2 | 3.2 | 152.8 | 4.2 | 4.8 | 73.8 | 7.7 | 40.3 | 114.8 | 74.2 |
| 23 May 2019 | 6.5 | 7.4 | 0.0 | 13.5 | 293.3 | 33.0 | 36.5 | 333.5 | 35.0 | 202.8 | 330.5 | 101.2 |
| 30 May 2019 | 2.0 | 7.4 | 0.0 | 23.5 | 213.6 | 8.0 | 17.0 | 229.0 | 26.3 | 96.8 | 108.0 | 180.4 |
| 6 June 2019 | 29.2 | 6.9 | 0.1 | 2.2 | 53.2 | 0.6 | 0.8 | 80.1 | 6.6 | 28.5 | 39.9 | 48.9 |
| 13 June 2019 | 41.4 | 6.5 | 0.3 | 1.1 | 87.0 | 0.6 | 2.7 | 26.9 | 2.7 | 33.0 | 46.4 | 33.3 |
| 20 June 2019 | 17.8 | 7.3 | 0.0 | 4.0 | 83.0 | 2.1 | 8.5 | 138.9 | 4.6 | 32.5 | 36.0 | 134.5 |
| 27 June 2019 | 67.8 | 6.4 | 0.4 | 0.9 | 81.6 | 0.7 | 2.7 | 27.7 | 4.9 | 25.6 | 48.2 | 35.7 |
| 5 July 2019 | 29.2 | 7.0 | 0.1 | 5.2 | 114.5 | 2.8 | 2.4 | 79.2 | 6.1 | 53.5 | 52.3 | 69.4 |
| 11 July 2019 | 35.3 | 6.5 | 0.3 | 7.3 | 128.6 | 2.3 | 2.7 | 98.1 | 8.9 | 62.3 | 124.0 | 42.9 |
| 18 July 2019 | 44.7 | 6.6 | 0.3 | 4.1 | 122.3 | 0.8 | 31.4 | 5.1 | 48.7 | 58.2 | 43.0 | |
| 25 July 2019 | 44.3 | 6.8 | 0.2 | 4.3 | 95.7 | 1.4 | 6.2 | 29.1 | 6.7 | 28.4 | 49.1 | 48.3 |
| 1 August 2019 | 99.3 | 6.6 | 0.3 | 1.6 | 88.4 | 0.5 | 3.6 | 29.6 | 4.0 | 32.0 | 35.7 | 36.4 |
| 8 August 2019 | 38.2 | 5.1 | 7.8 | 0.7 | 72.7 | 0.2 | 3.8 | 6.2 | 4.2 | 34.2 | 55.3 | |
| 15 August 2019 | 36.5 | 6.7 | 0.2 | 2.3 | 74.2 | 0.8 | 5.0 | 30.2 | 4.3 | 23.3 | 37.5 | 35.2 |
| 29 August 2019 | 13.0 | 6.6 | 0.3 | 4.3 | 182.1 | 2.6 | 0.7 | 79.0 | 9.8 | 85.6 | 118.1 | 41.5 |
| 12 September 2019 | 33.8 | 6.2 | 0.6 | 5.6 | 99.8 | 2.1 | 2.0 | 54.9 | 7.2 | 45.8 | 83.2 | 19.6 |
| 20 September 2019 | 138.5 | 6.5 | 0.3 | 0.7 | 56.1 | 0.1 | 3.0 | 28.5 | 3.9 | 20.1 | 31.5 | 35.9 |
| 26 September 2019 | 78.0 | 6.1 | 0.8 | 6.1 | 127.2 | 3.2 | 2.9 | 35.0 | 6.6 | 51.1 | 96.1 | 11.2 |
| 3 October 2019 | 37.2 | 6.7 | 0.2 | 1.7 | 70.7 | 0.5 | 2.1 | 23.0 | 3.5 | 15.6 | 20.2 | 40.9 |
| 10 October 2019 | 3.3 | 6.8 | 0.1 | 7.0 | 71.6 | 2.2 | 8.5 | 69.4 | 6.0 | 19.8 | 28.9 | 101.5 |
| 17 October 2019 | 20.6 | 6.9 | 0.1 | 4.5 | 68.5 | 2.7 | 6.7 | 59.8 | 4.6 | 17.5 | 23.3 | 67.0 |
| 24 October 2019 | 13.0 | 6.7 | 0.2 | 3.2 | 76.6 | 0.4 | 2.7 | 36.5 | 3.2 | 28.1 | 15.9 | 40.1 |
| 31 October 2019 | 61.1 | 4.9 | 12.4 | 2.3 | 154.3 | 1.2 | 6.2 | 26.9 | 5.9 | 77.8 | 130.1 | |
| 7 November 2019 | 29.1 | 6.8 | 0.2 | 2.0 | 122.7 | 1.4 | 5.8 | 65.9 | 5.1 | 89.4 | 87.0 |
Appendix B
| Sample | pH | Conductivity (µs/cm) | Na+ | NH4+ | K+ | Mg2+ | Ca2+ | Br− | Cl− | NO3− | SO42− | HCO3− |
|---|---|---|---|---|---|---|---|---|---|---|---|---|
| TM-G0-L-B | 5.59 | 23.09 | 0.11 | 1.34 | 0.10 | 0.03 | 0.83 | 0.00 | 0.45 | 1.90 | 2.77 | 0.00 |
| TM-G2-L-B | 5.87 | 24.52 | 0.19 | 1.34 | 0.17 | 0.04 | 0.93 | 0.00 | 0.49 | 1.65 | 2.80 | 9.70 |
| TM-G4-L-B | 5.64 | 19.69 | 0.19 | 1.30 | 0.14 | 0.04 | 0.84 | 0.00 | 0.45 | 1.61 | 2.66 | 3.19 |
| TM-G6-L-B | 5.96 | 26.78 | 0.18 | 1.32 | 1.48 | 0.04 | 0.89 | 0.00 | 1.92 | 1.43 | 2.49 | 11.28 |
| TM-G8-L-B | 5.32 | 24.07 | 0.18 | 1.19 | 0.35 | 0.03 | 0.81 | 0.00 | 0.69 | 1.36 | 2.68 | 0.00 |
| TM-G10-L-B | 5.23 | 29.57 | 0.10 | 1.57 | 0.14 | 0.04 | 0.98 | 0.00 | 0.69 | 3.25 | 5.51 | 0.00 |
| TM-G0-L-1 | 5.96 | 26.35 | 0.18 | 1.28 | 0.27 | 0.09 | 1.52 | 0.00 | 1.07 | 2.09 | 2.72 | 8.45 |
| TM-G2-L-1 | 6.03 | 26.91 | 0.37 | 1.31 | 0.23 | 0.08 | 1.23 | 0.00 | 0.92 | 1.77 | 2.81 | 8.31 |
| TM-G4-L-1 | 6.04 | 24.15 | 0.20 | 1.43 | 0.14 | 0.04 | 0.97 | 0.00 | 0.50 | 1.69 | 2.85 | 7.44 |
| TM-G6-L-1 | 5.93 | 29.16 | 0.17 | 1.43 | 0.52 | 0.04 | 1.00 | 0.00 | 1.10 | 2.93 | 4.84 | 7.45 |
| TM-G8-L-1 | 5.81 | 28.61 | 0.18 | 1.49 | 0.30 | 0.06 | 1.18 | 0.00 | 0.87 | 2.73 | 4.32 | 8.00 |
| TM-G10-L-1 | 5.78 | 30.53 | 0.11 | 1.70 | 0.17 | 0.08 | 1.28 | 0.00 | 0.93 | 3.49 | 5.49 | 2.59 |
| TM-G0-L-2 | 6.42 | 26.63 | 0.23 | 1.25 | 0.48 | 0.08 | 1.36 | 0.00 | 0.65 | 1.98 | 2.77 | 16.89 |
| TM-G2-L-2 | 6.02 | 26.12 | 0.18 | 1.36 | 0.23 | 0.06 | 1.17 | 0.00 | 0.51 | 1.73 | 2.81 | 47.13 |
| TM-G4-L-2 | 5.95 | 23.97 | 0.20 | 1.29 | 0.15 | 0.04 | 0.92 | 0.00 | 0.50 | 1.51 | 2.67 | 8.83 |
| TM-G6-L-2 | 5.74 | 28.47 | 0.16 | 1.41 | 0.68 | 0.04 | 0.96 | 0.00 | 1.07 | 2.94 | 4.73 | 0.90 |
| TM-G8-L-2 | 5.85 | 27.28 | 0.18 | 1.46 | 0.32 | 0.06 | 1.09 | 0.00 | 0.80 | 3.06 | 4.84 | 2.83 |
| TM-G10-L-2 | 6.42 | 31.48 | 0.15 | 1.65 | 0.29 | 0.11 | 1.54 | 0.00 | 0.85 | 3.58 | 5.69 | 16.89 |
| TM-G0-L-3 | 6.38 | 28.47 | 0.23 | 1.28 | 0.47 | 0.11 | 2.12 | 0.00 | 0.87 | 2.31 | 3.47 | 23.41 |
| TM-G2-L-3 | 6.36 | 28.34 | 0.21 | 1.32 | 0.30 | 0.10 | 1.95 | 0.00 | 0.78 | 2.92 | 4.58 | 11.54 |
| TM-G4-L-3 | 6.18 | 27.65 | 0.20 | 1.39 | 0.25 | 0.08 | 1.83 | 0.00 | 0.65 | 2.41 | 3.47 | 21.33 |
| TM-G6-L-3 | 6.35 | 28.88 | 0.20 | 1.43 | 0.74 | 0.08 | 1.67 | 0.00 | 1.03 | 2.35 | 3.54 | 12.04 |
| TM-G8-L-3 | 6.59 | 35.45 | 0.39 | 1.72 | 0.69 | 0.13 | 2.57 | 0.00 | 1.28 | 3.33 | 5.21 | 42.11 |
| TM-G10-L-3 | 6.26 | 32.72 | 0.13 | 1.66 | 0.23 | 0.11 | 2.10 | 0.00 | 1.00 | 3.55 | 5.60 | 16.00 |
| TM-G0-L-4 | 6.06 | 27.24 | 0.21 | 1.25 | 0.33 | 0.08 | 1.25 | 0.00 | 0.84 | 2.14 | 2.61 | 9.72 |
| TM-G2-L-4 | 5.79 | 24.71 | 0.18 | 1.38 | 0.20 | 0.06 | 1.06 | 0.00 | 0.60 | 1.85 | 2.87 | 4.60 |
| TM-G4-L-4 | 5.60 | 26.97 | 0.21 | 1.45 | 0.16 | 0.04 | 0.95 | 0.00 | 0.67 | 3.06 | 4.97 | 4.10 |
| TM-G6-L-4 | 5.70 | 28.20 | 0.18 | 1.45 | 0.59 | 0.04 | 0.97 | 0.00 | 0.94 | 1.53 | 2.76 | 8.80 |
| TM-G8-L-4 | 5.81 | 27.93 | 0.16 | 1.53 | 0.29 | 0.05 | 1.06 | 0.00 | 0.78 | 3.06 | 4.89 | 3.23 |
| TM-G10-L-4 | 5.75 | 31.07 | 0.14 | 1.68 | 0.20 | 0.07 | 1.20 | 0.00 | 0.79 | 2.74 | 5.17 | 4.10 |
| TM-G0-L-5 | 5.70 | 24.85 | 0.14 | 1.30 | 0.22 | 0.05 | 1.05 | 0.00 | 0.45 | 1.92 | 3.08 | 5.43 |
| TM-G2-L-5 | 5.87 | 25.05 | 0.16 | 1.41 | 0.17 | 0.05 | 1.00 | 0.00 | 0.78 | 3.08 | 5.40 | 3.69 |
| TM-G4-L-5 | 5.68 | 26.15 | 0.19 | 1.40 | 0.14 | 0.04 | 0.98 | 0.00 | 0.61 | 3.06 | 4.91 | 3.80 |
| TM-G6-L-5 | 5.72 | 28.34 | 0.19 | 1.43 | 0.67 | 0.04 | 0.94 | 0.00 | 1.25 | 3.04 | 2.65 | 4.76 |
| TM-G8-L-5 | 5.70 | 26.76 | 0.16 | 1.44 | 0.30 | 0.04 | 1.07 | 0.00 | 0.08 | 3.06 | 4.88 | 5.43 |
| TM-G10-L-5 | 5.58 | 29.29 | 0.11 | 1.63 | 0.15 | 0.05 | 1.07 | 0.00 | 0.66 | 3.27 | 5.49 | 0.00 |
| TM-G0-L-6 | 5.94 | 28.61 | 0.26 | 1.26 | 0.46 | 0.09 | 1.69 | 0.00 | 1.03 | 2.22 | 2.83 | 18.54 |
| TM-G2-L-6 | 5.79 | 26.20 | 0.20 | 1.34 | 0.25 | 0.06 | 1.19 | 0.00 | 0.68 | 1.98 | 2.88 | 8.56 |
| TM-G4-L-6 | 5.96 | 21.05 | 0.18 | 1.25 | 0.18 | 0.05 | 0.91 | 0.00 | 0.50 | 1.44 | 2.72 | 10.60 |
| TM-G6-L-6 | 6.16 | 31.48 | 0.21 | 1.43 | 0.92 | 0.07 | 1.25 | 0.00 | 1.67 | 3.26 | 4.74 | 3.75 |
| TM-G8-L-6 | 5.76 | 28.06 | 0.17 | 1.44 | 0.33 | 0.05 | 1.06 | 0.00 | 0.62 | 2.29 | 3.53 | 3.53 |
| TM-G10-L-6 | 6.24 | 32.44 | 0.20 | 1.71 | 0.35 | 0.10 | 1.82 | 0.00 | 0.89 | 3.32 | 5.57 | 13.33 |
| TM-G0-AA-B | 6.11 | 3.99 | 0.026 | 0.002 | 0.012 | 0.041 | 0.55 | 0 | 0.074 | 0.075 | 0.077 | 6.77 |
| TM-G10-AA-B | 5.49 | 2.9 | 0.026 | 0.002 | 0.012 | 0.041 | 0.55 | 0 | 0.349 | 0.135 | 0 | 0 |
| TM-G0-AA-1 | 7.35 | 47.4 | 0.795 | 0.465 | 1.203 | 0.609 | 5.726 | 0 | 9.068 | 2.323 | 1.887 | 103.55 |
| TM-G10-AA-1 | 7.35 | 104.4 | 1.891 | 0.594 | 2.819 | 1.357 | 11.917 | 0 | 21.169 | 8.674 | 3.196 | 177.96 |
| TM-G0-AA-2 | 7 | 16.97 | 0.697 | 0.066 | 0.923 | 0.165 | 1.749 | 0 | 1.193 | 0 | 1.132 | 61.9 |
| TM-G10-AA-2 | 7.56 | 38 | 1.162 | 0.801 | 1.663 | 0.462 | 3.674 | 0 | 2.126 | 2.759 | 1.683 | 253.49 |
| TM-G0-AA-3 | 6.89 | 26.22 | 0.6 | 0.003 | 0.999 | 0.225 | 3.086 | 0 | 2.679 | 0.914 | 1.007 | 86.21 |
| TM-G10-AA-3 | 7.56 | 64.2 | 1.142 | 0.418 | 0.849 | 0.776 | 8.557 | 0 | 5.976 | 2.723 | 1.986 | 217.23 |
| TM-G0-AA-4 | 6.96 | 55.13 | 1.743 | 0.605 | 2.103 | 0.839 | 6.407 | 0 | 8.534 | 4.337 | 1.943 | 106.24 |
| TM-G10-AA-4 | 7.18 | 62.9 | 1.743 | 0.605 | 2.103 | 0.839 | 6.407 | 0 | 10.205 | 7.556 | 2.056 | 90.1 |
| TM-G0-AA-5 | 7.42 | 28.024 | 0.75 | 0.372 | 1.08 | 0.326 | 3.15 | 0 | 1.236 | 0.439 | 0.592 | 154.75 |
| TM-G10-AA-5 | 7.23 | 28.024 | 0.75 | 0.372 | 1.08 | 0.326 | 3.15 | 0 | 1.382 | 1.518 | 0.996 | 106.24 |
| TM-G0-AA-6 | 7.56 | 59.89 | 1.321 | 0.303 | 1.747 | 0.451 | 7.814 | 0 | 7.506 | 3.112 | 3.013 | 131.87 |
| TM-G10-AA-6 | 7.28 | 45.991 | 1.013 | 0.877 | 1.485 | 0.466 | 5.084 | 0 | 4.222 | 3.868 | 1.841 | 115.97 |
| TM-N0-L-B | 6.41 | 14.57 | 0.27 | 1.11 | 0.05 | 0.22 | 1.19 | 0.00 | 0.37 | 2.44 | 2.13 | 20.16 |
| TM-N2-L-B | 5.66 | 13.37 | 0.21 | 0.83 | 0.00 | 0.13 | 1.14 | 0.00 | 0.33 | 2.52 | 2.25 | 3.97 |
| TM-N4-L-B | 6.03 | 15.57 | 0.15 | 0.84 | 0.12 | 0.01 | 0.94 | 0.00 | 0.32 | 2.85 | 2.52 | 8.17 |
| TM-N6-L-B | 5.66 | 13.94 | 0.13 | 0.53 | 0.00 | 0.02 | 0.72 | 0.00 | 0.35 | 2.28 | 2.46 | 3.41 |
| TM-N8-L-B | 5.99 | 15.63 | 0.16 | 0.92 | 0.13 | 0.01 | 0.88 | 0.00 | 0.44 | 3.14 | 2.85 | 12.68 |
| TM-N10-L-B | 6.12 | 15.59 | 0.16 | 0.93 | 0.21 | 0.00 | 0.94 | 0.00 | 0.33 | 2.80 | 2.57 | 10.60 |
| TM-N0-L-1 | 6.53 | 21.13 | 0.27 | 0.90 | 0.00 | 0.00 | 2.87 | 0.00 | 0.84 | 2.55 | 2.10 | 61.33 |
| TM-N2-L-1 | 6.12 | 15.36 | 0.25 | 0.99 | 0.28 | 0.16 | 1.19 | 0.00 | 0.48 | 2.73 | 2.32 | 15.62 |
| TM-N4-L-1 | 6.39 | 16.77 | 0.17 | 0.97 | 0.15 | 0.03 | 1.17 | 0.00 | 0.49 | 3.17 | 2.68 | 50.72 |
| TM-N6-L-1 | 6.24 | 16.68 | 0.28 | 0.81 | 0.28 | 0.01 | 1.27 | 0.00 | 0.46 | 2.73 | 2.49 | 15.77 |
| TM-N8-L-1 | 6.08 | 16.37 | 0.14 | 0.94 | 0.31 | 0.01 | 1.07 | 0.00 | 0.35 | 2.85 | 2.61 | 10.73 |
| TM-N10-L-1 | 5.96 | 17.09 | 0.16 | 0.93 | 0.29 | 0.05 | 1.16 | 0.00 | 0.40 | 3.04 | 2.71 | 14.12 |
| TM-N0-L-2 | 6.38 | 41.74 | 0.50 | 0.86 | 0.59 | 0.36 | 6.02 | 0.00 | 5.35 | 3.95 | 2.78 | 72.64 |
| TM-N2-L-2 | 5.95 | 15.37 | 0.20 | 0.94 | 0.12 | 0.17 | 1.41 | 0.00 | 0.55 | 2.37 | 2.06 | 16.83 |
| TM-N4-L-2 | 6.18 | 15.86 | 0.15 | 0.94 | 0.18 | 0.03 | 1.12 | 0.00 | 2.33 | 2.09 | 1.70 | 14.58 |
| TM-N6-L-2 | 6.3 | 21.09 | 0.17 | 0.91 | 0.27 | 0.11 | 1.56 | 0.00 | 1.46 | 3.08 | 2.60 | 15.23 |
| TM-N8-L-2 | 5.98 | 16.31 | 0.20 | 0.94 | 0.16 | 0.01 | 1.06 | 0.00 | 0.49 | 2.94 | 2.66 | 10.33 |
| TM-N10-L-2 | 6.18 | 16.76 | 0.13 | 0.99 | 0.21 | 0.02 | 1.12 | 0.00 | 0.44 | 2.98 | 2.66 | 12.25 |
| TM-N0-L-3 | 6.61 | 24.24 | 0.52 | 0.53 | 0.57 | 0.20 | 3.20 | 0.00 | 0.80 | 2.75 | 2.35 | 71.35 |
| TM-N2-L-3 | 6.21 | 14.93 | 0.15 | 1.04 | 0.14 | 0.15 | 1.15 | 0.00 | 0.31 | 2.35 | 2.05 | 18.94 |
| TM-N4-L-3 | 6.21 | 16.57 | 0.11 | 0.82 | 0.23 | 0.01 | 0.86 | 0.00 | 0.38 | 0.29 | 2.53 | 61.25 |
| TM-N6-L-3 | 6.76 | 16.65 | 0.22 | 1.00 | 0.23 | 0.02 | 1.86 | 0.00 | 0.42 | 2.31 | 2.17 | 47.94 |
| TM-N8-L-3 | 5.91 | 15.94 | 0.12 | 0.88 | 0.20 | 0.00 | 0.95 | 0.00 | 0.34 | 2.87 | 2.59 | 6.88 |
| TM-N10-L-3 | 5.76 | 15.68 | 0.20 | 0.81 | 0.21 | 0.00 | 0.99 | 0.00 | 0.39 | 2.99 | 2.73 | 7.40 |
| TM-N0-L-4 | 6.32 | 15.25 | 0.22 | 1.04 | 0.17 | 0.14 | 1.33 | 0.00 | 0.47 | 2.77 | 2.37 | 20.44 |
| TM-N2-L-4 | 5.94 | 14.45 | 0.17 | 1.02 | 0.00 | 0.14 | 1.20 | 0.00 | 0.32 | 2.37 | 2.02 | 28.80 |
| TM-N4-L-4 | 5.82 | 15.86 | 0.10 | 0.70 | 0.00 | 0.01 | 0.67 | 0.00 | 0.33 | 0.29 | 2.45 | 21.41 |
| TM-N6-L-4 | 6.23 | 16.12 | 0.12 | 0.85 | 0.35 | 0.01 | 0.93 | 0.00 | 0.42 | 2.87 | 2.55 | 19.83 |
| TM-N8-L-4 | 6.3 | 15.87 | 0.17 | 0.95 | 0.22 | 0.01 | 0.99 | 0.00 | 0.35 | 2.85 | 2.59 | 13.48 |
| TM-N10-L-4 | 5.75 | 15.98 | 0.16 | 0.90 | 0.32 | 0.03 | 1.03 | 0.00 | 0.36 | 3.04 | 2.66 | 7.52 |
| TM-N0-L-5 | 6.37 | 16.97 | 0.20 | 0.47 | 0.28 | 0.03 | 1.75 | 0.00 | 0.42 | 2.67 | 2.26 | 36.81 |
| TM-N2-L-5 | 5.96 | 13.92 | 0.12 | 0.83 | 0.35 | 0.02 | 0.89 | 0.00 | 0.32 | 2.42 | 2.09 | 23.61 |
| TM-N4-L-5 | 6.04 | 15.66 | 0.16 | 0.83 | 0.11 | 0.02 | 1.05 | 0.00 | 0.35 | 2.91 | 2.49 | 12.73 |
| TM-N6-L-5 | 6.05 | 16.18 | 0.12 | 0.90 | 0.27 | 0.01 | 0.80 | 0.00 | 0.33 | 2.82 | 2.50 | 18.13 |
| TM-N8-L-5 | 5.92 | 16.12 | 0.12 | 0.92 | 0.17 | 0.00 | 0.96 | 0.00 | 0.36 | 2.80 | 2.58 | 5.32 |
| TM-N10-L-5 | 5.97 | 15.89 | 0.14 | 0.97 | 0.15 | 0.00 | 0.93 | 0.00 | 0.33 | 2.80 | 2.57 | 9.49 |
| TM-N0-L-6 | 6.12 | 17.03 | 0.28 | 0.30 | 0.32 | 0.02 | 1.50 | 0.00 | 0.57 | 2.56 | 2.28 | 22.60 |
| TM-N2-L-6 | 6.12 | 14.19 | 0.19 | 0.82 | 0.45 | 0.01 | 0.97 | 0.00 | 0.34 | 2.45 | 2.13 | 8.39 |
| TM-N4-L-6 | 6.29 | 16.24 | 0.14 | 0.97 | 0.13 | 0.00 | 1.07 | 0.00 | 0.26 | 2.72 | 2.29 | 17.96 |
| TM-N6-L-6 | 5.99 | 16.81 | 0.21 | 0.69 | 0.20 | 0.00 | 1.27 | 0.00 | 0.42 | 2.89 | 2.23 | 11.92 |
| TM-N8-L-6 | 6.26 | 16.23 | 0.15 | 0.97 | 0.36 | 0.05 | 1.05 | 0.00 | 0.33 | 2.70 | 2.49 | 12.21 |
| TM-N10-L-6 | 6.07 | 16.1 | 0.09 | 0.99 | 0.23 | 0.03 | 1.05 | 0.00 | 0.34 | 2.81 | 2.61 | 9.39 |
| TM-N0-AA-B | 6.39 | 6.52 | 0.27 | 0.355 | 0.414 | 0.023 | 0.257 | 0 | 0.097 | 0.272 | 0.254 | 35.77 |
| TM-N10-AA-B | 6.16 | 1.95 | 0.07 | 0.001 | 0.18 | 0 | 0 | 0 | 0.02 | 0 | 0 | 11.35 |
| TM-N0-AA-1 | 7.51 | 123 | 2.406 | 0 | 2.344 | 1.497 | 10.332 | 0 | 10.2 | 4.14 | 3.48 | 553.23 |
| TM-N10-AA-1 | 7.27 | 71.92 | 1.36 | 0.237 | 1.356 | 0.974 | 9.28 | 0 | 6.065 | 3.22 | 1.575 | 280.57 |
| TM-N0-AA-2 | 7.35 | 350.9 | 3.558 | 0.318 | 5.26 | 4.19 | 49.11 | 0 | 61.94 | 16.21 | 5.42 | 474.64 |
| TM-N10-AA-2 | 6.59 | 51.388 | 0.887 | 0 | 0.902 | 0.489 | 6.17 | 0 | 9.387 | 0.491 | 0.907 | 59.83 |
| TM-N0-AA-3 | 7.49 | 160 | 2.519 | 0.59 | 2.365 | 2.113 | 18.627 | 0 | 16 | 3.31 | 2.05 | 532.98 |
| TM-N10-AA-3 | 6.83 | 39.324 | 0.795 | 0.496 | 0.845 | 0.408 | 4.609 | 0 | 4.077 | 2.32 | 1.097 | 113.7 |
| TM-N0-AA-4 | 7.33 | 81.6 | 3.49 | 0 | 2.079 | 1.267 | 6.216 | 0 | 5.625 | 2.961 | 0 | 373.52 |
| TM-N10-AA-4 | 6.83 | 28.072 | 0.767 | 0.405 | 0.773 | 0.245 | 1.883 | 0 | 1.694 | 1.186 | 0.867 | 111.07 |
| TM-N0-AA-5 | 6.88 | 67.3 | 2.719 | 0 | 2.143 | 0.877 | 5.053 | 0 | 1.907 | 1.382 | 2.087 | 347.04 |
| TM-N10-AA-5 | 6.86 | 27.608 | 0.759 | 0.481 | 0.752 | 0.194 | 1.592 | 0 | 0.962 | 0.855 | 1.153 | 124.1 |
| TM-N0-AA-6 | 7.25 | 149.8 | 6.283 | 1.497 | 3.908 | 1.488 | 9.127 | 0 | 17.796 | 6.122 | 9.336 | 375.24 |
| TM-N10-AA-6 | 6.89 | 39.644 | 1.033 | 0.297 | 0.743 | 0.309 | 3.342 | 0 | 1.536 | 2.056 | 1.72 | 182.9 |
| TM-A0-L-B | 5.05 | 23.52 | 0.788 | 0.829 | 0.137 | 0.031 | 0.542 | 0 | 0.629 | 3.316 | 3.556 | 0 |
| TM-A2-L-B | 5.03 | 23.63 | 0.783 | 0.834 | 0.152 | 0.03 | 0.553 | 0 | 0.595 | 3.228 | 3.553 | 0 |
| TM-A4-L-B | 5.23 | 16.91 | 0.381 | 0.718 | 0.143 | 0.031 | 0.598 | 0 | 0.582 | 3.299 | 1.938 | 0 |
| TM-A6-L-B | 5.11 | 15.46 | 0.155 | 0.557 | 0.01 | 0.028 | 0.493 | 0 | 0.565 | 2.911 | 1.468 | 0 |
| TM-A8-L-B | 5.12 | 16.25 | 0.205 | 0.637 | 0.256 | 0.034 | 0.596 | 0 | 0.534 | 2.357 | 1.062 | 0 |
| TM-A10-L-B | 5.01 | 17.29 | 0.119 | 0.615 | 0.146 | 0.016 | 0.526 | 0 | 0.587 | 3.141 | 1.462 | 0 |
| TM-A0-L-1 | 5.23 | 25.09 | 1.055 | 0.749 | 0.322 | 0.065 | 1.067 | 0 | 0.898 | 3.279 | 3.806 | 0 |
| TM-A2-L-1 | 5.36 | 22.29 | 0.912 | 0.951 | 0.298 | 0.038 | 0.759 | 0 | 0.725 | 3.341 | 3.618 | 0 |
| TM-A4-L-1 | 5.28 | 16.69 | 0.356 | 0.685 | 0.138 | 0.036 | 0.629 | 0 | 0.571 | 3.148 | 1.933 | 0 |
| TM-A6-L-1 | 5.29 | 14.92 | 1.49 | 0.53 | 0.14 | 0 | 0.645 | 0 | 0.807 | 3.667 | 1.873 | 0 |
| TM-A8-L-1 | 5.1 | 16.43 | 0.153 | 0.616 | 0.225 | 0.027 | 0.61 | 0 | 0.526 | 2.403 | 1.044 | 0 |
| TM-A10-L-1 | 5.24 | 15.69 | 0.136 | 0.644 | 0.187 | 0.02 | 0.673 | 0 | 0.682 | 3.162 | 1.434 | 0 |
| TM-A0-L-2 | 5.81 | 24.19 | 1.057 | 0.689 | 0.466 | 0.088 | 1.438 | 0 | 0.967 | 3.587 | 3.793 | 8.21 |
| TM-A2-L-2 | 5.65 | 21.5 | 0.873 | 0.85 | 0.263 | 0.053 | 0.958 | 0 | 0.755 | 3.254 | 3.628 | 0 |
| TM-A4-L-2 | 5.56 | 15.57 | 0.35 | 0.7 | 0.115 | 0.047 | 0.889 | 0 | 0.539 | 2.998 | 1.773 | 0 |
| TM-A6-L-2 | 5.66 | 13.73 | 0.229 | 0.561 | 0.141 | 0.053 | 0.801 | 0 | 0.582 | 2.677 | 1.344 | 0 |
| TM-A8-L-2 | 5.3 | 15.23 | 0.154 | 0.603 | 0.265 | 0.024 | 0.786 | 0 | 0.661 | 3.04 | 1.349 | 0 |
| TM-A10-L-2 | 6.12 | 17.66 | 0.545 | 0.679 | 0.464 | 0.065 | 1.096 | 0 | 1.245 | 3.284 | 1.572 | 15.83 |
| TM-A0-L-3 | 5.79 | 22.18 | 1.007 | 0.824 | 0.38 | 0.066 | 1.097 | 0 | 0.805 | 3.412 | 3.658 | 4.47 |
| TM-A2-L-3 | 5.4 | 21.84 | 0.755 | 0.766 | 0.206 | 0.037 | 0.561 | 0 | 0.63 | 3.276 | 3.658 | 0 |
| TM-A4-L-3 | 5.74 | 16.35 | 0.561 | 0.666 | 0.328 | 0.031 | 0.917 | 0 | 0.669 | 3.229 | 2.03 | 1.67 |
| TM-A6-L-3 | 5.64 | 14.2 | 0.313 | 0.591 | 0.251 | 0.035 | 0.679 | 0 | 0.638 | 2.621 | 1.269 | 0 |
| TM-A8-L-3 | 5.22 | 15.65 | 0.161 | 0.599 | 0.227 | 0.032 | 0.68 | 0 | 0.649 | 2.961 | 1.333 | 0 |
| TM-A10-L-3 | 5.08 | 16.76 | 0.133 | 0.63 | 0.159 | 0.015 | 0.546 | 0 | 0.599 | 3.192 | 1.499 | 0 |
| TM-A0-L-4 | 5.66 | 15.9 | 0.667 | 0.55 | 0.198 | 0.034 | 0.625 | 0 | 0.561 | 2.314 | 2.564 | 2.9 |
| TM-A2-L-4 | 5.47 | 21.39 | 0.87 | 0.852 | 0.188 | 0.052 | 0.708 | 0 | 0.671 | 3.163 | 3.521 | 0 |
| TM-A4-L-4 | 5.24 | 16.69 | 0.365 | 0.725 | 0.141 | 0.027 | 0.656 | 0 | 0.57 | 2.892 | 1.82 | 0 |
| TM-A6-L-4 | 5.44 | 15.14 | 0.275 | 0.599 | 0.185 | 0.029 | 0.61 | 0 | 0.733 | 3.021 | 1.47 | 0 |
| TM-A8-L-4 | 5.21 | 16.06 | 0.14 | 0.579 | 0.196 | 0.019 | 0.541 | 0 | 0.663 | 3.072 | 1.341 | 0 |
| TM-A10-L-4 | 5.34 | 15.56 | 0.239 | 0.626 | 0.173 | 0.023 | 0.733 | 0 | 0.608 | 3.052 | 1.434 | 0 |
| TM-A0-L-5 | 5.7 | 23.07 | 0.975 | 0.816 | 0.377 | 0.061 | 1.024 | 0 | 0.853 | 3.427 | 3.729 | 3.84 |
| TM-A2-L-5 | 5.3 | 21.5 | 0.776 | 0.833 | 0.159 | 0.038 | 0.737 | 0 | 0.616 | 3.224 | 3.517 | 0 |
| TM-A4-L-5 | 6.16 | 16.69 | 1.244 | 0.64 | 0.165 | 0.026 | 0.887 | 0 | 0.611 | 3.371 | 2.148 | 13.33 |
| TM-A6-L-5 | 6.26 | 17.77 | 0.669 | 0.815 | 0.516 | 0.062 | 0.759 | 0 | 1.303 | 3.047 | 1.516 | 17.96 |
| TM-A8-L-5 | 5.6 | 15.02 | 0.25 | 0.634 | 0.327 | 0.055 | 0.821 | 0 | 0.786 | 3.079 | 1.381 | 0 |
| TM-A10-L-5 | 5.29 | 15.72 | 0.185 | 0.62 | 0.205 | 0.024 | 0.676 | 0 | 0.643 | 3.187 | 1.463 | 0 |
| TM-A0-L-6 | 5.27 | 24.19 | 0.933 | 0.644 | 0.288 | 0.038 | 1.28 | 0 | 0.835 | 3.544 | 4.194 | 0 |
| TM-A2-L-6 | 5.13 | 21.95 | 0.831 | 0.895 | 0.164 | 0.035 | 0.716 | 0 | 0.647 | 3.282 | 3.556 | 0 |
| TM-A4-L-6 | 5.14 | 16.13 | 0.394 | 0.719 | 0.165 | 0.033 | 0.767 | 0 | 0.691 | 3.304 | 2.006 | 0 |
| TM-A6-L-6 | 6 | 15.6 | 0.381 | 0.573 | 0.352 | 0.08 | 0.994 | 0 | 1.081 | 3.122 | 1.511 | 7.6 |
| TM-A8-L-6 | 5.72 | 15.12 | 0.182 | 0.563 | 0.264 | 0.021 | 0.813 | 0 | 0.858 | 3.245 | 1.518 | 2.2 |
| TM-A10-L-6 | 5.05 | 16.69 | 0.124 | 0.564 | 0.114 | 0.01 | 0.535 | 0 | 0.622 | 3.17 | 1.453 | 0 |
| TM-A0-AA-B | 6.09 | 2.71 | 0.07 | 0.13 | 0.1 | 0 | 0 | 0 | 0.065 | 0.048 | 0.082 | 5.74 |
| TM-A10-AA-B | 5.99 | 1.77 | 0.034 | 0.045 | 0.01 | 0 | 0 | 0 | 0.045 | 0 | 0.059 | 5.24 |
| TM-A0-AA-1 | 7.13 | 61.49 | 4.21 | 0.44 | 0.63 | 0.17 | 4.23 | 0 | 4.804 | 0.939 | 3.036 | 202.33 |
| TM-A10-AA-1 | 6.37 | 23.52 | 1.269 | 0.495 | 1.039 | 0.231 | 1.536 | 0 | 1.308 | 1.236 | 1.189 | 158.06 |
| TM-A0-AA-2 | 7.21 | 19.94 | 0.818 | 0.323 | 0.823 | 0.204 | 1.647 | 0 | 1.56 | 1.868 | 1.151 | 83.66 |
| TM-A10-AA-2 | 6.67 | 19.94 | 0.818 | 0.323 | 0.823 | 0.204 | 1.647 | 0 | 0.745 | 1.022 | 0.595 | 155.73 |
| TM-A0-AA-3 | 6.58 | 30.46 | 1.193 | 0.406 | 1.156 | 0.418 | 2.695 | 0 | 1.427 | 1.567 | 1.113 | 123.95 |
| TM-A10-AA-3 | 6.67 | 14.31 | 0.668 | 0.228 | 0.634 | 0.133 | 1.106 | 0 | 0.749 | 1.009 | 0.542 | 93.11 |
| TM-A0-AA-4 | 6.74 | 37.52 | 1.445 | 0.399 | 0.06 | 0.19 | 3.76 | 0 | 2.651 | 1.549 | 1.333 | 168.36 |
| TM-A10-AA-4 | 6.85 | 20.05 | 1.021 | 0.288 | 0.968 | 0.221 | 1.641 | 0 | 1.155 | 0.948 | 0.566 | 141.41 |
| TM-A0-AA-5 | 7.36 | 38.37 | 1.406 | 0.436 | 1.112 | 0.23 | 4.59 | 0 | 3.168 | 2.19 | 1.5 | 231.5 |
| TM-A10-AA-5 | 6.69 | 20.53 | 0.732 | 0.318 | 0.726 | 0.195 | 1.926 | 0 | 1.121 | 0.955 | 0.413 | 133.25 |
| TM-A0-AA-6 | 6.88 | 71.9 | 1.54 | 0.68 | 0.31 | 0.64 | 7.946 | 0 | 7.232 | 6.563 | 3.323 | 172.05 |
| TM-A10-AA-6 | 6.67 | 22.62 | 0.763 | 0.243 | 0.823 | 0.224 | 2.027 | 0 | 1.652 | 1.714 | 0.682 | 143.04 |
Appendix C
| Global | |||||||||||
|---|---|---|---|---|---|---|---|---|---|---|---|
| Na+ | NH4+ | K+ | Mg2+ | Ca2+ | Cl− | NO3− | SO42− | HCO3− | H+ | ||
| Spearman Rho | Na+ | 1.00 | 0.38 | 0.928 ** | 0.50 | 0.49 | 0.03 | 0.14 | 0.41 | 0.70 | −0.55 |
| NH4⁺ | 1.00 | 0.43 | 0.12 | 0.37 | 0.49 | −0.14 | −0.20 | 0.03 | −0.09 | ||
| K+ | 1.00 | 0.75 | 0.77 | 0.37 | 0.43 | 0.64 | 0.829 * | −0.77 | |||
| Mg2+ | 1.00 | 0.899 * | 0.70 | 0.870 * | 0.882 * | 0.928 ** | −0.986 ** | ||||
| Ca2+ | 1.00 | 0.829 * | 0.66 | 0.72 | 0.77 | −0.829 * | |||||
| Cl− | 1.00 | 0.60 | 0.43 | 0.43 | −0.60 | ||||||
| NO3− | 1.00 | 0.899 * | 0.71 | −0.886 * | |||||||
| SO42− | 1.00 | 0.812* | −0.899 * | ||||||||
| HCO3− | 1.00 | −0.943 ** | |||||||||
| H+ | 1.00 | ||||||||||
| No Acid | |||||||||||
| Na+ | NH4+ | K+ | Mg2+ | Ca2+ | Cl− | NO3− | SO42− | HCO3− | H+ | ||
| Spearman Rho | Na+ | 1.00 | −0.962 ** | 0.12 | −0.23 | −0.22 | 0.07 | 0.42 | 0.51 | −0.30 | 0.63 |
| NH4+ | 1.00 | −0.25 | 0.16 | 0.25 | −0.01 | −0.48 | −0.50 | 0.49 | −0.782 * | ||
| K+ | 1.00 | 0.854 * | 0.63 | 0.34 | 0.774 * | 0.42 | −0.04 | 0.48 | |||
| Mg2+ | 1.00 | 0.842 * | 0.47 | 0.68 | 0.35 | 0.32 | 0.22 | ||||
| Ca2+ | 1.00 | 0.811 * | 0.65 | 0.56 | 0.46 | −0.07 | |||||
| Cl− | 1.00 | 0.72 | 0.807 * | 0.27 | 0.04 | ||||||
| NO3− | 1.00 | 0.843 * | −0.07 | 0.65 | |||||||
| SO42− | 1.00 | −0.16 | 0.51 | ||||||||
| HCO3− | 1.00 | −0.57 | |||||||||
| H+ | 1.00 | ||||||||||
| Acid | |||||||||||
| Na+ | NH4+ | K+ | Mg2+ | Ca2+ | Cl− | NO3− | SO42− | HCO3− | H+ | ||
| Spearman Rho | Na+ | 1.00 | 0.68 | 0.857 * | 0.857 * | 1.000 ** | 0.68 | 0.29 | 0.18 | 0.61 | −1.000 ** |
| NH4+ | 1.00 | 0.75 | 0.57 | 0.68 | 0.57 | 0.43 | 0.29 | 0.61 | −0.68 | ||
| K+ | 1.00 | 0.929 ** | 0.857 * | 0.75 | 0.43 | 0.34 | 0.61 | −0.857 * | |||
| Mg2+ | 1.00 | 0.857 * | 0.61 | 0.21 | 0.27 | 0.61 | −0.857 * | ||||
| Ca2+ | 1.00 | 0.68 | 0.29 | 0.18 | 0.61 | −1.000 ** | |||||
| Cl− | 1.00 | 0.46 | 0.13 | 0.61 | −0.68 | ||||||
| NO3− | 1.00 | 0.865 * | 0.61 | −0.29 | |||||||
| SO42− | 1.00 | 0.62 | −0.18 | ||||||||
| HCO3− | 1.00 | −0.61 | |||||||||
| H+ | 1.00 | ||||||||||
References
- Yocom, J. The deterioration of materials in polluted atmospheres. J. Air Pollut. Control Assoc. 1958, 8, 203–208. [Google Scholar] [CrossRef]
- Doehne, E.; Price, C. Stone Conservation. An Overview of Current Research; Getty Publications: Los Angeles, CA, USA, 2010. [Google Scholar]
- Moropoulou, A.; Labropoulos, K.; Konstanti, A.; Roumpopoulos, K.; Bakolas, A.; Michailidis, P. Weathering. In Fracture and Failure of Natural Building Stones; Springer: Dordrecht, The Netherlands, 2016; pp. 291–297. [Google Scholar] [CrossRef]
- Winkler, E. Weathering and weathering rates of natural stone. Environ. Geol. Water Sci. 1987, 9, 85–92. [Google Scholar] [CrossRef]
- Alonso, E.; Martínez, L. The role of environmental sulfur on degradation of ignimbrites of the Cathedral in Morelia, Mexico. Build. Environ. 2003, 38, 861–867. [Google Scholar] [CrossRef]
- Antonelli, F.; Gentili, G.; Renzulli, A.; Amadori, M. Provenance of the ornamental stones used in the baroque church of S. Pietro in Valle (Fano, Central Italy) and commentary on their state of conservation. J. Cult. Herit. 2003, 4, 299–312. [Google Scholar] [CrossRef]
- Belfiore, M.; Calabrò, C.; Ruffolo, S.A.; Ricca, M.; Török, Á.; Pezzino, A.; La Russa, M.F. The susceptibility to degradation of stone materials used in the built heritage of the Ortygia island (Syracuse, Italy): A laboratory study. Int. J. Rock Mech. Min. Sci. 2021, 146, 104877. [Google Scholar] [CrossRef]
- Bonazza, A.; Messina, P.; Sabbioni, C.; Grossi, C.; Brimblecombe, P. Mapping the impact of climate change on surface recession of carbonate buildings in Europe. Sci. Total Environ. 2009, 407, 2039–2050. [Google Scholar] [CrossRef]
- Bravo, H.; Sosa-Echeverría, R.; Sánchez, P.; Alarcón-Jiménez, A.; Kahl, J.; Ruíz, J. Effect of acid rain on building material of the El Tajín archaeological zone in Veracruz, Mexico. Environ. Pollut. 2006, 144, 655–660. [Google Scholar] [CrossRef]
- Pérez, N.; Lima, E. Chemical Evolution of the Volcanic Tuff from the Santa Mónica Church in Guadalajara, Mexico. MRS Online Proc. Libr. 2012, 1374, 195–203. [Google Scholar] [CrossRef]
- Delalieux, F.; Cardell-Fernandez, C.; Torfs, K.; Vleugels, G.; Van Grieken, R. Damage functions and mechanism equations derived from limestone weathering in field exposure. Water Air Soil Pollut. 2002, 139, 75–94. [Google Scholar] [CrossRef]
- Kucera, V.; Tidblad, J.; Kreislova, K.; Knotkova, D.; Faller, M.; Reiss, D.; Snethlage, R.; Yates, T.; Henriksen, J.; Schreiner, M.; et al. UN/ECEICP materials: Dose-response functions for the multi-pollutant situation. Water Air Soil Pollut. 2007, 7, 249–258. [Google Scholar] [CrossRef]
- Lipfert, F. Atmospheric damage to calcareous stones: Comparison and reconciliation of recent experimental findings. Atmos. Environ. 1989, 23, 415–429. [Google Scholar] [CrossRef]
- Tidblad, J.; Kucera, V.; Mikhailov, A.; Henriksen, J.; Kreislova, K.; Yates, T.; Stockle, B.; Schreiner, M. UN ECE ICP materials: Dose-response functions on dry and wet acid deposition effects after 8 years of exposure. Water Air Soil Pollut. 2001, 130, 1457–1462. [Google Scholar] [CrossRef]
- Balliana, E.; Ricci, G.; Pesce, C.; Zendri, E. Assessing the value of green conservation for cultural heritage: Positive and critical aspects of already available methodologies. Int. J. Conserv. Sci. 2016, 1, 185–202. [Google Scholar]
- Koob, S. Paraloid B-72®: 25 years of use as a consolidant and adhesive for ceramics and glass. In Holding it All Together; Archetype: London, UK, 2009; pp. 113–119. [Google Scholar]
- Pérez-Castellanos, N.; Lima-Muñoz, E. Diseño y evaluación de consolidantes para el patrimonio pétreo de origen volcánico. Intervención 2014, 8, 5–12. [Google Scholar] [CrossRef]
- Vidorni, G.; Sardella, A.; Nuntiis, P.D.; Volpi, F.; Dinoi, A.; Contini, D.; Comite, V.; Vaccaro, C.; Fermo, P.; Bonazza, A. Air pollution impact on carbonate building stones in Italian urban sites. Eur. Phys. J. Plus 2019, 134, 439. [Google Scholar] [CrossRef]
- Becherini, F.; Bernardi, A.; Frassoladi, E. Microclimate inside a semi-confined environment: Valuation of suitability for the conservation of heritage materials. J. Cult. Herit. 2010, 11, 471–476. [Google Scholar] [CrossRef]
- Camuffo, D.; Bernardi, A.; Sturaro, G.; Valentino, A. The microclimate inside the Pollaiolo and Botticelli rooms in the Uffizi Gallery, Florence. J. Cult. Herit. 2002, 3, 155–161. [Google Scholar] [CrossRef]
- Strada, M.; Carbonari, A.; Peron, F.; Porciani, L.; Romagnoni, P. The microclimate analysis of tezone ‘105’ of the Venetian Arsenale. J. Cult. Herit. 2002, 3, 89–92. [Google Scholar] [CrossRef]
- Langner, M.; Draheim, T.; Endlicher, W. Particulate Matter in the urban atmosphere: Concentration, distribution, reduction—Results of studies in the Berlin Metropolitan Area. In Perspectives in Urban Ecology; Springer: Berlin/Heidelberg, Germany, 2011; pp. 15–41. [Google Scholar] [CrossRef]
- Grossi; Brimblecombe, P.; Menéndez, B.; Benavente, D.; Harris, I.; Déqué, M. Climatology of salt transitions and implications for stone weathering. Sci. Total Environ. 2011, 409, 2577–2585. [Google Scholar] [CrossRef]
- Bonazza, A.; Sabbioni, C.; Messina, P.; Guaraldi, C.; Nuntiis, P.D. Climate change impact: Mapping thermal stress on Carrara marble in Europe. Sci. Total Environ. 2009, 407, 4506–4512. [Google Scholar] [CrossRef]
- Camuffo, D. Weathering of Building Materials in Air Pollution. In Air Pollution Reviews Urban Pollution; World Scientific: Singapore, 2016; pp. 19–64. [Google Scholar] [CrossRef]
- Siegesmund, S.; Török, A. Building stones. In Stone in Architecture: Properties, durability; Springer: Berlin/Heidelberg, Germany, 2011; pp. 11–95. [Google Scholar] [CrossRef]
- Ghedini, N.; Ozga, I.; Bonazza, A.; Dilillo, M.; Cachier, H.; Sabbioni, C. Atmospheric aerosol monitoring as a strategy for the preventive conservation of urban monumental heritage: The Florence Baptistery. Atmos. Environ. 2011, 45, 5979–5987. [Google Scholar] [CrossRef]
- Sabbioni, C.; Brimblecombe, P.; Cassar, M. The Atlas of Climate Change Impact on European Cultural Heritage: Scientific Analysis and Management Strategies; Anthem Press: London, UK, 2010. [Google Scholar] [CrossRef]
- La Russa, M.F.; Fermo, P.; Comite, V.; Belfiore, C.; Barca, D.; Cerioni, A.; Santis, M.D.; Barbagallo, L.; Ricca, M.; Ruffolo, S. The Oceanus statue of the Fontana di Trevi (Rome): The analysis of black crust as a tool to investigate the urban air pollution and its impact on the stone degradation. Sci. Total Environ. 2017, 593–594, 297–309. [Google Scholar] [CrossRef]
- Murru, A.; Freire-Lista, D.; Fort, R.; Varas-Muriel, M.; Meloni, P. Evaluation of post-thermal shock effects in Carrara marble and Santa Caterina di Pittinuri limestone. Constr. Build. Mater. 2018, 186, 1200–1211. [Google Scholar] [CrossRef]
- Freire-List, D.; Fort, R.; Varas-Muriel, M. Thermal stress-induced microcracking in building granite. Eng. Geol. 2016, 206, 83–93. [Google Scholar] [CrossRef]
- Freire-List, D.; Gonçalves, G.V.; Vazquez, P. Weathering detection of granite from three asynchronous historical quarries of Sabrosa municipally (North Portugal). J. Cult. Herit. 2022, 58, 199–208. [Google Scholar] [CrossRef]
- Tomás, R.; Cano, M.; Pulgarín, L.; Brotóns, V.; Benavente, D.; Miranda, T.; Vasconcelos, G. Thermal effect of high temperatures on the physical and mechanical properties of a granite used in UNESCO World Heritage sites in north Portugal. J. Build. Eng. 2021, 43, 102823. [Google Scholar] [CrossRef]
- Zappia, G.; Sabbioni, C.; Pauri, M.G.; Gobbi, G. Mortar damage due to airborne sulfur compounds in a simulation chamber. Mater. Struct. 1994, 27, 469–473. [Google Scholar] [CrossRef]
- Freire-List, D. The forerunners on heritage stones investigation: Historical synthesis and evolution. Heritage 2021, 4, 1228–1268. [Google Scholar] [CrossRef]
- Graue, B.; Siegesmund, S.; Middendorf, B. Quality assessment of replacement stones for the Cologne Cathedral: Mineralogical and petrophysical requirements. Environ. Earth Sci. 2011, 63, 1799–1822. [Google Scholar] [CrossRef]
- Graue, B.; Siegesmund, S.; Oyhantcabal, P.; Naumann, R.; Licha, T.; Simon, K. The effect of air pollution on stone decay: The decay of the Drachenfels trachyte in industrial, urban, and rural environments-a case study of the Cologne, Altenberg and Xanten cathedrals. Environ. Earth Sci. 2013, 69, 1095–1124. [Google Scholar] [CrossRef]
- Schiavon, N.; Caro, T.D.; Kiros, A.; Caldeira, A.; Parisi, I.; Riccucci, C.; Gigante, G. A multianalytical approach to investigate stone biodeterioration at a UNESCO world heritage site: The volcanic rock-hewn churches of Lalibela, Northern Ethiopia. Appl. Phys. A 2013, 113, 843–854. [Google Scholar] [CrossRef]
- López-Doncel, R.; Wedekind, W.; Leiser, T.; Molina-Maldonado, S.; Velasco-Sánchez, A.; Dohnrmann, R.; Kral, A.; Wittenborn, A.; Aguillón-Reyes, A.; Siegesmund, S. Salt bursting tests on volcanic tuff rocks from Mexico. Environ. Earth Sci. 2016, 75, 212. [Google Scholar] [CrossRef]
- Wedekind, W.; López-Doncel, R.; Dohrnmann, R.; Kocher, M.; Siegesmund, S. Weathering of volcanic tuff rocks caused by moisture expansion. Environ. Earth Sci. 2013, 69, 1203–1224. [Google Scholar] [CrossRef]
- Wedekind, W.; Ruedrich, J.; Siegesmund, S. Natural building stones of Mexico-Tenochtitlán: Their use, weathering and rock properties at the Templo Mayor, Palace Heras Soto and the Metropolitan Cathedral. Environ. Earth Sci. 2011, 63, 1787–1798. [Google Scholar] [CrossRef]
- Ruiz-Ruiz, R.; Alonso-Guzman, E.; Martinez-Molina, W.; Chavez-Garcia, H.; Arreola-Sanchez, M.; Borrego-Perez, J.; Navarrete-Seras, M.; Velazquez-Perez, J.; Morales-Rosales, L. Environmental Decay of Ignimbrite Patrimonial Monuments in the Dry, Urban, and Non-Industrial Atmosphere of Morelia (México). Heritage 2023, 6, 3137–3158. [Google Scholar] [CrossRef]
- Geological Survey of Japan (GSJ); National Institute of Advanced Industrial Science and Technology (AIST); Coordinating Committee for Geoscience Programmes in East and Southeast Asia (CCOP). Stone Heritage of East and Southeast Asia; Geological Survey of Japan—National Institute of Advanced Industrial Science and Technology, and Coordinating Committee for Geoscience Programmes: Bangkok, Thailand, 2016. [Google Scholar]
- McCoy, M.; Alderson, H.; Hemi, R.; Cheng, H.; Edwards, R. Earliest direct evidence of monument building at the archaeological site of Nan Madol (Pohnpei, Micronesia) identified using 230 Th/U coral dating and geochemical sourcing of megalithic architectural stone. Quat. Res. 2016, 86, 295–303. [Google Scholar] [CrossRef]
- Urbina-Leonor, L.; Sosa-Echeverría, R.; Pérez, N.; Vega, E.; Kahl, J.; Solano-Murllo, M.; Soto-Ayala, R. Importance of Atmospheric Sciences in Stone Heritage Conservation Study in Italy and Mexico. Sustainability 2023, 15, 5321. [Google Scholar] [CrossRef]
- Segerstrom, K. Quaternary system. In Geology of South-Central Hidalgo and Northeastern Mexico, Mexico; USGS: Washington, DC, USA, 1962; pp. 123–129. [Google Scholar]
- Ponce-Lira, B.; Ortíz-Polo, A.; Otazo-Sánchez, E.; Reguera-Ruíz, E.; Acevedo-Sandoval, O.; Prieto-García, F.; González-Ramírez, C. Physical Characterization of an Extensive Volcanic Rock in México: “Red Tezontle” from Cerro de la Cruz, in Tlahuelilpan, Hidalgo. Acta Univ. Univ. Guanaj. 2013, 1, 9–16. Available online: https://www.actauniversitaria.ugto.mx/index.php/acta/article/view/462/pdf (accessed on 12 June 2023).
- Duarte, R.; Flores-Colen, I.; de Brito, J.; Hawreen, A. Variability of in-situ testing in wall coating systems—Karsten tube and moisture meter techniques. J. Build. Eng. 2020, 27, 100998. [Google Scholar] [CrossRef]
- Borrelli, E. Porosity. In ARC Laboratory Handbook; ICCROM: Roma, Italy, 1999. [Google Scholar]
- Secretaría del Medio Ambiente de la Ciudad de México (SEDEMA). Calidad del Aire en la Ciudad de México, Informe 2019; SEDEMA CDMX: Mexico City, Mexico, 2022; pp. 123–134. [Google Scholar]
- Karadag, O.; Aktas, S. Optimal Sample Size Determination for the ANOVA Designs. Int. J. Appl. Math. Stat. 2012, 25, 127–134. [Google Scholar]
- Salvini, S.; Bertoncello, R.; Coletti, C.; Germinario, L.; Maritan, L.; Massironi, M.; Pozzobon, R.; Mazzoli, C. Recession rate of carbonate rocks used in cultural heritage: Textural control assessed by accelerated ageing tests. J. Cult. Herit. 2022, 1, 154–164. [Google Scholar] [CrossRef]
- Stumm, W.; Morgan, J. Aquatic chemistry: An Introduction Emphasizing Chemical Equilibria in Natural Waters; Wiley Interscienc: New York, NY, USA, 1970. [Google Scholar] [CrossRef]
- Government of Alberta. Precipitation Chemistry Data Handling and Preparation; Alberta Environment and Parks: Edmonton, AB, Canada, 2015. [Google Scholar]
- Ciantelli, C.; Palazzi, E.; Hardenberg, J.V.; Vaccaro, C.; Tittarelli, F.; Bonazza, A. How can climate change affect the UNESCO Cultural Heritage Sites in Panama? Geosciences 2018, 8, 296. [Google Scholar] [CrossRef]
- King, A.; Eckersley, R. Chapter 7—Inferential Statistics IV: Choosing a Hypothesis Test. In Statistics for Biomedical Engineers and Scientists; Academic Press: Cambridge, MA, USA, 2019; pp. 147–171. [Google Scholar] [CrossRef]
- Ross, A.; Willson, V. Paired Samples T-Test. In Basic and Advanced Statistical Tests; SensePublishers: Rotterdam, The Netherlands, 2017; pp. 17–19. [Google Scholar] [CrossRef]
- Yurtkoru, E. The Friedman two-way ANOVA by ranks application: Comparison of change forces. Öneri Derg. 2003, 5, 231–237. [Google Scholar] [CrossRef]
- Xia, Y. Chapter Eleven. Correlation and association analyses in microbiomes study integrating multiomics in health and disease. Prog. Mol. Biol. Transl. Sci. 2020, 171, 309–491. [Google Scholar] [CrossRef] [PubMed]
- Navarre-Sichler, A.; Brantley, S.; Rother, G. How Porosity Increases During Incipient Weathering of. Rev. Miner. Geochem. 2015, 80, 331–354. [Google Scholar] [CrossRef]
- Gudbransson, S.; Wolff-Boenisch, D.; Gislason, S.; Oelkers, E. An experimental study of crystalline basalt dissolution from 2 < pH < 11 and Temperatures from 5 to 75 °C. Geochim. Cosm. Acta 2011, 75, 5496–5509. [Google Scholar] [CrossRef]
- De la Torre, E.Y. Los volcanes del Sistema Volcánico Transversal. Investig. Geográficas 2022, 50, 221–234. Available online: http://www.scielo.org.mx/scielo.php?script=sci_arttext&pid=S0188-46112003000100018&l (accessed on 7 June 2023). [CrossRef]
- Levy, G.; Nachshon, U. Sodic soils. In Reference Modulein Earth Systems and Environmental Sciences; Elsevier: Amsterdam, The Netherlands, 2022. [Google Scholar] [CrossRef]
- Chapman, H. Cation-Exchange Capacity. In Methods for Soil Analysis, Part 2: Chemical and Microbiological Capacities; American Society of Agronomy, Inc.: Madison, WI, USA, 1965; pp. 891–901. [Google Scholar] [CrossRef]
- Anouar, F.; Elmchaouri, A.; Taoufik, N.; Rakhila, Y. Investigation of the Ion Exchange Effect on Surface Properties and Porous Structure of Clay: Application of Ascorbic Acid adsorption. J. Environ. Chem. Eng. 2019, 7, 103404. [Google Scholar] [CrossRef]
- Hayes, J.; Riebe, C.; Holbrook, W.; Flinchum, B.; Hartsough, P. Porosity production in weathered rock: Where volumetric strain dominates over chemical mass loss. Sci. Adv. 2019, 5, eaao0834. [Google Scholar] [CrossRef]


| Global | Acid | No Acid | ||||||
|---|---|---|---|---|---|---|---|---|
| Volume of sampled rain (mm) | 976.30 | Volume of sampled rain (mm) | 213.64 | Volume of sampled rain (mm) | 762.66 | |||
| Annual volume per specimen (L) | 2.44 | Annual volume per specimen (L) | 0.53 | Annual volume per specimen (L) | 1.91 | |||
| Total Volume (L) | 147.00 | Total Volume (L) | 33.00 | Total Volume (L) | 116.00 | |||
| pH | 5.5 | pH | 4.9 | pH | 6.3 | |||
| Compound | Mass (g) | Volume (mL) | Compound | Mass (g) | Volume (mL) | Compound | Mass (g) | Volume (mL) |
| NH4NO3 | 0.5217 | Ca(NO3)2 | 0.4583 | CaCO3 | 0.9205 | |||
| CaSO4 | 1.8231 | NaNO3 | 0.0177 | Ca(NO3)2 | 0.2657 | |||
| MgCl2 | 0.0963 | Mg(NO3)2 | 0.0442 | CaCl2 | 0.0772 | |||
| NaCl | 0.0433 | HCl | 0.0208 | MgCl2 | 0.0769 | |||
| K2CO3 | 0.1032 | KCl | 0.0040 | KCl | 0.0143 | |||
| H2SO4 (18.4 M) | 0.6879 | 0.378 | H2SO4 | 0.0087 | KNO3 | 0.0149 | ||
| NH4OH (14 M) | 0.2458 | 0.061 | NH4NO3 | 0.0002 | NaNO2 | 0.0098 | ||
| H2SO4 (18.4 M) | 0.7259 | 0.399 | H2SO4 (18.4 M) | 1.4365 | 0.789 | |||
| NH4OH (14 M) | 0.2593 | 0.065 | NH4OH (14 M) | 0.5132 | 0.128 | |||
| Year | T average (°C) | RH (%) | Wind Speed (m/s) | Wind Direction (°) |
|---|---|---|---|---|
| 2014 | 17.3 | 52.0 | 2.1 | 326.3 |
| 2015 | 17.2 | 58.5 | 2.1 | 326.3 |
| 2016 | 17.3 | 54.9 | 2.2 | 326.3 |
| 2017 | 17.6 | 52.3 | 2.1 | 326.3 |
| 2018 | 17.5 | 55.6 | 2.1 | 326.3 |
| 2019 | 18.5 | 51.1 | 2.1 | 326.3 |
| Mean | 17.6 | 54.1 | 2.1 | 326.3 (NW) |
| Group of Wet Atmospheric Deposition | Year | 2014 | 2015 | 2016 | 2017 | 2018 | 2019 | Total |
|---|---|---|---|---|---|---|---|---|
| Global | Samples | 37 | 22 | 24 | 20 | 24 | 25 | 152 |
| Volume (mm) | 1965 | 710 | 774 | 686 | 768 | 955 | 5858 | |
| No Acid | Samples | 10 | 6 | 3 | 0 | 3 | 2 | 24 |
| Volume (mm) | 809 | 203 | 103 | 0 | 68 | 99 | 1282 | |
| Acid | Samples | 27 | 16 | 21 | 20 | 21 | 23 | 128 |
| Volume (mm) | 1157 | 508 | 670 | 686 | 700 | 856 | 4576 |
| Group of Wet Atmospheric Deposition | Global | Acid | No Acid |
|---|---|---|---|
| Ion | xw(μEq/L) | xw (μEq/L) | xw (μEq/L) |
| [H+] | 4 | 0 | 4 |
| [Na+] | 5 | 3 | 3 |
| [NH4+] | 98 | 42 | 56 |
| [K+] | 3 | 1 | 1 |
| [Mg2+] | 3 | 2 | 1 |
| [Ca2+] | 45 | 25 | 19 |
| [F−] | 1 | 0 | 0 |
| [Cl−] | 10 | 3 | 7 |
| [NO3−] | 45 | 19 | 27 |
| [SO42−] | 69 | 26 | 43 |
| [HCO3−] | 29 | 22 | 6 |
| [NO2−] | 1 | 0 | 0 |
| Weighted pH | 5.5 | 4.9 | 6.6 |
| Uncertainty: ±0.56 μEq/L for Cl−; ±0.32 μEq/L for NO3−; ±0.42 μEq/L for SO42−; ±0.51 μEq/L for K+; ±0.87 μEq/L for Na⁺, ±1.11 μEq/L for NH4+; ±1.65 μEq/L for Mg2+; ±1.00 μEq/L for Ca2+. | |||
| Before Treatment | ||||||||||
|---|---|---|---|---|---|---|---|---|---|---|
| Deposition Group | Saturation Mass (g) | Dry Mass (g) | Vop (cm³) | %OP | %WAC | |||||
| Average | Std. Deviation | Average | Std. Deviation | Average | Std. Deviation | Average | Std. Deviation | Average | Std. Deviation | |
| Global | 79.4481 | 12.2473 | 76.4481 | 13.3462 | 3.0000 | 0.7538 | 6.63% | 1.61% | 4.01% | 1.04% |
| No Acid | 80.9924 | 19.4507 | 78.8626 | 21.1188 | 2.1298 | 0.7080 | 4.63% | 1.47% | 2.83% | 1.14% |
| Acid | 67.7868 | 10.3265 | 66.3994 | 11.5237 | 1.3874 | 0.2749 | 3.61% | 0.88% | 2.19% | 0.74% |
| After treatment | ||||||||||
| Deposition group | Saturation mass (g) | Dry mass (g) | Vop (cm³) | %OP | %WAC | |||||
| Average | Std. Deviation | Average | Std. Deviation | Average | Std. Deviation | Average | Std. Deviation | Average | Std. Deviation | |
| Global | 78.8962 | 13.5179 | 76.3889 | 13.3556 | 2.5073 | 0.6480 | 5.54% | 1.38% | 3.34% | 0.82% |
| No Acid | 81.0465 | 21.3526 | 78.8395 | 21.1252 | 2.2071 | 0.7062 | 4.80% | 1.47% | 2.92% | 1.08% |
| Acid | 67.8375 | 11.3111 | 66.3547 | 11.5215 | 1.4828 | 0.2568 | 3.86% | 0.85% | 2.34% | 0.74% |
| Mass | |||||
| Deposition group | W | p | Distribution | ||
| Shapiro–Wilk test | Global | 0.9199 | 0.5050 | Normal | |
| No Acid | 0.9074 | 0.4193 | Normal | ||
| Acid | 0.9562 | 0.7897 | Normal | ||
| Deposition group | t | p | Average | ¿Significant difference? | |
| t-Student’s test | Global | −6.9910 | 0.0009 | −0.0592 | Yes |
| No Acid | −4.0123 | 0.0102 | −0.0232 | Yes | |
| Acid | −9.6010 | 0.0002 | −0.0447 | Yes | |
| Water Absorption Capacity (WAC) | |||||
| W | p | Distribution | |||
| Shapiro–Wilk test | Global | 0.9331 | 0.6045 | Normal | |
| No Acid | 0.9652 | 0.8585 | Normal | ||
| Acid | 0.9322 | 0.5972 | Normal | ||
| t | p | Average | ¿Significant difference? | ||
| t-Student’s test | Global | −4.3033 | 0.0077 | −0.007 | Yes |
| No Acid | 1.7229 | 0.1455 | 0.0009 | No | |
| Acid | 3.5813 | 0.0159 | 0.0015 | Yes | |
| Open Porosity (OP) | |||||
| Deposition group | W | p | Distribution | ||
| Shapiro–Wilk test | Global | 0.9218 | 0.5181 | Normal | |
| No Acid | 0.9586 | 0.8090 | Normal | ||
| Acid | 0.9516 | 0.7532 | Normal | ||
| Deposition group | t | p | Average | ¿Significant difference? | |
| t-Student’s test | Global | −4.7085 | 0.0053 | −0.0110 | Yes |
| No Acid | 1.9707 | 0.1058 | 0.0017 | No | |
| Acid | 3.2627 | 0.0224 | 0.0025 | Yes | |
| Group of Wet Atmospheric Deposition | Dry Mass Difference | Wet Mass Difference |
|---|---|---|
| Global | ||
| No Acid | ||
| Acid |
| Years of Precipitation Simulated | Blank | G1 | G2 | G3 | G4 | G5 | G6 |
|---|---|---|---|---|---|---|---|
| 0 | N | A | N | A | A | N | N |
| 2 | N | N | A | A | N | N | N |
| 4 | N | A | N | A | A | A | A |
| 6 | N | N | N | N | N | N | N |
| 8 | N | A | A | A | A | N | A |
| 10 | N | A | A | A | N | N | A |
| Years of precipitation simulated | Blanks | N1 | N2 | N3 | N4 | N5 | N6 |
| 0 | N | N | A | A | A | N | N |
| 2 | N | A | N | N | N | N | N |
| 4 | N | A | N | N | N | N | N |
| 6 | A | A | A | A | A | A | A |
| 8 | N | N | N | N | N | N | N |
| 10 | N | A | A | N | N | N | N |
| Years of precipitation simulated | Blanks | A1 | A2 | A3 | A4 | A5 | A6 |
| 0 | N | A | A | N | N | N | A |
| 2 | A | N | N | N | N | N | N |
| 4 | N | N | N | N | N | N | N |
| 6 | A | N | N | N | N | A | A |
| 8 | N | N | N | N | N | N | N |
| 10 | N | N | A | N | N | N | N |
| Deposition Group | Years of Accelerated Weathering | ¿Significant Difference? | Samples | Ion Concentration Change |
|---|---|---|---|---|
| Global | 0 | Alternative hypothesis | G1, G3, G4 | Increased all ions, except NH4+, which diminishes. Na+ doubled |
| Null hypothesis | G2, G5, G6 | |||
| 2 | Alternative hypothesis | G2, G3 | Increased all ions, especially Ca2+ and HCO₃− | |
| Null hypothesis | G1, G4, G5, G6 | Slight increase in Ca2+, Cl− | ||
| 4 | Alternative hypothesis | G1, G3, G4, G5, G6 | Increase Ca2+, NH4+, SO42−, HCO₃− | |
| Null hypothesis | G2 | Slight increase in concentration overall | ||
| 6 | Alternative hypothesis | 0 | - | |
| Null hypothesis | G1, G2, G3, G4, G5, G6 | Slight increase in NH4+, Ca2+, NO3−, SO42− reduced K+, Cl−, HCO3− | ||
| 8 | Alternative hypothesis | G1, G2, G3, G4, G6 | Slight increase NH4+, Mg2+, Cl−. Large increase NO3−, SO42−, Ca²⁺ | |
| Null hypothesis | G5 | Slight increase NH4+, Ca2+, HCO3− large increase NO3−, SO42−, decrease Cl− | ||
| 10 | Alternative hypothesis | G1, G2, G3, G6 | Slight increase in all ions | |
| Null hypothesis | G4, G5 | A slight decrease in SO42−, increase in the rest of the ions | ||
| No Acid | 0 | Alternative hypothesis | N1 | Slight decrease in K+, NH4+, Mg2+. Increase Ca²⁺, HCO3− |
| Null hypothesis | N2, N3, N4, N5, N6 | Increase K+, Ca2+, Cl−, NO3−, SO42−, HCO3−. Decrease NH4+ | ||
| 2 | Alternative hypothesis | N1 | Increase overall, especially in K+, HCO₃− | |
| Null hypothesis | N2, N3, N4, N5, N6 | General increase, especially higher in Ca2+, K+, HCO3− | ||
| 4 | Alternative hypothesis | N1 | Slight increase overall, especially higher in HCO3− | |
| Null hypothesis | N2, N3, N4, N5, N6 | Slight decrease NO3−, SO42−. Mild increase in the rest. | ||
| 6 | Alternative hypothesis | N6 | Slight increase overall, especially higher in Ca2+, HCO3− | |
| Null hypothesis | 0 | - | ||
| 8 | Alternative hypothesis | 0 | - | |
| Null hypothesis | N6 | Slight decrease in Cl−, amild increase in Ca2+ | ||
| 10 | Alternative hypothesis | N1, N2 | Slight increase Ca2+ | |
| Null hypothesis | N3, N4, N5, N6 | Slight increase Ca2+ | ||
| Acid | 0 | Alternative hypothesis | A1, A2, A6 | Increase Na+, K+, Cl−, SO42−. Ca2+ concentration duplicated. Slight decrease NH4+ |
| Null hypothesis | A3, A4, A5 | Slight increase in K+, Ca2+, Cl− | ||
| 2 | Alternative hypothesis | 0 | - | |
| Null hypothesis | A1, A2, A3, A4, A5, A6 | Slight increase in K+, Ca2+, Cl− | ||
| 4 | Alternative hypothesis | 0 | - | |
| Null hypothesis | A1, A2, A3, A4, A5, A6 | Not a clear trend | ||
| 6 | Alternative hypothesis | A5, A6 | Slight increase in NO3−, HCO3−. Na+, K+, Ca2+, Cl− more than doubled | |
| Null hypothesis | A1, A2, A3, A4 | Mild increase Na+, K+, Ca²+, Cl−, NO3−. Slight decrease overall. | ||
| 8 | Alternative hypothesis | - | ||
| Null hypothesis | A1, A2, A3, A4, A5, A6 | Mild decrease Na⁺, NH4+. Slight increase Ca2+, Cl− | ||
| 10 | Alternative hypothesis | A2 | Increase Na+, K+. Concentrations of Ca2+, Cl− more than doubled | |
| Null hypothesis | A1, A3, A4, A5, A6 | Not a clear trend |
Disclaimer/Publisher’s Note: The statements, opinions and data contained in all publications are solely those of the individual author(s) and contributor(s) and not of MDPI and/or the editor(s). MDPI and/or the editor(s) disclaim responsibility for any injury to people or property resulting from any ideas, methods, instructions or products referred to in the content. |
© 2023 by the authors. Licensee MDPI, Basel, Switzerland. This article is an open access article distributed under the terms and conditions of the Creative Commons Attribution (CC BY) license (https://creativecommons.org/licenses/by/4.0/).
Share and Cite
Urbina Leonor, L.M.; Sosa Echeverría, R.; Alarcón Jiménez, A.L.; Solano Murillo, M.; Velasco Herrera, G.; Perez, N.A. Quantifying Decay Due to Wet Atmospheric Deposition on Basalt. Materials 2023, 16, 5644. https://doi.org/10.3390/ma16165644
Urbina Leonor LM, Sosa Echeverría R, Alarcón Jiménez AL, Solano Murillo M, Velasco Herrera G, Perez NA. Quantifying Decay Due to Wet Atmospheric Deposition on Basalt. Materials. 2023; 16(16):5644. https://doi.org/10.3390/ma16165644
Chicago/Turabian StyleUrbina Leonor, Luis Miguel, Rodolfo Sosa Echeverría, Ana Luisa Alarcón Jiménez, Mónica Solano Murillo, Graciela Velasco Herrera, and Nora A. Perez. 2023. "Quantifying Decay Due to Wet Atmospheric Deposition on Basalt" Materials 16, no. 16: 5644. https://doi.org/10.3390/ma16165644
APA StyleUrbina Leonor, L. M., Sosa Echeverría, R., Alarcón Jiménez, A. L., Solano Murillo, M., Velasco Herrera, G., & Perez, N. A. (2023). Quantifying Decay Due to Wet Atmospheric Deposition on Basalt. Materials, 16(16), 5644. https://doi.org/10.3390/ma16165644