
Optimal Design of the Austenitic Stainless-Steel Composition Based on Machine Learning and Genetic Algorithm

Abstract
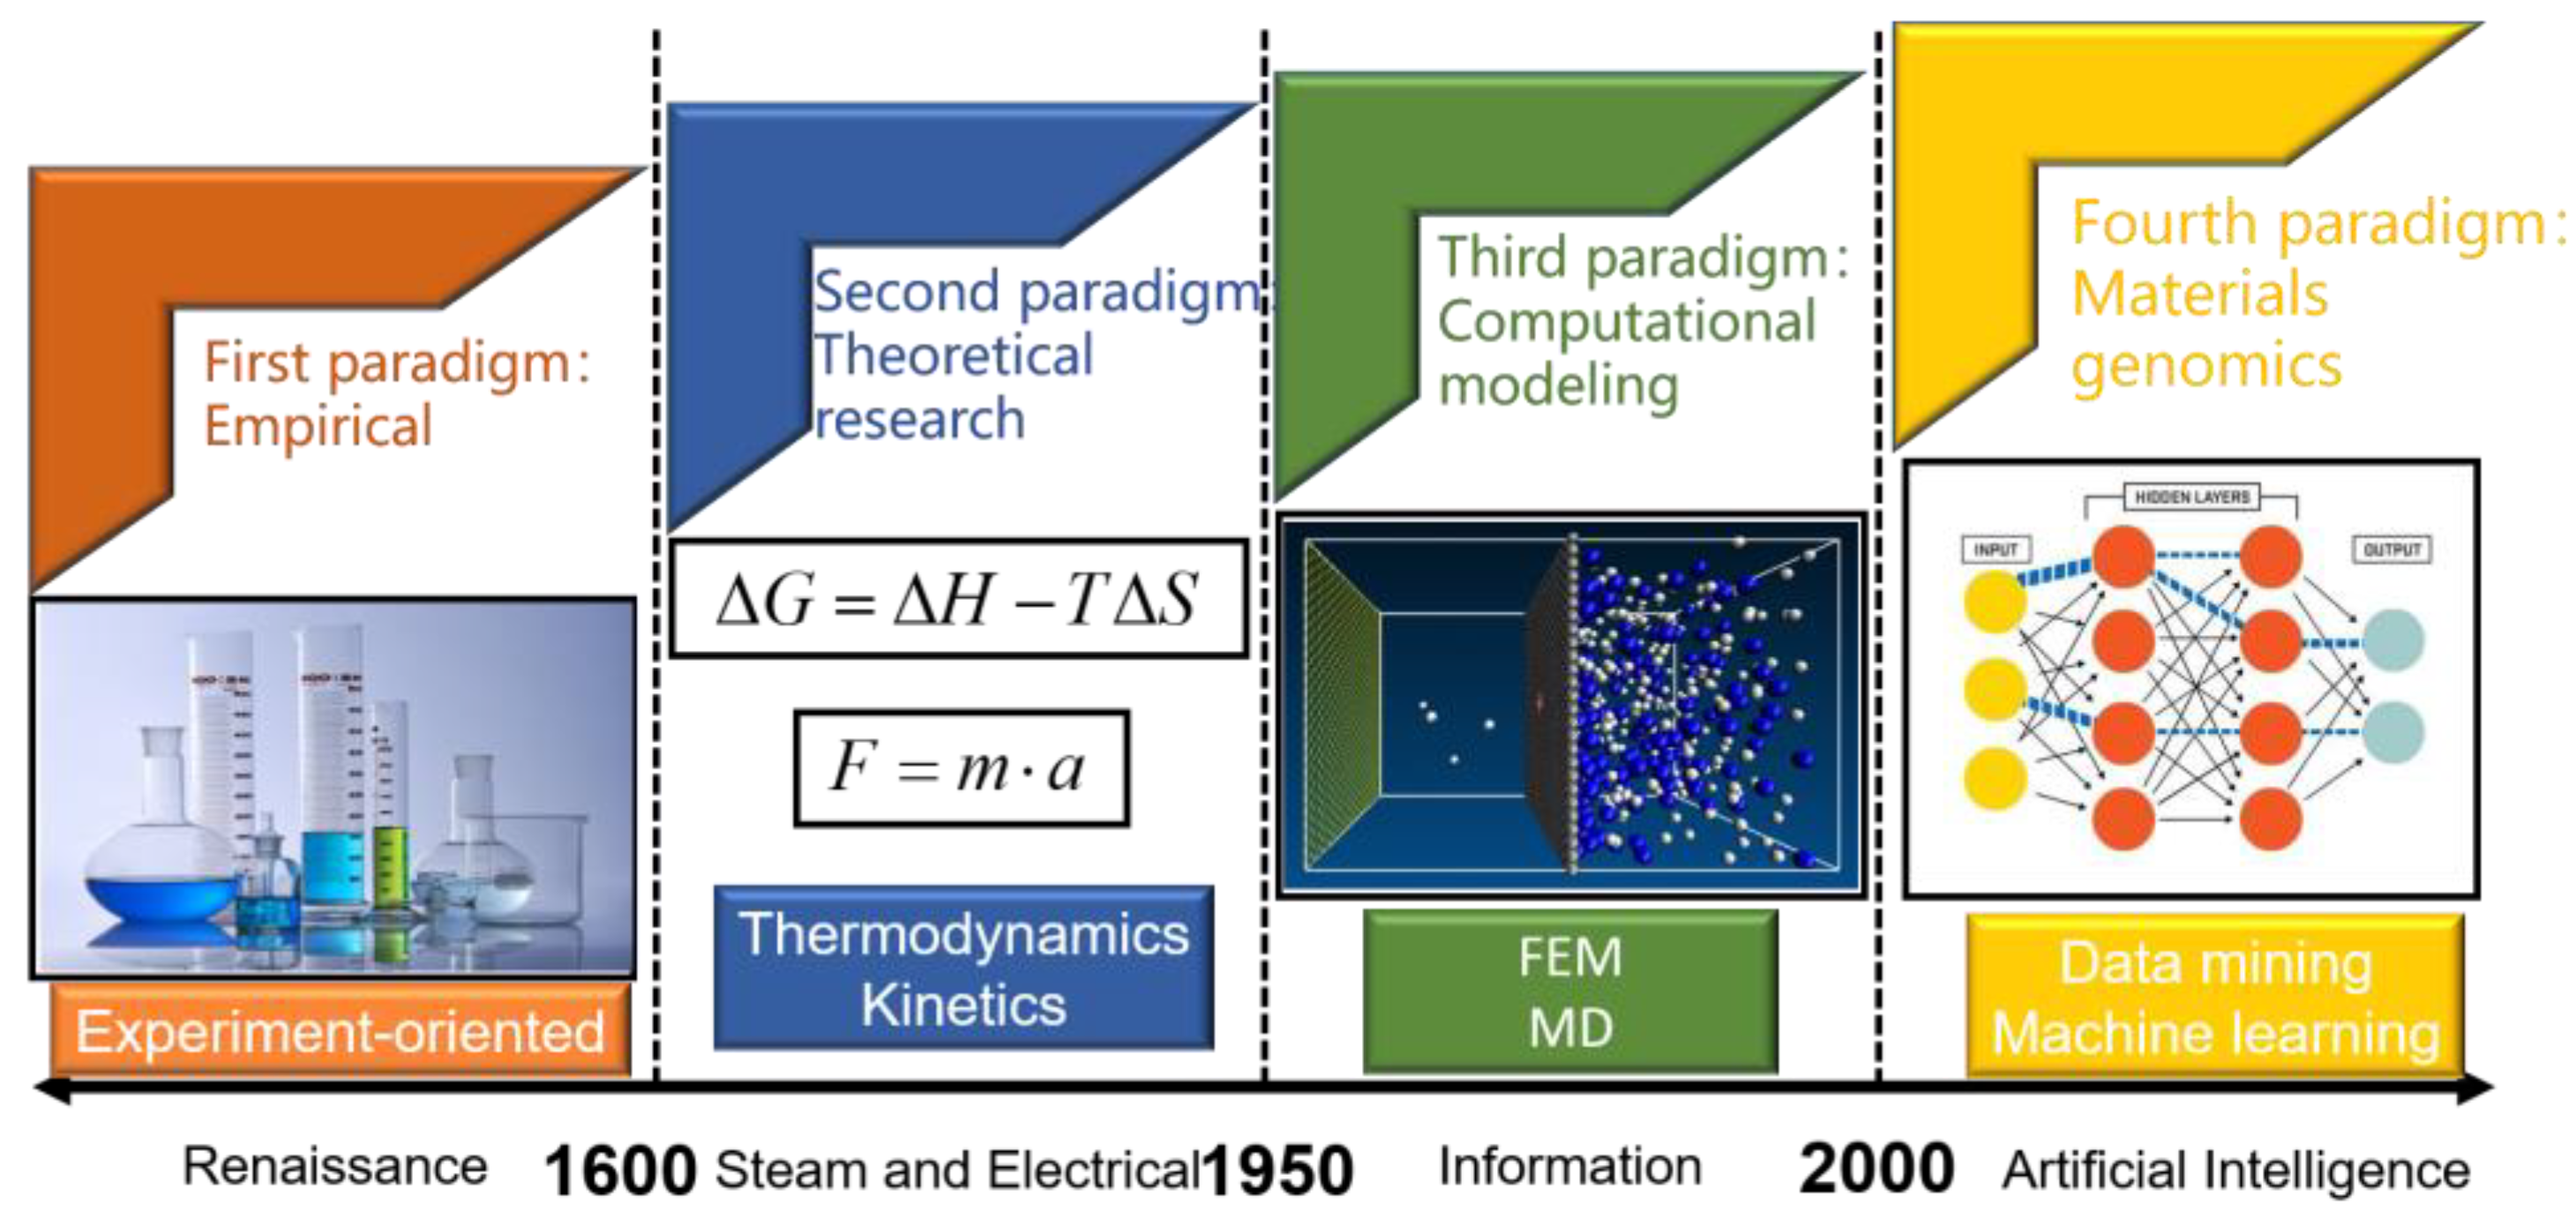
1. Introduction
2. Materials and Methods
2.1. Optimal Design Strategy
2.2. Dataset
2.3. Model Evaluation and Hyperparametric Optimization
3. Results and Discussion
3.1. Model Establishment
3.2. Hyperparametric Optimization
3.3. Interpretable Analysis
3.4. Genetic Algorithm Optimization
4. Conclusions
- (1)
- Nine machine learning algorithms were used to establish prediction models for mechanical properties of austenitic stainless steel. The results show that the gradient boosting regression (gbr) algorithm has the highest prediction accuracy and the best fitting degree.
- (2)
- Bayesian optimization was used to optimize the hyperparameters of the gbr algorithm, and the best parameter combination corresponding to four mechanical properties was obtained. The mechanical properties prediction model established had good prediction accuracy on the test set (YS: R2 = 0.88, MAE = 4.89 MPa; UTS: R2 = 0.99, MAE = 2.65 MPa; EL: R2 = 0.84, MAE = 1.42%; AR: R2 = 0.88, MAE = 1.39%).
- (3)
- The feature importance and SHAP value were used to perform interpretable analysis on the performance prediction model. The results indicate that the test temperature is the most important feature affecting the performance, and the high- and low-test temperatures have different positive and negative effects on the performance.
- (4)
- The NSGA-III algorithm was used to optimize the four mechanical properties of austenitic stainless steel, and the constraints and search space were established based on expert knowledge. A new type of austenitic stainless steel with excellent performance was successfully obtained.
- (5)
- The combination of machine learning and genetic algorithm to find the optimal value of performance in the search space can accelerate the research and development efficiency of materials and provide some guidance for the design of new materials.
Author Contributions
Funding
Institutional Review Board Statement
Informed Consent Statement
Data Availability Statement
Acknowledgments
Conflicts of Interest
References
- Agrawal, A.; Choudhary, A. Perspective: Materials informatics and big data: Realization of the “fourth paradigm” of science in materials science. APL Mater. 2016, 4, 053208. [Google Scholar] [CrossRef]
- Zhang, H.; Fu, H.; He, X.; Wang, C.; Jiang, L.; Chen, L.; Xie, J. Dramatically enhanced combination of ultimate tensile strength and electric conductivity of alloys via machine learning screening. Acta Mater. 2020, 200, 803–810. [Google Scholar] [CrossRef]
- Pattanayak, S.; Dey, S.; Chatterjee, S.; Chowdhury, S.G.; Datta, S. Computational intelligence based designing of microalloyed pipeline steel. Comput. Mater. Sci. 2015, 104, 60–68. [Google Scholar] [CrossRef]
- Weng, B.; Song, Z.; Zhu, R.; Yan, Q.; Sun, Q.; Grice, C.G.; Yan, Y.; Yin, W.-J. Simple descriptor derived from symbolic regression accelerating the discovery of new perovskite catalysts. Nat. Commun. 2020, 11, 3513. [Google Scholar] [CrossRef]
- Xu, G.; Zhang, X.; Xu, J. Data Augmentation of Micrographs and Prediction of Impact Toughness for Cast Austenitic Steel by Machine Learning. Metals 2023, 13, 107. [Google Scholar] [CrossRef]
- Qin, Z.; Wang, Z.; Wang, Y.; Zhang, L.; Li, W.; Liu, J.; Wang, Z.; Li, Z.; Pan, J.; Zhao, L. Phase prediction of Ni-base superalloys via high-throughput experiments and machine learning. Mater. Res. Lett. 2021, 9, 32–40. [Google Scholar] [CrossRef]
- Yu, J.; Guo, S.; Chen, Y.; Han, J.; Lu, Y.; Jiang, Q.; Wang, C.; Liu, X. A two-stage predicting model for γ′ solvus temperature of L12-strengthened Co-base superalloys based on machine learning. Intermetallics 2019, 110, 106466. [Google Scholar] [CrossRef]
- Li, Y.; Guo, W. Machine-learning model for predicting phase formations of high-entropy alloys. Phys. Rev. Mater. 2019, 3, 095005. [Google Scholar] [CrossRef]
- Zhou, Z.; Zhou, Y.; He, Q.; Ding, Z.; Li, F.; Yang, Y. Machine learning guided appraisal and exploration of phase design for high entropy alloys. NPJ Comput. Mater. 2019, 5, 128. [Google Scholar] [CrossRef]
- Kong, C.S.; Luo, W.; Arapan, S.; Villars, P.; Iwata, S.; Ahuja, R.; Rajan, K. Information-theoretic approach for the discovery of design rules for crystal chemistry. J. Chem. Inf. Model. 2012, 52, 1812–1820. [Google Scholar] [CrossRef]
- Xue, D.; Xue, D.; Yuan, R.; Zhou, Y.; Balachandran, P.V.; Ding, X.; Sun, J.; Lookman, T. An informatics approach to transformation temperatures of NiTi-based shape memory alloys. Acta Mater. 2017, 125, 532–541. [Google Scholar] [CrossRef]
- Wen, C.; Wang, C.; Zhang, Y.; Antonov, S.; Xue, D.; Lookman, T.; Su, Y. Modeling solid solution strengthening in high entropy alloys using machine learning. Acta Mater. 2021, 212, 116917. [Google Scholar] [CrossRef]
- Zhu, Q.; Liu, Z.; Yan, J. Machine learning for metal additive manufacturing: Predicting temperature and melt pool fluid dynamics using physics-informed neural networks. Comput. Mech. 2021, 67, 619–635. [Google Scholar] [CrossRef]
- Zhu, C.; Li, C.; Wu, D.; Ye, W.; Shi, S.; Ming, H.; Zhang, X.; Zhou, K. A titanium alloys design method based on high-throughput experiments and machine learning. J. Mater. Res. Technol. 2021, 11, 2336–2353. [Google Scholar] [CrossRef]
- Jiang, L.; Wang, C.; Fu, H.; Shen, J.; Zhang, Z.; Xie, J. Discovery of aluminum alloys with ultra-strength and high-toughness via a property-oriented design strategy. J. Mater. Sci. Technol. 2022, 98, 33–43. [Google Scholar] [CrossRef]
- Konno, T.; Kurokawa, H.; Nabeshima, F.; Sakishita, Y.; Ogawa, R.; Hosako, I.; Maeda, A. Deep learning model for finding new superconductors. Phys. Rev. B 2021, 103, 014509. [Google Scholar] [CrossRef]
- Diao, Y.; Yan, L.; Gao, K. A strategy assisted machine learning to process multi-objective optimization for improving mechanical properties of carbon steels. J. Mater. Sci. Technol. 2022, 109, 86–93. [Google Scholar] [CrossRef]
- Reddy, N.; Krishnaiah, J.; Young, H.B.; Lee, J.S. Design of medium carbon steels by computational intelligence techniques. Comput. Mater. Sci. 2015, 101, 120–126. [Google Scholar] [CrossRef]
- Shen, C.; Wang, C.; Wei, X.; Li, Y.; van der Zwaag, S.; Xu, W. Physical metallurgy-guided machine learning and artificial intelligent design of ultrahigh-strength stainless steel. Acta Mater. 2019, 179, 201–214. [Google Scholar] [CrossRef]
- Available online: https://citrination.com/datasets/114165/show_files/ (accessed on 12 July 2023).
- Cavanaugh, M.; Buchheit, R.; Birbilis, N. Modeling the environmental dependence of pit growth using neural network approaches. Corros. Sci. 2010, 52, 3070–3077. [Google Scholar] [CrossRef]
- Yan, L.; Diao, Y.; Gao, K. Analysis of environmental factors affecting the atmospheric corrosion rate of low-alloy steel using random forest-based models. Materials 2020, 13, 3266. [Google Scholar] [CrossRef]
- Wen, Y.; Cai, C.; Liu, X.; Pei, J.; Zhu, X.; Xiao, T. Corrosion rate prediction of 3C steel under different seawater environment by using support vector regression. Corros. Sci. 2009, 51, 349–355. [Google Scholar] [CrossRef]
- Jiang, X.; Yin, H.-Q.; Zhang, C.; Zhang, R.-J.; Zhang, K.-Q.; Deng, Z.-H.; Liu, G.-Q.; Qu, X.-H. An materials informatics approach to Ni-based single crystal superalloys lattice misfit prediction. Comput. Mater. Sci. 2018, 143, 295–300. [Google Scholar] [CrossRef]
- Bergstra, J.; Bengio, Y. Random Search for Hyper-Parameter Optimization. J. Mach. Learn. Res. 2012, 13, 281–305. [Google Scholar]
- Zhang, W.; Wu, C.; Zhong, H.; Li, Y.; Wang, L. Prediction of undrained shear strength using extreme gradient boosting and random forest based on Bayesian optimization. Geosci. Front. 2021, 12, 469–477. [Google Scholar] [CrossRef]
- Snoek, J.; Larochelle, H.; Adams, R.P. Practical bayesian optimization of machine learning algorithms. Adv. Neural Inf. Process. Syst. 2012, 25, 1–9. [Google Scholar]
- Greenhill, S.; Rana, S.; Gupta, S. Bayesian optimization for adaptive experimental design: A review. IEEE Access 2020, 8, 13937–13948. [Google Scholar] [CrossRef]
- Hernández-Lobato, J.M.; Gelbart, M.A.; Adams, R.P.; Hoffman, M.W.; Ghahramani, Z. A general framework for constrained Bayesian optimization using information-based search. J. Mach. Learn. Res. 2016, 17, 1–53. [Google Scholar]
- Roy, A.; Babuska, T.; Krick, B.; Balasubramanian, G. Machine learned feature identification for predicting phase and Young’s modulus of low-, medium-and high-entropy alloys. Scr. Mater. 2020, 185, 152–158. [Google Scholar] [CrossRef]
- Yan, L.; Diao, Y.; Lang, Z.; Gao, K. Corrosion rate prediction and influencing factors evaluation of low-alloy steels in marine atmosphere using machine learning approach. Sci. Technol. Adv. Mater. 2020, 21, 359–370. [Google Scholar] [CrossRef]
- Choudhary, B.; Samuel, E.I.; Bhanu Sankara Rao, K.; Mannan, S. Tensile stress–strain and work hardening behaviour of 316LN austenitic stainless steel. Mater. Sci. Eng. A 2001, 17, 223–231. [Google Scholar] [CrossRef]
- Aghaie-Khafri, M.; Zargaran, A. High temperature tensile behavior of a PH stainless steel. Mater. Sci. Eng. A 2010, 527, 4727–4732. [Google Scholar] [CrossRef]
- Kim, J.W.; Byun, T.S. Analysis of tensile deformation and failure in austenitic stainless steels: Part I—Temperature dependence. J. Nucl. Mater. 2010, 396, 1–9. [Google Scholar] [CrossRef]
- Yanushkevich, Z.; Lugovskaya, A.; Belyakov, A.; Kaibyshev, R. Deformation microstructures and tensile properties of an austenitic stainless steel subjected to multiple warm rolling. Mater. Sci. Eng. A 2016, 667, 279–285. [Google Scholar] [CrossRef]
- Lipovetsky, S.; Conklin, M. Analysis of regression in game theory approach. Appl. Stoch. Models Bus. Ind. 2001, 17, 319–330. [Google Scholar] [CrossRef]
- Štrumbelj, E.; Kononenko, I. Explaining prediction models and individual predictions with feature contributions. Knowl. Inf. Syst. 2014, 41, 647–665. [Google Scholar] [CrossRef]
- Lundberg, S.M.; Lee, S.-I. A unified approach to interpreting model predictions. Adv. Neural Inf. Process. Syst. 2017, 30, 4768–4777. [Google Scholar]
- Lundberg, S.M.; Erion, G.; Chen, H.; DeGrave, A.; Prutkin, J.M.; Nair, B.; Katz, R.; Himmelfarb, J.; Bansal, N.; Lee, S.-I. From local explanations to global understanding with explainable AI for trees. Nat. Mach. Intell. 2020, 2, 56–67. [Google Scholar] [CrossRef]
- Pardo, A.; Merino, M.C.; Coy, A.E.; Viejo, F.; Arrabal, R.; Matykina, E. Pitting corrosion behaviour of austenitic stainless steels—Combining effects of Mn and Mo additions. Corros. Sci. 2008, 50, 1796–1806. [Google Scholar] [CrossRef]
- Deb, K.; Jain, H. An evolutionary many-objective optimization algorithm using reference-point-based nondominated sorting approach, part I: Solving problems with box constraints. IEEE Trans. Evol. Comput. 2013, 18, 577–601. [Google Scholar] [CrossRef]
- Jain, H.; Deb, K. An evolutionary many-objective optimization algorithm using reference-point based nondominated sorting approach, part II: Handling constraints and extending to an adaptive approach. IEEE Trans. Evol. Comput. 2013, 18, 602–622. [Google Scholar] [CrossRef]
- Yuan, Y.; Xu, H.; Wang, B. An improved NSGA-III procedure for evolutionary many-objective optimization. In Proceedings of the 2014 Annual Conference on Genetic and Evolutionary Computation, New York, NY, USA, 12–16 July 2014; pp. 661–668. [Google Scholar]
- Chand, S.; Wagner, M. Evolutionary many-objective optimization: A quick-start guide. Surv. Oper. Res. Manag. Sci. 2015, 20, 35–42. [Google Scholar] [CrossRef]
- Vesikar, Y.; Deb, K.; Blank, J. Reference point based NSGA-III for preferred solutions. In Proceedings of the 2018 IEEE Symposium Series on Computational Intelligence (SSCI), Bengaluru, India, 18–21 November 2018; IEEE: Piscataway, NJ, USA; pp. 1587–1594. [Google Scholar]
- Lu, S. Introduction to Stainless Steel; Chemical Industry Press: Beijing, China, 2013. [Google Scholar]
- Hong, I.T.; Koo, C.H. Antibacterial properties, corrosion resistance and mechanical properties of Cu-modified SUS 304 stainless steel. Mater. Sci. Eng. A 2005, 393, 213–222. [Google Scholar] [CrossRef]
- Veiga, F.; Bhujangrao, T.; Suárez, A.; Aldalur, E.; Goenaga, I.; Gil-Hernandez, D. Validation of the Mechanical Behavior of an Aeronautical Fixing Turret Produced by a Design for Additive Manufacturing (DfAM). Polymers 2022, 14, 2177. [Google Scholar] [CrossRef]
- Veiga, F.; Suárez, A.; Aldalur, E.; Goenaga, I.; Amondarain, J. Wire Arc Additive Manufacturing Process for Topologically Optimized Aeronautical Fixtures. 3d Print. Addit. Manuf. 2021, 10, 23–33. [Google Scholar] [CrossRef] [PubMed]


| Features | Variable |
|---|---|
| Heat treatment | Water cooling after solid solution treatment |
| Composition | Mass fraction of each element |
| Steel type | Steel tube |
| Mechanical properties | Yield strength (YS), ultimate tensile strength (UTS), elongation (EL), and reduction of area (RA) |
| Test condition | Test temperature |
| Grain | Grain size |
| Melting mode | Arc furnace |
| Feature Name | Minimum | Maximum | Mean | |
|---|---|---|---|---|
| Composition | Cr content (wt%) | 16.42 | 18.24 | 17.6113 |
| Ni content (wt%) | 9.8 | 13.5 | 12.08947 | |
| Mo content (wt%) | 0.02 | 2.38 | 0.688626 | |
| Mn content (wt%) | 1.47 | 1.74 | 1.621221 | |
| Si content (wt%) | 0.52 | 0.82 | 0.638168 | |
| Nb content (wt%) | 0.005 | 0.79 | 0.198321 | |
| Ti content (wt%) | 0.011 | 0.53 | 0.142389 | |
| Cu content (wt%) | 0.05 | 0.17 | 0.103817 | |
| N content (wt%) | 0.013 | 0.038 | 0.024901 | |
| C content (wt%) | 0.04 | 0.09 | 0.059466 | |
| B content (wt%) | 0.0001 | 0.0013 | 0.059466 | |
| P content (wt%) | 0.019 | 0.028 | 0.022802 | |
| S content (wt%) | 0.006 | 0.017 | 0.011573 | |
| Al content (wt%) | 0.004 | 0.161 | 0.039153 | |
| Co content (wt%) | 0 | 0.37 | 0.08145 | |
| V content (wt%) | 0 | 0.33 | 0.007656 | |
| Process | Solution treatment temperature/STT (K) | 1343 | 1473 | 1394 |
| Solution treatment time/STt (s) | 600 | 1200 | 742 | |
| Test | Test temperature/TT (K) | 298 | 1073 | 714 |
| Property | YS (MPa) | 108 | 239 | 153 |
| UTS (MPa) | 203 | 620 | 416 | |
| EL (%) | 11 | 75 | 46 | |
| RA (%) | 14 | 82 | 66 |
| Hyperparameter | Significance |
|---|---|
| n_estimators | The number of weak learners, that is, the number of subtrees. More trees can improve the model accuracy, but at the same time, it will reduce the running speed of the model, and too many trees may lead to overfitting. |
| learning_rate | The step size used in each iteration. If the step size is set too large, it may cause the gradient to descend too quickly and fail to converge; conversely, if the step size is set too small, it may take a very long time to reach the optimal result. |
| max_depth | This parameter limits the depth of the decision tree, controlling the complexity and prediction accuracy of the model. Increasing max_depth will make the model more complex and more prone to overfitting, while smaller values may lead to underfitting. |
| subsample | The proportion of randomly sampled data for each tree. It is used to control the number of samples in each tree of the training dataset and can be used to solve overfitting problems. |
| min_samples_split | The minimum number of observations required for a split at an internal node. This parameter can limit the depth of subtree split and prevent overfitting. |
| min_samples_leaf | The minimum number of samples required to be in a leaf node. Smaller leaf sizes correspond to higher variance and may lead to overfitting problems. |
| n_Estimators | Learning_Rate | Max_Depth | Subsample | Min_Samples_Split | Min_Samples_Leaf | |
|---|---|---|---|---|---|---|
| YS | 223 | 0.03773 | 2 | 0.5 | 24 | 1 |
| UTS | 347 | 0.08097 | 20 | 1.0 | 27 | 5 |
| EL | 500 | 0.03750 | 8 | 0.7287 | 20 | 4 |
| RA | 383 | 0.09559 | 2 | 1.0 | 20 | 1 |
| No | Cr | Ni | Mo | Mn | Si | Nb | Ti | Cu | N | C | B | P | S | Al | UTS | EL | YS | AR |
|---|---|---|---|---|---|---|---|---|---|---|---|---|---|---|---|---|---|---|
| 1 | 16.98 | 9.80 | 0.121 | 1.481 | 0.597 | 0.375 | 0.021 | 0.051 | 0.026 | 0.090 | 0.00039 | 0.023 | 0.00604 | 0.0138 | 611 | 72.5 | 221 | 81.5 |
| 2 | 16.99 | 9.98 | 0.0395 | 1.568 | 0.598 | 0.276 | 0.521 | 0.052 | 0.025 | 0.043 | 0.00113 | 0.022 | 0.01700 | 0.1438 | 614 | 68.7 | 223 | 81.9 |
| 3 | 16.99 | 9.96 | 1.020 | 1.471 | 0.597 | 0.116 | 0.103 | 0.050 | 0.013 | 0.041 | 0.00092 | 0.022 | 0.01263 | 0.0141 | 601 | 70.5 | 224 | 84.6 |
| 4 | 16.84 | 9.92 | 0.181 | 1.671 | 0.597 | 0.295 | 0.529 | 0.050 | 0.026 | 0.042 | 0.00017 | 0.023 | 0.00625 | 0.0142 | 603 | 68.2 | 229 | 79.8 |
Disclaimer/Publisher’s Note: The statements, opinions and data contained in all publications are solely those of the individual author(s) and contributor(s) and not of MDPI and/or the editor(s). MDPI and/or the editor(s) disclaim responsibility for any injury to people or property resulting from any ideas, methods, instructions or products referred to in the content. |
© 2023 by the authors. Licensee MDPI, Basel, Switzerland. This article is an open access article distributed under the terms and conditions of the Creative Commons Attribution (CC BY) license (https://creativecommons.org/licenses/by/4.0/).
Share and Cite
Liu, C.; Wang, X.; Cai, W.; Yang, J.; Su, H. Optimal Design of the Austenitic Stainless-Steel Composition Based on Machine Learning and Genetic Algorithm. Materials 2023, 16, 5633. https://doi.org/10.3390/ma16165633
Liu C, Wang X, Cai W, Yang J, Su H. Optimal Design of the Austenitic Stainless-Steel Composition Based on Machine Learning and Genetic Algorithm. Materials. 2023; 16(16):5633. https://doi.org/10.3390/ma16165633
Chicago/Turabian StyleLiu, Chengcheng, Xuandong Wang, Weidong Cai, Jiahui Yang, and Hang Su. 2023. "Optimal Design of the Austenitic Stainless-Steel Composition Based on Machine Learning and Genetic Algorithm" Materials 16, no. 16: 5633. https://doi.org/10.3390/ma16165633
APA StyleLiu, C., Wang, X., Cai, W., Yang, J., & Su, H. (2023). Optimal Design of the Austenitic Stainless-Steel Composition Based on Machine Learning and Genetic Algorithm. Materials, 16(16), 5633. https://doi.org/10.3390/ma16165633