Article

The Effect of Annealing on the Soft Magnetic Properties and Microstructure of Fe82Si2B13P1C3 Amorphous Iron Cores

1
Institute for Advanced Materials and Technology, University of Science and Technology Beijing, Beijing 100083, China
2
Central Iron and Steel Research Institute, Beijing 100081, China
3
Jiangsu JITRI Advanced Energy Materials Research Institute Co., Ltd., Changzhou 213001, China
4
Institute of Advanced Materials, North China Electric Power University, Beijing 102206, China
5
Electrical & Information Engineering, Shandong University, Weihai 264209, China
*
Authors to whom correspondence should be addressed.
Materials 2023, 16(16), 5527; https://doi.org/10.3390/ma16165527
Submission received: 26 June 2023 / Revised: 1 August 2023 / Accepted: 7 August 2023 / Published: 9 August 2023
(This article belongs to the Special Issue Structure and Properties of Crystalline and Amorphous Alloys-Part II)

Abstract

:
This research paper investigated the impact of normal annealing (NA) and magnetic field annealing (FA) on the soft magnetic properties and microstructure of Fe82Si2B13P1C3 amorphous alloy iron cores. The annealing process involved various methods of magnetic field application: transverse magnetic field annealing (TFA), longitudinal magnetic field annealing (LFA), transverse magnetic field annealing followed by longitudinal magnetic field annealing (TLFA) and longitudinal magnetic field annealing followed by transverse magnetic field annealing (LTFA). The annealed samples were subjected to testing and analysis using techniques such as differential scanning calorimetry (DSC), transmission electron microscopy (TEM), X-ray diffraction (XRD), magnetic performance testing equipment and magneto-optical Kerr microscopy. The obtained results were then compared with those of commercially produced Fe80Si9B11. Fe82Si2B13P1C3 demonstrated the lowest loss of P1.4T,2kHz = 8.1 W/kg when annealed in a transverse magnetic field at 370 °C, which was 17% lower than that of Fe80Si9B11. When influenced by the longitudinal magnetic field, the magnetization curve tended to become more rectangular, and the coercivity (B3500A/m) of Fe82Si2B13P1C3 reached 1.6 T, which was 0.05 T higher than that of Fe80Si9B11. During the 370 °C annealing process of the Fe82Si2B13P1C3 amorphous iron core, the internal stress in the strip gradually dissipated, and impurity domains such as fingerprint domains disappeared and aligned with the length direction of the strip. Consequently, wide strip domains with low resistance and easy magnetization were formed, thereby reducing the overall loss of the amorphous iron core.

1. Introduction

Soft magnetic materials and their related devices (inductors, transformers and electrical machines) play a key role in the conversion of energy throughout our world. The conversion of electrical power includes the bidirectional flow of energy between sources, storage and the electrical grid and is accomplished via the use of power electronics. Electrical machines (motors and generators) transform mechanical energy into electrical energy and vice versa. The introduction of wide bandgap (WBG) semiconductors is allowing power conversion electronics and motor controllers to operate at much higher frequencies. This reduces the size requirements for passive components (inductors and capacitors) in power electronics and enables more efficient, high-rotational-speed electrical machines [1]. Fe-based amorphous alloys exhibit superior soft magnetic properties, including relatively high saturated magnetization, high effective permeability, low coercivity and low core loss, especially at middle and high frequencies, compared to other traditional soft magnetic materials, such as ferrite, silicon steel and permalloy. These kinds of alloys with unique structures, excellent magnetic properties and good mechanical properties have attracted much attention in a variety of emerging science and engineering fields [2].
Amorphous alloy ribbons possess desirable properties, such as low losses and high magnetic permeability, making them potential replacements for non-oriented silicon steel in high-frequency motors. This substitution can reduce iron core losses by more than 80% and significantly enhance overall efficiency [3,4,5,6]. However, the saturation magnetic induction strength (Bs) of commercially available amorphous ribbons is only 1.56 T, which is considerably lower than that of non-oriented silicon steel (1.8–2.0 T). This limitation hampers the application of amorphous ribbons in motors. Consequently, there is a pressing need to explore the composition design and applications of high-Bs amorphous alloys, which has become a prominent research and development focus in this field. Although there have been several relevant reports [7,8,9], most of them have been conducted in laboratory settings with a limited number of high-quality samples, which are often narrow in width. These samples are suitable for studying strip characteristics such as saturation magnetic induction and coercivity. However, they are inadequate for producing iron core samples required for the comprehensive testing and analysis of losses and magnetization curves.
Relaxation upon isothermal annealing below the crystallization transition temperature is applied to release the residual stress in metallic amorphous alloys [10] to enhance their soft magnetic performance [8]. Ordinarily, the soft magnetic properties of amorphous alloys can be further optimized through appropriate annealing characteristics, such as the annealing temperature, heating rate and holding time [11]. As-spun amorphous ribbons are usually subjected to magnetic field annealing to improve their soft magnetic properties (SMPs) [12]. Magnetic field annealing treatment can bring about a process of atomic pair ordering and the decline of the coercive field [13]. Magnetic field annealing has a positive effect on changing the domain-sensitive direction and unifying the easy magnetization direction [14]. Magnetic field annealing causes the formation of strip domains in the sample for optimal SMPs [15]. Magnetic field annealing can promote inner stress release and modulate the domain structure, which directly affects soft magnetic alloys [16]. However, the mechanism of the effect of magnetic field annealing on SMPs is not yet clear.
This paper focuses on the utilization of planar flow continuous casting technology to produce wide amorphous alloy ribbons and high-quality annular amorphous iron core samples based on the previously developed Fe82Si2B13P1C3 alloy, which possesses a high saturation magnetic induction strength. This study systematically investigates the impact of heat treatment processes on the soft magnetic properties of these amorphous iron cores, aiming to uncover the underlying mechanisms of magnetic domain morphology on the magnetic properties. By employing this approach, a heat treatment technique is developed for amorphous iron cores with a high saturation magnetic induction strength and low loss. Furthermore, systematic magnetization curves and loss data are obtained, which are expected to offer valuable insight for the application of Fe82Si2B13P1C3 amorphous ribbons in motors.

2. Methods

Sample source: The GFA and soft magnetic properties of as-spun Fe80Si9B(11−x)Px amorphous alloys were improved due to the incorporation of a minor amount of P element. However, excess P led to a reduction in iron content and the deterioration of saturation magnetization [17]. Wide amorphous alloy ribbons with compositions of Fe80Si9B11 (1K101) and Fe82Si2B13P1C3 were produced using planar flow continuous casting. The ribbons had a width of 150 ± 0.5 mm and a thickness of 25 ± 1 µm. These wide ribbons were subsequently cut into 10 mm narrow ribbons and wound into circular amorphous samples. The resulting samples had an outer diameter of φouter = 35 mm, an inner diameter of φinner = 25 mm and a height of h = 10 mm.
  • Annealing experiments:
Normal annealing (NA): The amorphous iron core was positioned within the annealing area of the furnace. The furnace door was closed, and the interior was evacuated before being filled with nitrogen gas. The temperature of the furnace was then raised from room temperature to the designated holding temperature (Fe80Si9B11:370–420 °C and Fe82Si2B13P1C3:340–390 °C) at a heating rate of 6 °C/min. The temperature was maintained at the holding temperature for a duration of 40 min, followed by furnace cooling until reaching room temperature to allow for sample removal.
  • Magnetic field annealing (FA):
In the case of transverse magnetic field annealing (TFA), as depicted in Figure 1a, pure iron magnetic poles of equal inner and outer diameters and a length of 150 mm were affixed on both sides of the sample. Subsequently, the furnace door was closed, and the furnace was evacuated and filled with nitrogen. The heating rate was set at 6 °C/min. Upon reaching the desired temperature, a transverse magnetic field was applied with the specified current. After a holding period of 40 min, the sample was cooled to room temperature and removed from the furnace.
During longitudinal magnetic field annealing (LFA), as illustrated in Figure 1b, the sample was threaded to the center of the copper rod. The remaining procedures were identical to those of TFA, with the exception that a longitudinal magnetic field was applied.
Test method: The amorphous nature of the alloy strip was assessed using X-ray diffraction (XRD) with Cu Kα (λ = 0.15406 nm) radiation in the range of 30–90° taking 0.2 s for one step of 0.02°. FEI Strata 400S focused ion beam scanning electron microscopy (FIB-SEM) was used to cut the ribbon, and FEI Talos F200s transmission electron microscopy (TEM) was used to observe the cross-section of the ribbon (FEI, Los Angeles, CA, USA). Thermal parameters, including the crystallization temperature (Tx) and crystallization peak (Tp), were analyzed via differential thermal analysis (DSC) at a heating rate of 10 °C/min under the protection of argon gas to establish an appropriate range of annealing temperatures. The loss and hysteresis loop of the amorphous iron core were measured using both direct current (model TD8150) and alternating current (model TK7500) magnetic performance testing instruments. Additionally, a magneto-optical Kerr effect (MOKE, Evico 4-873K/950 MT) microscope was employed to examine the magnetic domain structures (evico magnetics GmbH, Dresden, Germany).

3. Results and Discussion

In this study, the magnetic properties of the novel amorphous strip (Fe82Si2B13P1C3) were systematically investigated under various heat treatment processes. The research aimed to understand the influence of magnetic fields on the morphology and orientation of magnetic domains and elucidate the underlying mechanisms.

3.1. Structure and Performance Analysis of Fe82Si2B13P1C3 Ribbons

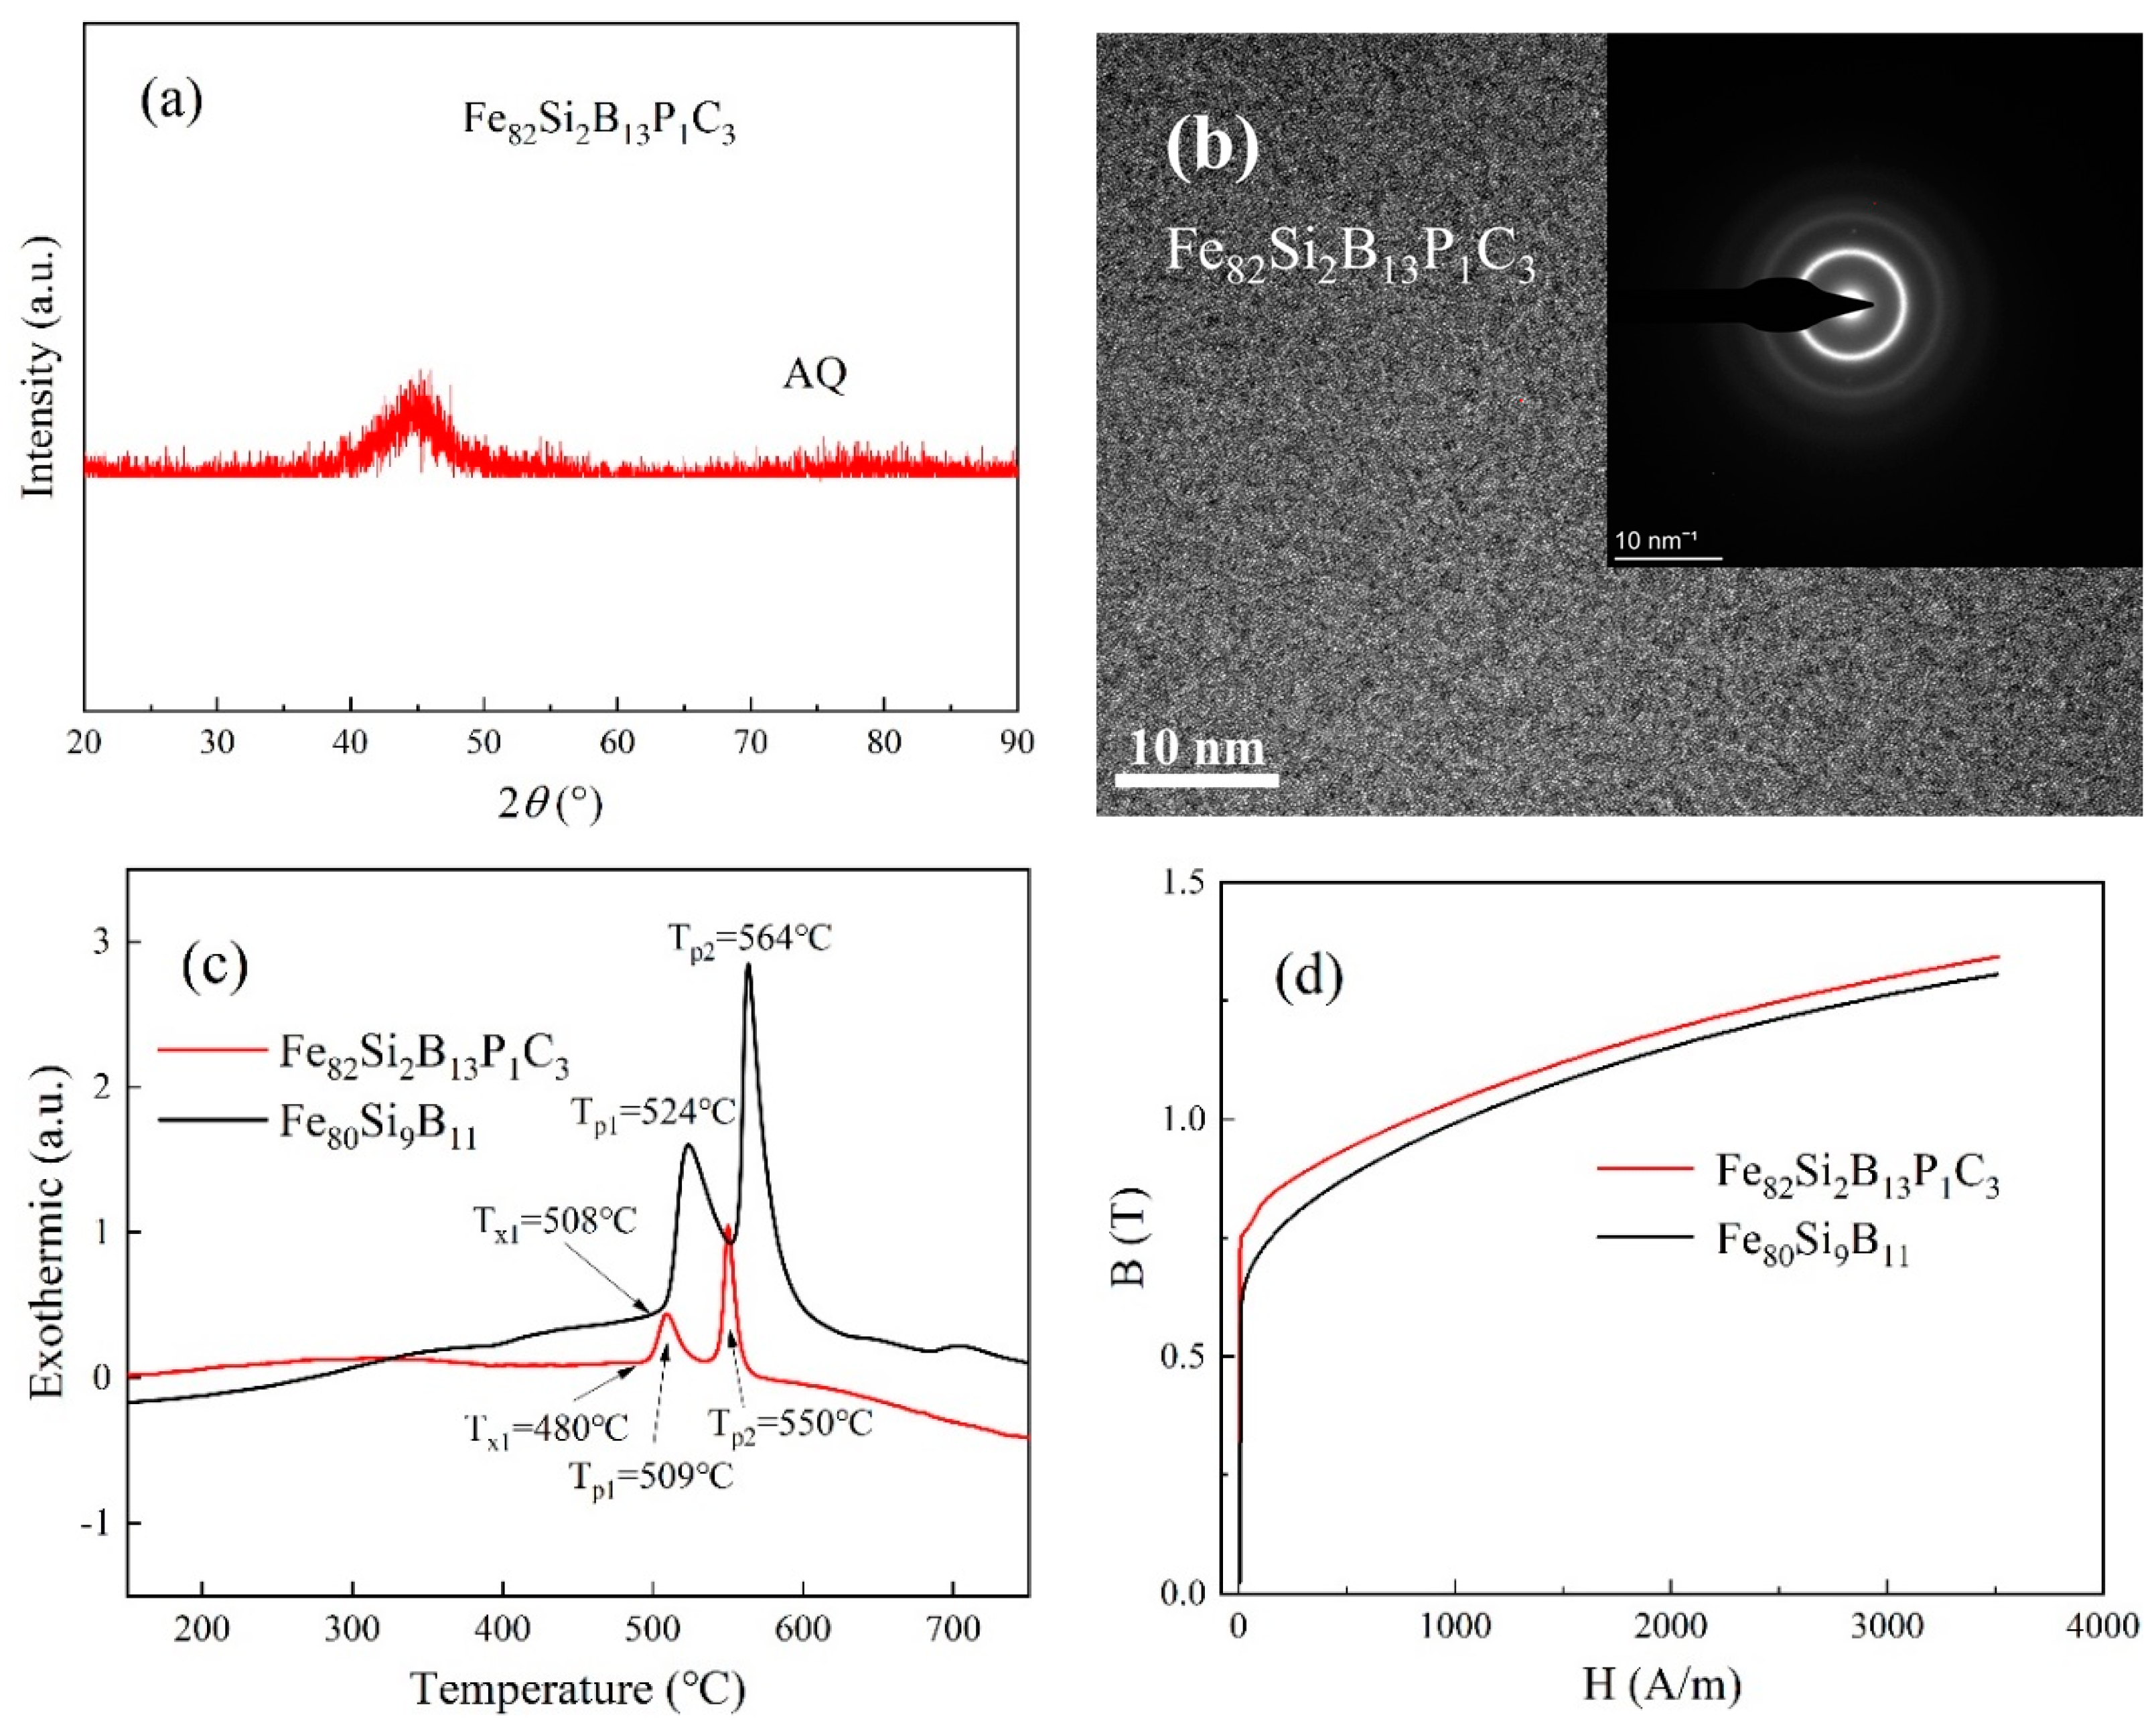
The XRD pattern of the as-spun Fe82Si2B13P1C3 strip is presented in Figure 2a. The diffraction curve reveals a distinct diffuse peak near the diffraction angle of 2θ = 45°, and no sharp crystallization peaks are observed. This pattern confirms that the strip possesses an amorphous structure. Figure 2b displays the high-resolution TEM (HRTEM) image and the selected area electron diffraction (SAED) pattern of the as-spun Fe82Si2B13P1C3 strip. The atomic arrangement within the structure exhibits disorder, which is indicative of an amorphous structure. The presence of diffraction halos in the pattern further supports the amorphous nature of the strip.
Figure 2c presents the results of the DSC tests conducted on the Fe82Si2B13P1C3 and Fe80Si9B11 strip samples. Both samples exhibit two distinct exothermic peaks. The crystallization onset temperature (Tx1) was determined by analyzing the tangent to the initial arc of the first exothermic peak. As indicated in Table 1, the Tx1 of the Fe82Si2B13P1C3 strip was 28 °C lower than that of Fe80Si9B11. This observation suggests that the addition of P and C elements promotes the early precipitation of the α-Fe phase. The temperature range from the Curie temperature (Tc) to Tx1 is commonly considered an optimal heat treatment interval for amorphous ribbons. Furthermore, the ideal annealing temperature is typically achieved by reducing the temperature by 80–120 °C from Tx1. These criteria serve as essential guidelines for determining the appropriate annealing temperature [18]. Figure 2c shows two crystallization peaks, with the first corresponding to the precipitation of the α-Fe phase and the second corresponding to the formation of the Fe–B phase [19,20]. Table 1 reveals that the crystallization peak temperatures of the Fe82Si2B13P1C3 strip are lower than those of Fe80Si9B11, and the gaps ΔTp between the crystallization peaks remain relatively consistent for both ribbons.
The magnetization curve of the as-spun Fe82Si2B13P1C3 strip is depicted in Figure 2d. Under an excitation of 3500 A/m, the values of magnetic induction (Bm) for Fe82Si2B13P1C3 and Fe80Si9B11 were measured to be 1.34 T and 1.31 T, respectively. The higher Fe content in Fe82Si2B13P1C3 accounts for its elevated Bm value.

3.2. Effects of NA Processes on Magnetic Properties of Amorphous Iron Cores

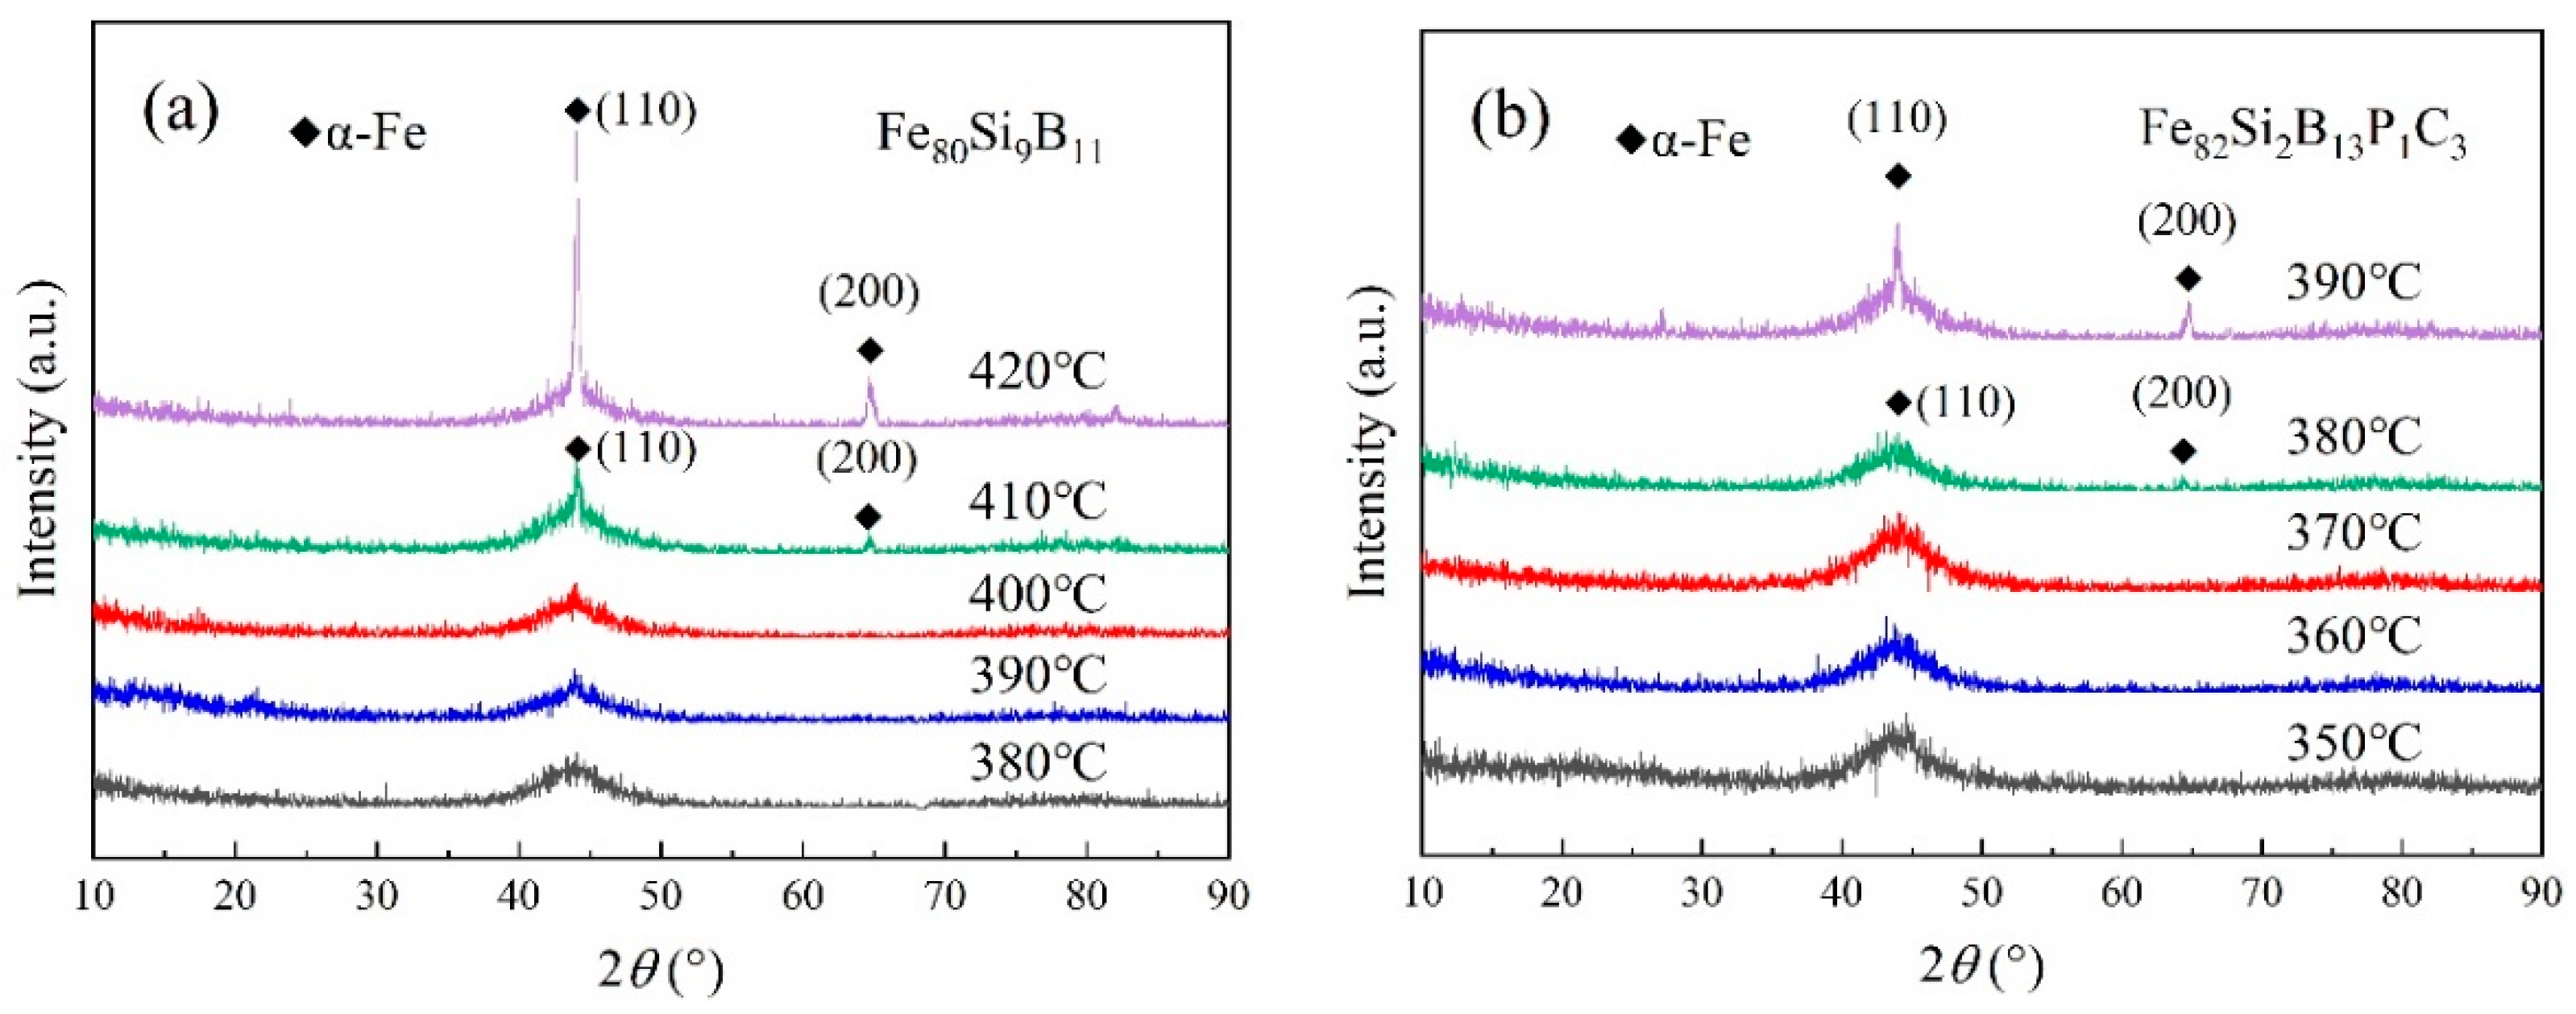
Based on the DSC test results, Fe80Si9B11 underwent annealing within the temperature range of 380–420 °C, and Fe82Si2B13P1C3 was annealed at temperatures between 350 and 390 °C. The XRD spectra of the amorphous iron cores are displayed in Figure 3a,b. From the figures, it can be observed that, when Fe80Si9B11 was annealed at ≤400 °C and Fe82Si2B13P1C3 was annealed at ≤370 °C, a diffuse diffraction peak appeared near 2θ = 45° for both alloys, indicating the retention of their amorphous state. However, when Fe80Si9B11 was annealed at ≥410 °C and Fe82Si2B13P1C3 was annealed at ≥380 °C, the diffuse peak became sharper, suggesting the precipitation of trace crystalline phases. These crystalline phases can be identified as α-Fe(Si) with a body-centered cubic (bcc) structure. Furthermore, the XRD spectra revealed that, with the increasing annealing temperature, the intensity of the diffraction peak corresponding to the α-Fe(Si) phase gradually strengthened, indicating an augmentation in the crystallization fraction of the α-Fe(Si) phase as the annealing temperature rose.
Figure 4a,b illustrate the loss curves of Fe80Si9B11 annealed at 370–410 °C and Fe82Si2B13P1C3 annealed at 340–380 °C at different frequencies. The curves display an initial decrease followed by an increase as the heat treatment temperature rises. According to Table 2, the minimum loss for Fe80Si9B11 was achieved at 400 °C, with a value of P1.4T,2kHz = 36 W/kg. Similarly, Fe82Si2B13P1C3 reached its minimum loss at 370 °C, with a value of P1.4T,2kHz = 29 W/kg. Additionally, as the excitation frequency increased, the losses also increased, with the loss at 2 kHz being nearly 100 times higher compared to that at 50 Hz. The losses for Fe80Si9B11 annealed at 410 °C and Fe82Si2B13P1C3 annealed at 380 °C were P1.4T,2kHz = 58 W/kg and P1.4T,2kHz = 47 W/kg, respectively. The XRD curves in Figure 3a,b exhibited crystallization peaks for Fe80Si9B11 ≥ 410 °C and Fe82Si2B13P1C3 ≥ 380 °C, providing further evidence of increased loss after the crystallization of the amorphous iron cores.
Figure 4c depicts the frequency-dependent loss curves of Fe80Si9B11 annealed at 400 °C and Fe82Si2B13P1C3 annealed at 370 °C under an excitation of 1.4 T. It is evident that, within the frequency range of 50 Hz to 2 kHz, Fe82Si2B13P1C3 exhibits lower losses compared to those of Fe80Si9B11 at 1.4 T.
Figure 4d displays the magnetization curves of Fe80Si9B11 annealed at 400 °C and Fe82Si2B13P1C3 annealed at 370 °C. Prior to the intersection point of the two curves (indicated by the dashed line) at an excitation of 130 A/m, the working magnetic flux density Bm of Fe80Si9B11 exceeded that of Fe82Si2B13P1C3. However, beyond the excitation of 130 A/m, the Bm of Fe82Si2B13P1C3 surpassed that of Fe80Si9B11. At an excitation of 3500 A/m, Fe82Si2B13P1C3 exhibited a Bm of 1.59 T, which was higher than that of Fe80Si9B11 (Bm = 1.55 T). The higher Fe content in Fe82Si2B13P1C3, as indicated in Table 2, contributed to its elevated Bm value beyond an excitation of 130 A/m.
In short, the Fe82Si2B13P1C3 amorphous iron core demonstrated a lower loss than that of Fe80Si9B11. The Fe82Si2B13P1C3 amorphous iron core in the motor has the advantage of high efficiency, high power density and high torque density. The Fe82Si2B13P1C3 amorphous iron core exhibited a higher Bm than that of Fe80Si9B11. Compared with Fe80Si9B11, the amorphous iron core possess a relatively lower Bm, which hampers the miniature of the devices.
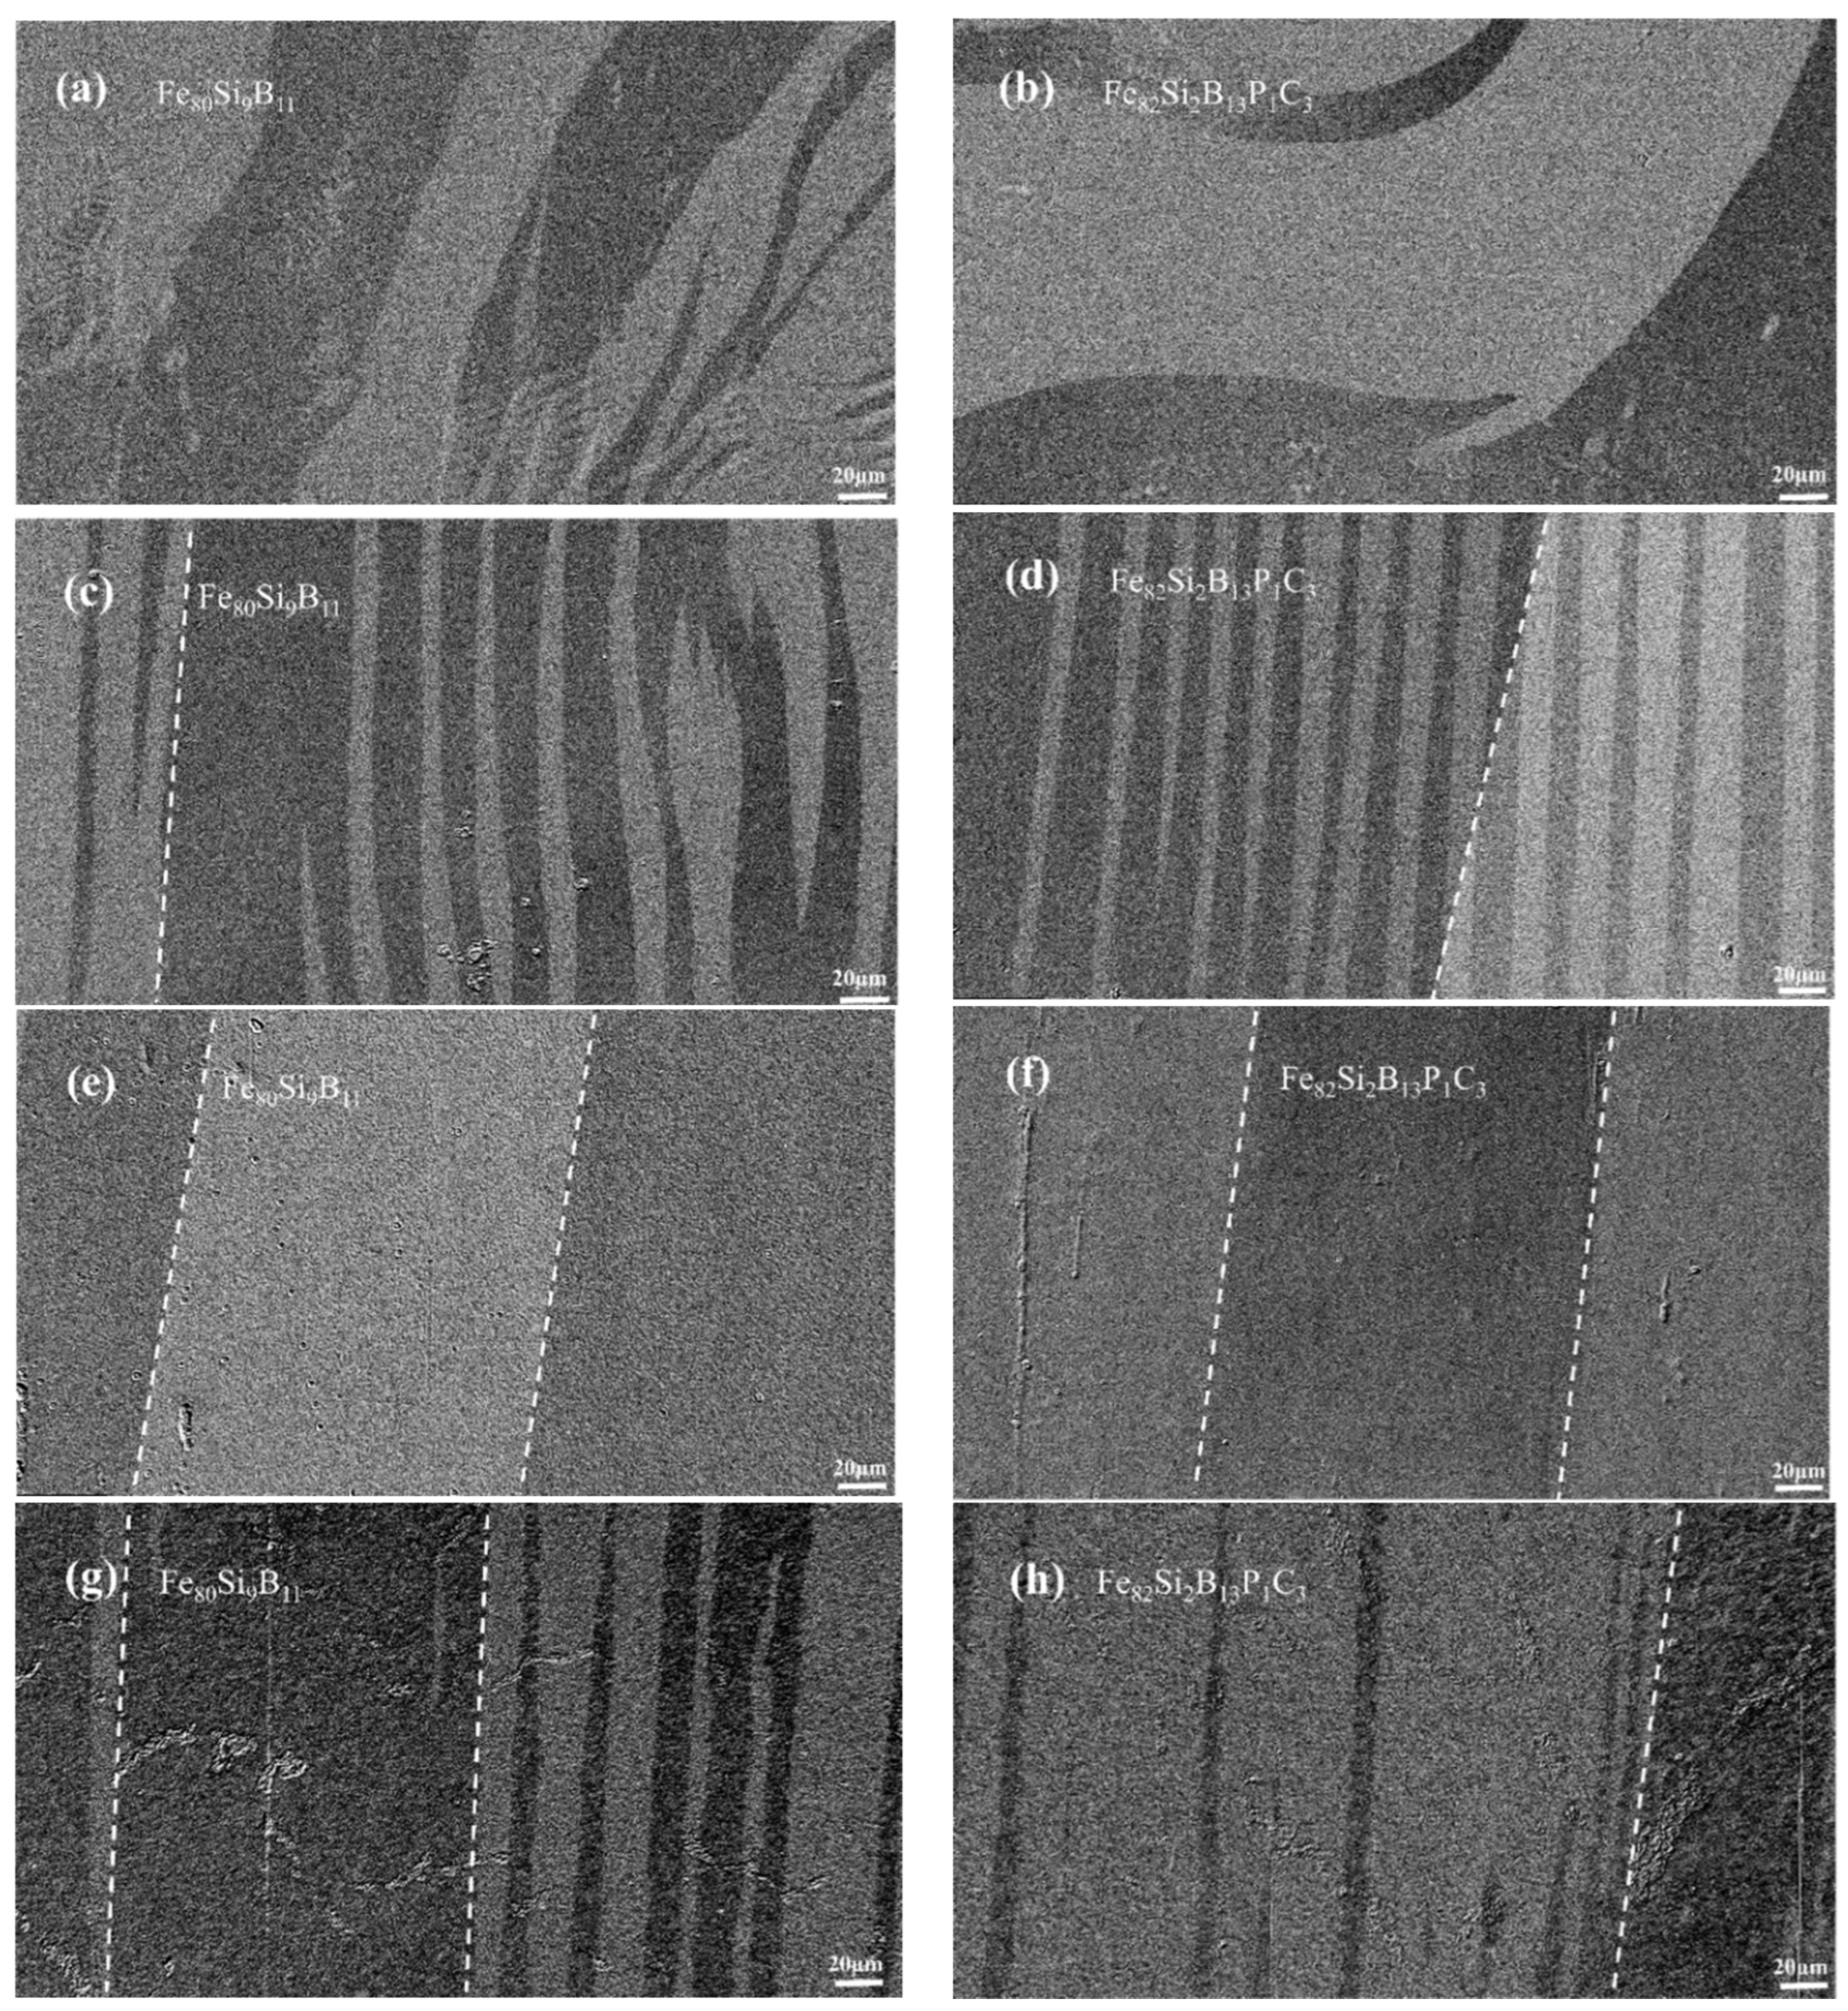
Figure 5a,b depict the magnetic domain morphologies of the as-spun Fe80Si9B11 and Fe82Si2B13P1C3 amorphous ribbons, respectively. Magnetic domains exhibit various types, such as sheet domains, closed domains, checkerboard domains, ripple domains, magnetic bubble domains and their derivatives [21]. Because the amorphous alloys lack grains, the influence of magnetic crystal anisotropy can be disregarded. Thus, the magnetic domain structure is primarily determined according to the residual stress generated during the preparation of the amorphous ribbons [22]. The high stress levels during the extremely cold process of quenching result in magnetic domains with irregular shapes, varying widths, disordered orientations and the presence of fine fingerprint domains. Residual stress has a detrimental effect on magnetic properties, and annealing has been proven to be effective in relieving internal stress and enhancing the magnetic properties of the ribbons [23]. Annealing induces structural relaxation and the release of internal stress in the amorphous strip, causing the magnetic domains within the strip to align along the direction of the easily magnetized axis, which is parallel to the strip’s length. This minimizes magnetic anisotropy within the strip [24]. The magnetic domain morphologies of Fe80Si9B11 annealed at 370 °C and Fe82Si2B13P1C3 annealed at 340 °C are illustrated in Figure 5c,d, respectively. The chosen annealing temperatures alleviate some stress, resulting in magnetic domains with converging orientations along the length direction of the ribbons. However, the shapes of the domains remain irregular and exhibit varying sizes. The results for Fe80Si9B11 annealed at 400 °C and Fe82Si2B13P1C3 annealed at 370 °C are presented in Figure 5e,f, respectively. Clearly, as the annealing temperature increases, wide and uniform magnetic domains form with consistent orientations within the ribbons. Moreover, Figure 5g,h demonstrate that, when Fe80Si9B11 was annealed at 410 °C and Fe82Si2B13P1C3 was annealed at 380 °C, the previously wide magnetic domains started to crack, becoming irregular and narrower. These observations indicate that the annealed amorphous ribbons began to crystallize at these temperatures.
Magnetic domain observations not only provide insight into the spatial distribution of domains within ferromagnetic materials but also serve as a foundation for investigating the magnetic properties of amorphous iron cores. During the magnetization process of these cores, the magnetic domain walls undergo bending, which can be impeded by impurities or internal stress within the material. To overcome these obstacles, partial excitation is employed to induce the bending of magnetic domain walls, resulting in their conversion into heat and subsequent energy losses. This motion of the domain walls generates eddy current losses. As the heat treatment temperature increases, the internal stress within the amorphous iron cores gradually diminishes, and impurities such as fingerprint domains gradually disappear. Consequently, the magnetic domains become more uniform, as illustrated in Figure 5e,f. In this scenario, wide strip domains characterized by low resistance and uniform changes are formed, leading to a reduction in the overall losses of the amorphous iron cores, as demonstrated by the red curves in Figure 4a,b.

3.3. Effects of FA on Magnetic Properties of Amorphous Iron Cores

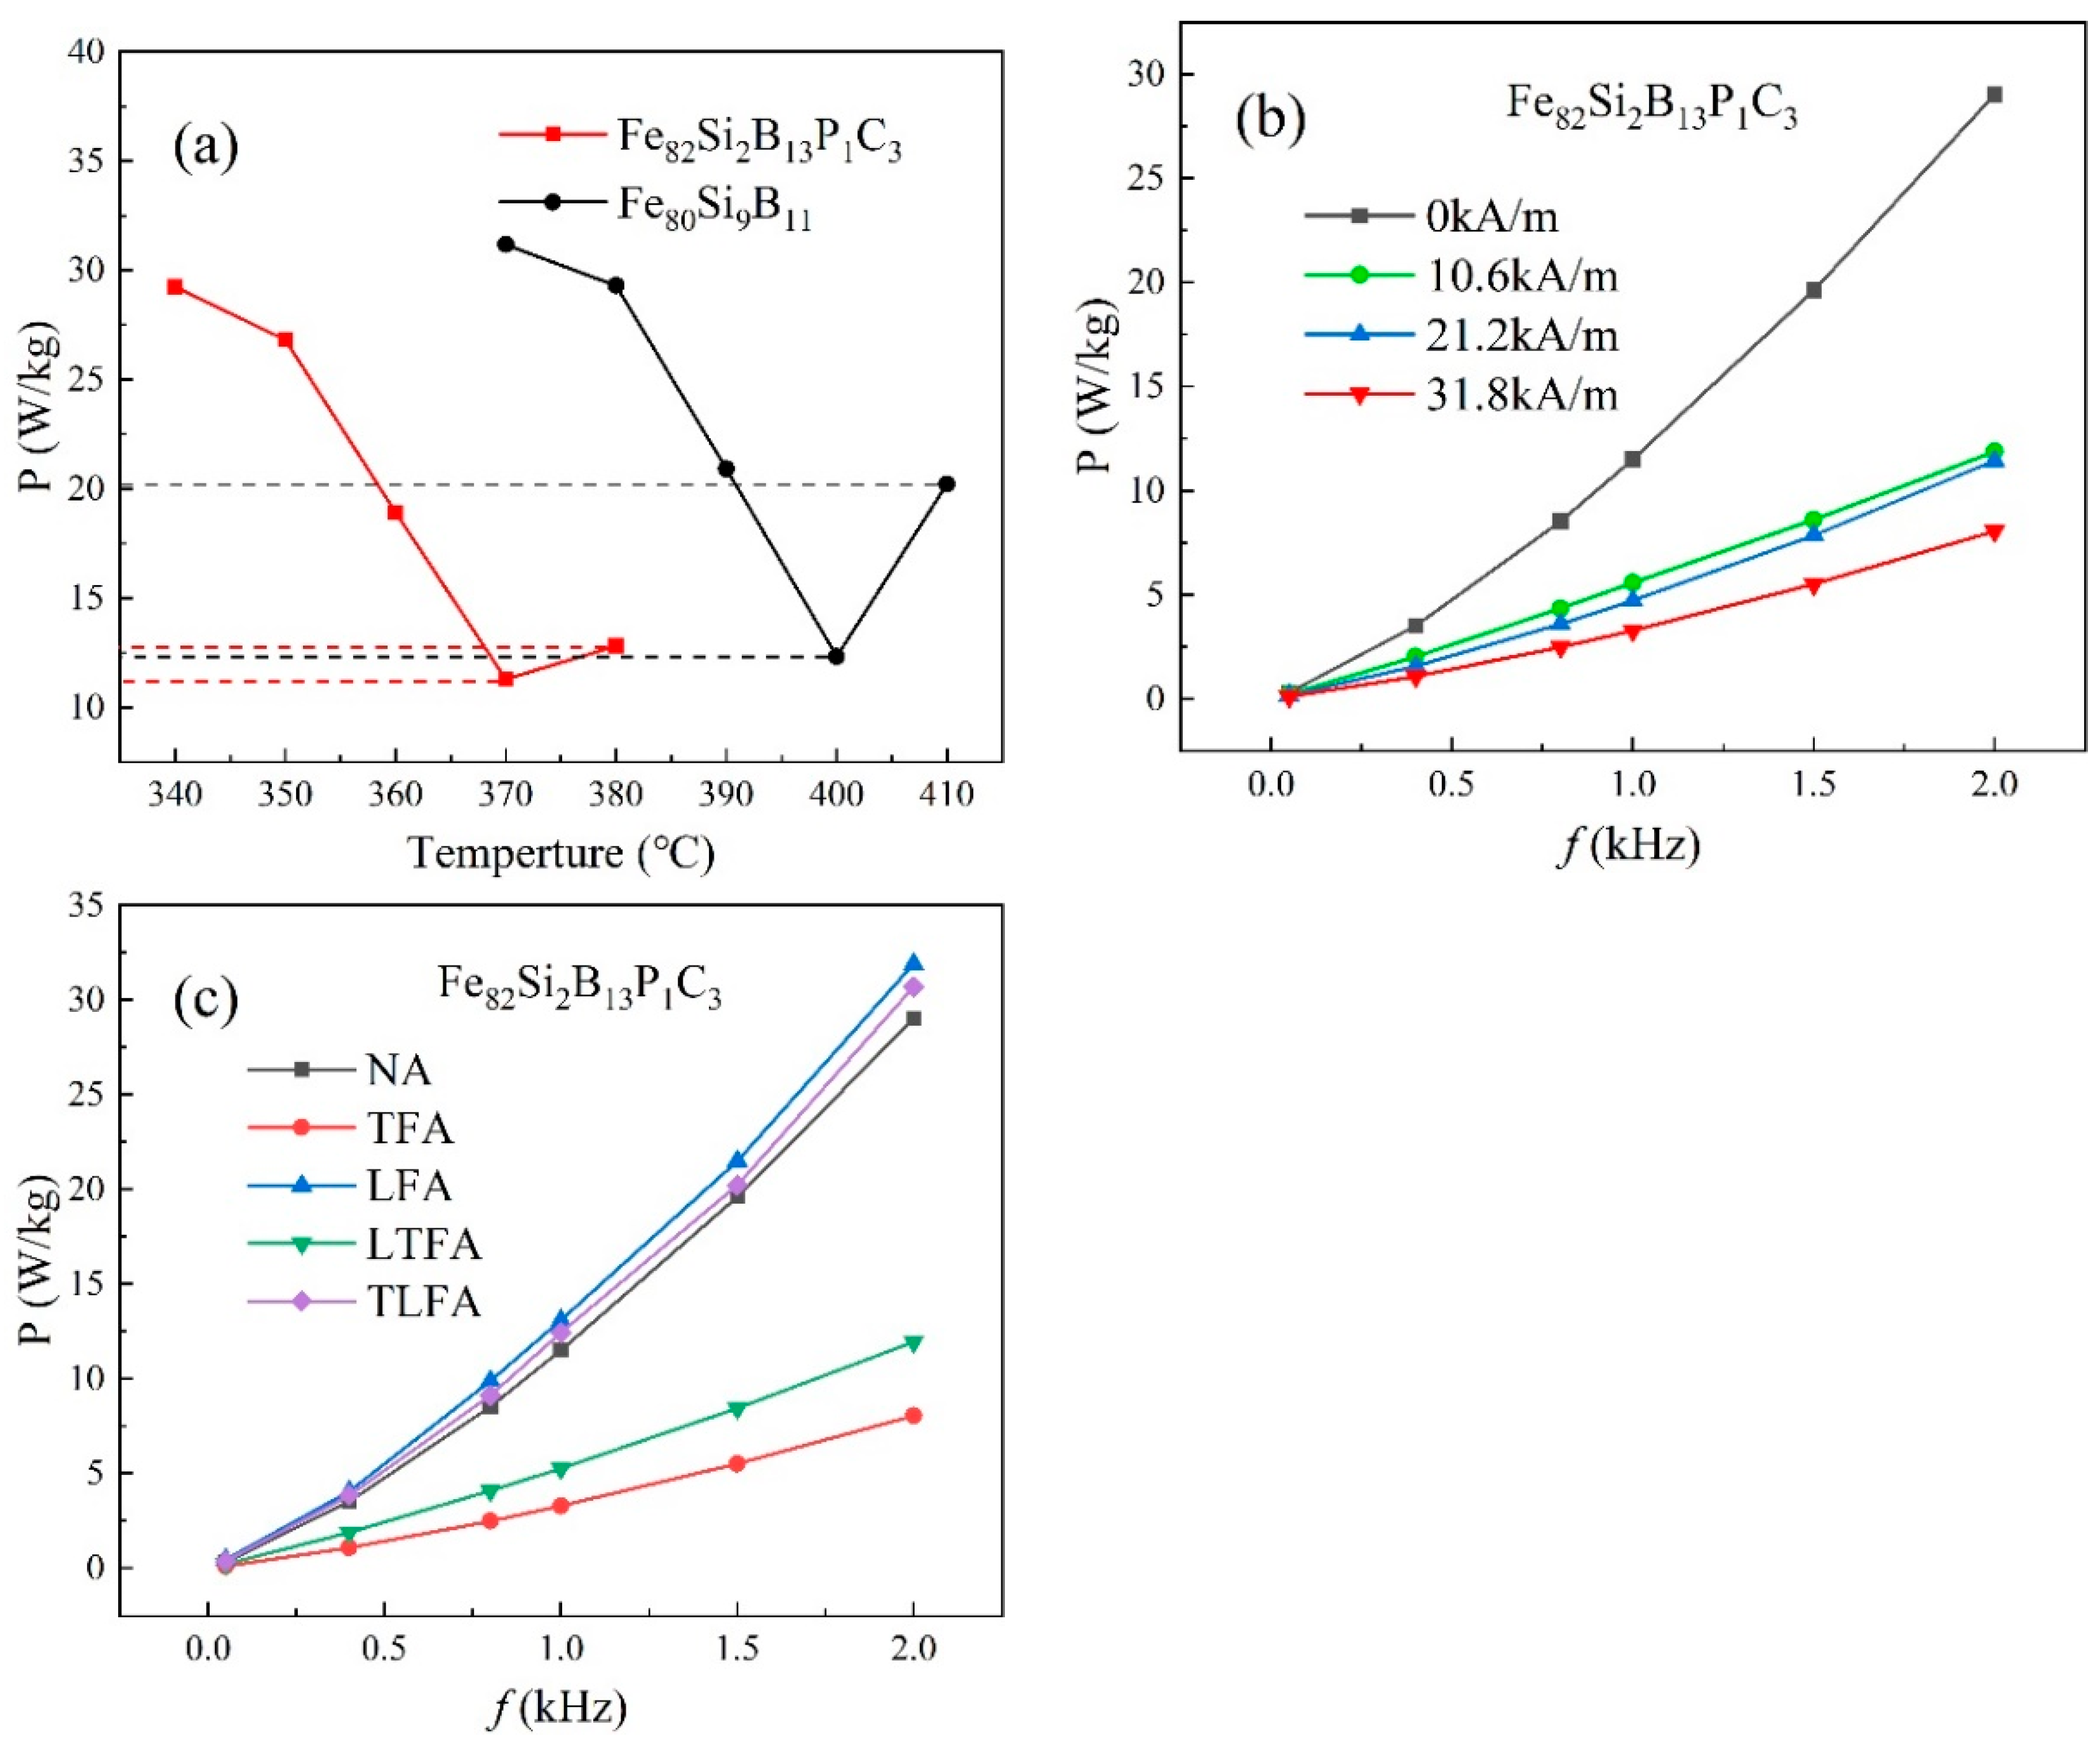
Figure 6a illustrates the effect of the annealing temperature on the loss under a transverse magnetic field of 10.6 kA/m. The results indicate that the loss first decreases and then increases with the increasing annealing temperature. Specifically, the minimum loss for Fe80Si9B11, recorded at P1.4T,2kHz = 12.3 W/kg, is achieved at an annealing temperature of 400 °C. Similarly, the lowest loss for Fe82Si2B13P1C3, measured at P1.4T,2kHz = 11.3 W/kg, occurs at an annealing temperature of 370 °C. As the annealing temperature is further increased, the losses begin to rise, reaching P1.4T,2kHz = 20.2 W/kg for Fe80Si9B11 annealed at 410 °C and P1.4T,2kHz = 12.8 W/kg for Fe82Si2B13P1C3 annealed at 380 °C. Notably, the loss of Fe82Si2B13P1C3 in the case of TFA is significantly lower than that of Fe80Si9B11 (As shown by the dashed line). To further investigate the impact of changing the transverse magnetic field on the magnetic properties, different magnetic field intensities were applied to the Fe82Si2B13P1C3 amorphous iron core at an annealing temperature of 370 °C. Figure 6b displays the variations in the loss. With an increased magnetic field intensity of 31.8 kA/m, the loss further decreased to P1.4T,2kHz = 8.1 W/kg, which is notably superior to the loss of the NA sample at 370 °C (P1.4T,2kHz = 29 W/kg), as shown in Figure 4d.
This study also examined the impact of different annealing processes, including NA, TFA, LFA, TLFA and LTFA, on the magnetic properties of Fe82Si2B13P1C3 when annealed at 370 °C. Figure 6c demonstrates that the sample treated with TFA exhibited the lowest loss, measured at P1.4T,2kHz = 8.1 W/kg, which was significantly superior to the losses observed in the other annealing processes. Conversely, LFA showed a poor loss performance. LTFA resulted in a loss of P1.4T,2kHz = 11.9 W/kg, which was better than that of TLFA (P1.4T,2kHz = 30.7 W/kg), as outlined in Table 3.
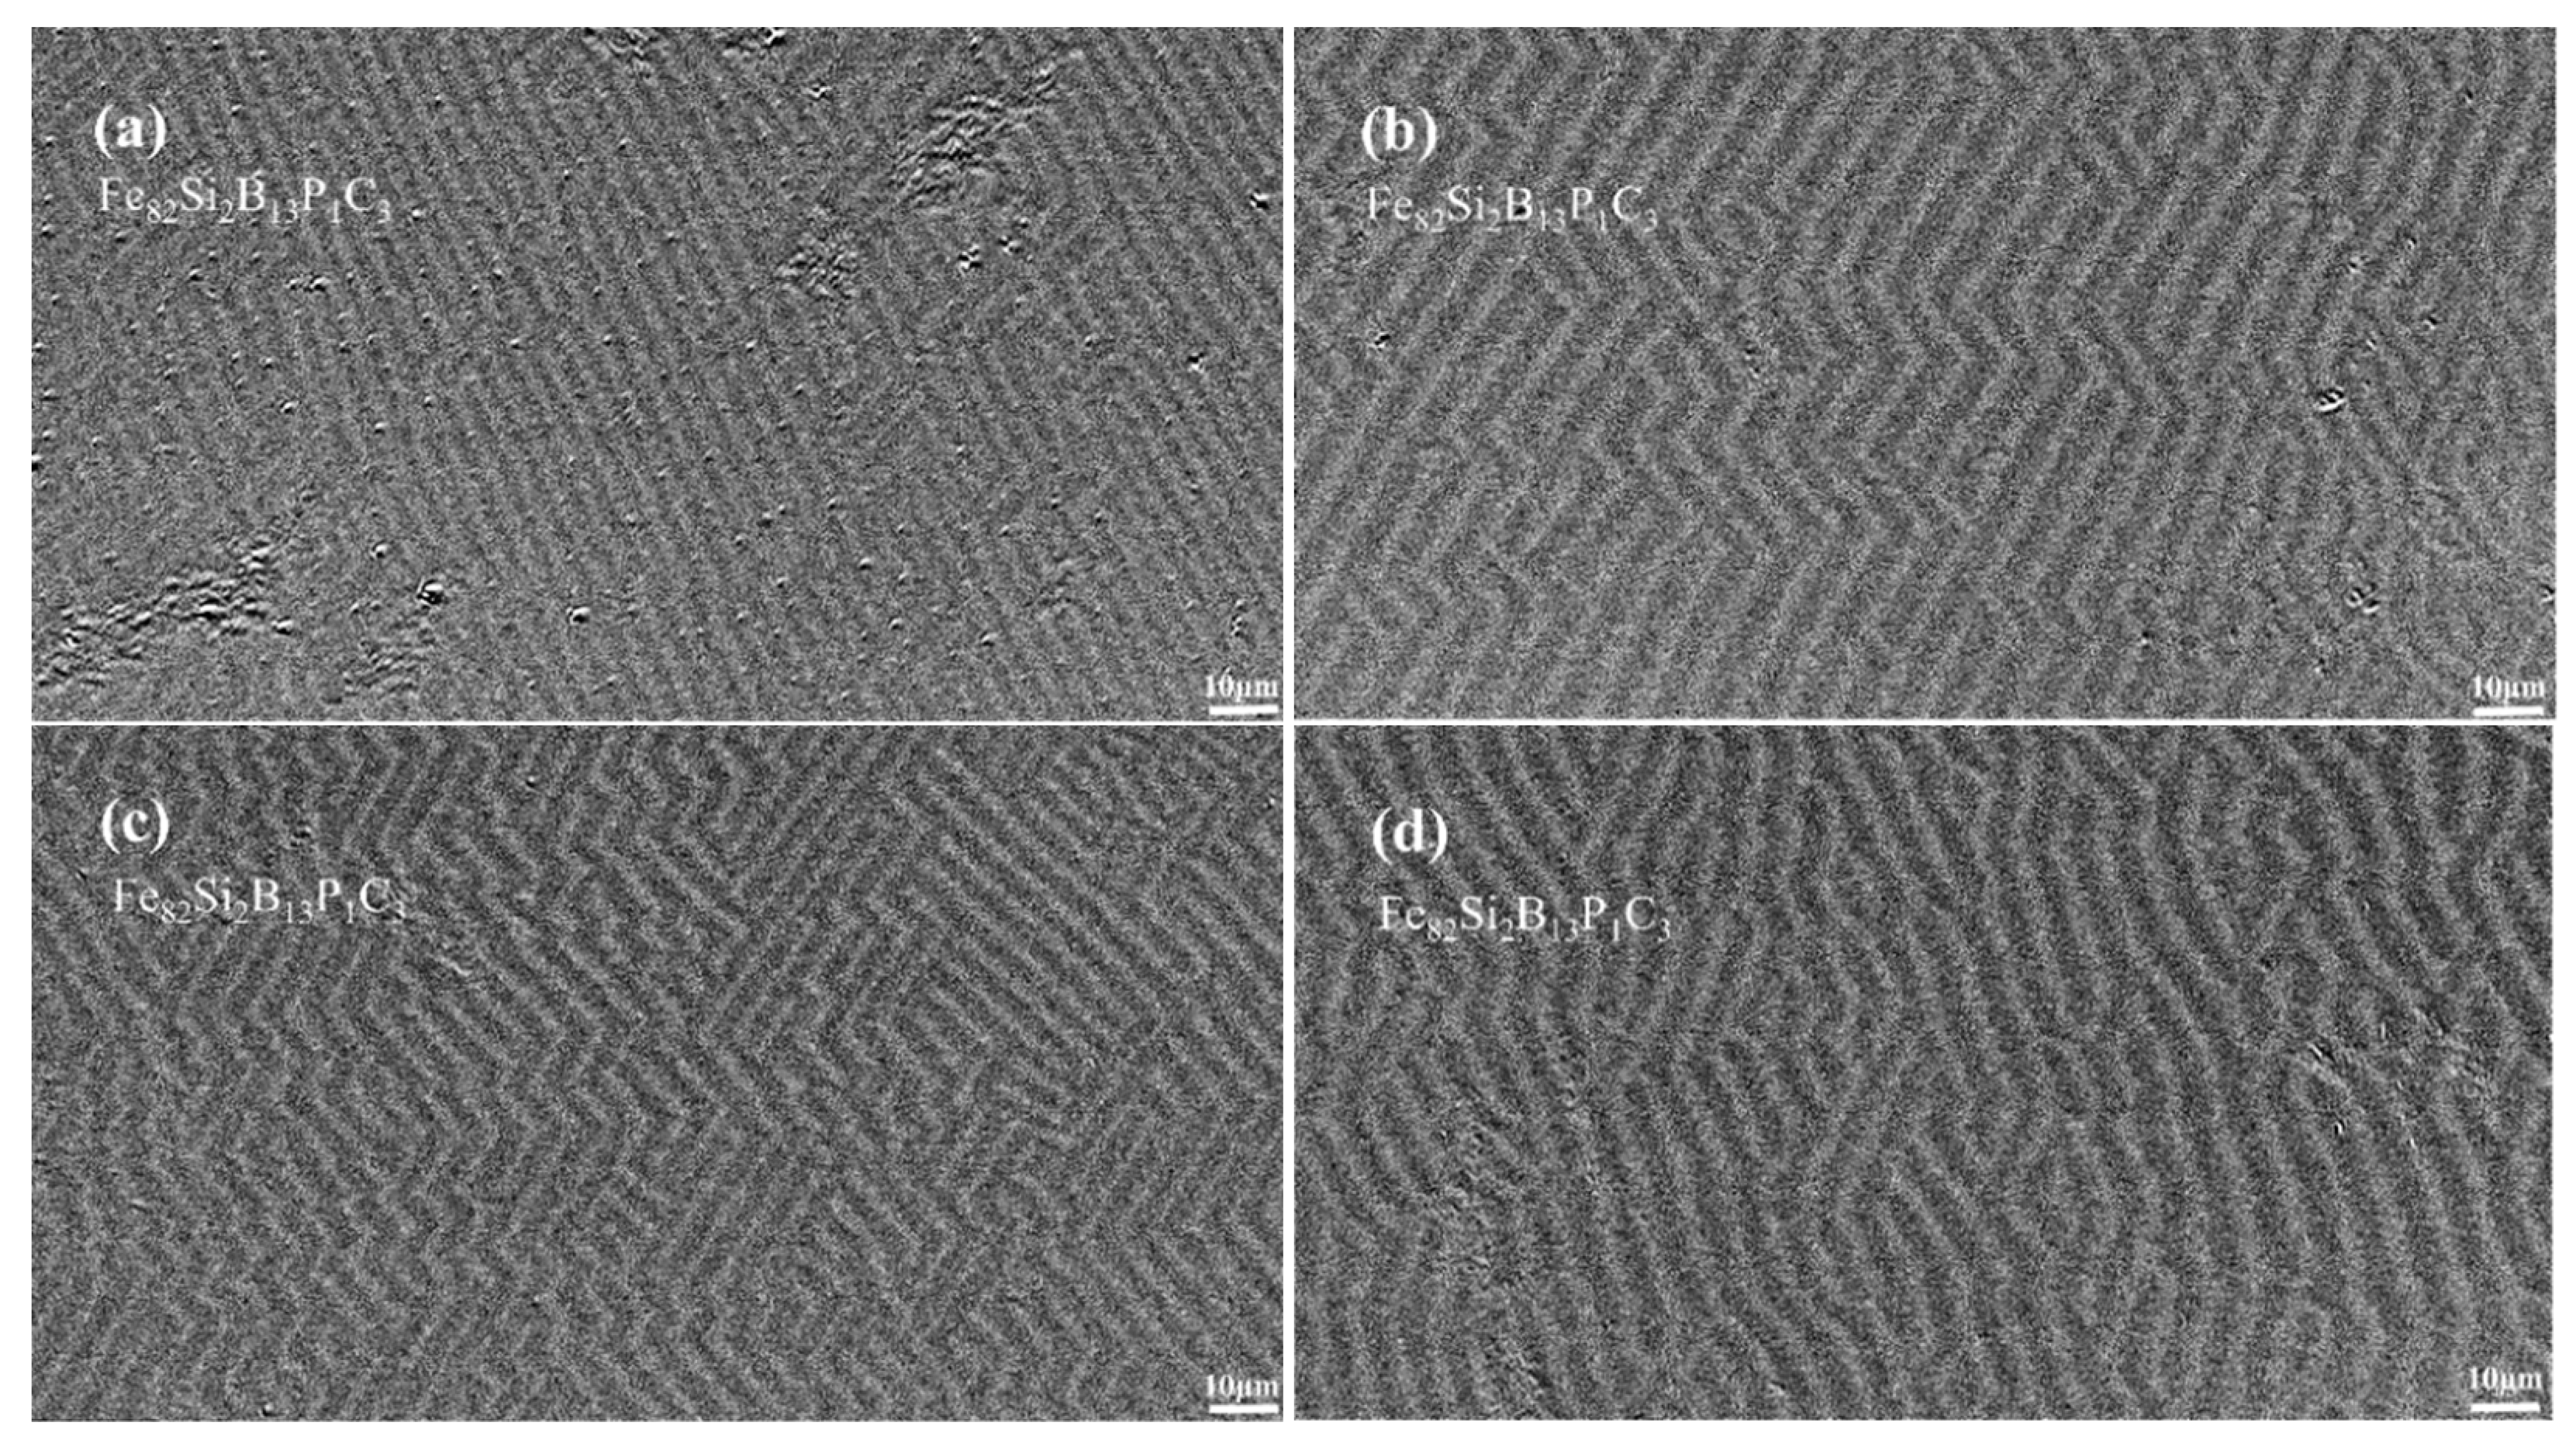
Figure 7a,b present the magnetic domain morphologies of Fe82Si2B13P1C3 annealed at 370 °C under transverse and longitudinal magnetic fields, respectively. In the case of TFA, the magnetic domain morphology appeared finer and exhibited a greater consistency in direction, as depicted in Figure 7c,d. When the longitudinal magnetic field was applied first or later, an increase in Z-shaped bending within the magnetic domains was observed, with the magnetic domain morphology of LTFA appearing finer compared to that of TLFA.
In conclusion, the morphology and orientation of magnetic domains were found to be closely related to the magnetic properties of the material. Furthermore, the results suggest that the presence and alteration of elements have an impact on the morphology of magnetic domains, consequently influencing the magnetic properties of the material.
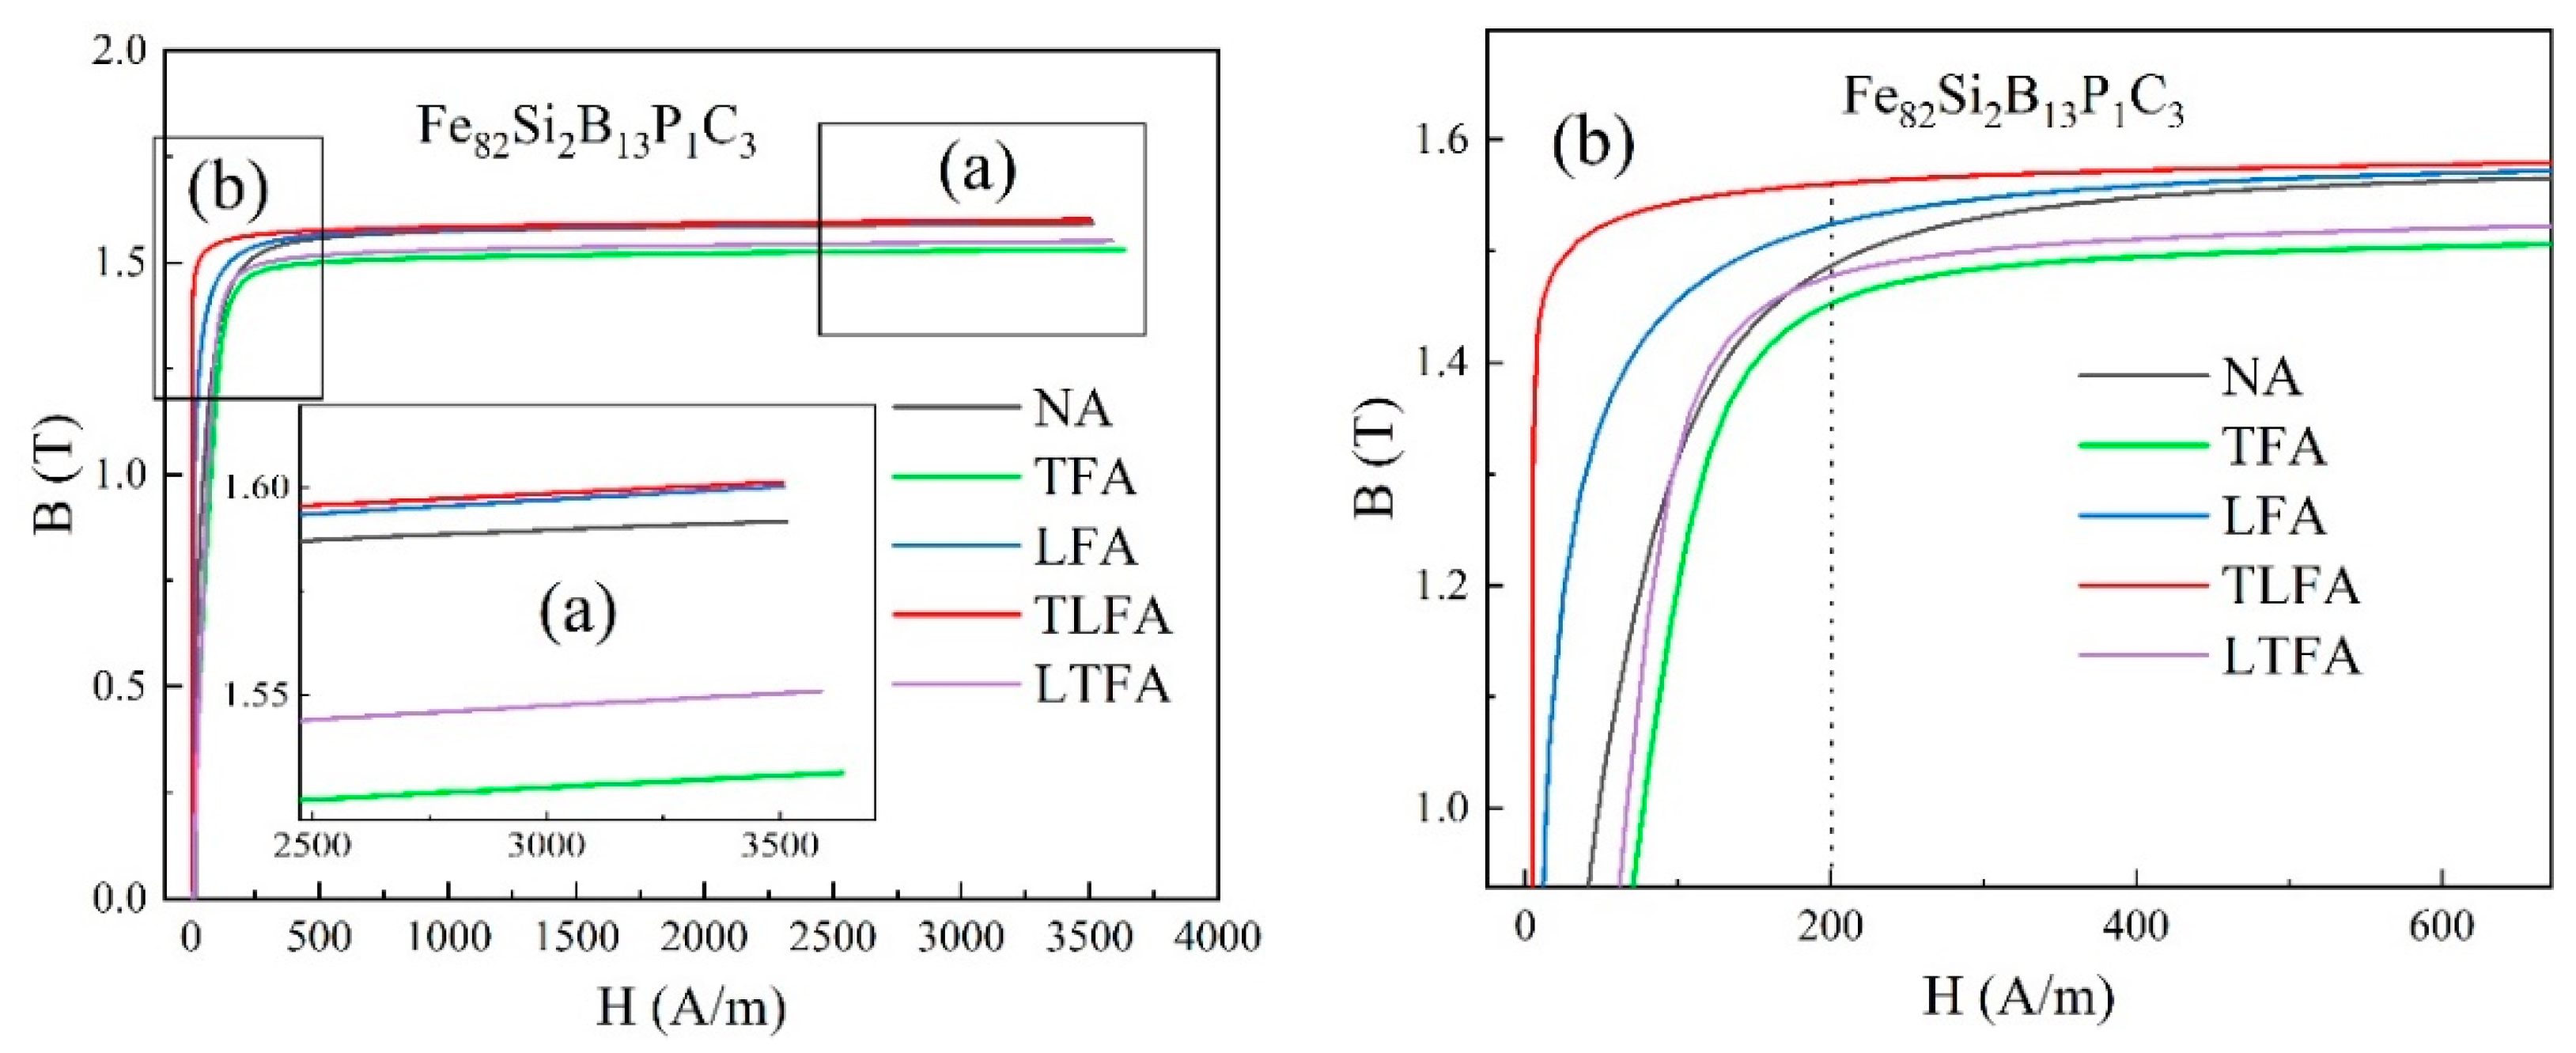
Figure 8 illustrates the magnetization curves of Fe82Si2B13P1C3 amorphous iron cores subjected to various treatments: NA, TFA, LFA, TLFA and LTFA at 370 °C. In Figure 8a, under an applied excitation of 3500 A/m, the Bm values of the treatment processes were arranged in ascending order as TFA < LTFA < NA < LFA < TLFA. Particularly, the Bm values of LFA and TLFA closely overlapped, both reaching 1.6 T. Figure 8b presents enlarged images at the inflection points. The ordering of Bm values under an excitation of 200 A/m was consistent with that under 3500 A/m. Notably, the LFA magnetization curve exhibited a distinct rectangular shape, enhancing the maximum permeability and residual magnetic induction strength while also increasing the loss. Conversely, TFA resulted in a flattened magnetization curve, promoting a more stable magnetic permeability, lower residual magnetic induction strength and reduced loss. The low-loss amorphous alloy iron core proves to be an exceptional material for pulse transformers. Magnetic field heat treatment can introduce uniaxial magnetic anisotropy to the amorphous iron core, enabling precise control of its size, direction and modulation of the magnetization curve to fulfill specific application requirements.

4. Conclusions

This study conducted a comprehensive investigation into the impact of NA and FA on the magnetic properties of an Fe82Si2B13P1C3 amorphous iron core and compared it with an Fe80Si9B11 amorphous iron core. The findings can be summarized as follows.
(1)
The Fe82Si2B13P1C3 amorphous iron core, subjected to TFA, demonstrated a lower loss of P1.4T,2kHz = 8.1 W/kg, which was 17% less than that of Fe80Si9B11 with a loss of P1.4T,2kHz = 9.8 W/kg. Furthermore, the Fe82Si2B13P1C3 amorphous iron core exhibited a higher B3500A/m value of 1.6 T under LFA, which was 0.05 T greater than the B3500A/m value of Fe80Si9B11 (B3500A/m = 1.55 T). The optimal heat treatment temperature for Fe82Si2B13P1C3 was 30 °C lower than that of Fe80Si9B11, contributing to improved toughness of the amorphous ribbons.
(2)
As the heat treatment temperature of Fe82Si2B13P1C3 increased to 370 °C, the internal stress gradually dissipated, resulting in the disappearance of impurity domains, such as fingerprint domains. Moreover, the magnetic domains within the strip underwent a transformation, aligning themselves with the length direction of the strip. This led to the formation of wide strip domains with low resistance, facilitating easy magnetization and ultimately reducing the overall loss of the amorphous iron core.
(3)
For Fe82Si2B13P1C3 amorphous iron cores under an applied excitation of 3500 A/m, the Bm values of the treatment processes were arranged in ascending order as TFA < LTFA < NA < LFA < TLFA. Particularly, the Bm values of LFA and TLFA closely overlapped, with both reaching 1.6 T.

Author Contributions

Formal analysis, W.Z. and S.S.; writing—original draft preparation, W.Z.; data curation, W.Z., M.G. and H.Y.; software, Q.Z.; methodology, G.Z. and Z.L.; supervision, G.Z.; writing—review and editing, S.Z. and X.Q. All authors have read and agreed to the published version of the manuscript.

Funding

This study was supported by the Major Program of the National Natural Science Foundation of China [No. 52192603] and the National Key Research and Development Program [No. 2021YFB3800502].

Institutional Review Board Statement

Not applicable.

Informed Consent Statement

Not applicable.

Data Availability Statement

The data presented in this study are available within the article.

Conflicts of Interest

The authors declare no conflict of interest.

References

  1. Silveyra, J.M.; Ferrara, E.; Huber, D.L.; Monson, T.C. Soft magnetic materials for a sustainable and electrified world. Science 2018, 362, eaao0195. [Google Scholar] [CrossRef] [Green Version]
  2. Suryanarayana, C.; Inoue, A. Iron-based bulk metallic glasses. Int. Mater. Rev. 2013, 58, 131–166. [Google Scholar] [CrossRef]
  3. Fan, T.; Li, Q.; Wen, X. Development of a high power density motor made of amorphous alloy cores. IEEE Trans. Ind. Electron. 2013, 61, 4510–4518. [Google Scholar] [CrossRef]
  4. Wang, W.H. Development and implication of amorphous alloys. Bull. Chin. Acad. Sci. 2022, 37, 352–359. (In Chinese) [Google Scholar]
  5. Wang, Z.; Masaki, R.; Morinaga, S.; Enomoto, Y.; Itabashi, H.; Ito, M.; Tanigawa, S. Development of an axial gap motor with amorphous metal cores. IEEE Trans. Ind. Appl. 2011, 47, 1293–1299. [Google Scholar] [CrossRef]
  6. Hong, D.-K.; Joo, D.; Woo, B.-C.; Jeong, Y.-H.; Koo, D.-H. Investigations on a super high speed motor-generator for microturbine applications using amorphous core. IEEE Trans. Magn. 2013, 49, 4072–4075. [Google Scholar] [CrossRef]
  7. Zhang, Q.; Li, Z.; Zhang, G.; Zheng, W.; Cao, X.; Hui, X.; Zhou, S. The role of P content on the glass-forming ability and the magnetic properties of FeSiBPC amorphous alloys. J. Mater. Sci. Mater. Electron. 2022, 33, 10259–10266. [Google Scholar] [CrossRef]
  8. Wang, A.; Zhao, C.; Men, H.; He, A.; Chang, C.; Wang, X.; Li, R.-W. Fe-based amorphous alloys for wide ribbon production with high Bs and outstanding amorphous forming ability. J. Alloys Comp. 2015, 630, 209–213. [Google Scholar] [CrossRef]
  9. Zhang, Q.; Hui, X.; Li, Z.; Zhang, G.; Lin, J.; Li, X.; Zheng, W.; Cao, X.; Zhou, S. Effect of pre-oxidation treatment on corrosion resistance of FeCoSiBPC amorphous alloy. Materials 2022, 15, 3206. [Google Scholar] [CrossRef]
  10. Aljerf, M.; Georgarakis, K.; Yavari, A.R. Shaping of metallic glasses by stress-annealing without thermal embrittlement. Acta Mater. 2011, 59, 3817–3824. [Google Scholar] [CrossRef]
  11. Morsdorf, L.; Pradeep, K.G.; Herzer, G.; Kovács, A.; Dunin-Borkowski, R.E.; Povstugar, I.; Konygin, G.; Choi, P.; Raabe, D. Phase selection and nanocrystallization in Cu-free soft magnetic FeSiNbB amorphous alloy upon rapid annealing. J. Appl. Phys. 2016, 119, 124903. [Google Scholar] [CrossRef] [Green Version]
  12. Wang, F.; Inoue, A.; Han, Y.; Kong, F.L.; Zhu, S.L.; Shalaan, E.; Marzouki, F.A.; Obaid, A. Excellent soft magnetic Fe-Co-B-based amorphous alloys with extremely high saturation magnetization above 1.85 T and low coercivity below 3 A/m. J. Alloys Comp. 2017, 711, 132–142. [Google Scholar] [CrossRef]
  13. Miguel, C.; Zhukov, A.P.; Val, J.J.; Arellano, A.R.; González, J. Effect of stress and/or field annealing on the magnetic behavior of the (Co77Si13.5B9.5)90Fe7Nb3 amorphous alloy. J. Appl. Phys. 2005, 97, 034911. [Google Scholar] [CrossRef]
  14. Zhao, C.; Wang, A.; Yue, S.; Liu, T.; He, A.; Chang, C.; Wang, X.M.; Liu, C.T. Significant improvement of soft magnetic properties for Fe(Co)BPSiC amorphous alloys by magnetic field annealing. J. Alloys Comp. 2018, 742, 220–225. [Google Scholar] [CrossRef]
  15. Li, H.; He, A.; Wang, A.; Xie, L.; Li, Q.; Zhao, C.; Zhang, G.Y.; Chen, P.B. Improvement of soft magnetic properties for distinctly high Fe content amorphous alloys via longitudinal magnetic field annealing. J. Magn. Magn. Mater. 2019, 471, 110–115. [Google Scholar] [CrossRef]
  16. Suzuki, K.; Herzer, G. Magnetic-field-induced anisotropies and exchange softening in Fe-rich nanocrystalline soft magnetic alloys. Scr. Mater. 2012, 67, 548–553. [Google Scholar] [CrossRef]
  17. Li, Z.; Zhou, S.; Zhang, G.; Zheng, W. Highly Ductile and Ultra-Thick P-Doped FeSiB Amorphous Alloys with Excellent Soft Magnetic Properties. Materials 2018, 11, 1148. [Google Scholar] [CrossRef] [Green Version]
  18. Turnbull, D. Under what conditions can a glass be formed? Contemp. Phys. 1969, 10, 473–488. [Google Scholar] [CrossRef]
  19. Turnbull, D.; Cohen, M.H. Free-volume model of the amorphous phase: Glass transition. J. Chem. Phys. 1961, 34, 120–125. [Google Scholar] [CrossRef]
  20. Gruszka, K.M.; Nabiałek, M.; Błoch, K.; Olszewski, J. Effect of heat treatment on the shape of the hyperfine field induction distributions and magnetic properties of amorphous soft magnetic Fe62Co10Y8B20 alloy. J. Nukl. 2015, 60, 23–27. [Google Scholar] [CrossRef] [Green Version]
  21. Zeper, W.B.; Greidanus, F.; Carcia, P.F.; Fincher, C.R. Perpendicular magnetic anisotropy and magneto-optical Kerr effect of vapor-deposited Co/Pt-layered structures. J. Appl. Phys. 1989, 65, 4971–4975. [Google Scholar] [CrossRef]
  22. Liu, J.P.; Fullerton, E.; Gutfleisch, O.; Sellmyer, D.J. Nanoscale Magnetic Materials and Applications; Springer: Berlin/Heidelberg, Germany, 2009. [Google Scholar]
  23. Ri, M.C.; Ding, D.W.; Sohrabi, S.; Sun, B.A.; Wang, W.H. Stress relief by annealing under external stress in Fe-based metallic glasses. J. Appl. Phys. 2018, 124, 165108. [Google Scholar] [CrossRef]
  24. Zhao, C.; Wang, A.; He, A.; Yue, S.; Chang, C.; Wang, X.; Li, R.-W. Correlation between soft-magnetic properties and Tx1-Tc in high Bs FeCoSiBPC amorphous alloys. J. Alloys Comp. 2016, 659, 193–197. [Google Scholar] [CrossRef]
Figure 1. (a) Schematic diagram of TFA; (b) Schematic diagram of LFA.
Materials 16 05527 g001
Figure 2. (a) XRD curve of as-spun Fe82Si2B13P1C3; (b) HRTEM image and SAED pattern of as-spun Fe82Si2B13P1C3; (c) DSC curves of Fe80Si9B11 and Fe82Si2B13P1C3; (d) Magnetization curves of Fe80Si9B11 and Fe82Si2B13P1C3.
Materials 16 05527 g002
Figure 3. (a) XRD curves of Fe80Si9B11 at different annealing temperatures; (b) XRD curves of Fe82Si2B13P1C3 at different annealing temperatures.
Materials 16 05527 g003
Figure 4. (a) Fe80Si9B11 loss curves under different temperatures and frequencies at an excitation of 1.4 T; (b) Fe82Si2B13P1C3 loss curves under different temperatures and frequencies at an excitation of 1.4 T; (c) Loss curves under different frequencies for annealed Fe80Si9B11 (400 °C) and Fe82Si2B13P1C3 (370 °C) at an excitation of 1.4 T; (d) Magnetization curves of annealed Fe80Si9B11 (400 °C) and Fe82Si2B13P1C3 (370 °C).
Materials 16 05527 g004
Figure 5. (a) Domain morphology of as-spun Fe80Si9B11; (b) Domain morphology of as-spun Fe82Si2B13P1C3, (c) Domain morphology of Fe80Si9B11 at 370 °C; (d) Domain morphology of Fe82Si2B13P1C3C3 at 340 °C; (e) Domain morphology of Fe80Si9B11 at 400 °C; (f) Domain morphology of Fe82Si2B13P1C3 at 370 °C; (g) Domain morphology of Fe80Si9B11 at 410 °C; (h) Domain morphology of Fe82Si2B13P1C3 at 380 °C.
Materials 16 05527 g005
Figure 6. (a) TFA losses under different temperatures at 10.6 kA/m, 1.4 T, 2 kHz; (b) Losses at 370 °C when the transverse magnetic field was varied; (c) Loss curves of NA, TFA, LFA, LTFA and TLFA at 370 °C.
Materials 16 05527 g006
Figure 7. (a) TFA domain morphology for Fe82Si2B13P1C3 annealed at 370 °C; (b) LFA domain morphology for Fe82Si2B13P1C3 annealed at 370 °C; (c) LTFA domain morphology for Fe82Si2B13P1C3 annealed at 370 °C; (d) TLFA domain morphology for Fe82Si2B13P1C3 annealed at 370 °C.
Materials 16 05527 g007
Figure 8. (a) Magnetization curves of NA, TFA, LFA, LTFA and TLFA samples annealed at 370 °C; (b) Partially enlarged images.
Materials 16 05527 g008
Table 1. Thermodynamic properties of Fe82Si2B13P1C3 and Fe80Si9B11 ribbons in as-spun state.
ItemTx1 (°C)Tp1 (°C)Tp2 (°C)ΔTp = Tp2 − Tp1 (°C)
Fe82Si2B13P1C348050955041
Fe80Si9B1150852456440
Difference (TFe82Si2B13P1C3 − TFe80Si9B11)−28−15−141
Table 2. NA losses and Bm values of Fe82Si2B13P1C3 and Fe80Si9B11 iron cores.
ItemP1.4T,2kHz (W/kg)P1.4T,2kHz (W/kg)ΔP1.4T,2kHz (W/kg)B3500A/m
(T)
Fe82Si2B13P1C329 (370 °C)47 (380 °C)181.59 (380 °C)
Fe80Si9B1136 (400 °C)58 (410 °C)221.55 (410 °C)
Difference
(Fe82Si2B13P1C3 − Fe80Si9B11)
−7−11−40.04
Table 3. NA losses for Fe82Si2B13P1C3 and Fe80Si9B11 iron cores.
ItemP1.4T,2kHz
(W/kg)
10.6 kA/m
P1.4T,2kHz
(W/kg)
10.6 kA/m
P1.4T,2kHz
(W/kg)
31.8 kA/m
P1.4T,2kHz
(W/kg)
LTFA
P1.4T,2kHz
(W/kg)
TLFA
Fe82Si2B13P1C311.3
(370 °C)
12.8
(380 °C)
8.1
(370 °C)
11.9
(370 °C)
30.7
(370 °C)
Fe80Si9B1112.3
(400 °C)
20.2
(410 °C)
9.8 (400 °C)12.5 (400 °C)32.1 (400 °C)
Difference (P Fe82Si2B13P1C3 − P Fe80Si9B11)−1−7.4−1.7−0.6−1.4
Disclaimer/Publisher’s Note: The statements, opinions and data contained in all publications are solely those of the individual author(s) and contributor(s) and not of MDPI and/or the editor(s). MDPI and/or the editor(s) disclaim responsibility for any injury to people or property resulting from any ideas, methods, instructions or products referred to in the content.