

Analysis of the Rolling Interface Contact Characteristics in Mixed Lubrication Based on Gaussian Distribution Theory


Abstract
:1. Introduction
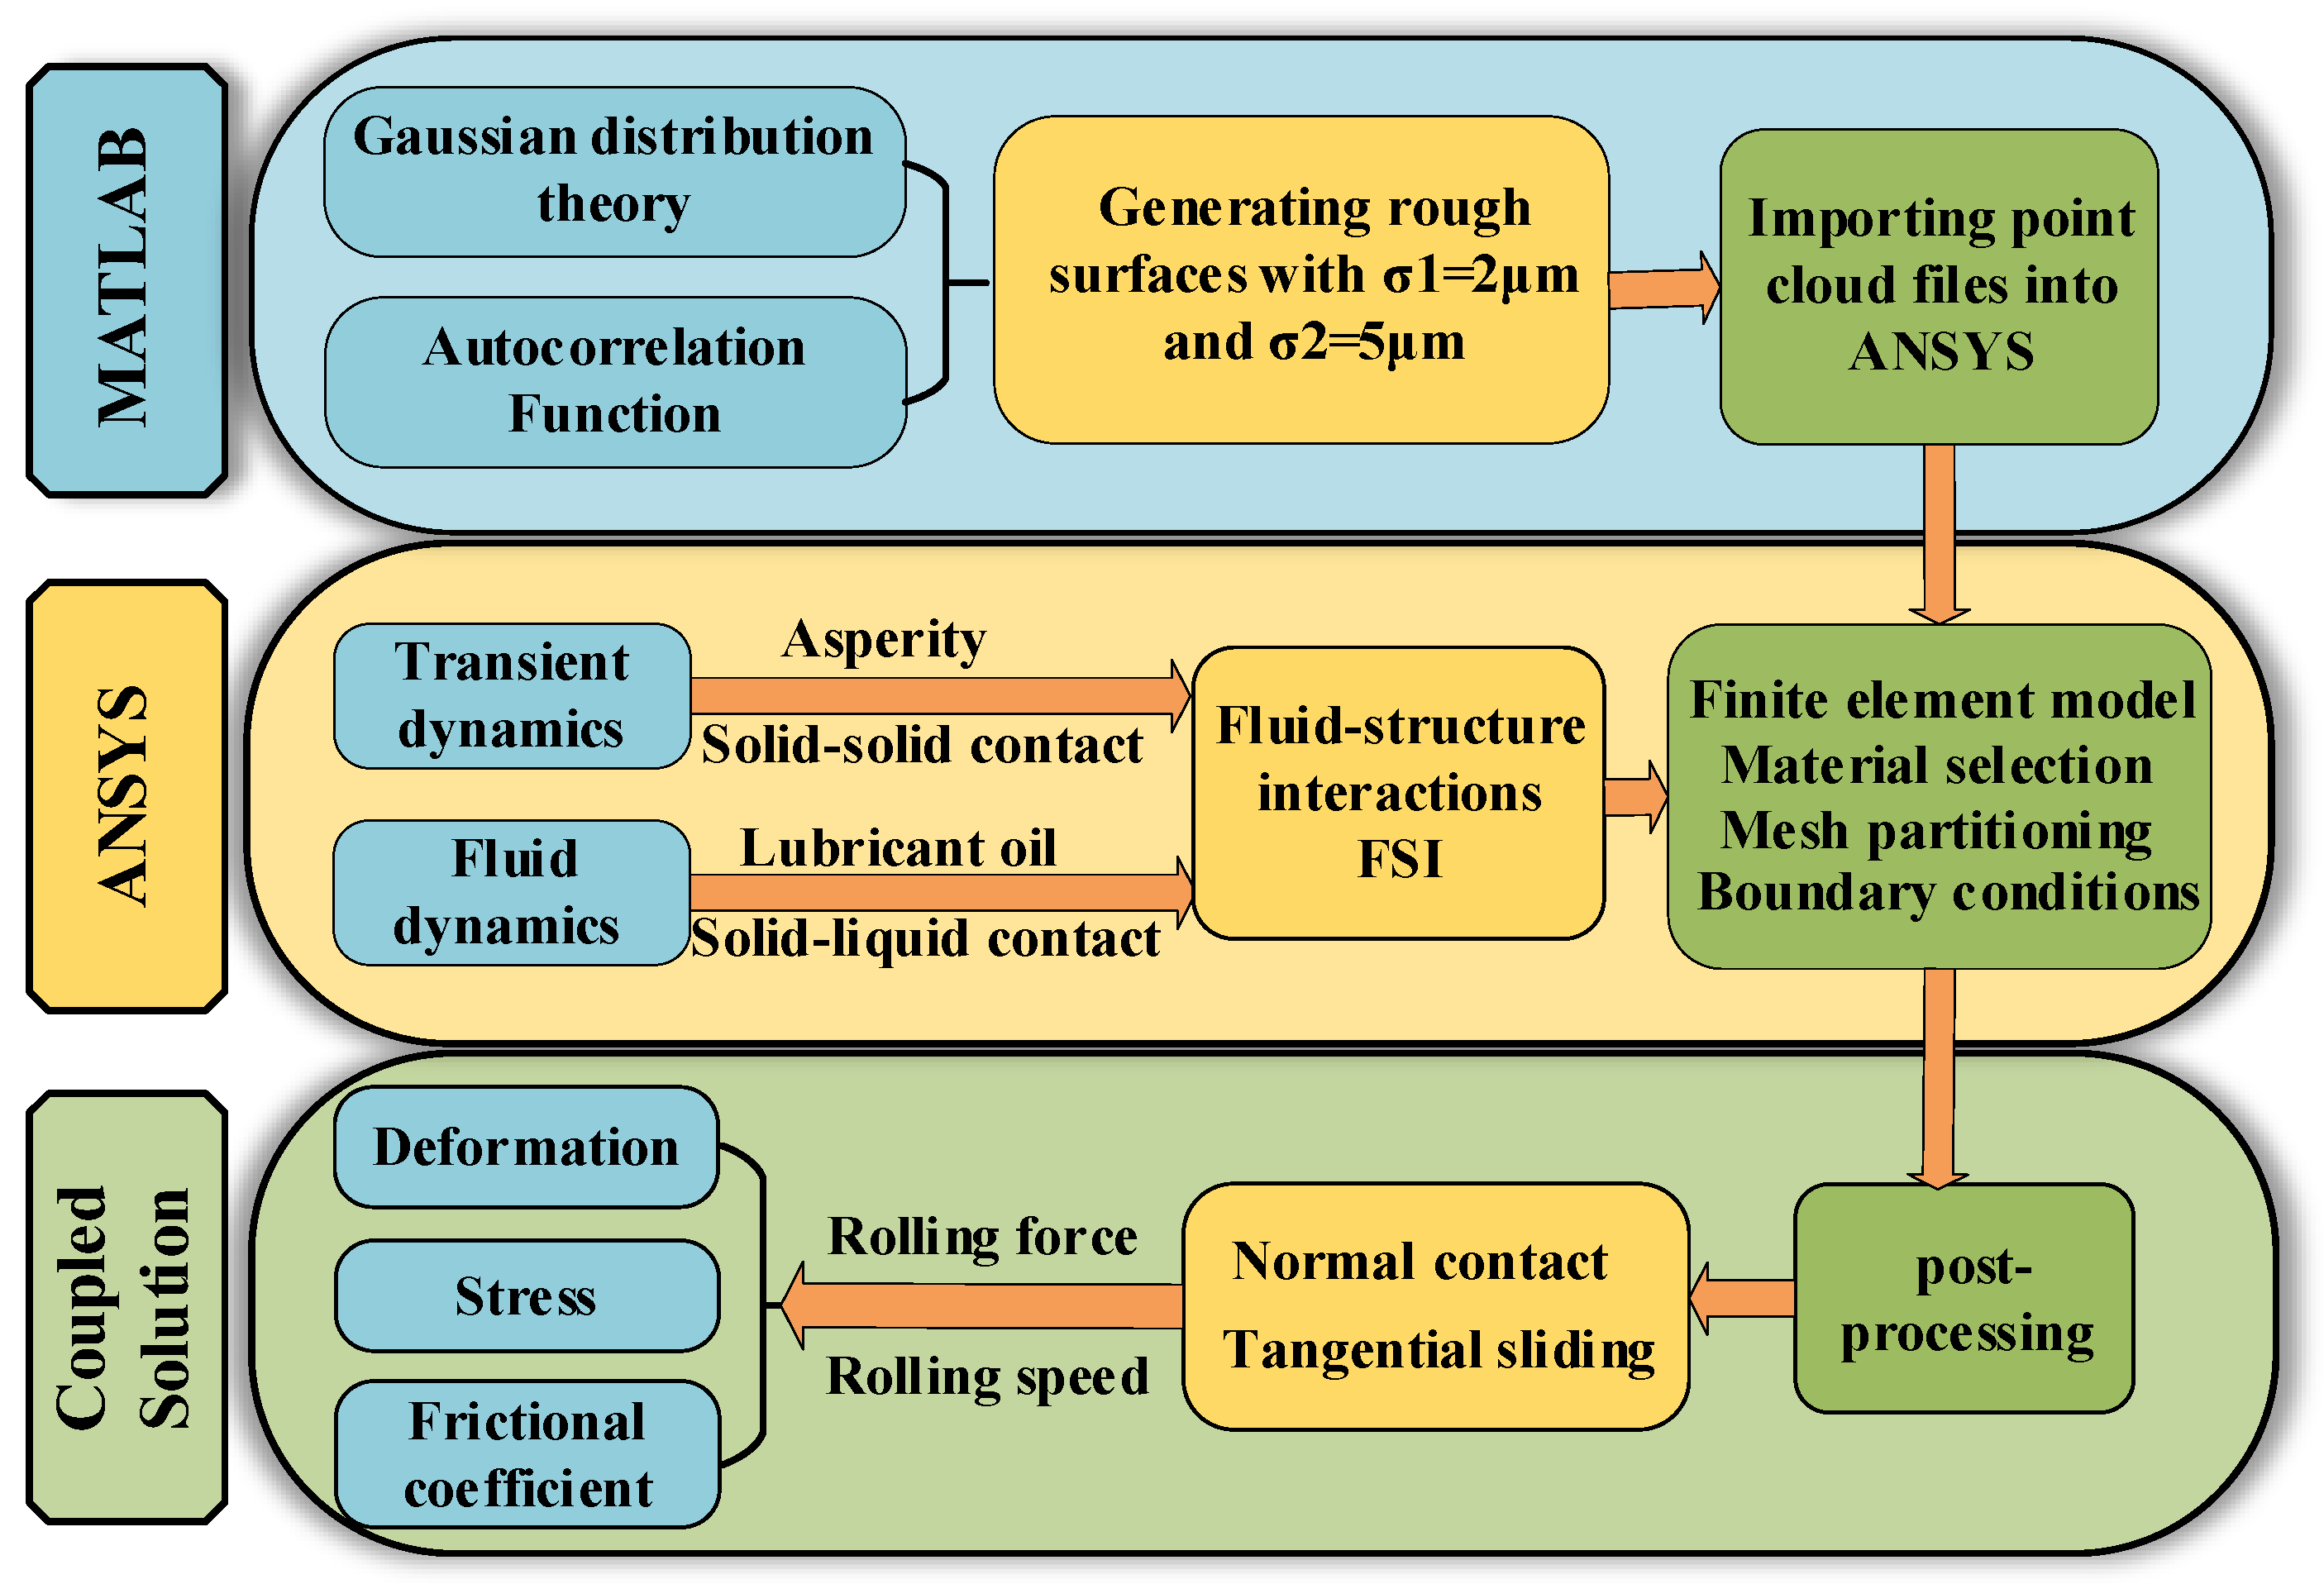
2. Micro-Scale Simulation Model
2.1. Gaussian Control Equation for Rough Surfaces
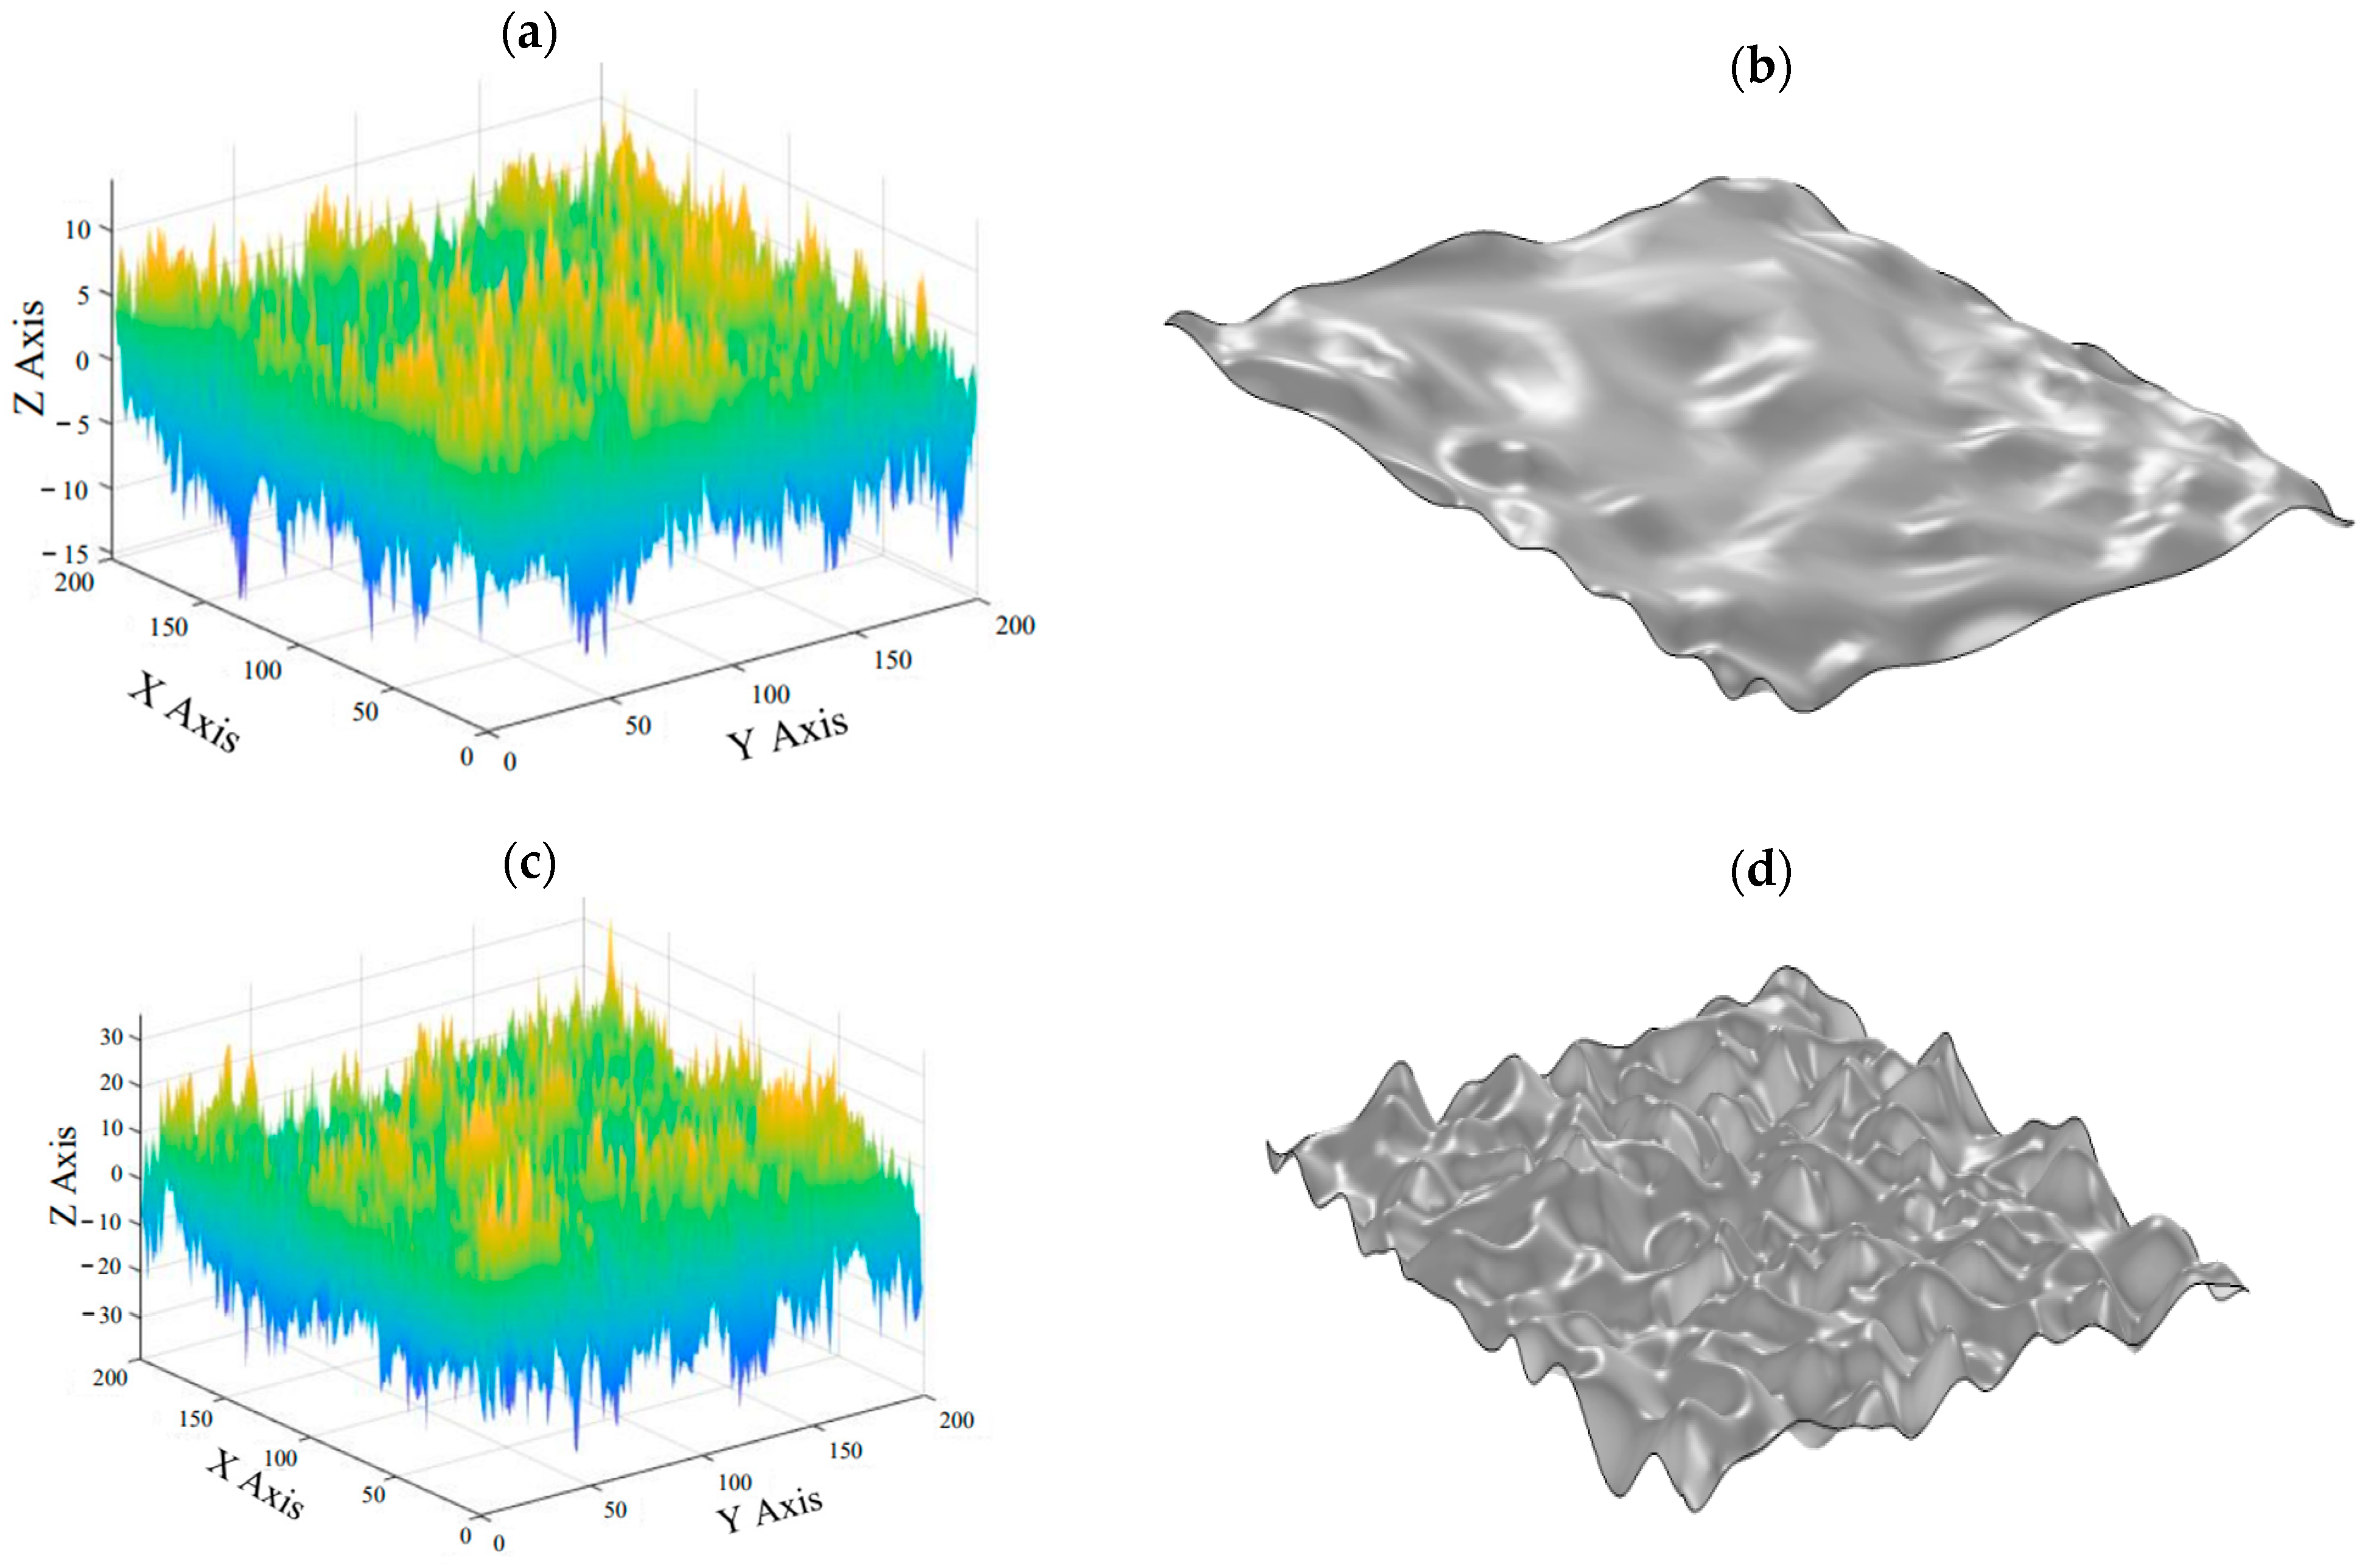
2.2. Three-Dimensional Surface Modeling and Analysis of Gaussian-Distributed Rough Surfaces
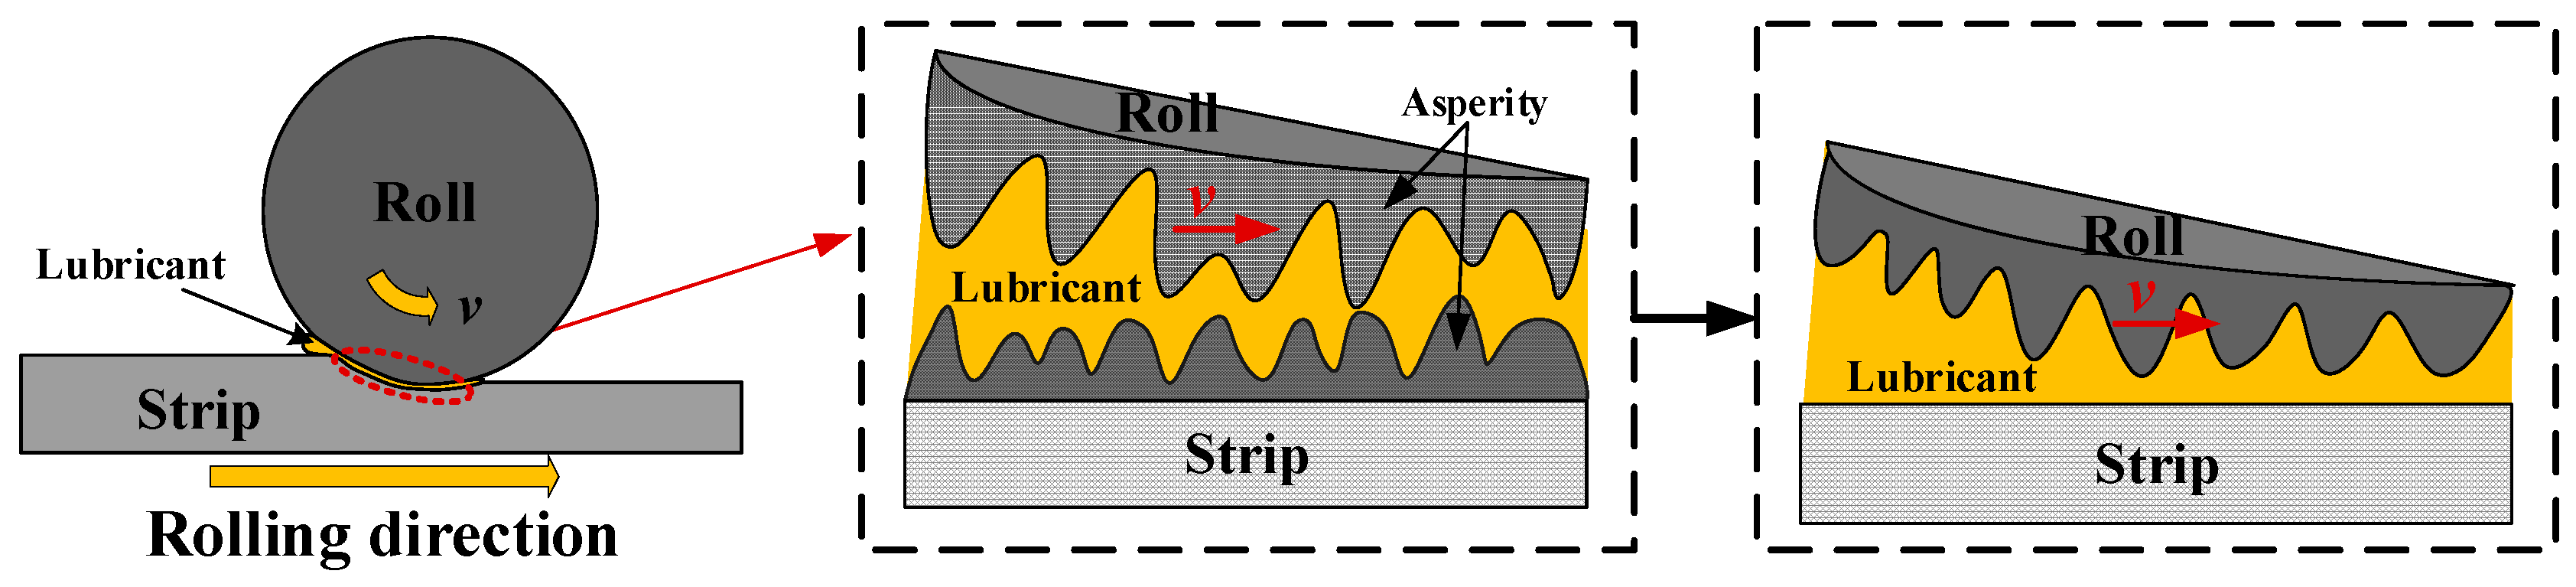
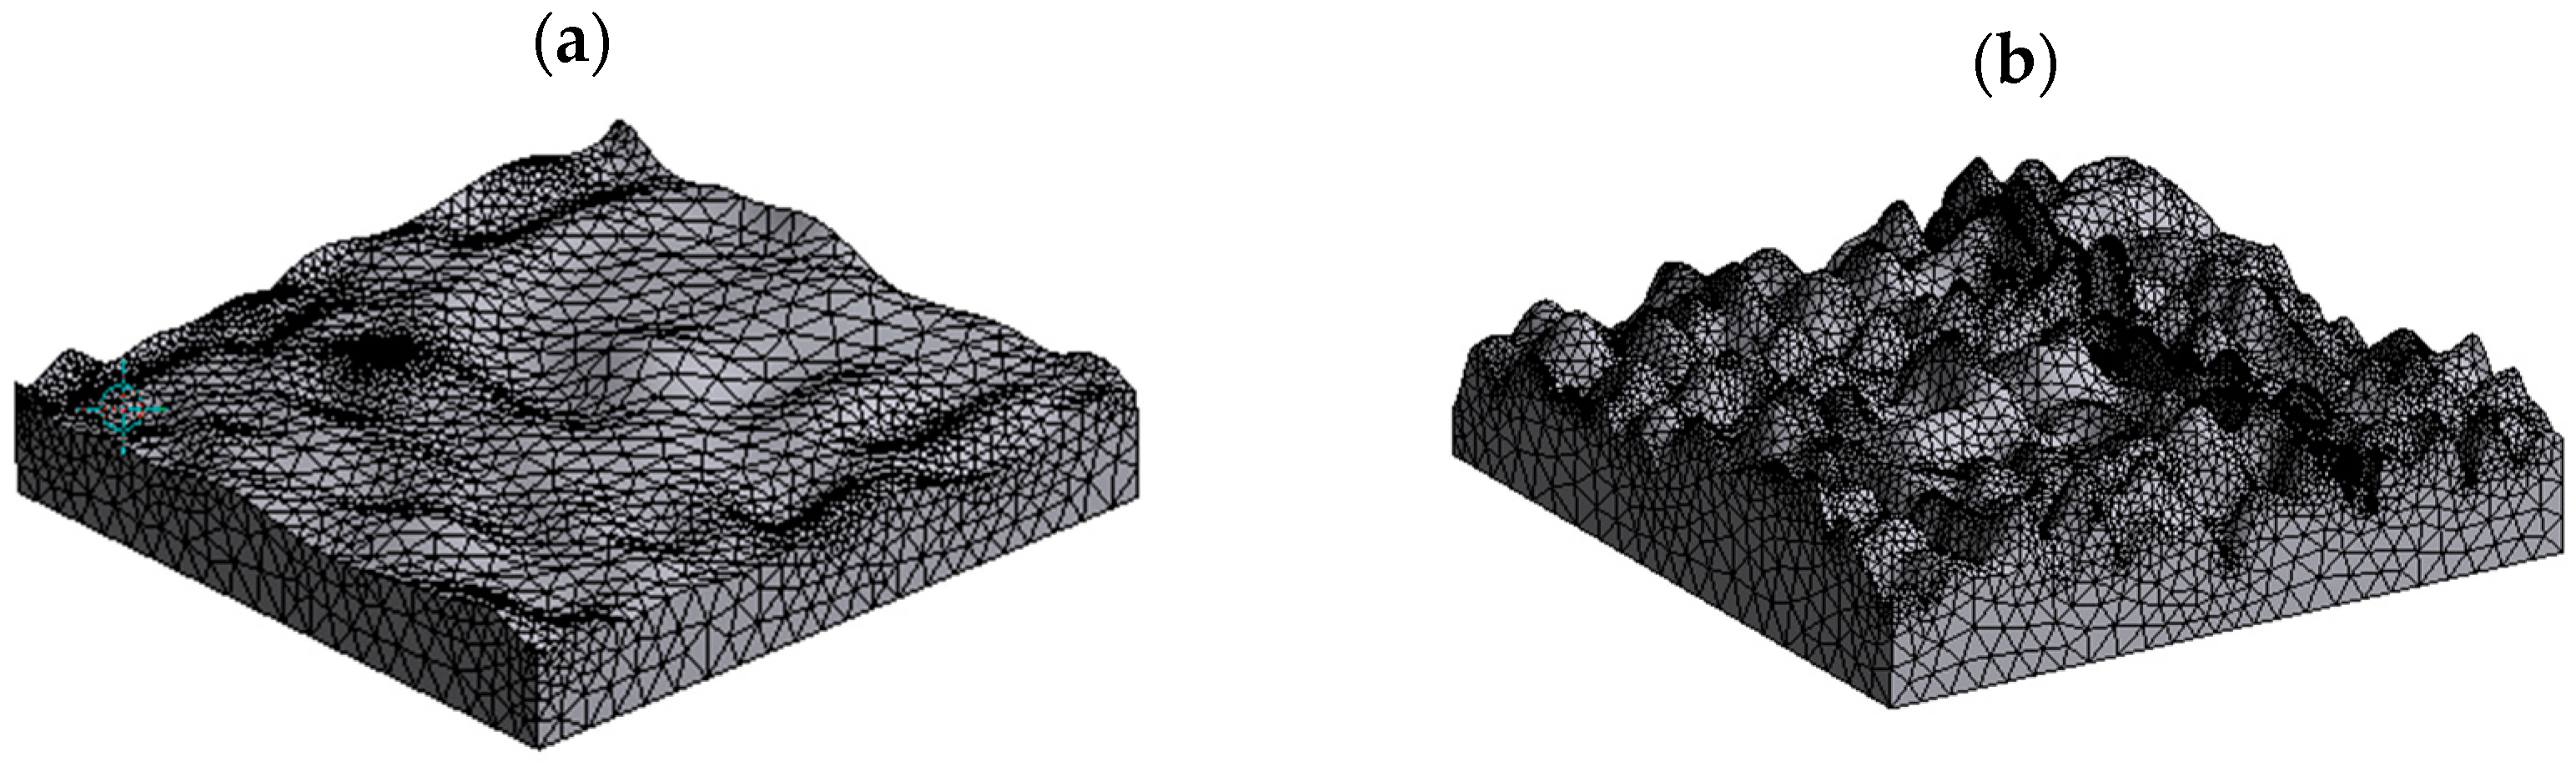
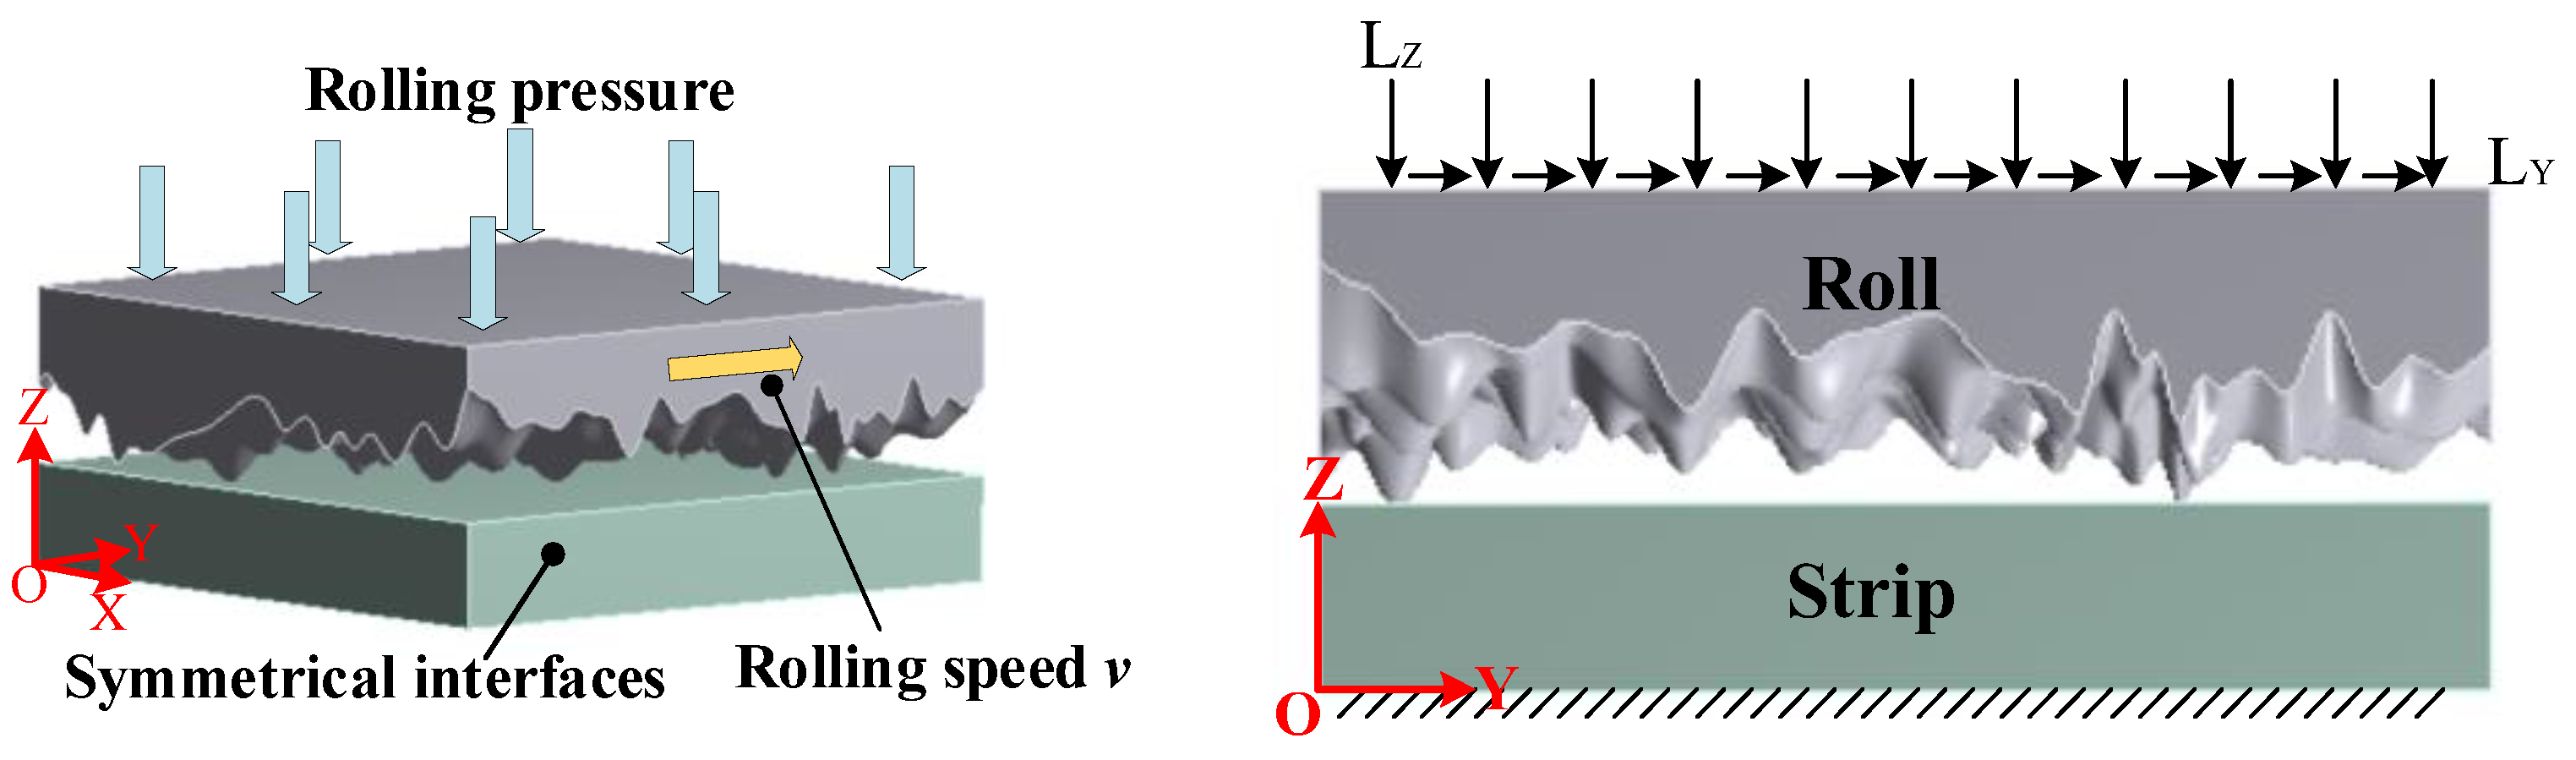
2.3. Establishment and Analysis of Calculation Model for Rolling Interface
3. Simulation Process
3.1. Performance Parameters of Materials
3.2. Boundary Conditions of Dry Friction Model
3.3. Boundary Conditions of Mixed Lubrication Model
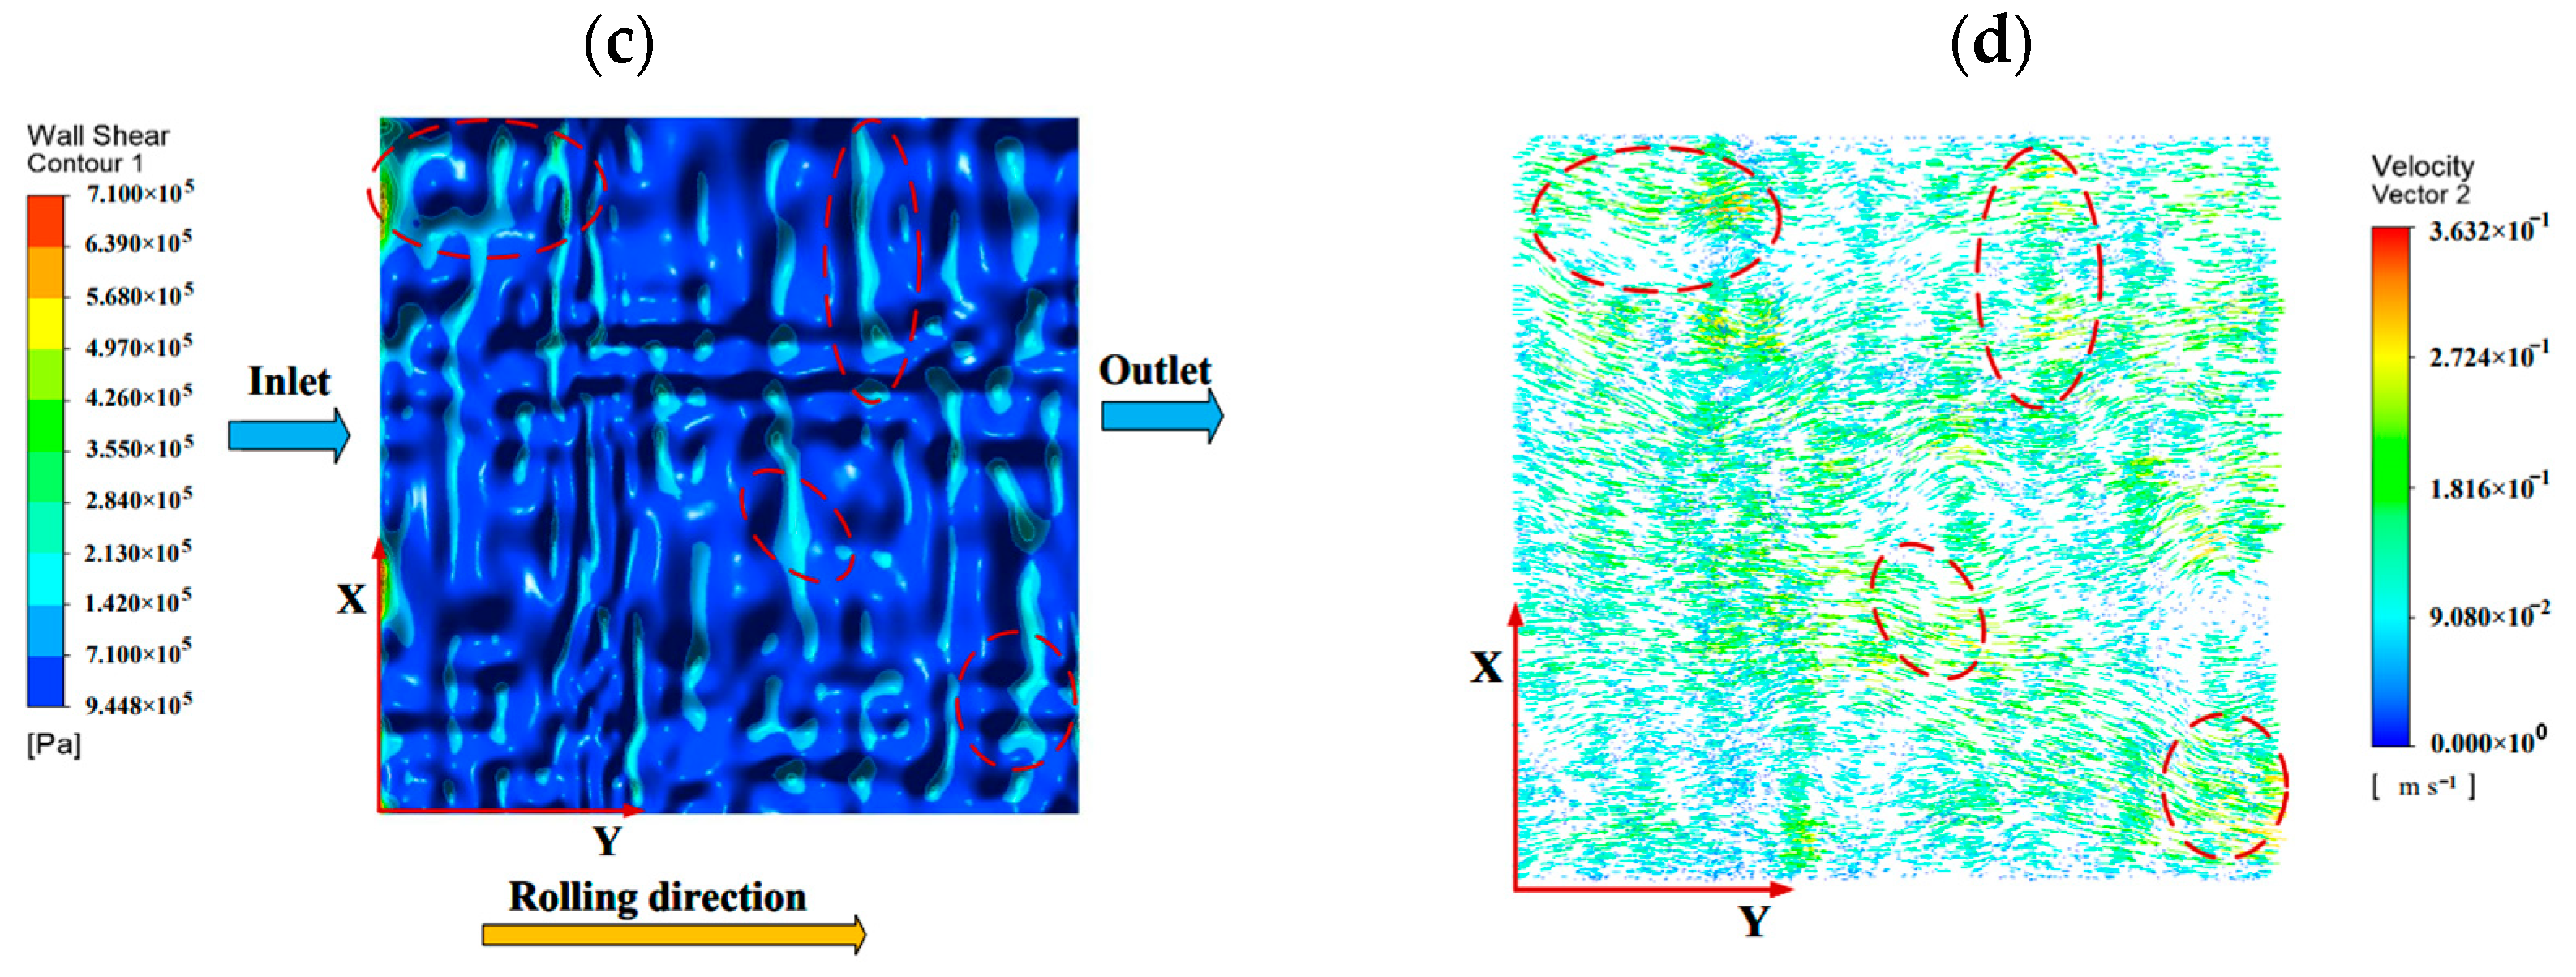
4. Result Analysis
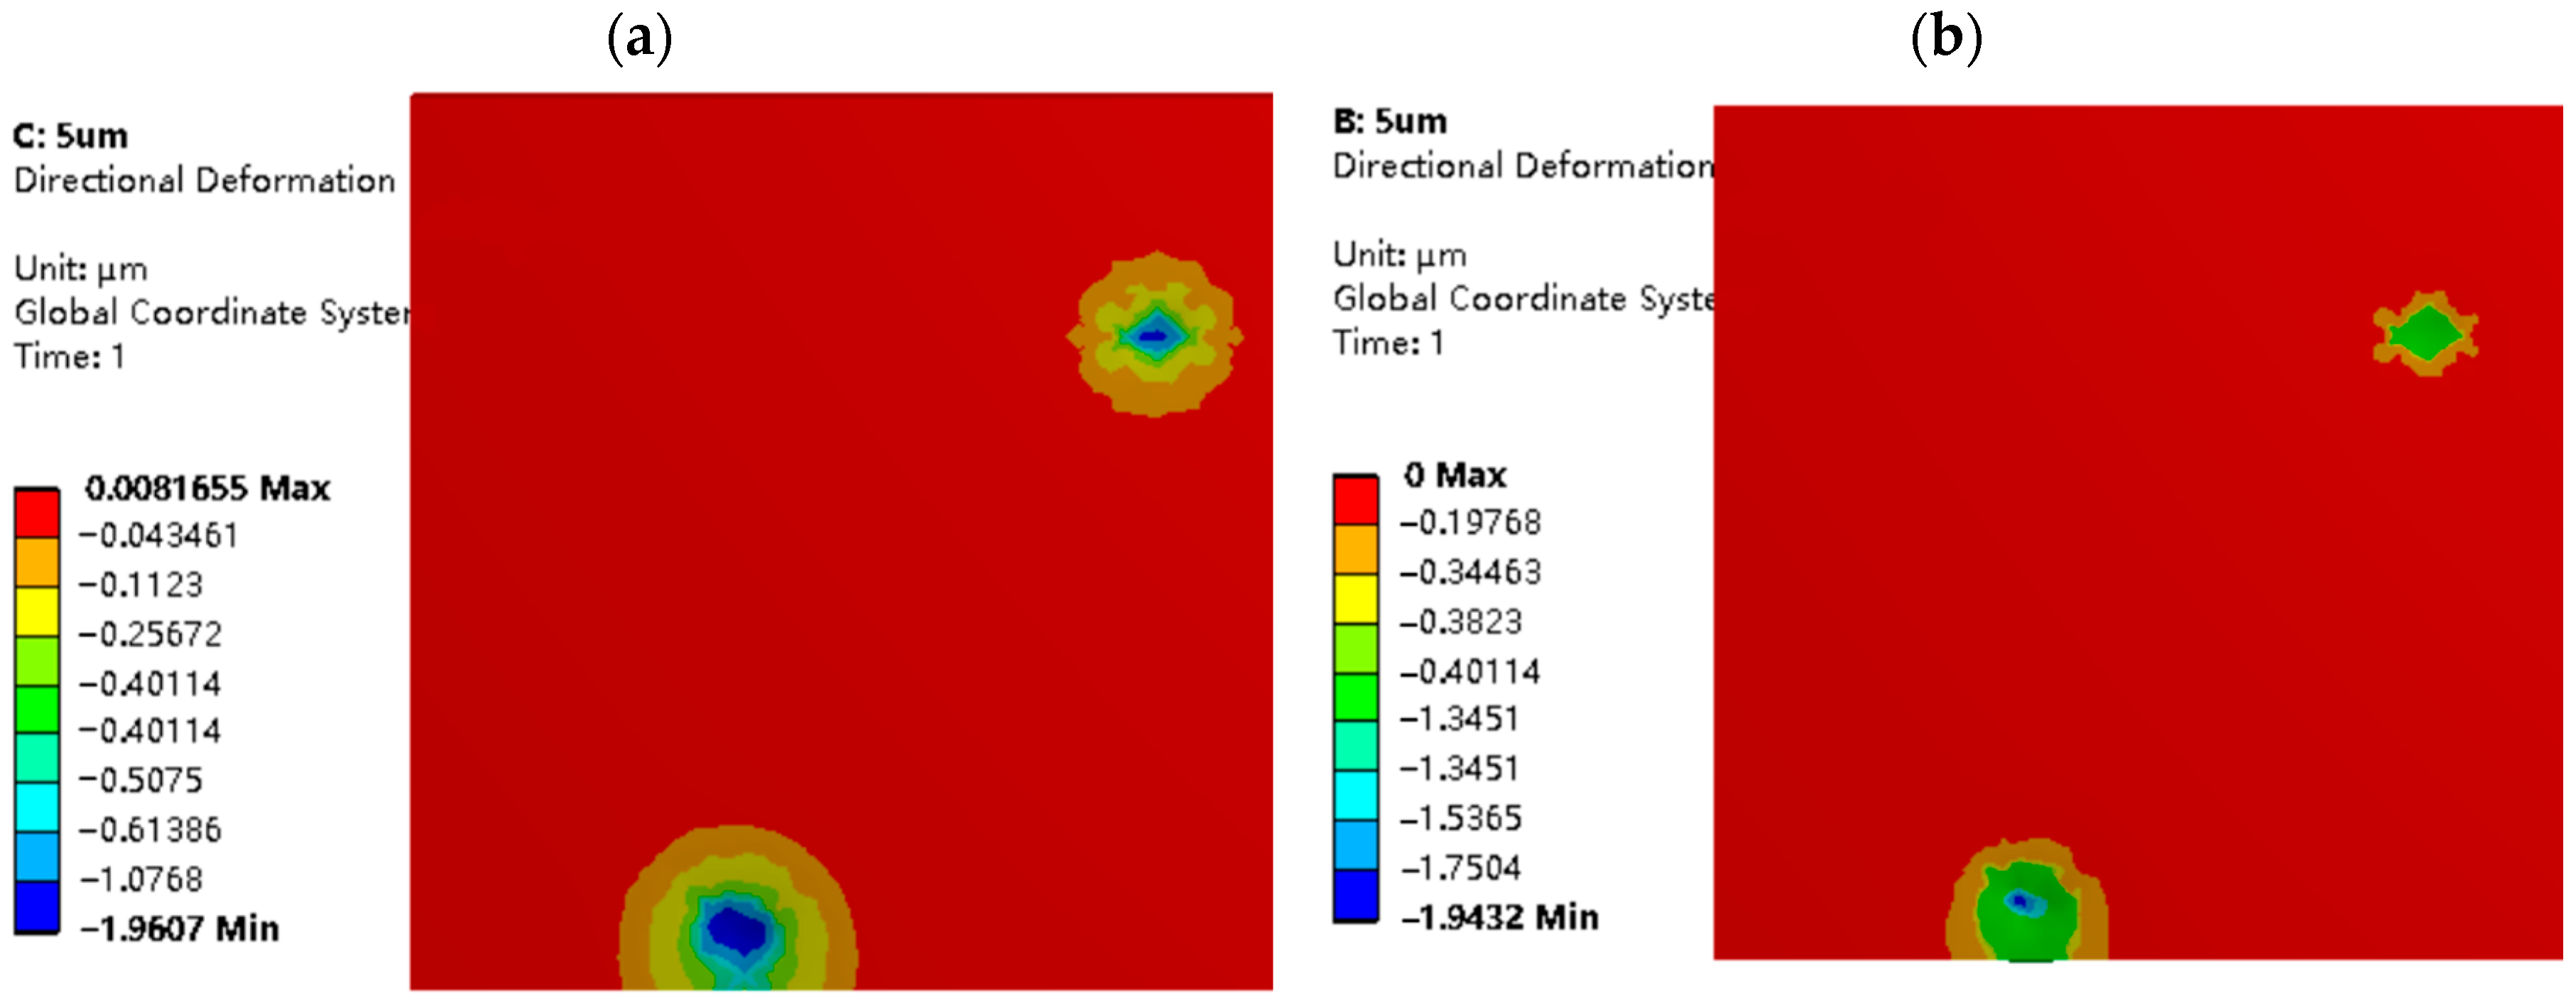
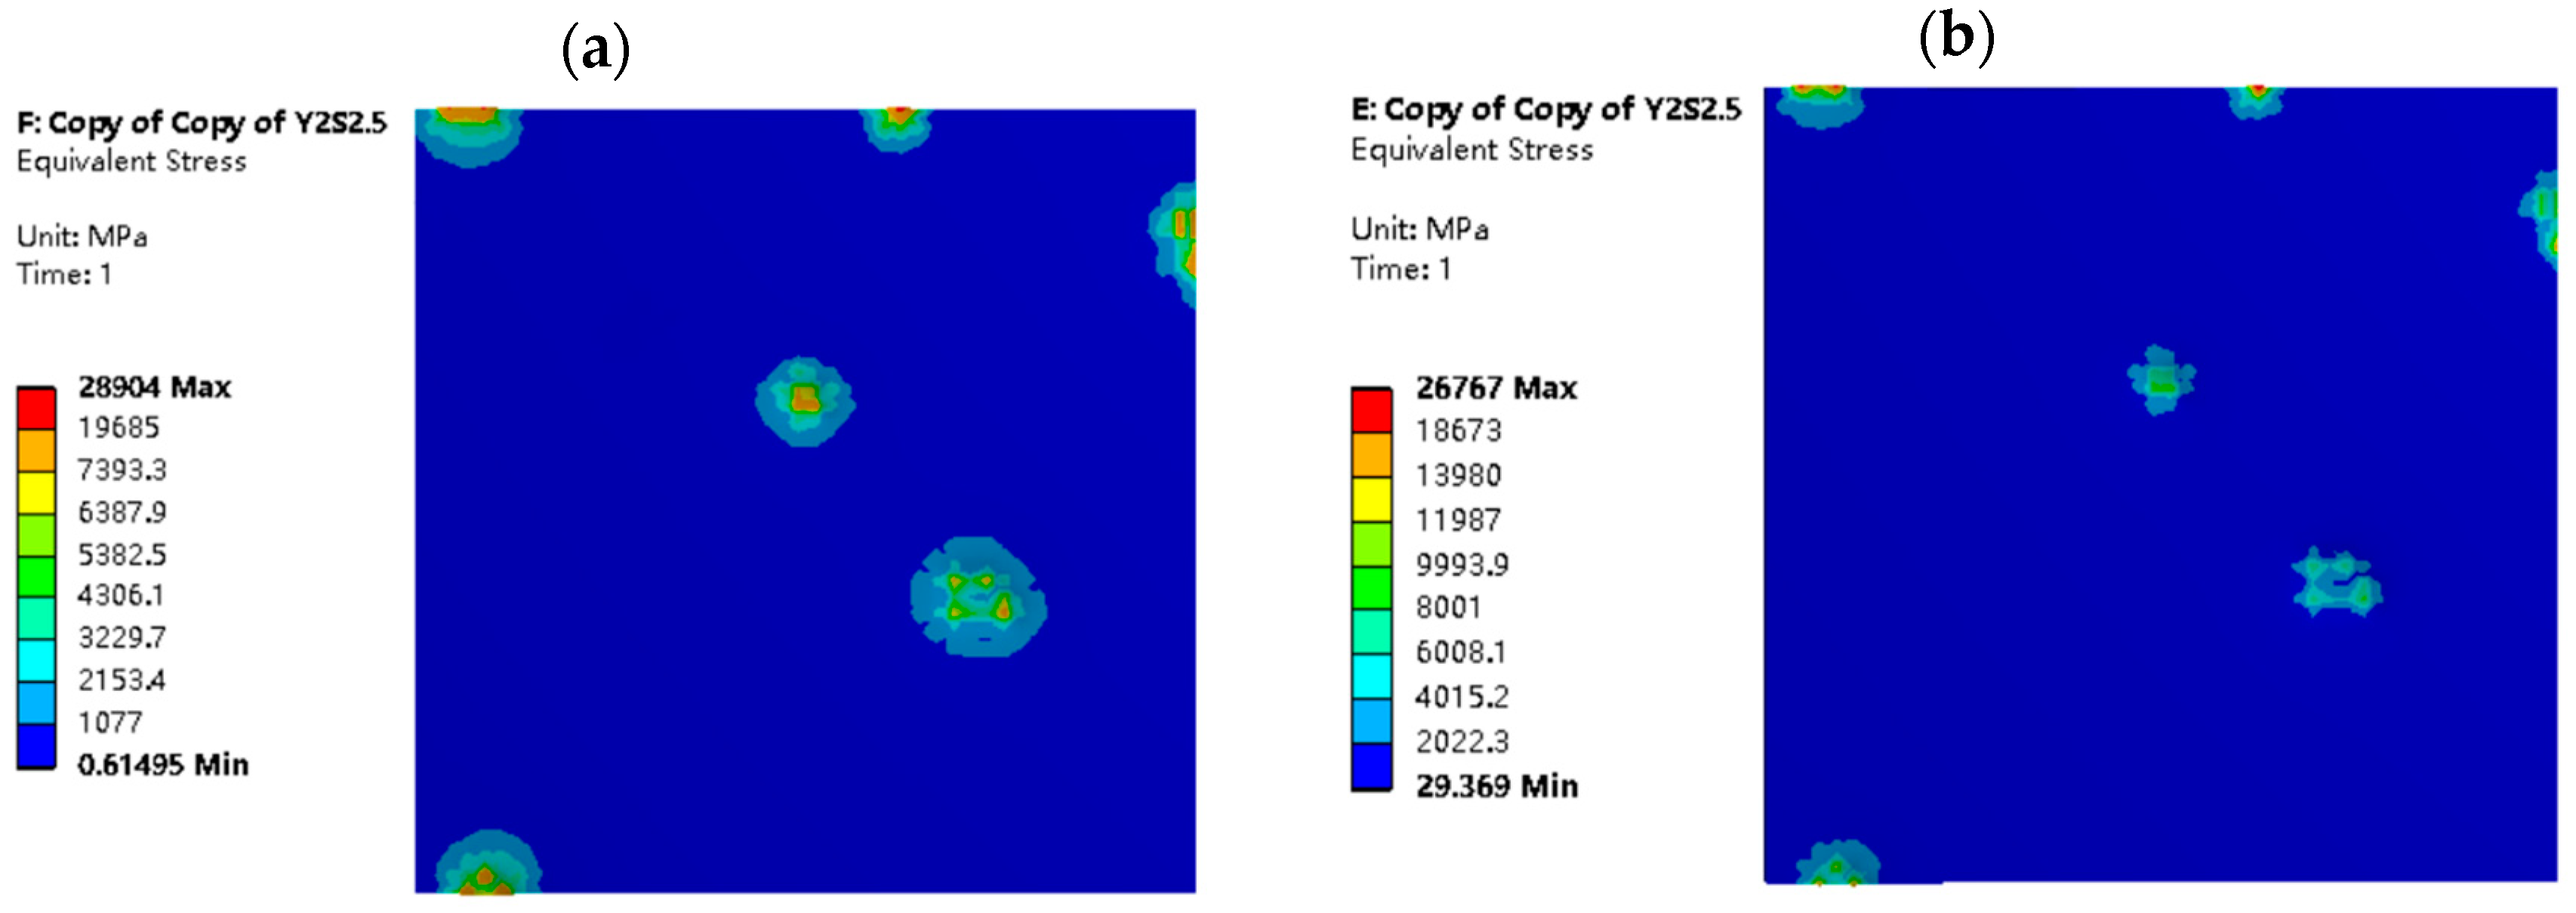
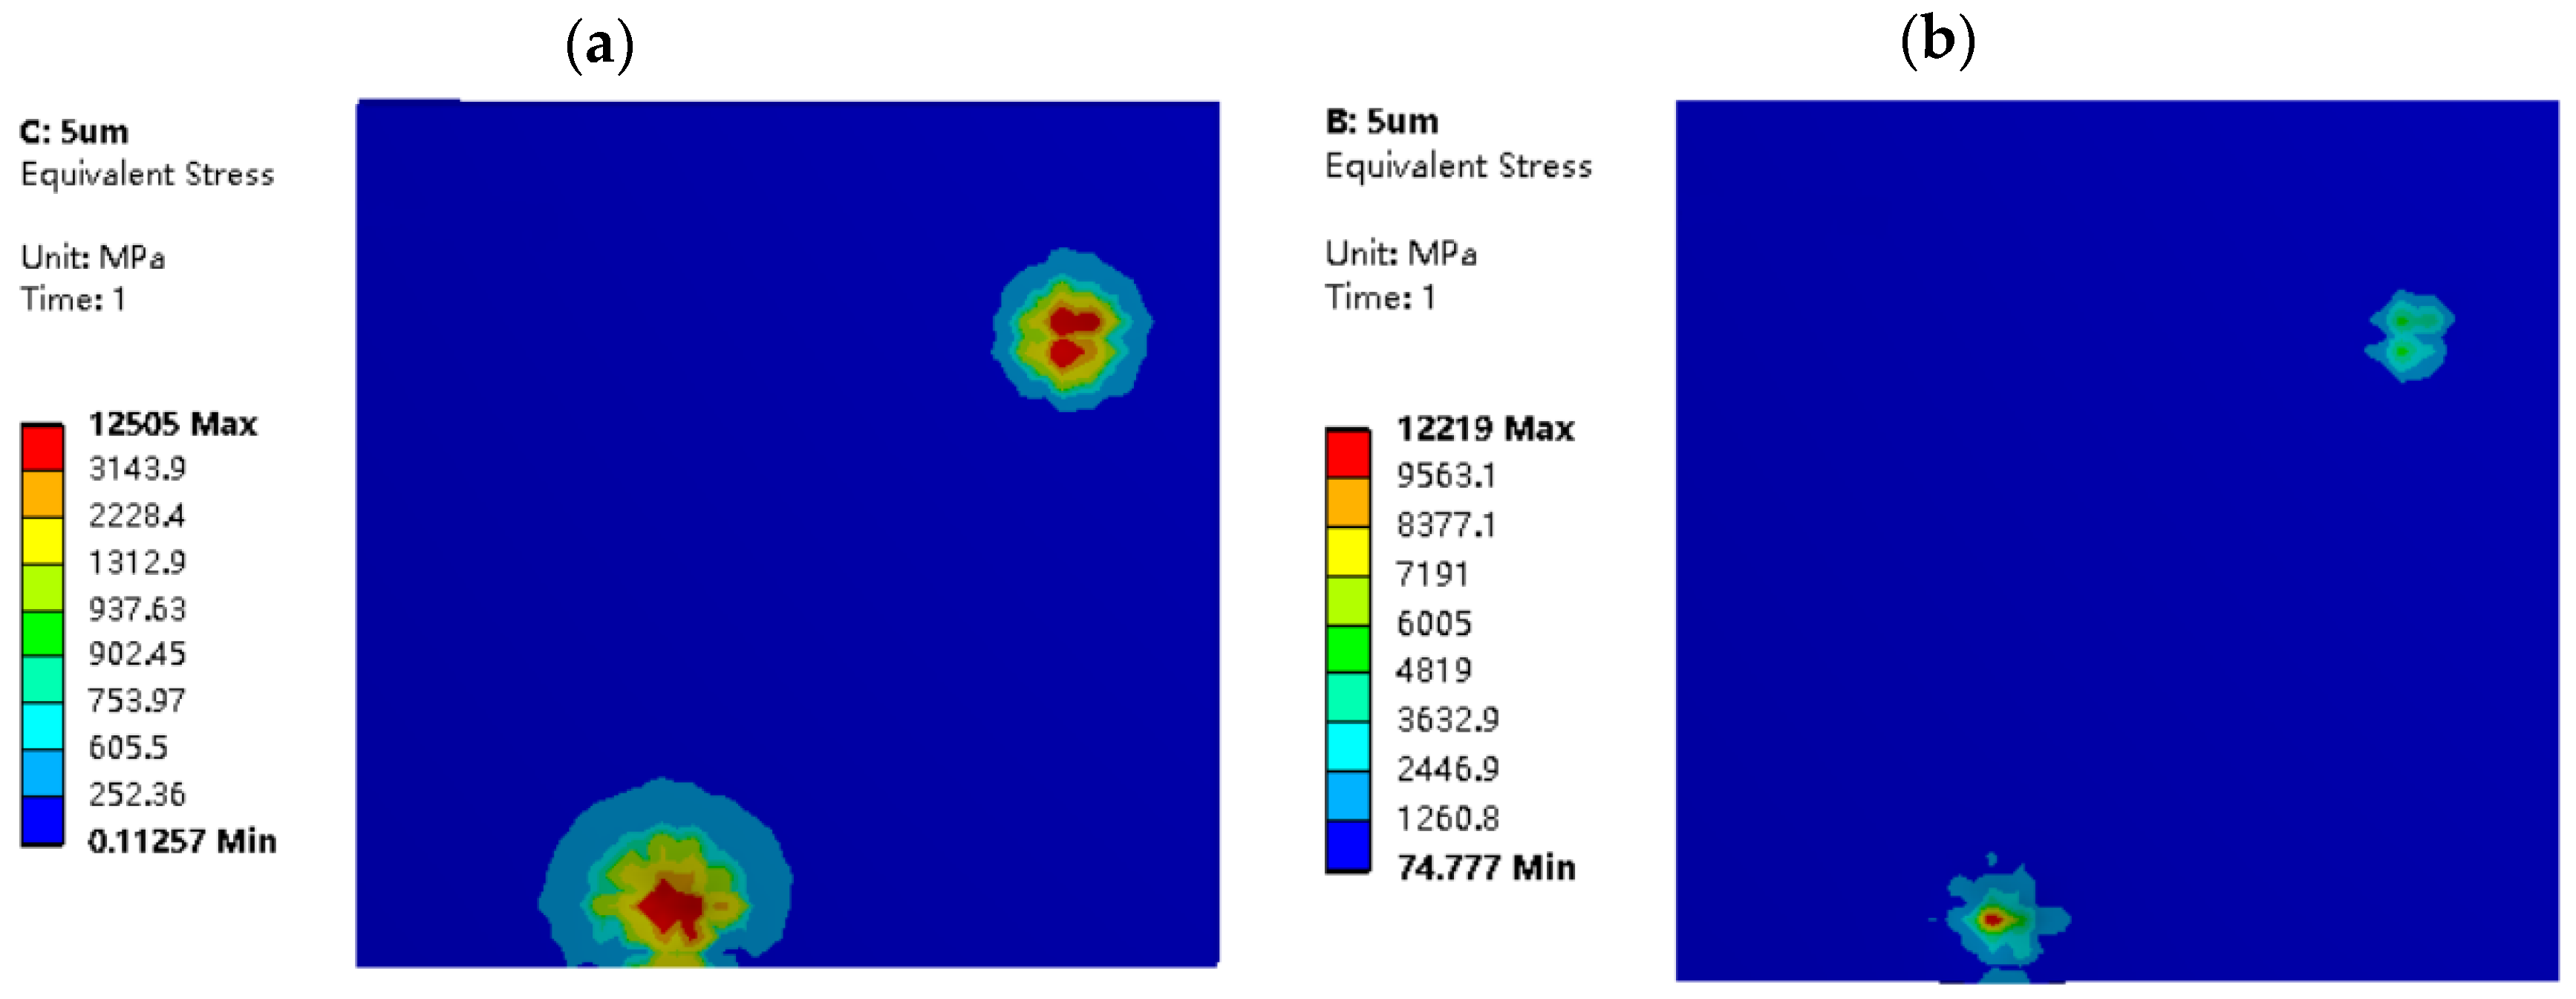
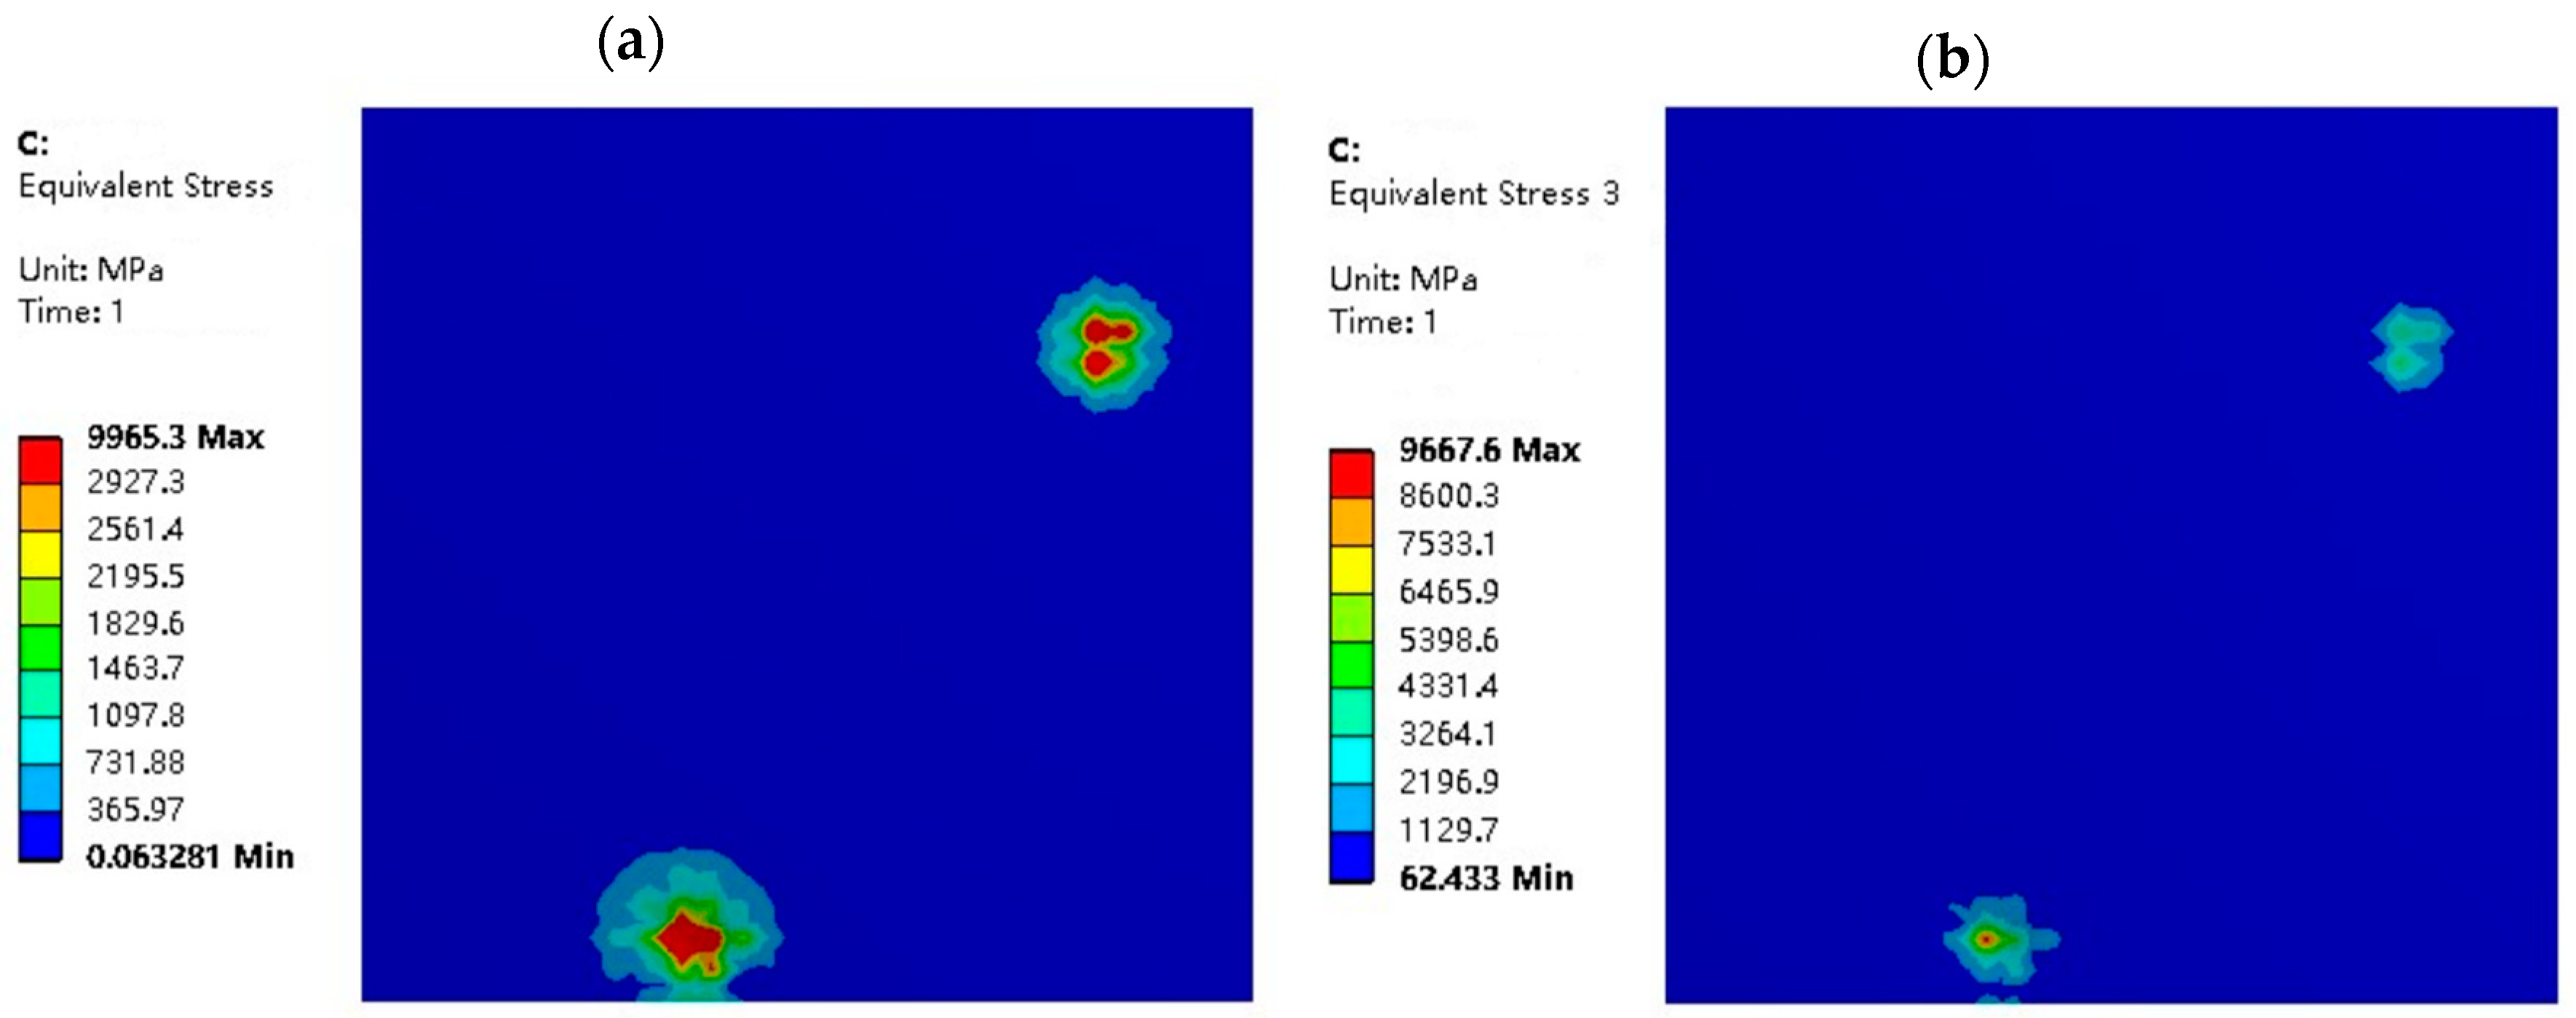
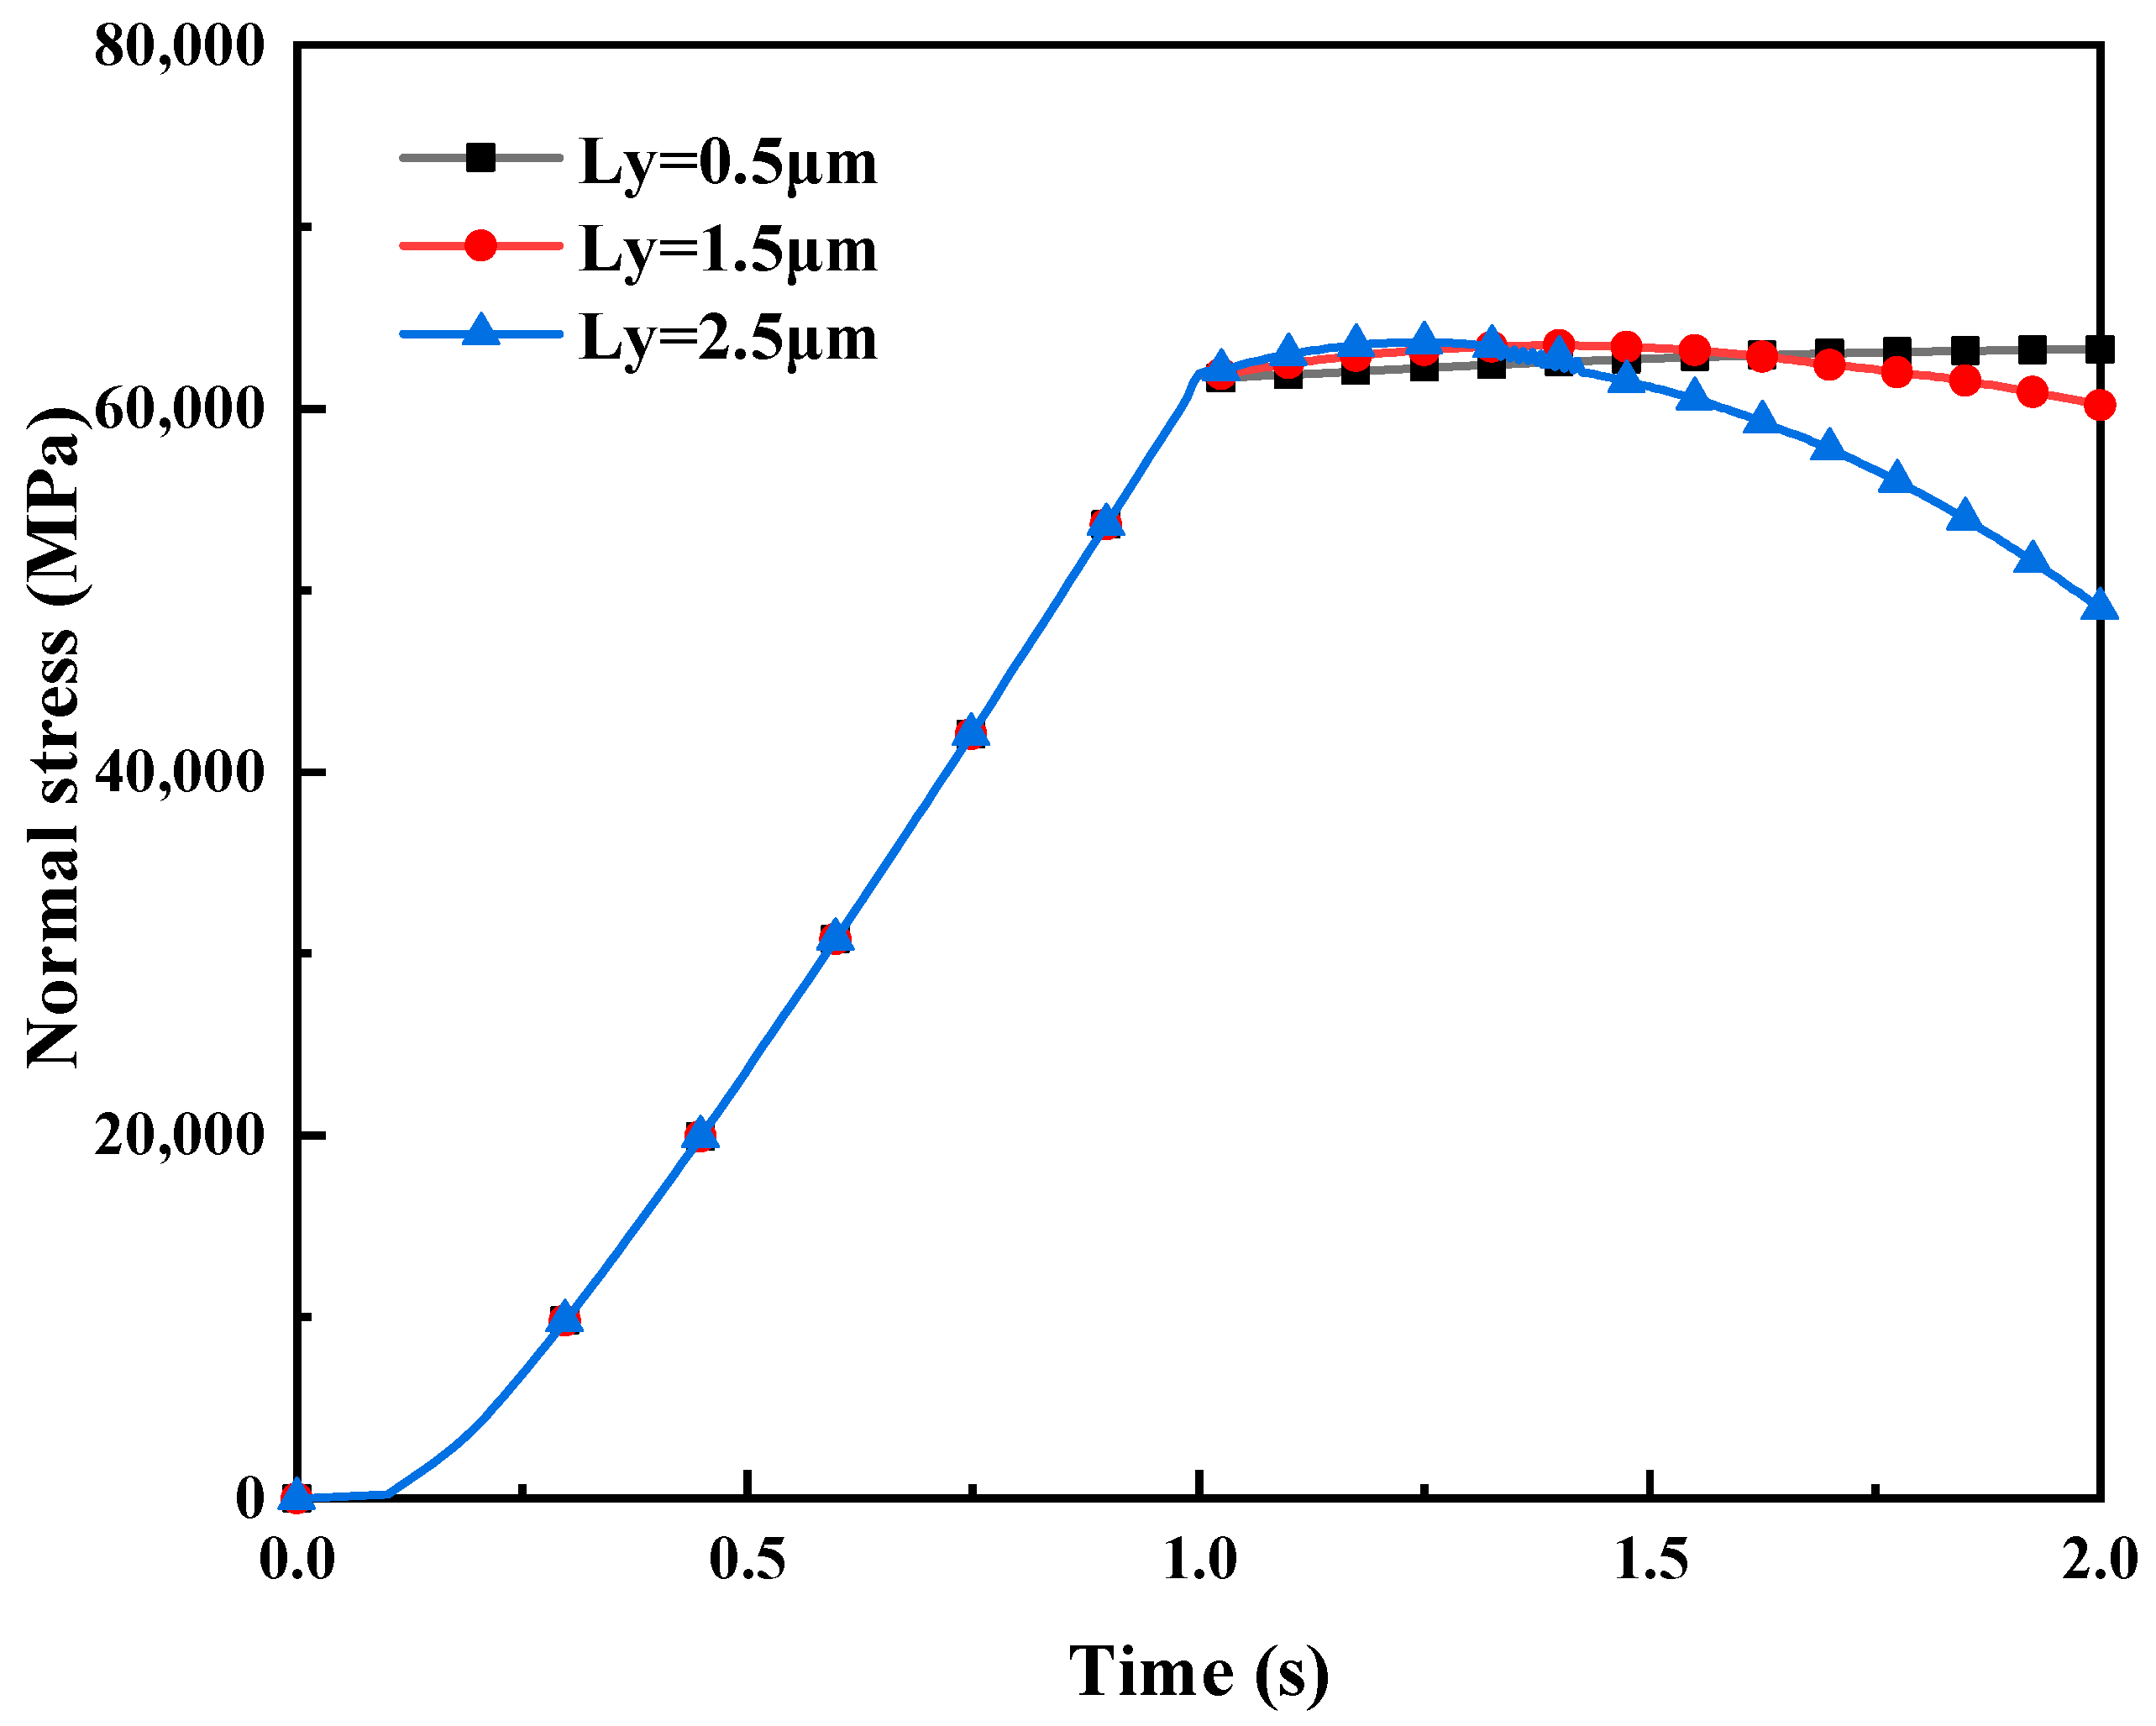
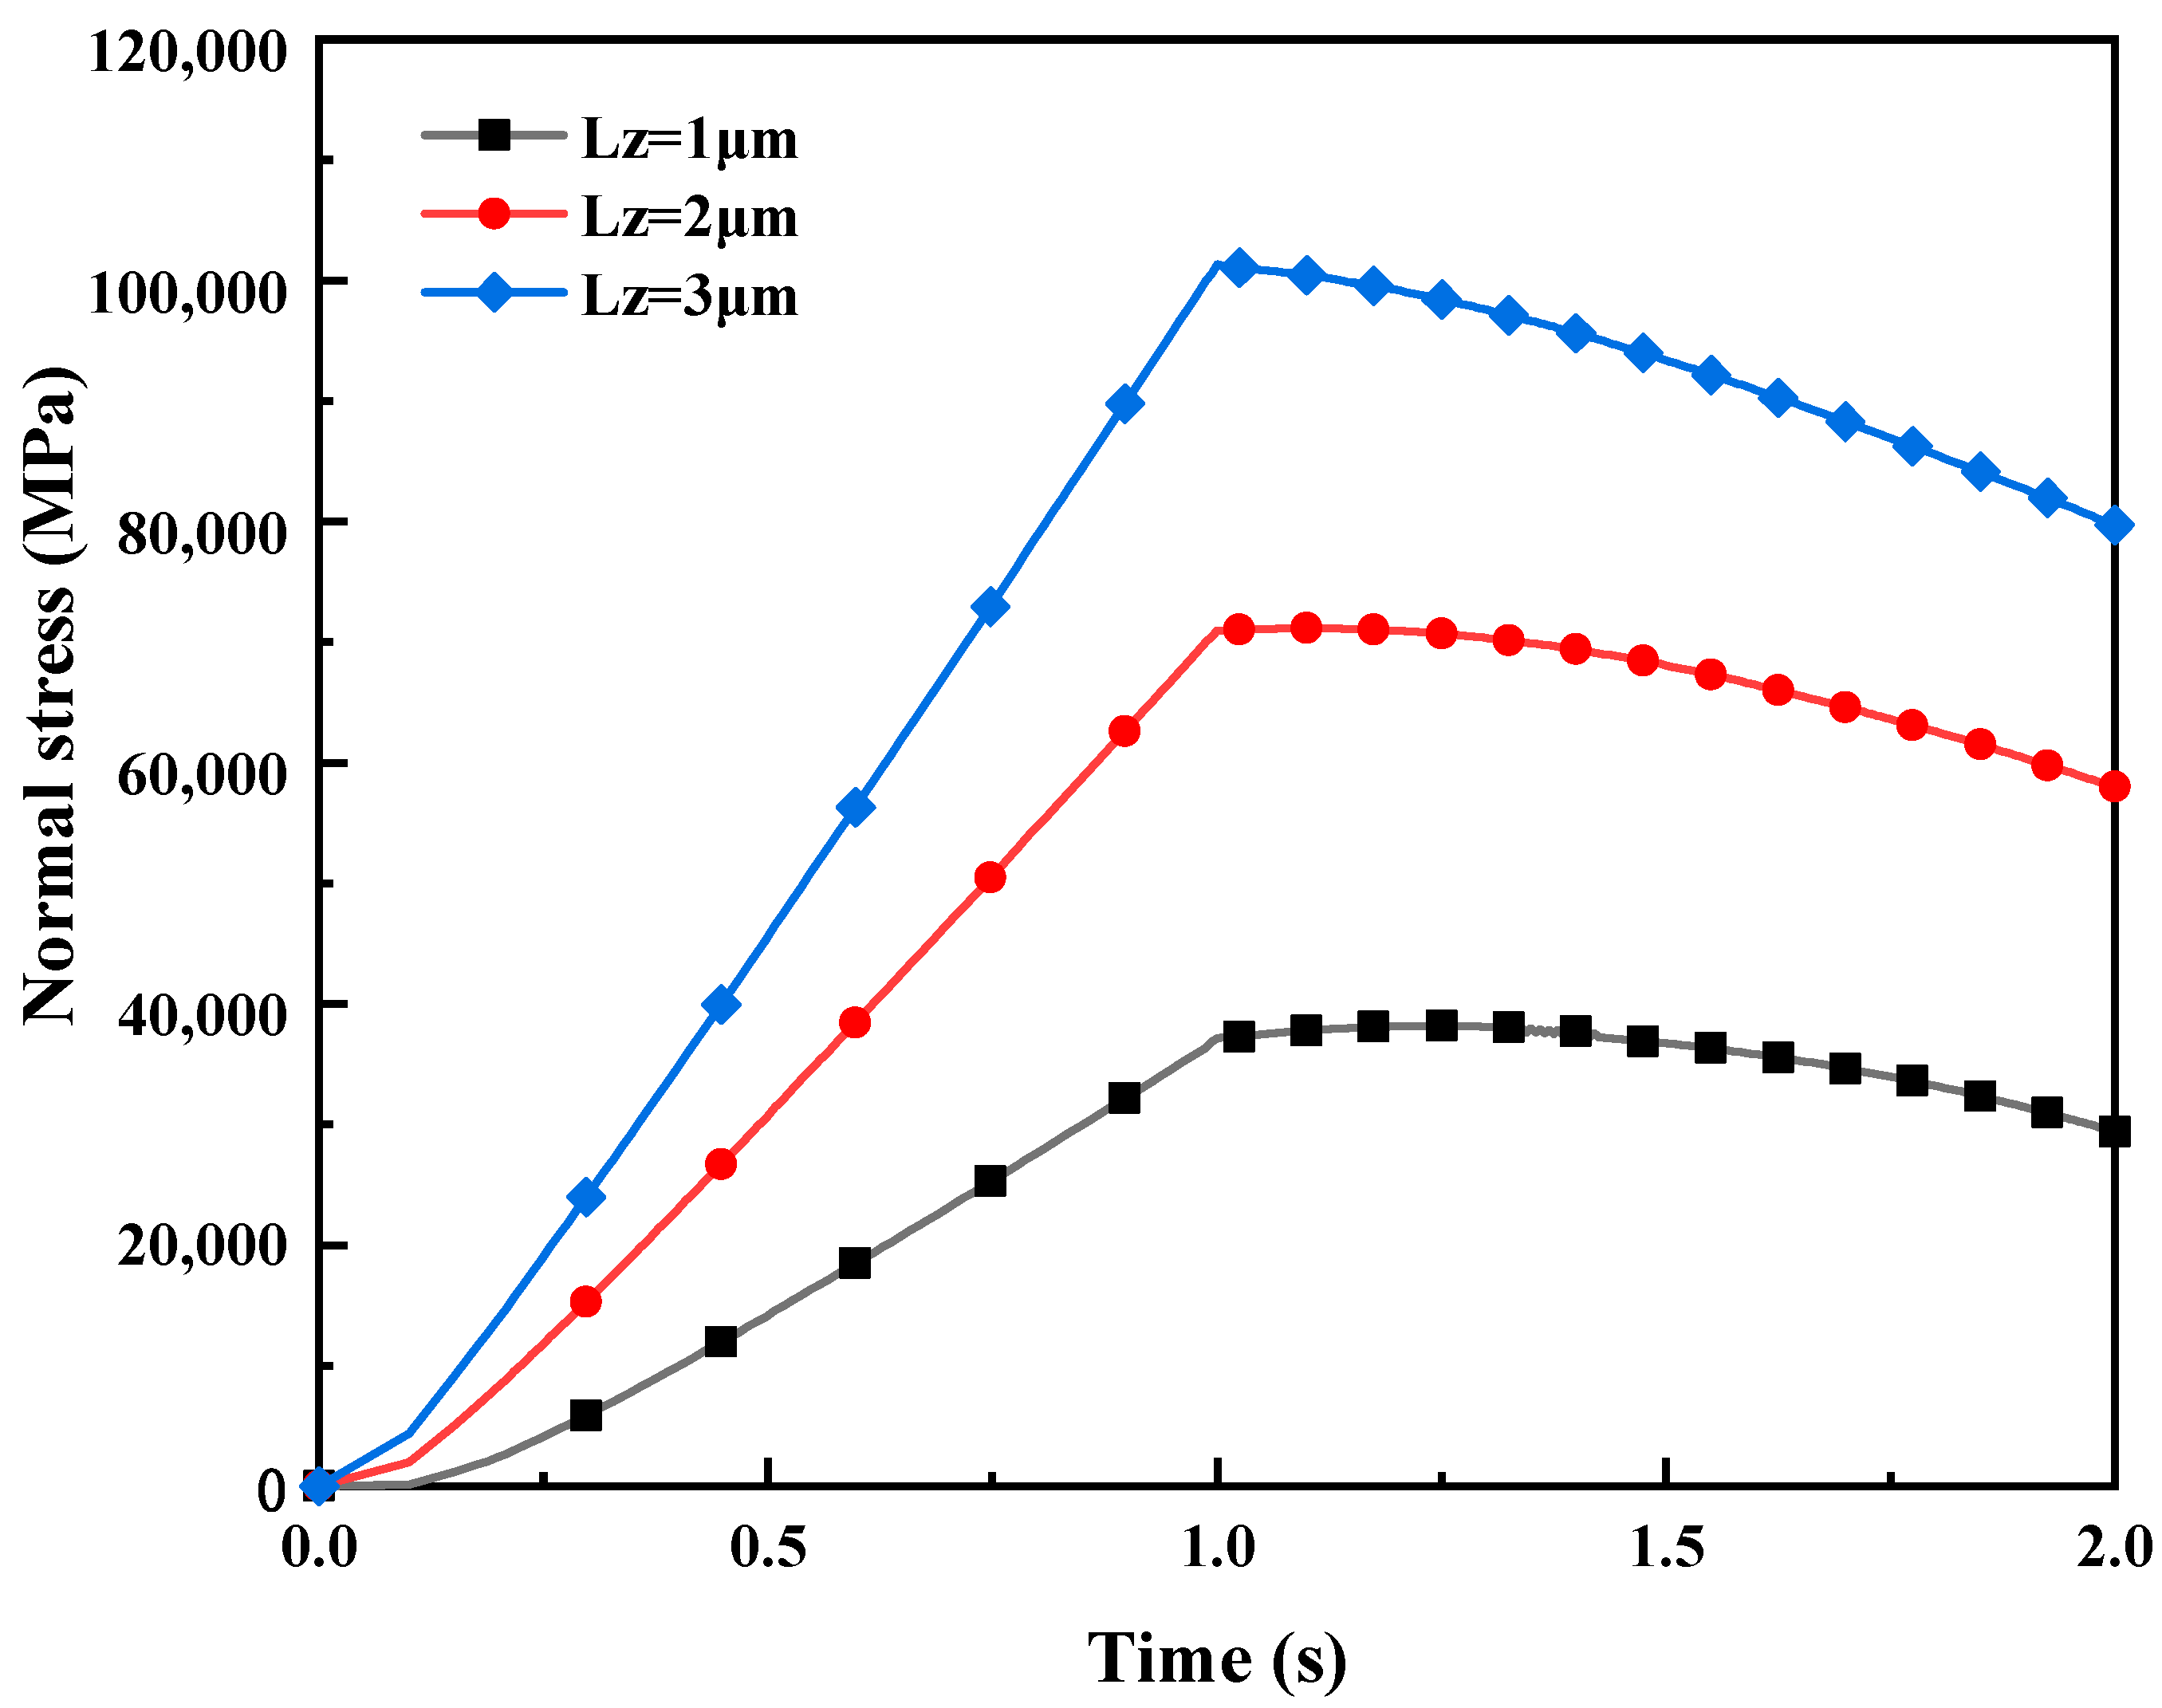
4.1. Normal Contact
4.2. Tangential Sliding
5. Conclusions
- The lubricating oil film in the rolling interface plays a crucial role in reducing direct contact with micro-asperities, decreasing the friction, balancing the load, and suppressing uneven deformation of the strip. Therefore, when studying the rough contact conditions of the rolling interface at the micro scale, the effect of lubricating oil film cannot be ignored.
- The simulation results of different roughness models show that different roughness and rolling conditions significantly affect the normal contact and tangential sliding behavior of rough surface micro-asperities. In the same conditions, the surface with a lower roughness has a more uniform distribution of wave peaks and valleys, and the number of rough peaks participating in contact is more significant; also, the bearing capacity of the lubricating oil film between the interfaces is improved.
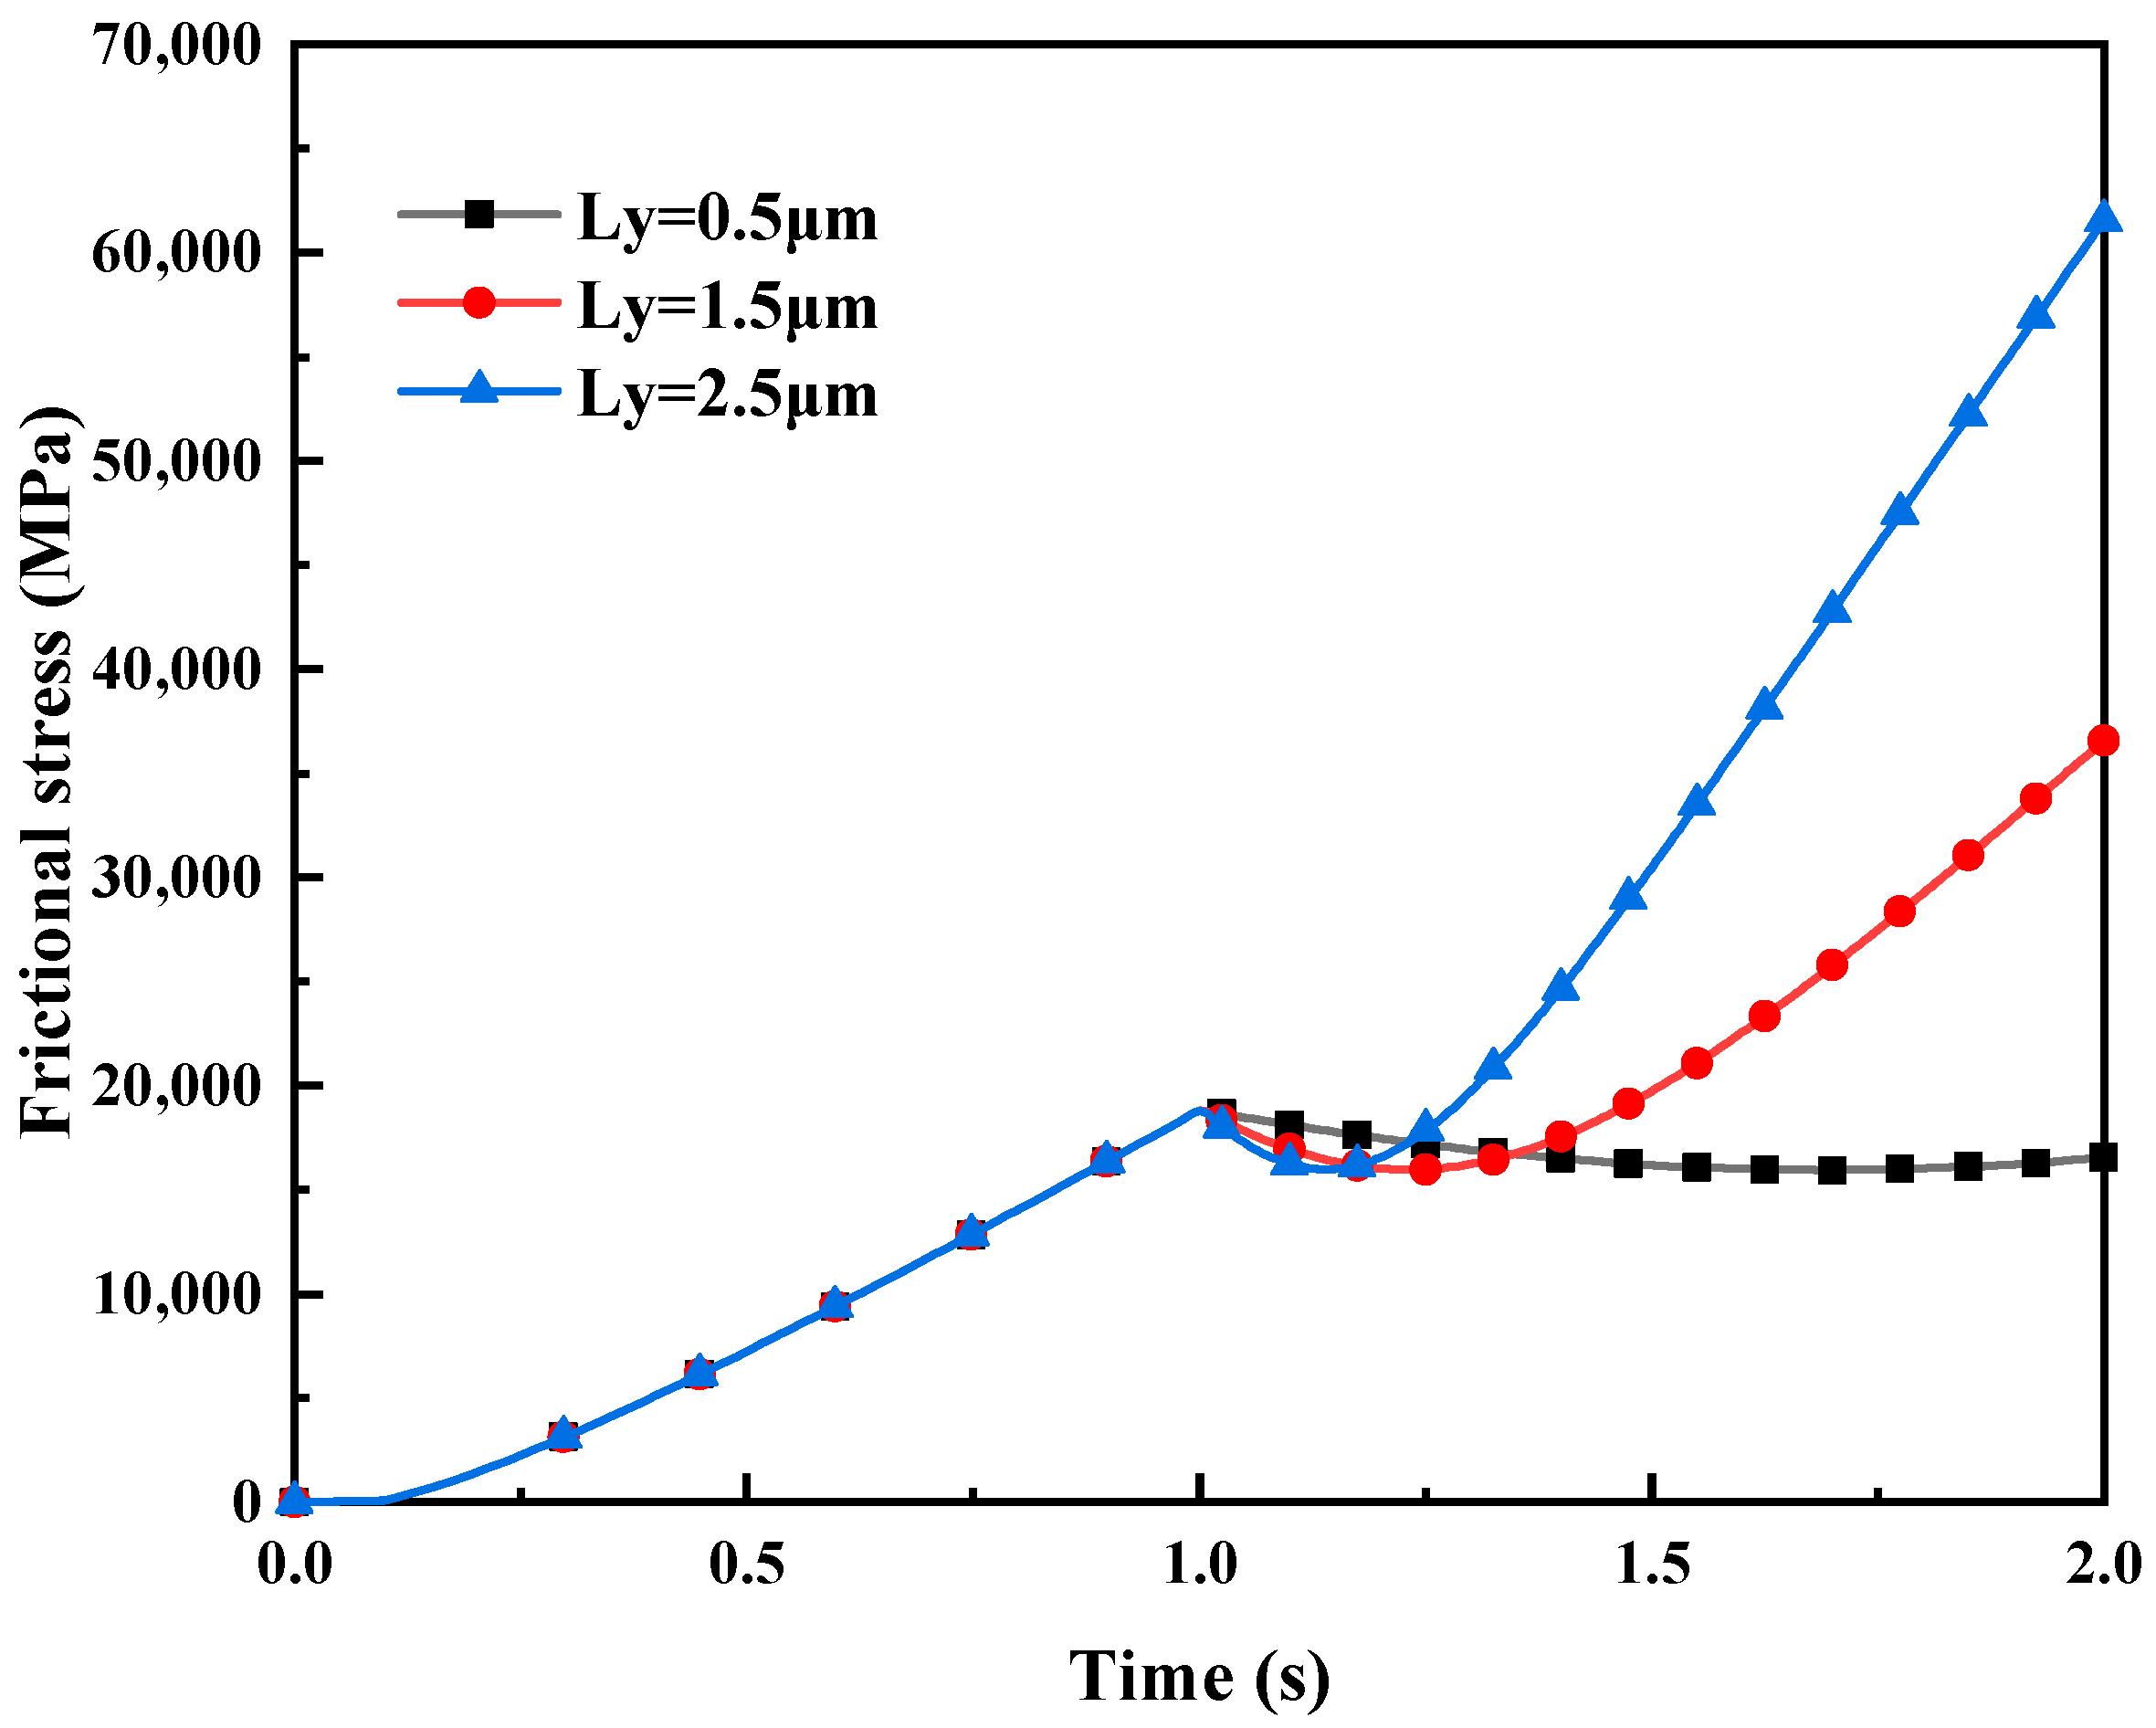
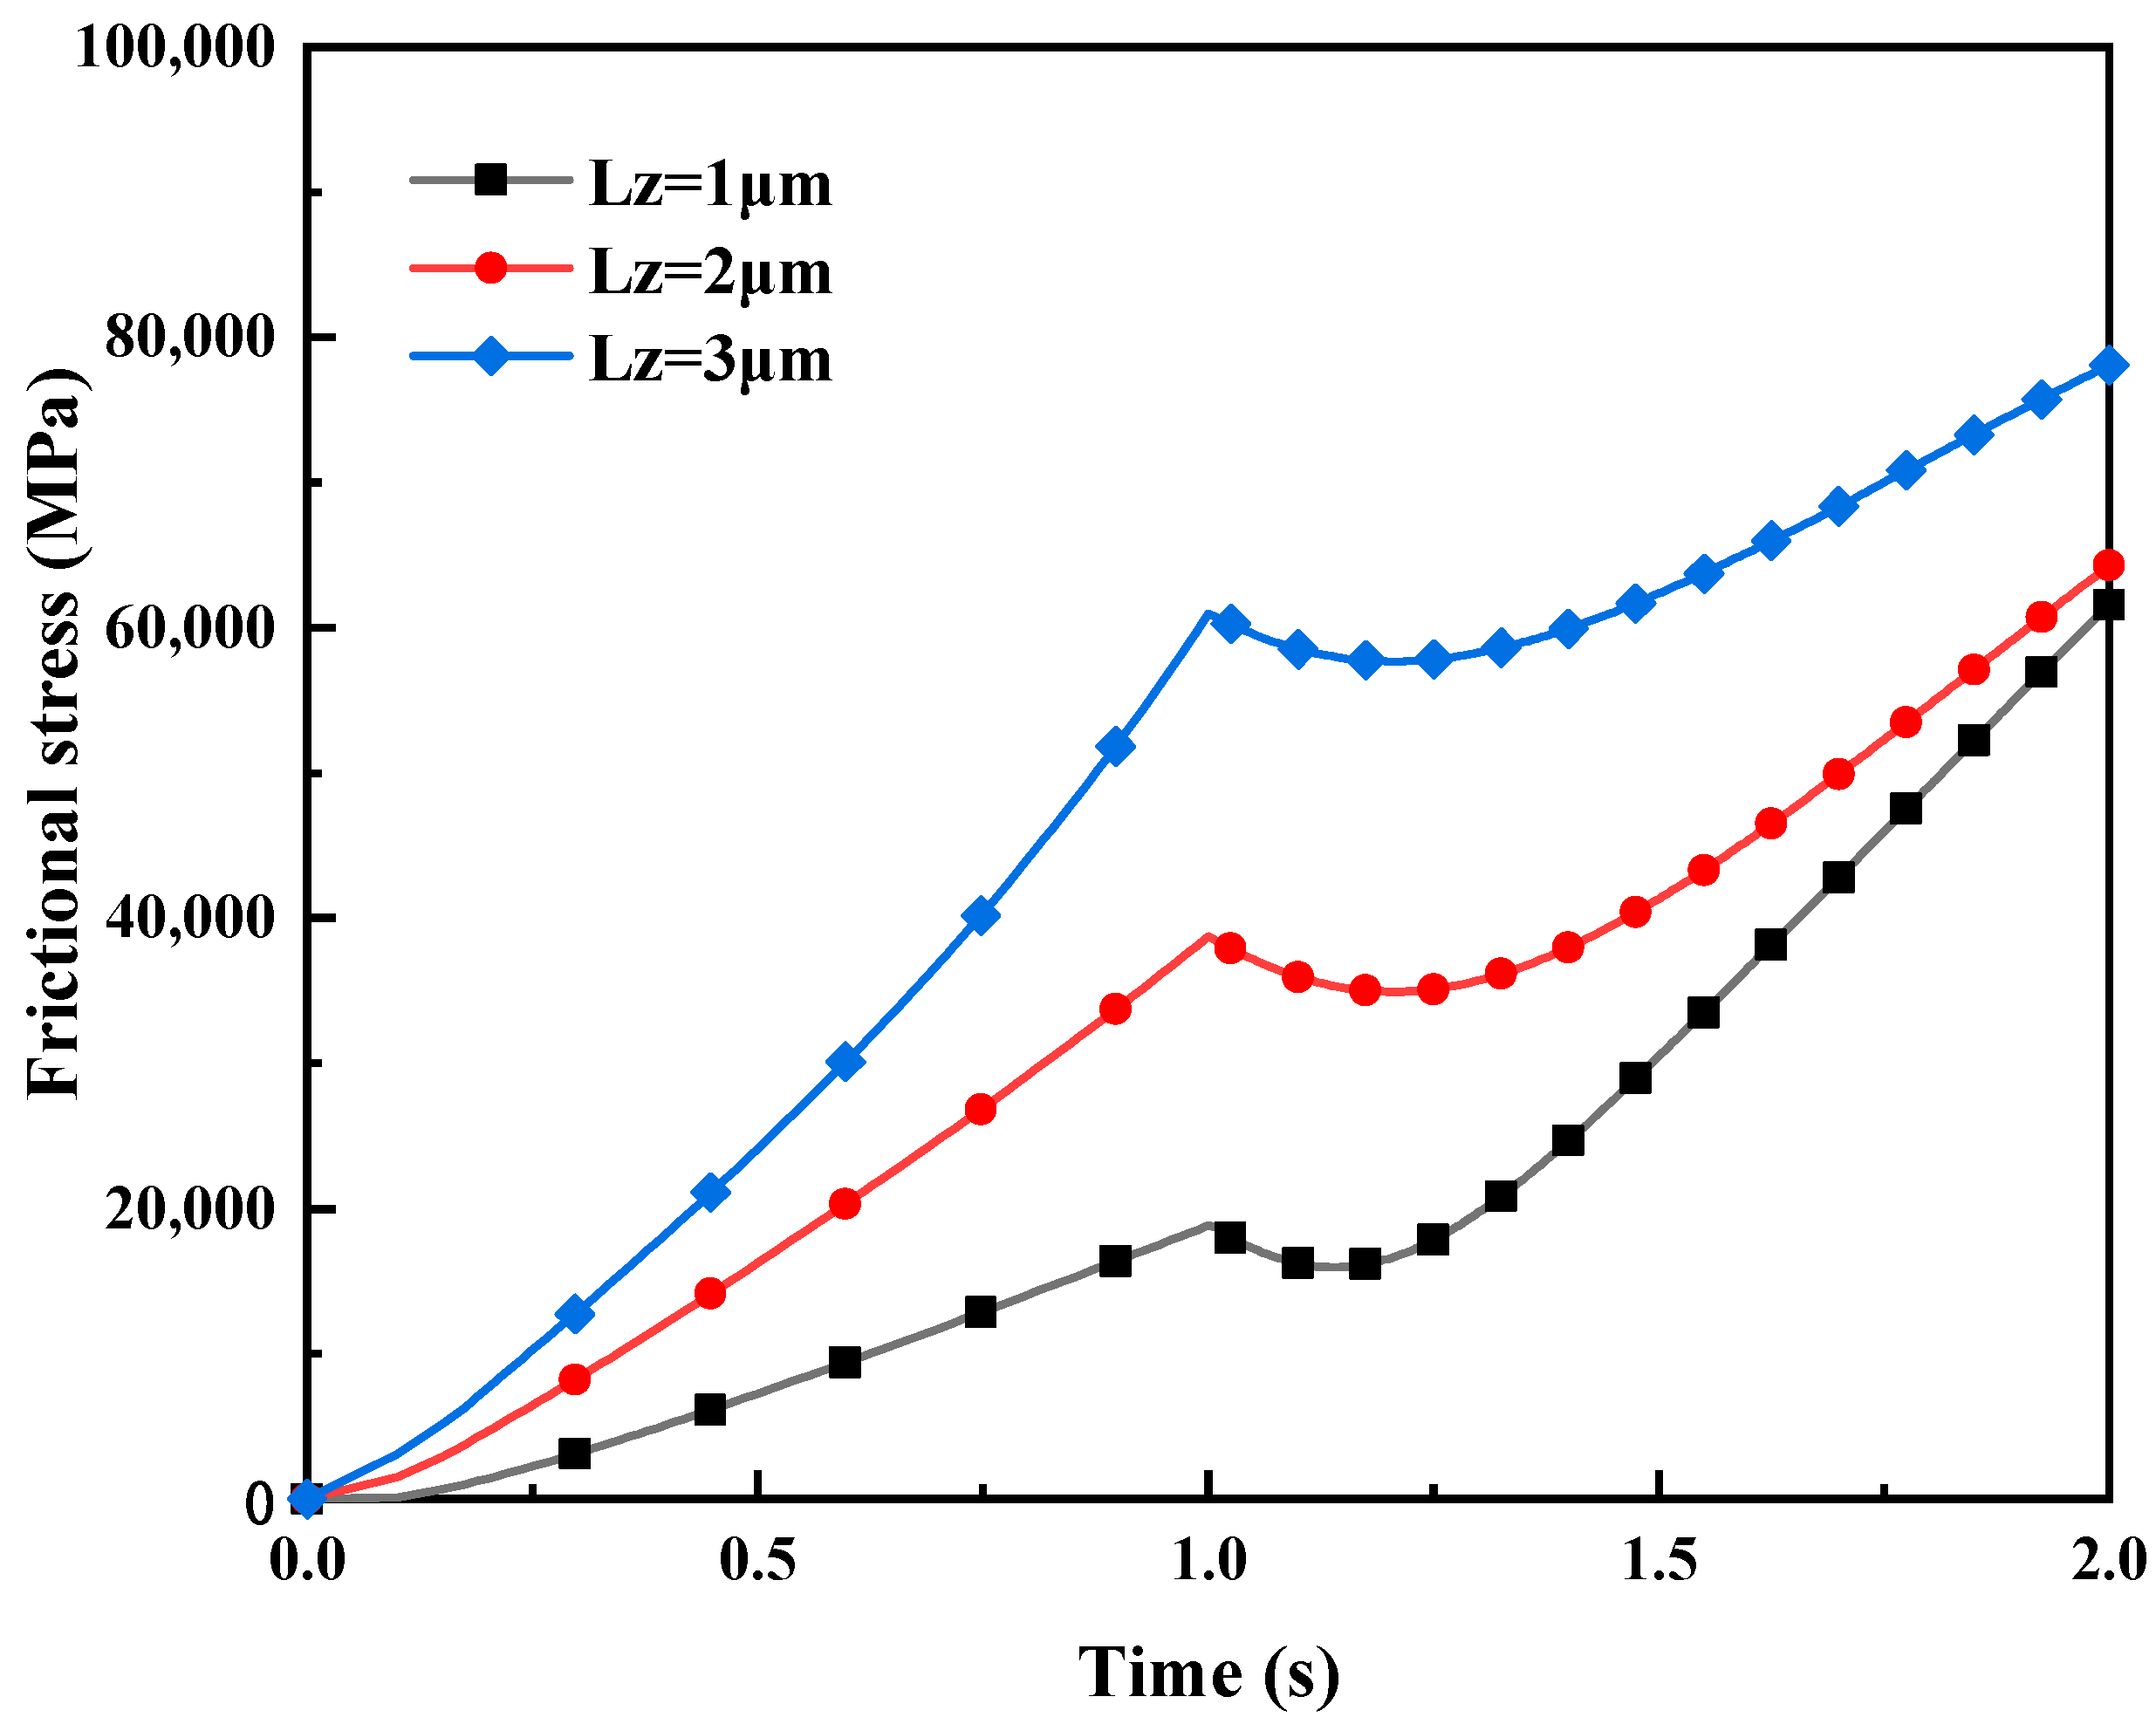
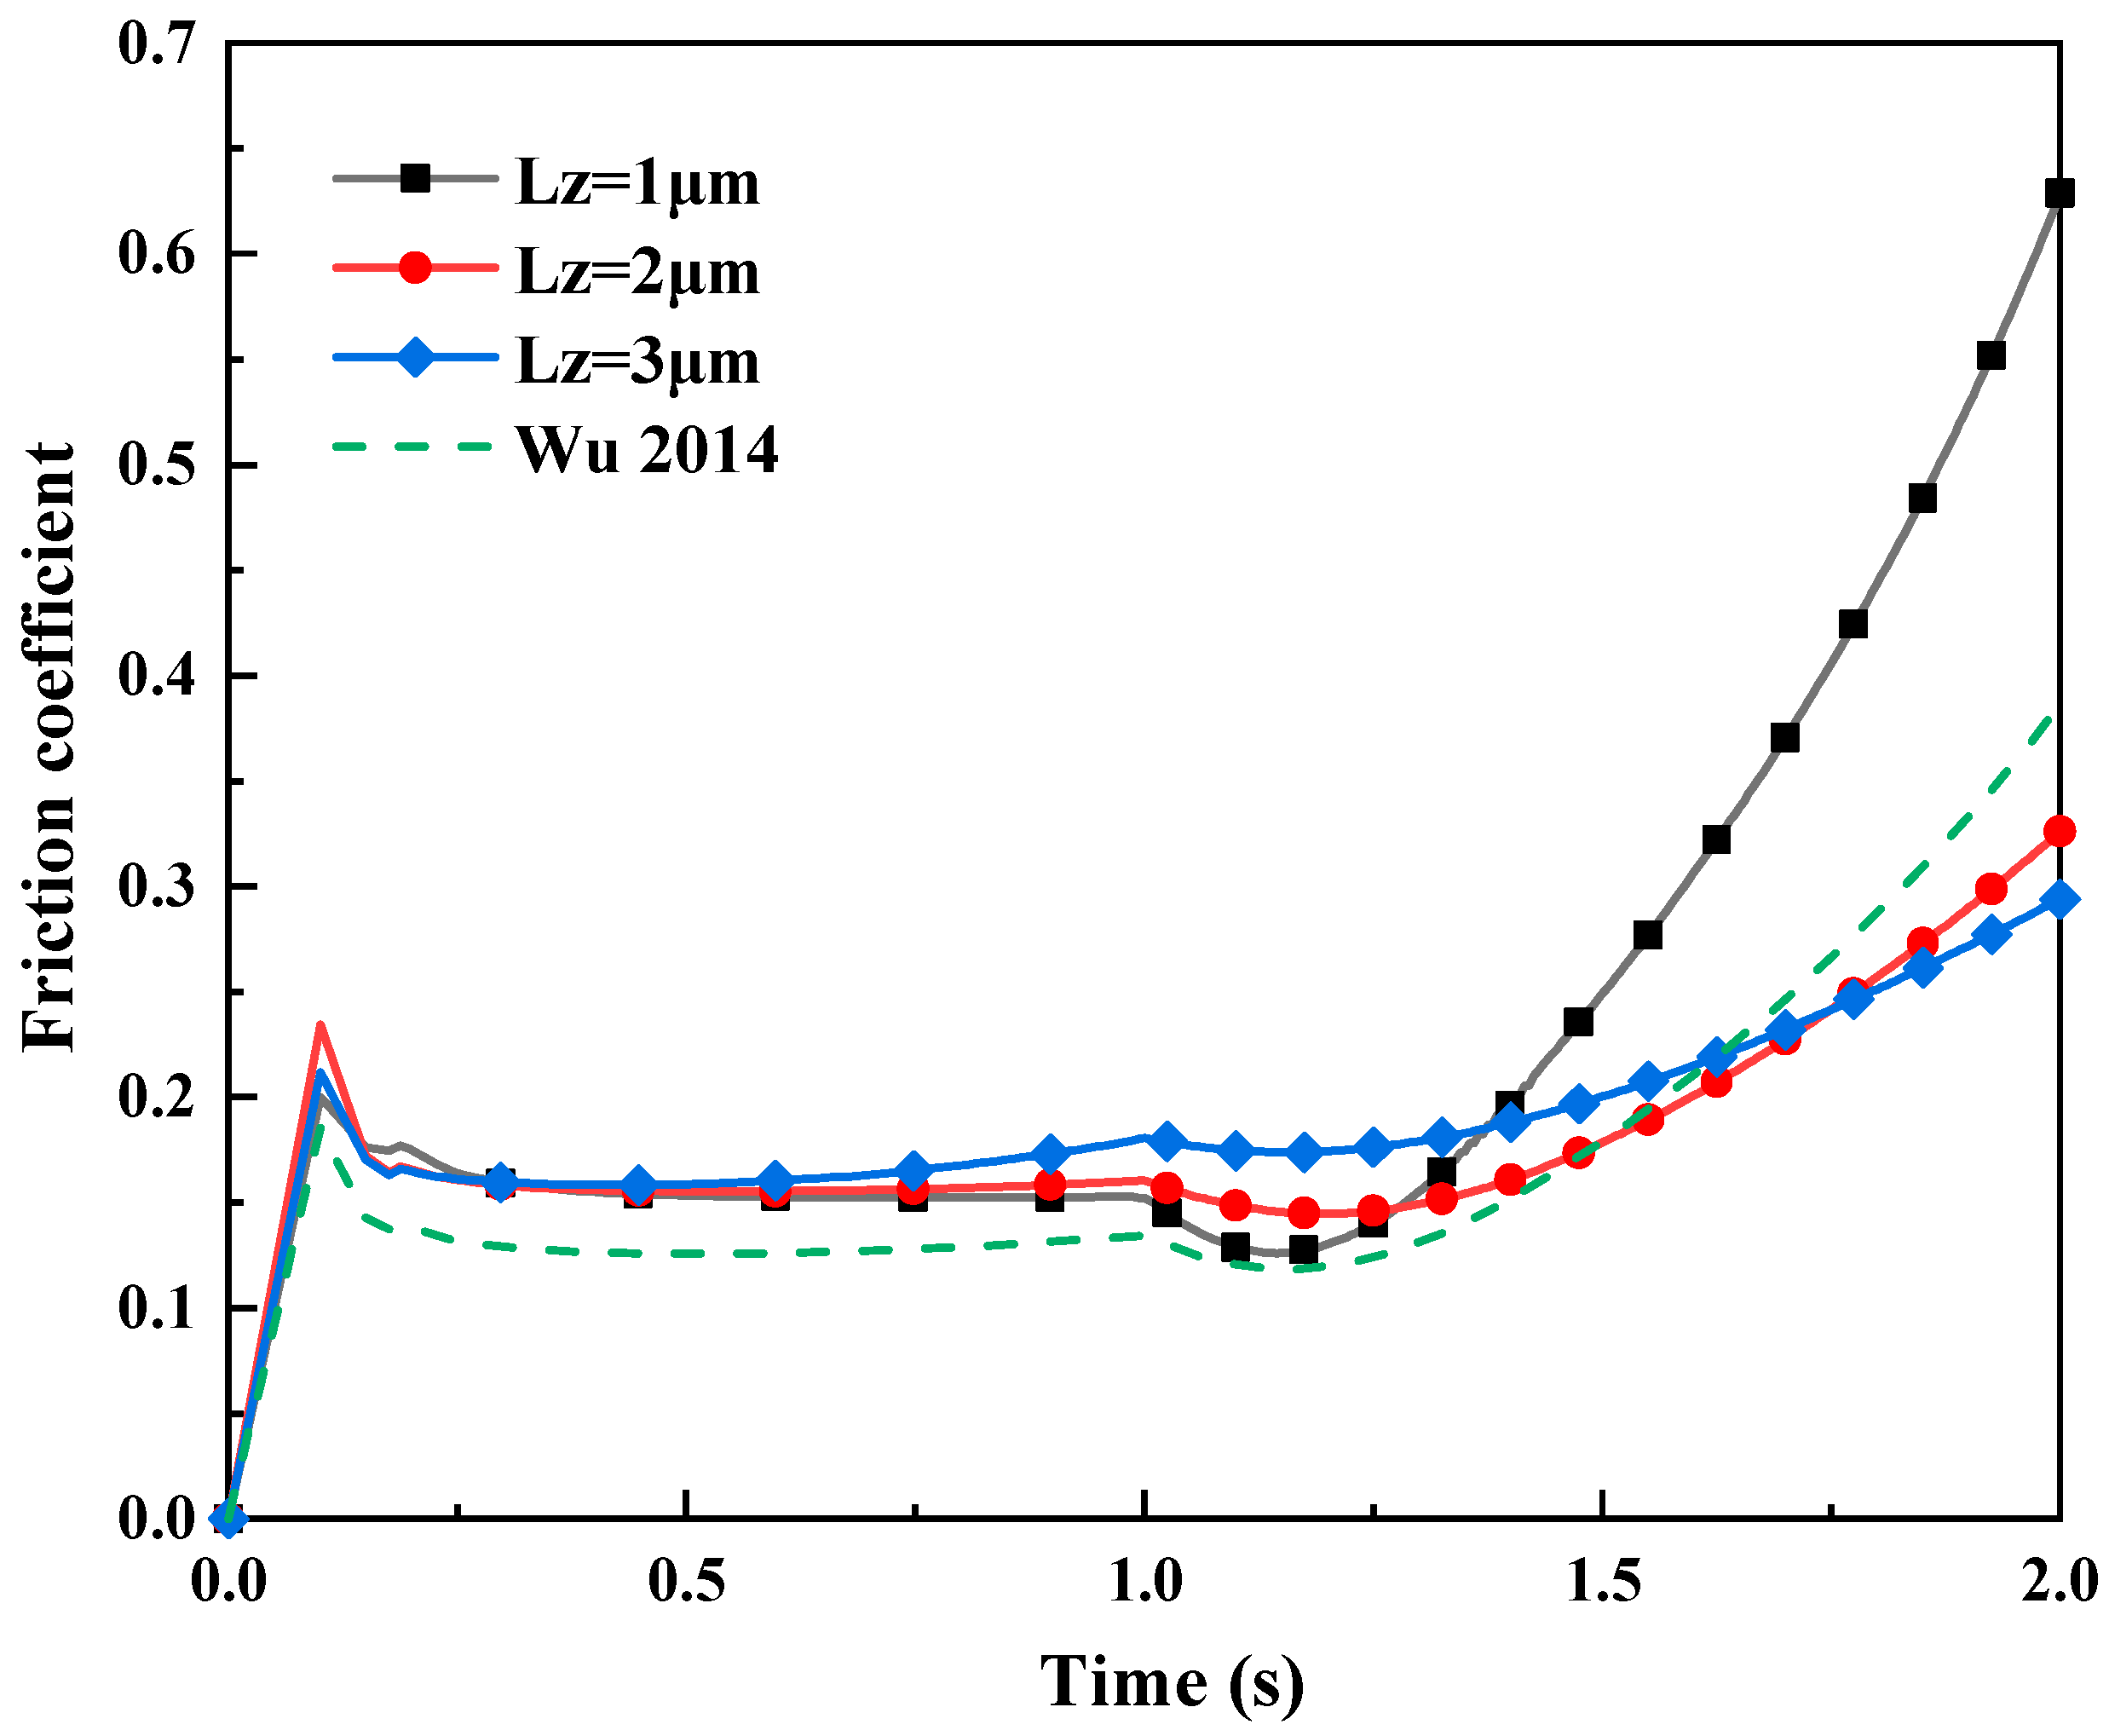
- When there is tangential sliding between the rolling mill and the strip, the normal stress decreases non-linearly with the sliding increase. In contrast, the friction stress first decreases and then rises rapidly with the increasing sliding. It is due to adhesion and plowing effects causing the elastic–plastic deformation of the contacting micro-asperities and forming plowing grooves on the strip’s surface during sliding, increasing the contact area and sliding resistance.
- When the rolling speed between the rolling mill and the strip is constant, the normal and friction stresses created by the contact of the micro-asperities at the rolling interface grow as the indentation depth increases. Still, the friction coefficient reduces as the contact pressure increases. In mixed lubrication, the normal pressure borne by the lubricating oil film rises with the increasing normal displacement, resulting in a rise in viscosity between the oil film molecular layers, which increases the friction stress.
Author Contributions
Funding
Institutional Review Board Statement
Informed Consent Statement
Data Availability Statement
Conflicts of Interest
References
- Wang, Y.; Liu, Y.; Li, H. A review of rough surface simulation methods. J. Mech. Eng. 2022, 58, 148–165. [Google Scholar]
- Wu, C.; Zhang, L.; Qu, P. A multiscale soft-contact modelling method for rough surfaces in contact with coupled sliding/sliding and rolling. Tribol. Int. 2022, 173, 107627. [Google Scholar] [CrossRef]
- Wu, C.; Zhang, L.; Qu, P. A numerical strategy for predicting the interface stresses in metal strip rolling with small reduction. Int. J. Mech. Sci. 2023, 240, 107953. [Google Scholar] [CrossRef]
- Wu, C.; Zhang, L.; Li, S. A novel multi-scale statistical characterization of interface pressure and friction in metal strip rolling. Int. J. Mech. Sci. 2014, 89, 391–402. [Google Scholar] [CrossRef]
- Zhang, S.; Yan, Z.; Liu, Z. Experimental and numerical study of mixed lubrication considering boundary film strength. Materials 2023, 16, 1035. [Google Scholar] [CrossRef]
- Jeng, Y.; Lee, J.; Hwu, Y. Effects of operation parameters of cold rolling on surface finish of aluminum. Tribol. Int. 2020, 148, 106321. [Google Scholar] [CrossRef]
- Xia, C.; Li, H.; Zhang, J. Research on contact behavior of single asperity on work roll surface in mixed lubrication. J. Fail. Anal. Prev. 2018, 18, 75–82. [Google Scholar] [CrossRef]
- Chen, J.; Li, C.; Cao, Y. Effects of roll on surface and process parameters for stainless-steel strip. J. Mech. Eng. 2013, 49, 30–31. [Google Scholar] [CrossRef]
- Zhang, X.; Li, R.; Zhang, B. Model for the generation of surface topography in steel strip temper rolling. J. Mech. Eng. 2013, 49, 38–44. [Google Scholar] [CrossRef]
- Sutcliffe, M.; Le, H. Measurements of surface roughness in cold metal rolling in the mixed lubrication regime. Tribol. Trans. 2000, l43, 39–44. [Google Scholar] [CrossRef]
- Hu, S.; Zheng, L.; Guo, Q. Influence of cross-grooved texture shape on tribological performance under mixed lubrication. Coatings 2022, 12, 305. [Google Scholar] [CrossRef]
- Wu, C.; Zhang, L.; Qu, P. Surface texture transfer in skin-pass rolling with the effect of roll surface wear. Wear 2021, 476, 203764. [Google Scholar] [CrossRef]
- Shi, X.; Wang, W.; Liu, K. Construction and contact analysis of micro-random rough surface contact finite element model. Lubr. Eng. 2020, 45, 25–29. [Google Scholar]
- Zhao, J.; Li, Z.; Zhang, H.; Zhu, R. Study on sliding wear characteristics of non-Gaussian rough surface in mixed lubrication. Tribol. Trans. 2022, 65, 621–632. [Google Scholar] [CrossRef]
- Megalingam, A.; Mayuram, M. Effect of surface parameters on finite element method based deterministic Gaussian rough surface contact model. Part J-J. Eng. Tribol. 2014, 228, 1358–1373. [Google Scholar] [CrossRef]
- Thirumalai, R.; Selvarani, P.; Arunachalam, R.M. Investigations of surface roughness and flank wear behaviour in machining of Inconel 718. Aust. J. Mech. Eng. 2012, 10, 157–167. [Google Scholar] [CrossRef]
- Li, L.; He, B.; Wang, J. Asperity Model Construction and Contact Characteristics Analysis of Rough Surfaces. J. Vib. Shock. 2023, 42, 43–50. [Google Scholar]
- Wang, Q.; Li, Z. Research on the characteristics for unsteady mixed lubrication in metal rolling processes. Tribology 2009, 29, 251–255. [Google Scholar]
- Wang, Q.; Zhu, Y.; Guo, S. Research on mixed lubrication characteristics of strip mill based on surface roughness features of rolling interface. J. Cent. South Univ. 2019, 50, 83–90. [Google Scholar]
- Wang, W.; Li, X.; Huang, J. Research on the mixed lubrication characteristics in the working zone of aluminium cold rolling. Lubr. Eng. 2022, 47, 81–88. [Google Scholar]
- Christensen, H. Statistic models for hydrodynamic lubrication of rough surfaces. Part J-J. Eng. Tribol. 1969, 184, 1013–1026. [Google Scholar]
- Mccool, J. Comparison of models for the contact of rough surfaces. Wear 1986, 107, 37–60. [Google Scholar] [CrossRef]
- Chen, H.; Hu, Y.; Wang, H. The generation of three dimensional rough surface and the control of texture feature. Lubr. Eng. 2007, 32, 42–45. [Google Scholar]
- Li, J.; Zhang, B.; Zhang, Q. The influence of surface topography on mixed plasto-elastohydrodynamic lubrication in point contacts. Part J-J. Eng. Tribol. 2023, 237, 1197–1211. [Google Scholar] [CrossRef]


| Parameter | Value | Unit |
|---|---|---|
| Young’s modulus of roll 9Cr | 200 | |
| Poisson’s ratio of roll 9Cr | 0.3 | _ |
| Density of roll 9Cr | 7850 | |
| Young’s modulus of strip 5052 | 71 | |
| Poisson’s ratio of strip 5052 | 0.3 | _ |
| Density of strip 5052 | 2770 | |
| Viscosity of lubricant N54 | 1.06 (25 °C) | |
| Density of lubricant N54 | 889 |
Disclaimer/Publisher’s Note: The statements, opinions and data contained in all publications are solely those of the individual author(s) and contributor(s) and not of MDPI and/or the editor(s). MDPI and/or the editor(s) disclaim responsibility for any injury to people or property resulting from any ideas, methods, instructions or products referred to in the content. |
© 2023 by the authors. Licensee MDPI, Basel, Switzerland. This article is an open access article distributed under the terms and conditions of the Creative Commons Attribution (CC BY) license (https://creativecommons.org/licenses/by/4.0/).
Share and Cite
Tao, L.; Wang, Q.; Qi, Z.; Wu, H.; Zhu, H.; Huang, J. Analysis of the Rolling Interface Contact Characteristics in Mixed Lubrication Based on Gaussian Distribution Theory. Materials 2023, 16, 5220. https://doi.org/10.3390/ma16155220
Tao L, Wang Q, Qi Z, Wu H, Zhu H, Huang J. Analysis of the Rolling Interface Contact Characteristics in Mixed Lubrication Based on Gaussian Distribution Theory. Materials. 2023; 16(15):5220. https://doi.org/10.3390/ma16155220
Chicago/Turabian StyleTao, Laihua, Qiaoyi Wang, Ziwei Qi, Huajie Wu, Hanbin Zhu, and Junbo Huang. 2023. "Analysis of the Rolling Interface Contact Characteristics in Mixed Lubrication Based on Gaussian Distribution Theory" Materials 16, no. 15: 5220. https://doi.org/10.3390/ma16155220
APA StyleTao, L., Wang, Q., Qi, Z., Wu, H., Zhu, H., & Huang, J. (2023). Analysis of the Rolling Interface Contact Characteristics in Mixed Lubrication Based on Gaussian Distribution Theory. Materials, 16(15), 5220. https://doi.org/10.3390/ma16155220