Article

Influence of Strain Hardening Rate of Material on Temperature and Strain Distributions during Wire Drawing

School of Mechatronics Engineering, Korea University of Technology & Education, Cheonan 31253, Republic of Korea
Materials 2023, 16(14), 5203; https://doi.org/10.3390/ma16145203
Submission received: 11 July 2023 / Revised: 20 July 2023 / Accepted: 22 July 2023 / Published: 24 July 2023

Abstract

:
Temperature rise of a specimen is a significant issue in drawing industries for wire, rod, and bar products, because an excessive increase in temperature during the drawing process can deteriorate the product quality and die life. The influence of the strain hardening exponent (n) of a wire on the temperature and strain distributions during wire drawing is investigated to understand its effect and to improve the quality of drawn wire. Finite element analysis and experiments are conducted to analyze the temperature and strain distributions of wires with n values of 0.0, 0.1, 0.5, and 1.0. The temperature increase of the wire augments as the n of the wire increases, despite the same amount of ideal plastic deformation, which is associated closely with the redundant work. The shear strain increases with the n of the specimen, which generates redundant work, leading to a high temperature rise. Similarly, drawing force increases with the n of the specimen, owing to the increase in redundant work with the n of the wire. In addition, the drawing force presents a linear relationship with the temperature rise of the wire. The drawing speed should be reduced and/or the cooling of wire and die should be strengthened during wire drawing, with increasing n value of the wire, because product quality and die wear are highly associated with the temperature rise of the wire in the deformation zone.

1. Introduction

The temperature control of both the workpiece and tool is one of the prime issues in the cold metal-forming process, because an excessive increase in temperature during the forming process can deteriorate the product quality and tool life. In wire-drawing industries for wire, rod, and bar products, an increase in temperature during the process is a significant issue, as the drawing speed increases owing to high productivity [1,2]. For example, in plain carbon steels, temperature increase deteriorates the ductility and drawability of the wire during wire drawing because of the strain aging effect [3,4]. Thus, drawing speed or productivity of plain carbon steels, particularly pearlitic steels, can only be increased to a certain extent, owing to the temperature rise during wire drawing.
In wire drawing, the temperature increase of a specimen is determined by the process conditions, such as the drawing speed (Vd), reduction in area per pass (Rp), friction coefficient between the specimen and die (m), and semi-die angle (θ), as well as material properties, such as the thermal conductivity (k), heat capacity (Cp), density (ρ), and strain hardening exponent (n) of a specimen. The effects of process conditions on the temperature increase of materials have been extensively investigated over the past five decades [3,4,5,6,7,8,9,10,11,12]. For example, researchers reported that an increase in Vd, Rp, and m increased the temperature of a specimen. In the case of θ, an optimum value of θ resulted in minimal temperature increase.
However, studies regarding the effects of material properties on the temperature increase of a material during wire drawing are insufficient. That is, studies regarding the influence of n of a material on the temperature increase during wire drawing are few [13], although several studies have been performed to investigate the effect of n on the strain distribution during wire drawing [14,15]. Figure 1 summarizes the n values of typical metals from the literature [16,17,18,19,20,21,22,23,24,25]. The n values of metals, including wire rod products, vary significantly, from 0.1 to 0.6. The n of wire rod products has increased because wire rod industries are developing new products in the direction of increasing both the strength and formability. For example, the automobile industry intends to manufacture products that reduce car weight by increasing strength and the elimination of expensive heat treatments, via an improvement in formability. In the same vein, Hwang et al. [26] recommended using twinning-induced plasticity (TWIP) steel for wire, rod, and bar products, such as bearings and fasteners, because TWIP steels offer an excellent combination of strength, ductility, and toughness, which is due to their high n values (Figure 1) arising from mechanical twinning and dynamic strain aging during plastic deformation [27,28]. The behavior of temperature increase in TWIP steels may differ from that of plain carbon steels or non-ferrous metals, owing to their high n values. The n of TWIP steels can be more than twice that of plain carbon steels and non-ferrous metals, as shown in Figure 1; thus, TWIP steels and plain carbon steels exhibit different thermal behavior during wire drawing. Even under the same drawing conditions, the Vd and/or cooling condition should be changed with the material, especially with n, because the temperature distribution of a specimen is different during the drawing process depending on the material properties. Therefore, it is industrially important to understand the thermal behavior of a specimen during the drawing process according to the n value of a wire, to find the optimum drawing condition. However, studies regarding the effect of the n of a metal on its temperature increase during wire drawing are few. In particular, to the best of the author’s knowledge, no comprehensive study was reported on the correlation between the n value and temperature increase of the specimen during wire, rod, and bar drawing.
Hence, the effect of the n of a metal on the temperature increase during wire drawing should be investigated to elucidate the wire-drawing behavior in more detail and improve the quality of drawn wire. In the present study, the effect of the n of a wire on the temperature increase and strain distribution is analyzed during wire drawing. Finite element analysis (FEA) and experiments were performed to analyze the temperature and strain distributions of wires with n values of 0.0, 0.1, 0.5, and 1.0.

2. Experiment and FEA

2.1. Experiment

To validate the current FEA model, wire-drawing tests were conducted on ferritic steel with low n and TWIP steel with high n values using a single pass-type draw-bench machine. The 13 mm diameter ferritic steel wire rod used was provided by steel-making company, POSCO, in South Korea. This wire rod was manufactured by heating the billet with a 160-mm-wide square shape at approximately 1200 °C, followed by performing normal hot rolling at temperature ranges of 900–1200 °C, and Stelmor air cooling at a cooling rate of approximately 3 °C/s [29]. The chemical composition of the ferritic steel was Fe-0.1C-0.4Mn-0.1Si (wt.%). For the case of TWIP steel, a 50 kg ingot with a chemical composition of Fe-0.72C-17.07Mn-2.9Cu (wt.%) was cast via induction melting under Ar gas. To reduce Mn segregation in the ingot, the ingot was soaked at 1200 °C for 12 h, and then rolled down to a plate measuring 20 mm thick, at a final rolling temperature of 950 °C, followed by air cooling at 21 °C. For the tensile test, the specimens were extracted along the rolling direction from the hot-rolled ferritic steel rod and hot-rolled TWIP steel plate. Subsequently, the specimens were machined into a tensile specimen with a gauge diameter of 5.0 mm and length of 25.0 mm, using a lathe. The specimens were assumed to be isotropic materials because hot-rolled steels were used in this test. The specimens were strained at a low strain rate of 10−3 s−1 using an Instron at a room temperature (RT) of 26 °C. Figure 2 shows the true stress–strain curve of the two specimens. Based on the curve fitting of the two true stress–strain profiles using Hollomon’s law, the n value of ferritic steel was 0.16 and that of TWIP steel was 0.53.
For the wire-drawing test, round rods with a 13 mm diameter were prepared using lathe from the TWIP steel plate along the rolling axis. The 13 mm diameter wire rod was drawn into an 11.63 mm diameter wire with a Vd of 0.07 m/s using the single die-type draw-bench at RT. The process conditions of wire-drawing test were summarized in Table 1. Prior to the test, the oxidation scale on the specimen was removed via chemical pickling using 12.5% HCl solution. MoS2 lubricant was sprayed onto the specimen. θ was 6°, and Rp was approximately 20%. Rp was calculated as follows:
R p = d 0 2 d f 2 d 0 2 × 100   %
where d0 and df are the diameters of initial and drawn wires, respectively. The nominal drawing strain (εn) of the drawn wire was 0.22, which was calculated as follows:
ε n = 2 l n d 0 d f
The temperature in the core region of the specimen was measured using a K-type thermocouple with 1.0 mm diameter. To reduce temperature disturbances at the surface of the wire, a thermocouple was embedded in a 1.0 mm diameter hole in the wire [12,29]. Additionally, a load cell installed on the draw-bench machine was used to measure the drawing force.

2.2. FEA

During a typical wire drawing, the temperature of the wire increases from heat generation owing to the deformation of the wire, as well as the friction between the wire and die interface [30]. Consequently, the surface region of the wire exhibits a higher temperature rise than the center region, owing to heating caused by friction at the wire and die interface. Unfortunately, measuring the surface temperature of round-shaped small specimens was difficult using both non-contact-type pyrometers and contact-type thermocouples [29]. Furthermore, a wire experiences inhomogeneous plastic deformation along its radial direction depending on operating conditions during wire drawing [31,32,33], thus resulting in a complex temperature distribution within the wire. Hence, FEA was applied in this study to evaluate both the temperature and strain distributions of the specimen, because FEA is an effective approach for analyzing the complex temperature, strain, and stress distributions in deformed specimens. The DEFORM commercial software (version 11.0) was used in simulating the wire-drawing process. Based on the experiences of the author, this FEA software well-simulates bulk-forming processes, such as forging, wire drawing, and rolling; therefore, it is suitable for analyzing the wire-drawing process.
The die was considered as a rigid body, i.e., it did not deform during the entire drawing process. The die angle was 6°. The shear friction factor was set as 0.1765, based on a previous FEA [34]. The initial wire with the diameter of 13 mm was drawn into wire with the diameter of 11.63 mm at a velocity of 0.07 m/s at RT. Half of the entire geometry was modeled stemming from the symmetric natures of the wire-drawing process, and approximately 5000 square elements were used in wire specimen.
During plastic deformation, the temperature rise was numerically obtained as follows [35]:
Δ T i = Δ Q ρ C p = ξ ρ C p 0 ε 1 σ d ε
where Ti and Q are the ideal temperature increase and heat energy, respectively; and ξ is a fraction factor representing the ratio of Q to mechanical work. In this FEA, ξ was assumed to be 0.9 because only a slight amount of mechanical energy was stored in the deformed specimen as elastic energy [35,36]. The thermal properties of the specimen and die, as listed in Table 2, were assumed to be unaffected by temperature because the temperature variation in the wire and die was small; namely, 25–150 °C.
The required flow stress curves for the FEA were obtained by analyzing Ti during plastic deformation using Equation (3). The specimen was considered as an isotropic material; thus, the wire’s constitutive behavior can be described by Hollomon’s law using the strain hardening coefficient (K) and n as follows:
σ = K ε n
In this case, ΔTi during plastic deformation was easily calculated as follows:
Δ T i = ξ ρ C p 0 ε 1 K ε n d ε = ξ ρ C p K ϵ 1 n + 1 n + 1
where ε1 was defined to be 0.22 based on Equation (2). The values of K were calculated for fixed n values of 0.0, 0.1, 0.5, and 1.0 under the assumption of a constant Δ T i . The flow stresses of the metals are shown in Figure 3 and Table 3. For convenience, wire with n values of 0.0, 0.1, 0.5, and 1.0 is referred to as non-hardening, low-hardening, high-hardening, and linear-hardening wires, respectively.

3. Validation of FEA Model

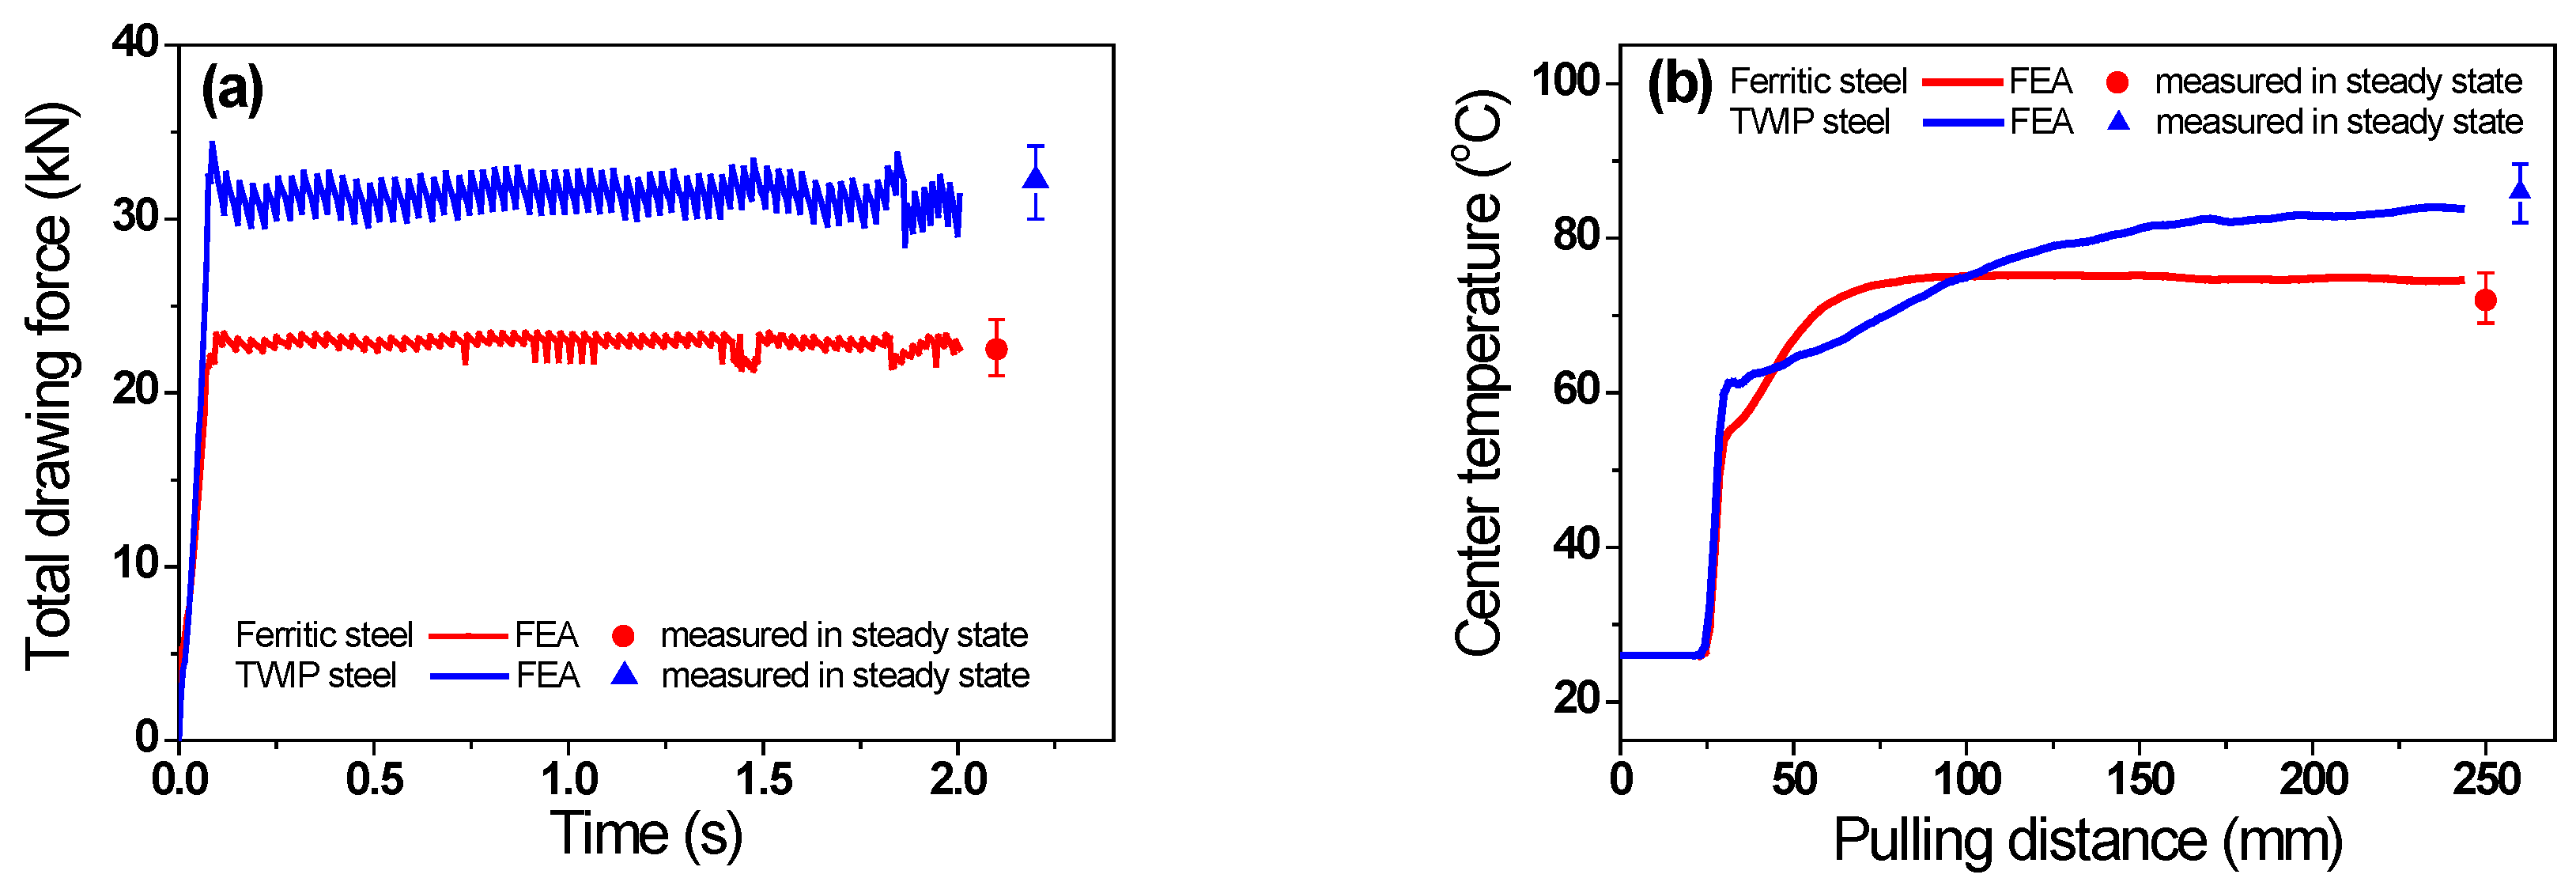
Before analyzing the FEA results, the accuracy of the current FEA model was verified by comparing the simulated and measured drawing forces and temperatures of the two steels. Figure 4a shows a comparison of the total drawing forces (Ft) of the two steels. The simulated Ft was consistent with the measured Ft. The Ft of the TWIP steel was higher than that of the ferritic steel. Figure 4b compares the equilibrium temperature (Teq) calculated via FEA and that measured using the thermocouple. The simulated Teq of the wire was in agreement with the measured Teq. The temperature increase of the two steels showed a pattern similar to that of Ft. The Teq of the TWIP steel was higher compared with that of the ferritic steel. Based on the validation of Ft and Teq, one can conclude that the results of the present FEA are acceptable and reliable for further analysis.

4. Results

4.1. Temperature Distribution

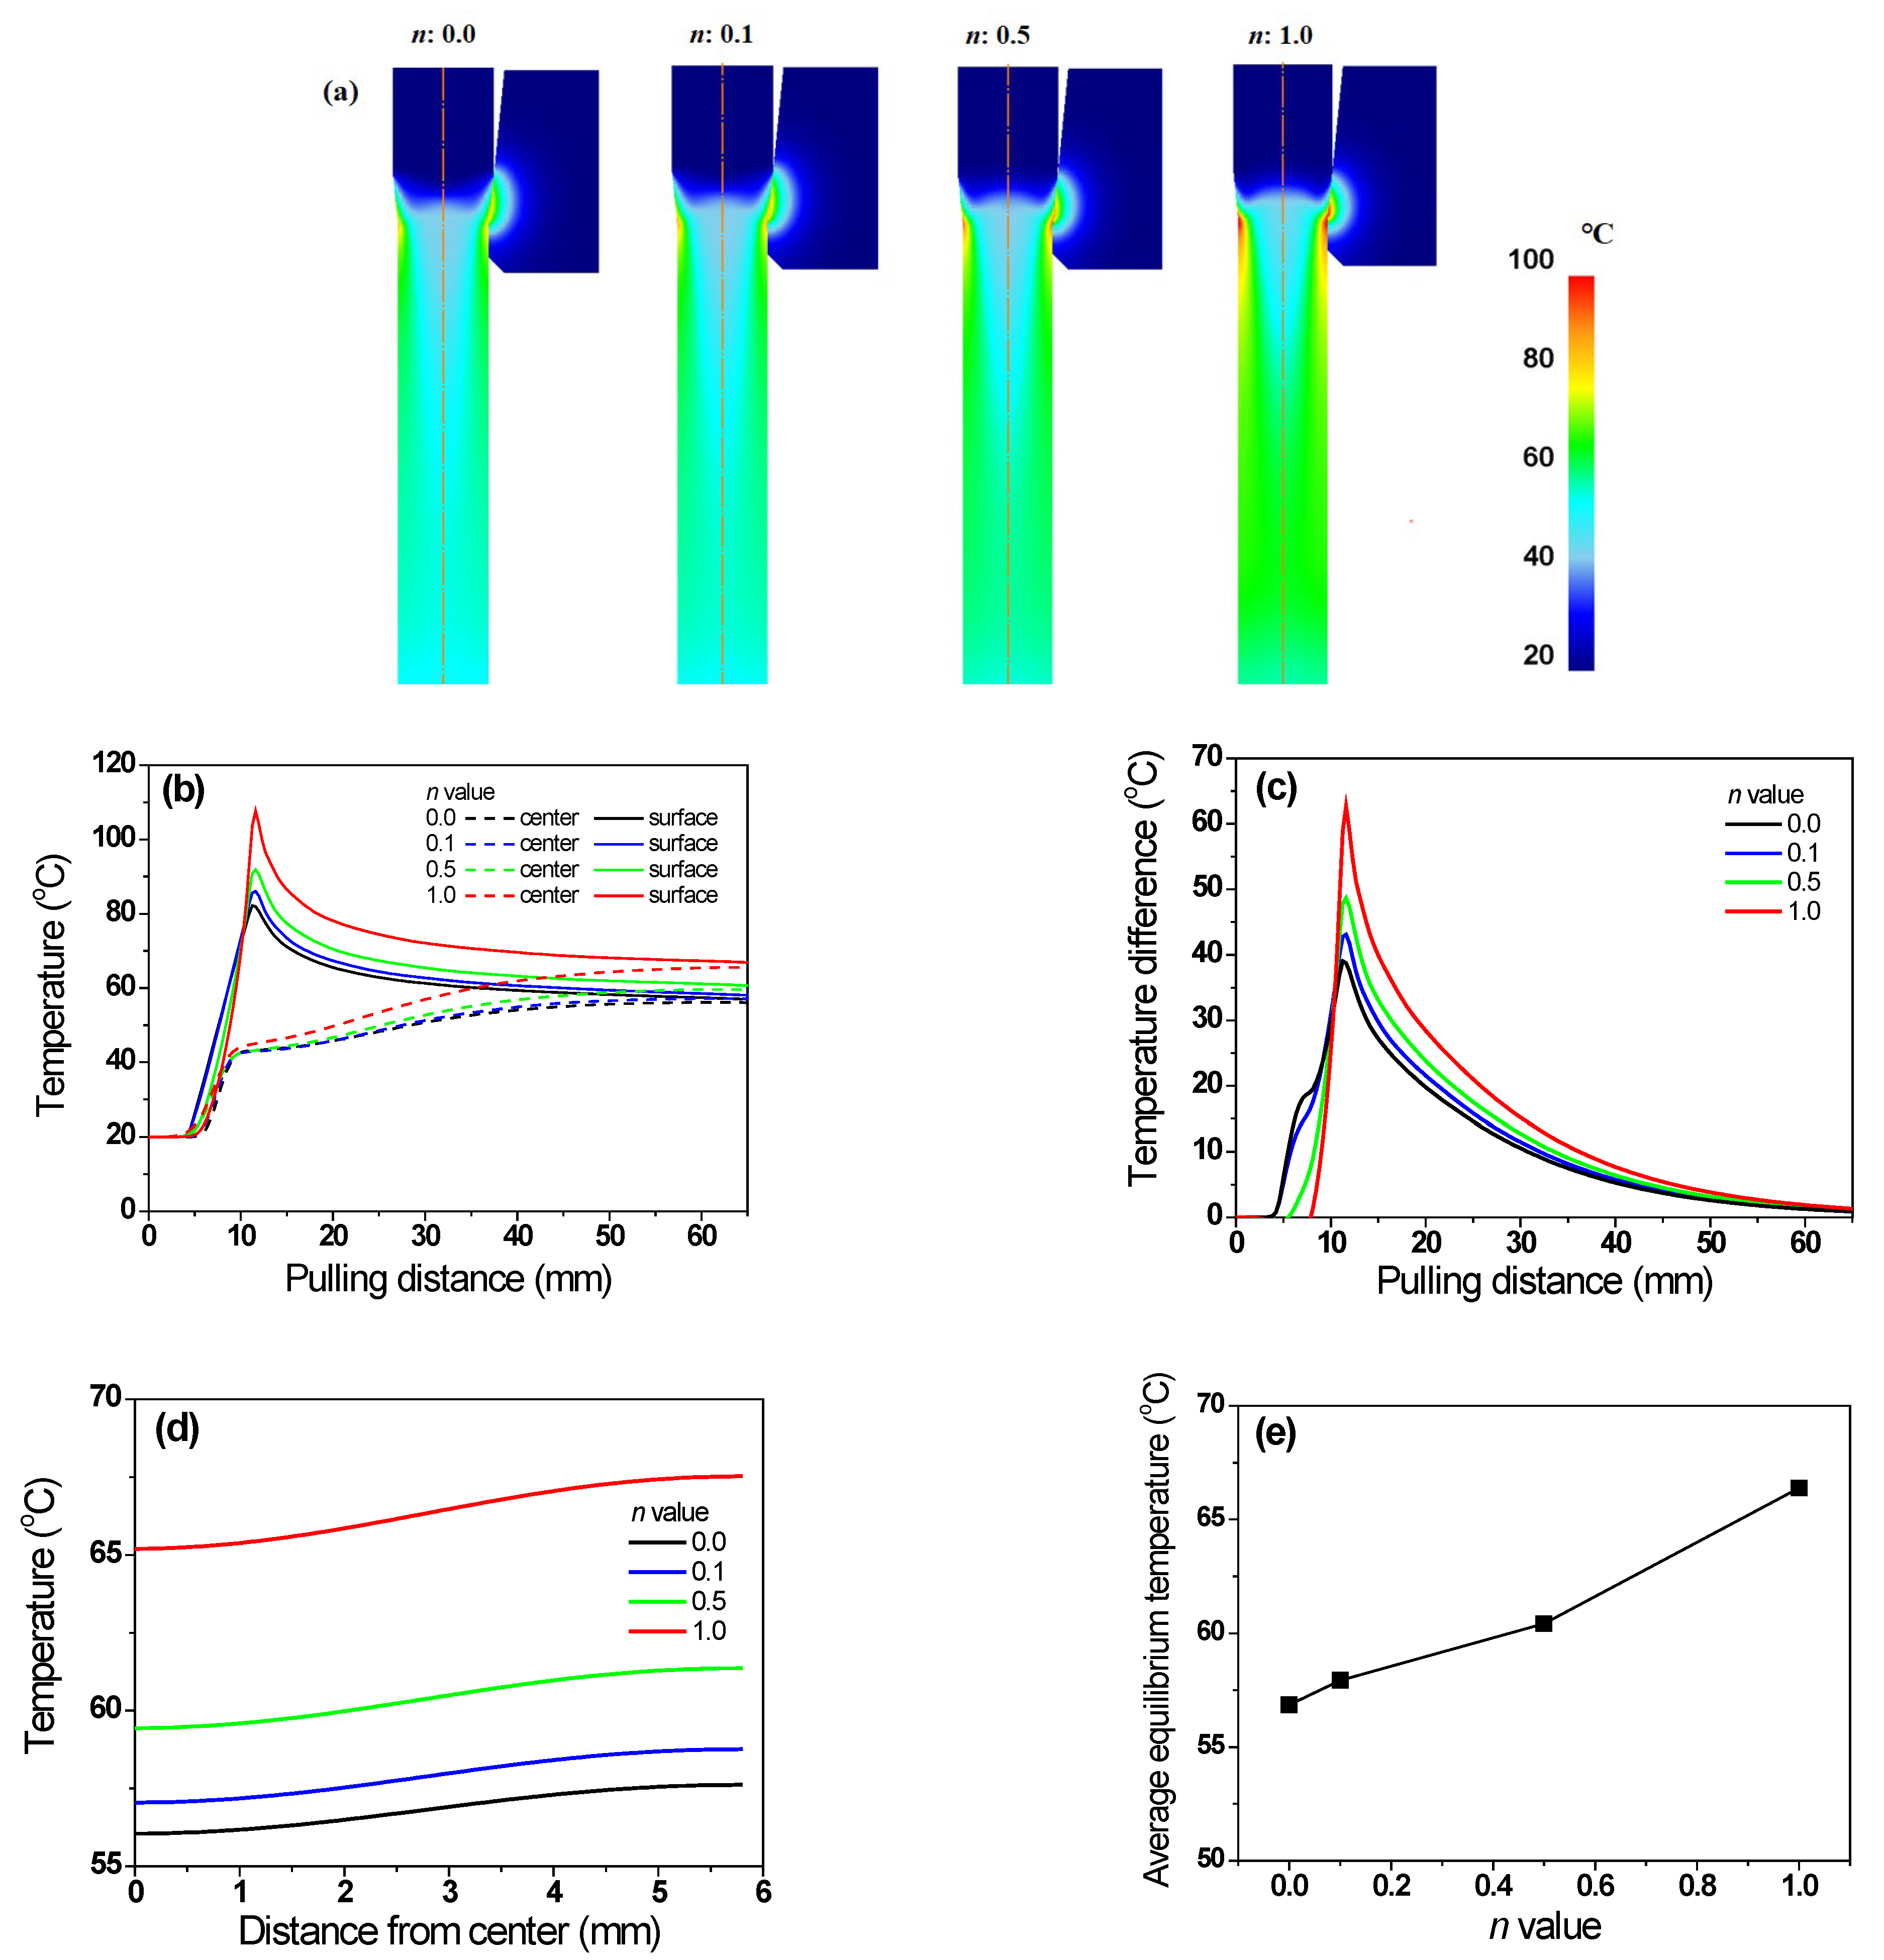
Figure 5a shows the numerical simulation results for the temperature distribution of the specimens with different n values. Figure 5b compares temperature profiles along the drawing direction at the center and surface regions of the specimen. Regardless of the n of the specimen, the maximum temperature was recorded in the surface region of the wire at the inlet of the die’s bearing zone. The maximum temperature increased with the n of the specimen, which is consistent with the previous results of El-Domiaty and Kassab [13]. A temperature gradient existed along the radial direction of the wire, because frictional heating at the surface region led to a steep temperature rise at the surface region. In all steels, the center temperature (Tc) increased gradually; whereas, the surface temperature (Ts) increased rapidly and then decreased gradually, because most of the heat generated by friction was transferred to the specimen interior via conduction heat transfer, until the specimen temperatures reached equilibrium. Additionally, the ambient air cooled the surface of the specimen via convection and radiation heat transfers, although the influence was relatively insignificant. For example, in the high-hardening wire, the Tc increased gradually from 42 °C to 62 °C; whereas, the Ts decreased rapidly from 93 °C to 62 °C. Figure 5c compares the temperature difference (Td) between the Tc and Ts of specimens with different n values. The Td was calculated as follows:
T d = T s T c
The Td increased with the n of the specimen. Figure 5d shows the comparison of temperature profiles of the wire along the radial direction at a location 50 mm from the die exit with different n values. The average temperature increased with the n of the specimen (Figure 5e).

4.2. Strain Distribution

Figure 6 shows the effective strain (εeff) of the specimens with different n values. All wires exhibited the maximum εeff near the surface, and the minimum value at the center. This implies that the temperature increase in the surface region was higher than that in the center region, owing to the higher plastic deformation during wire drawing. The average εeff increased with the n of the specimen (Figure 6c).
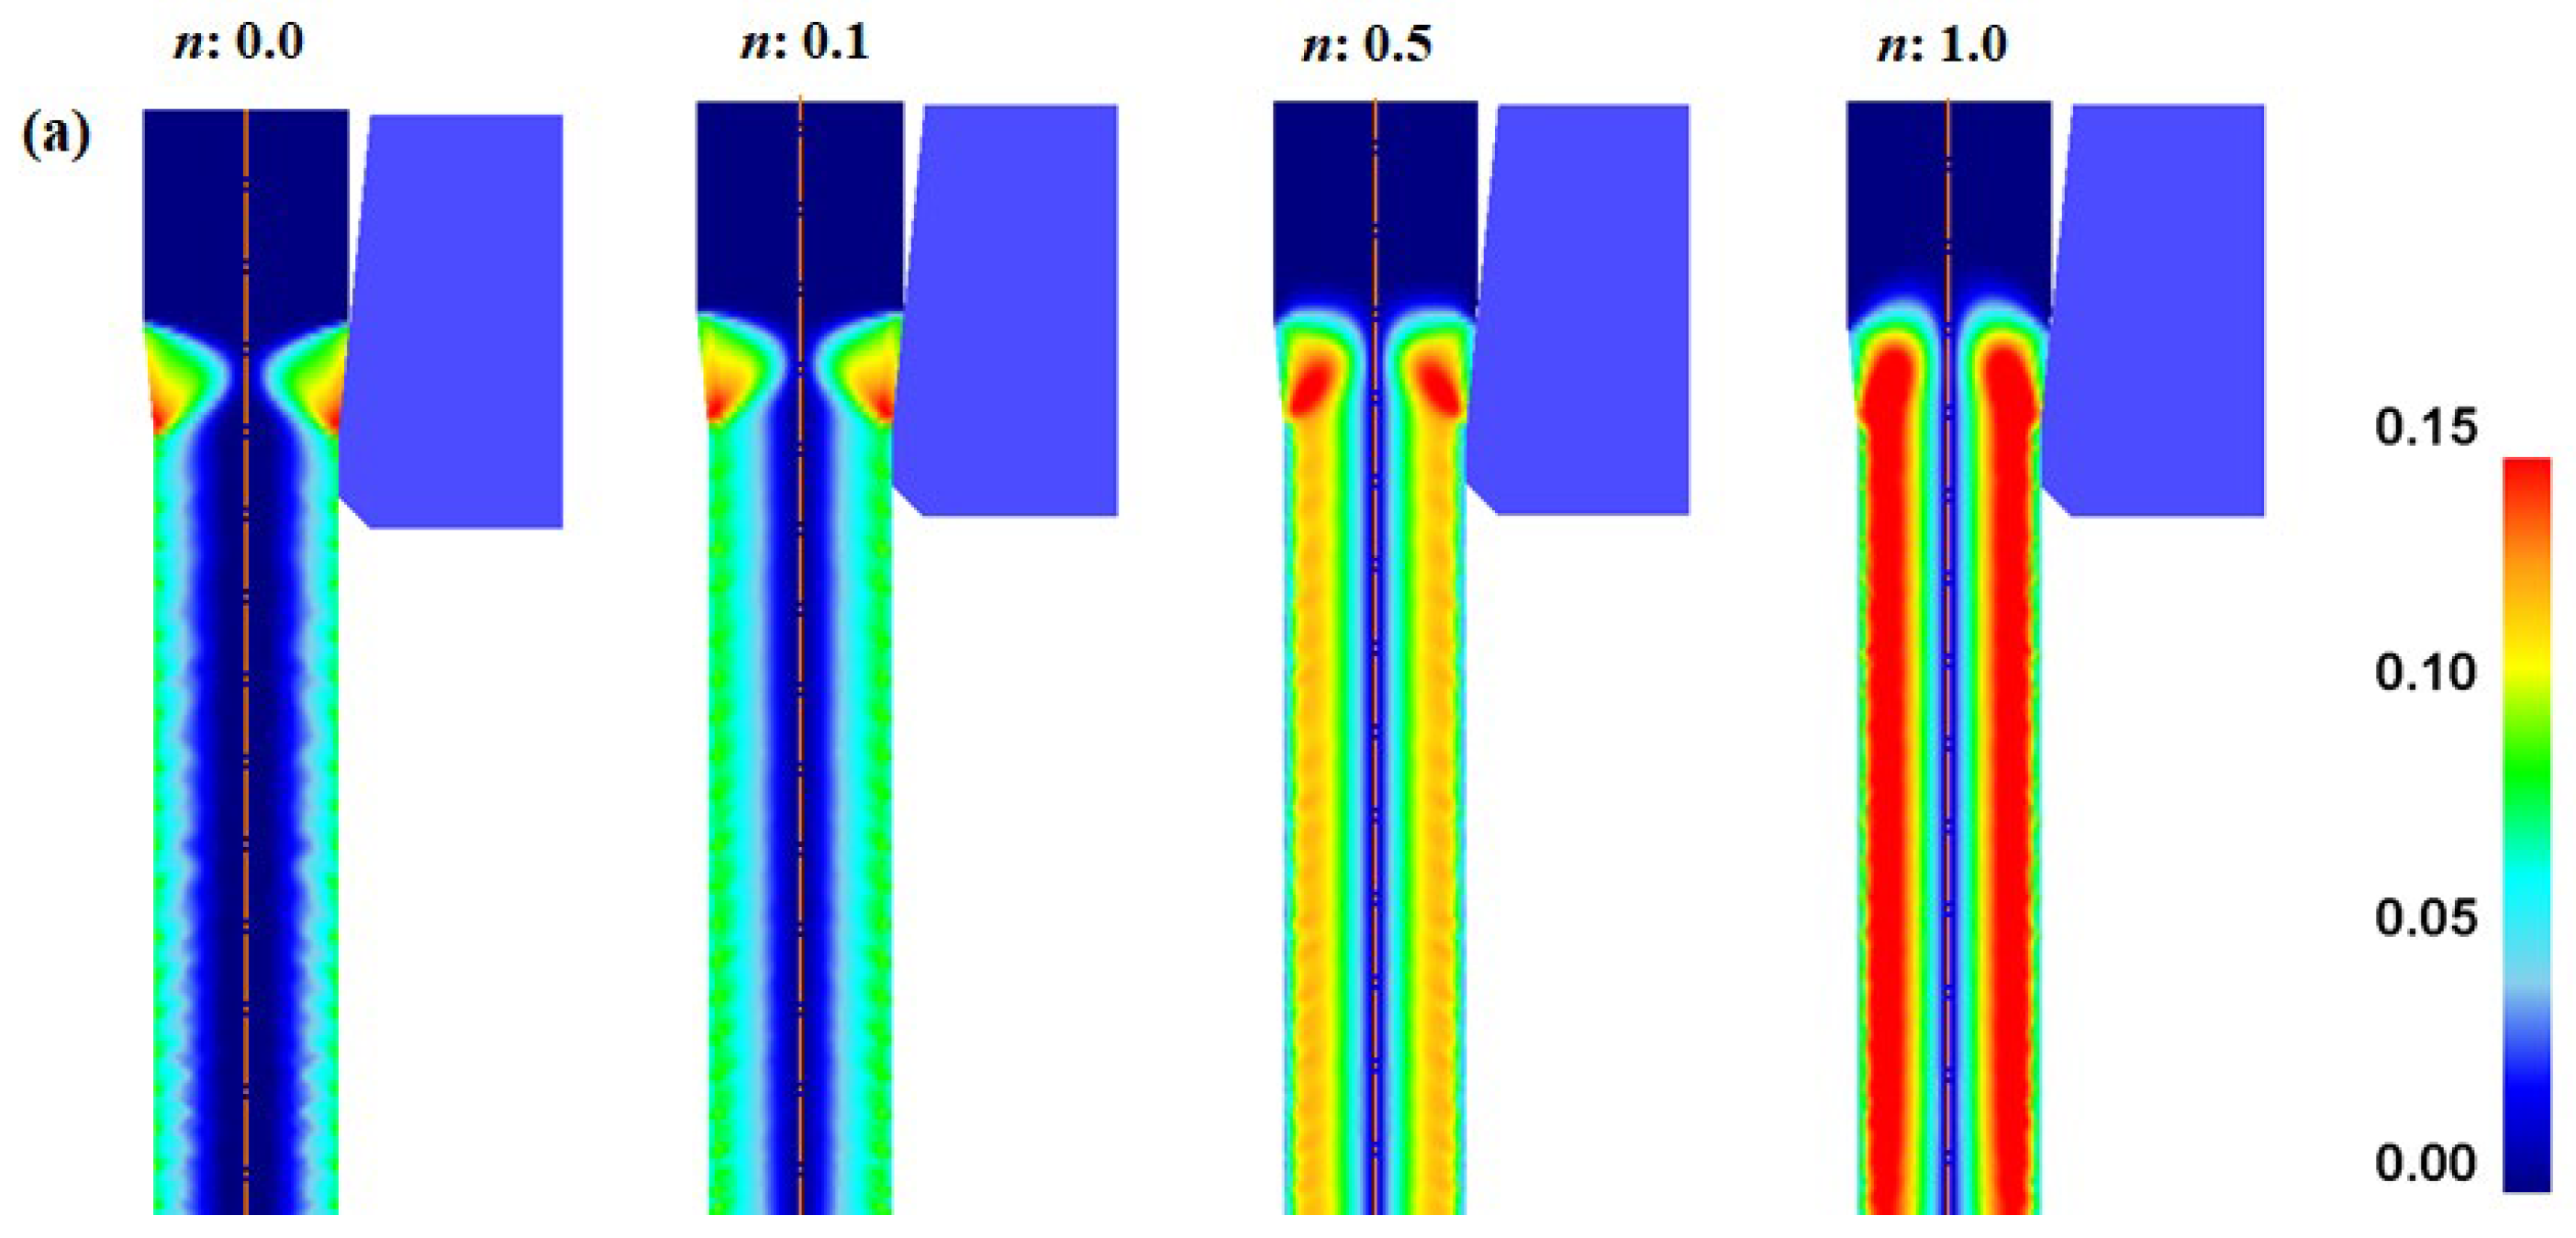
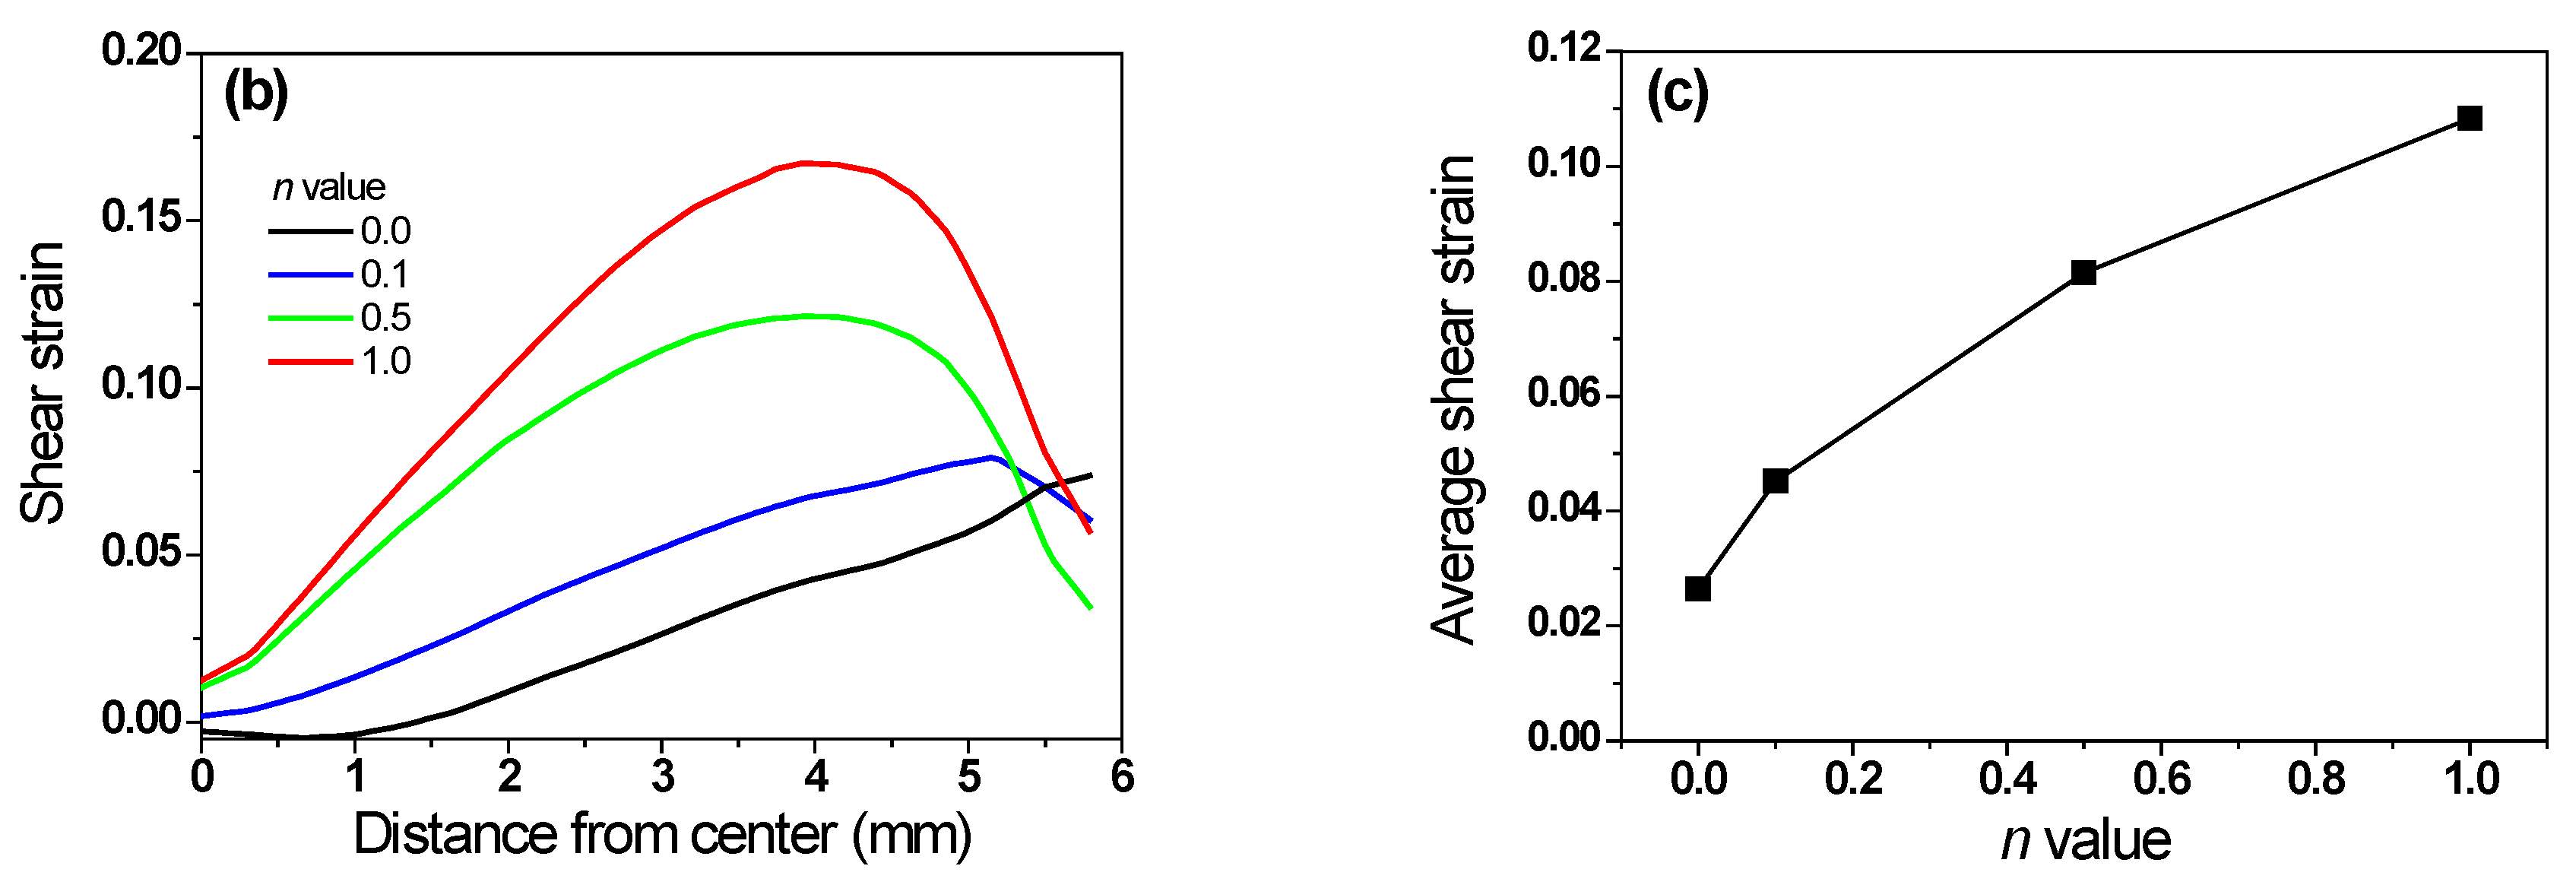
Figure 7 compares the shear strains (εs) of the specimens with different n values. The εs along the radial direction of the wire exhibited a trend similar to that of εeff. In other words, εs increased and then decreased as the distance from the center increased, and εs was zero at the center region regardless of the n. Interestingly, the profiles of εs differed depending on the n. εs increased with increasing the n of the specimen. Accordingly, the non-hardening wire exhibited the highest uniformity along the radial direction of the wire.
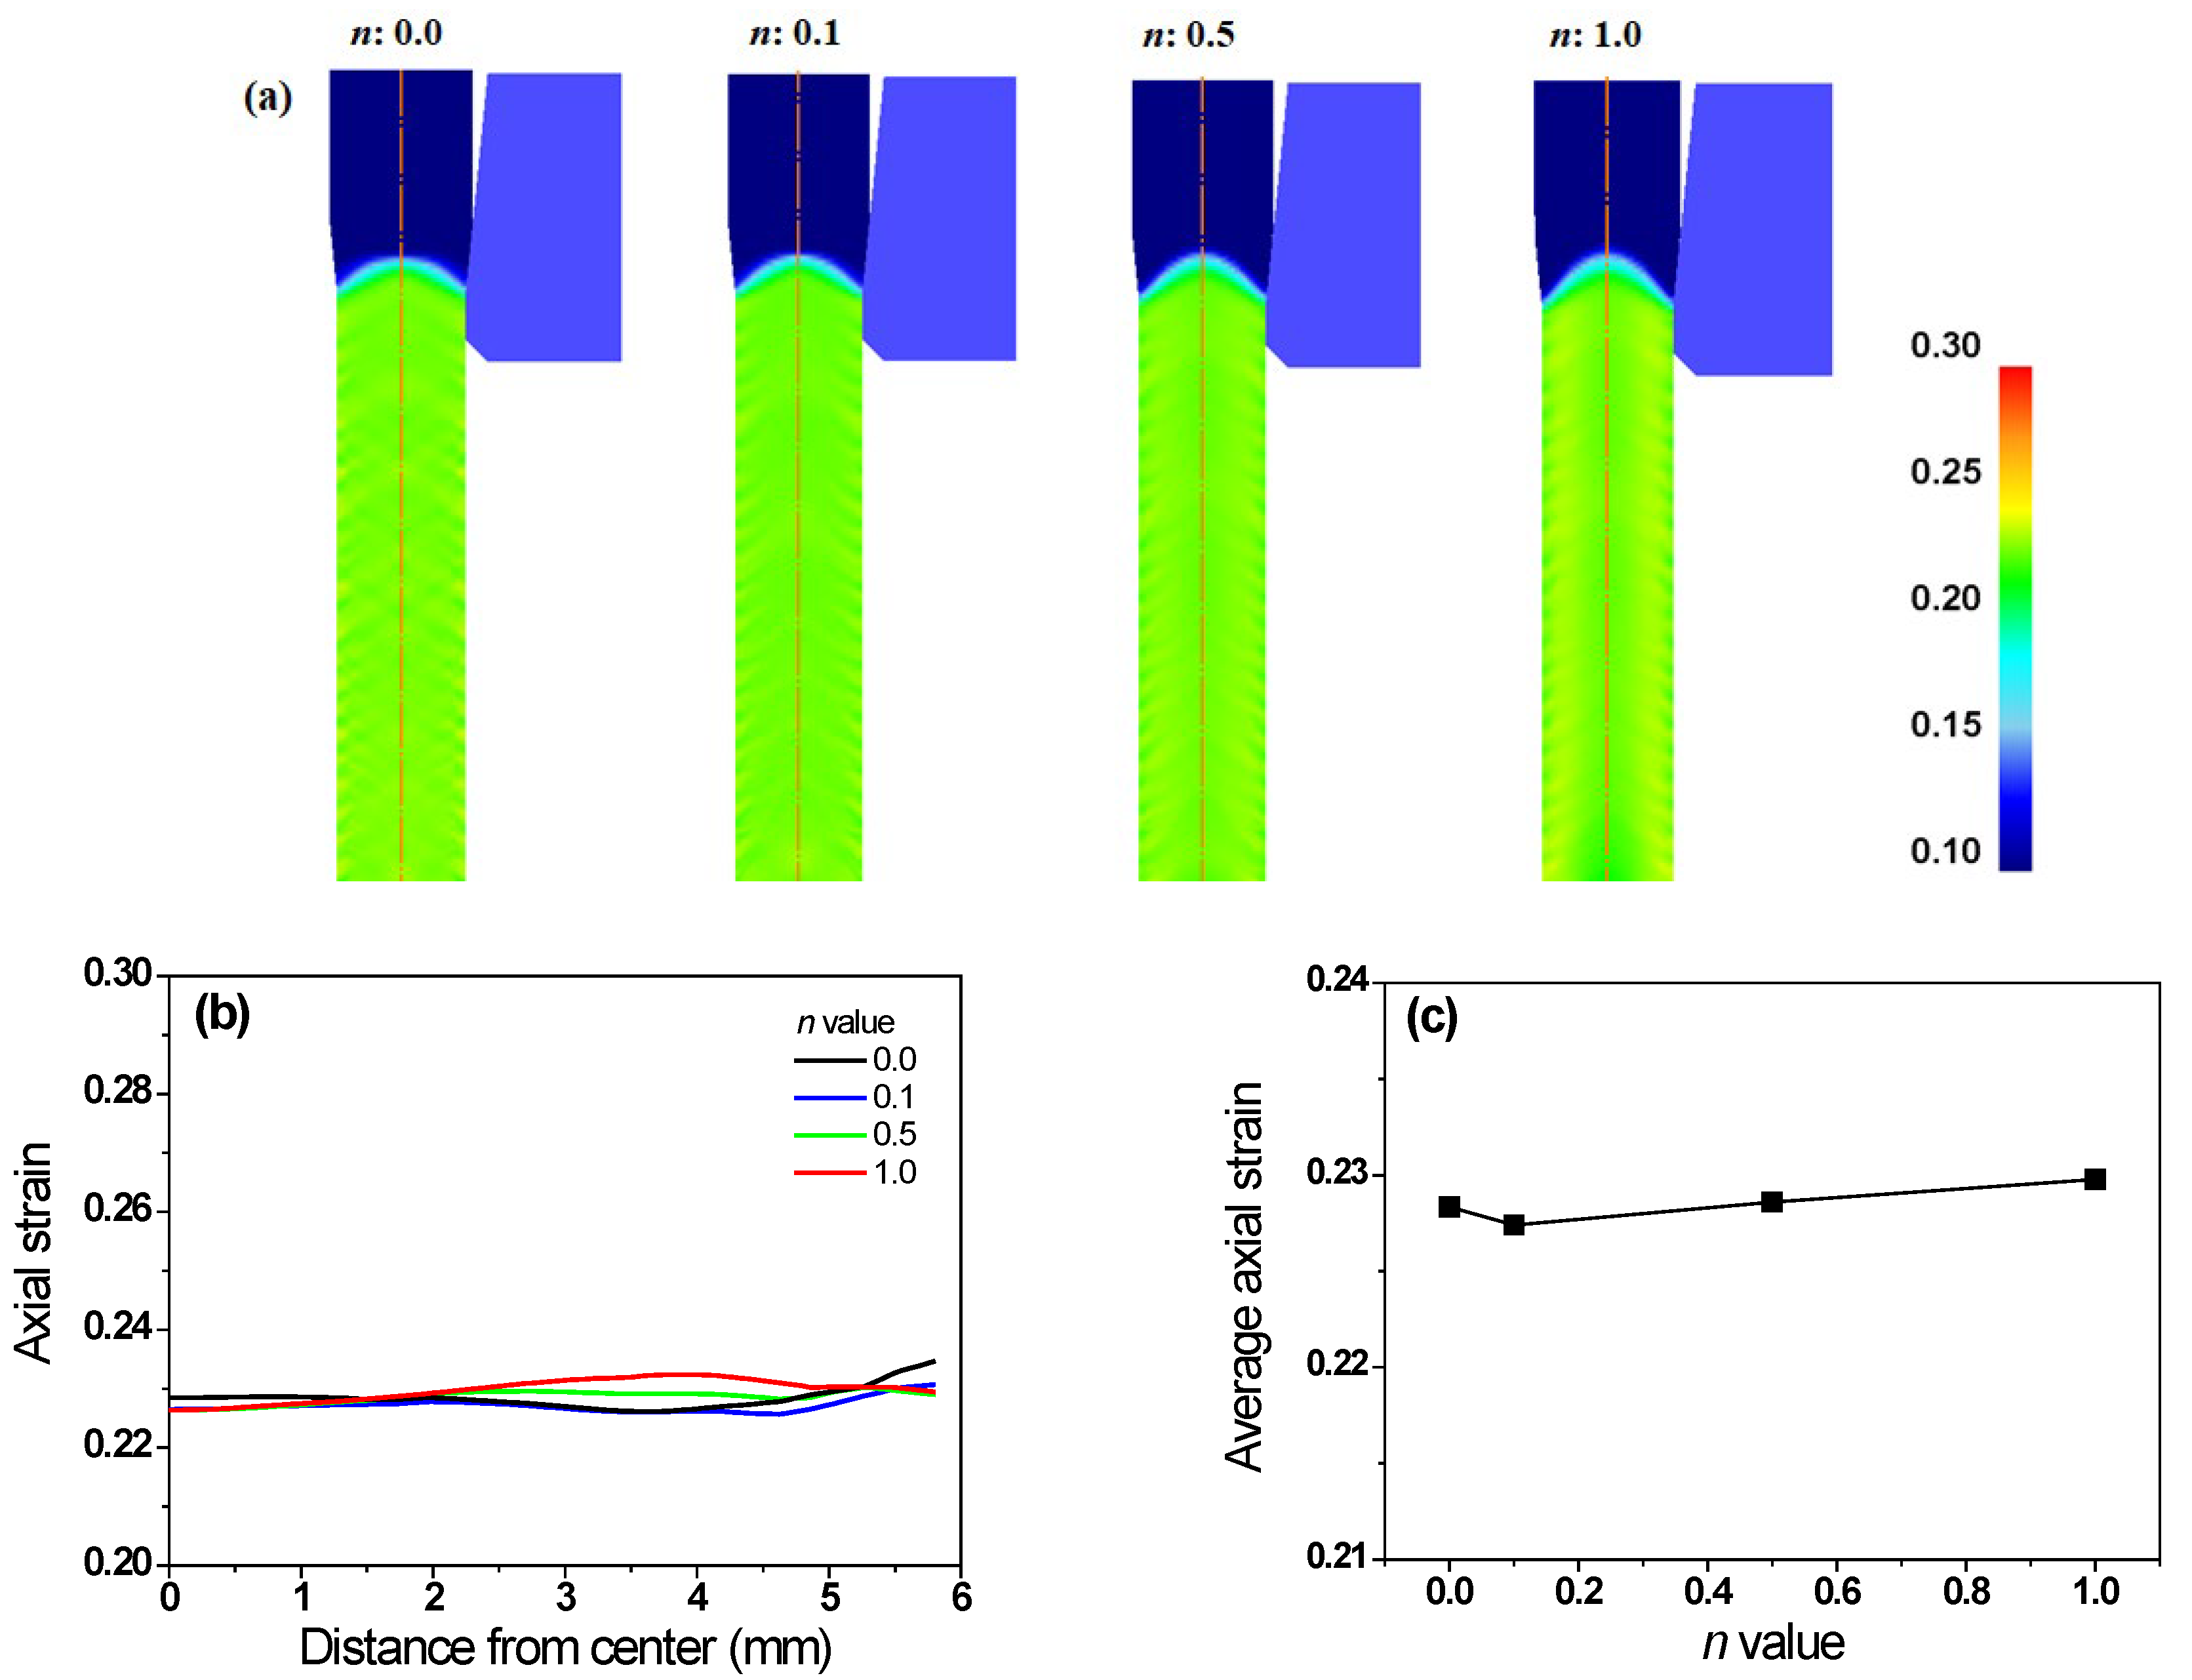
Figure 8 shows a comparison of the axial strain (εaxi) of the wires with n. Regardless of the n of the specimen, the εaxi was similar. Based on the analysis of εeff, εs, and εaxi, the different εeff of the specimens with n were associated closely with the distribution of εs with the n of the wire.

4.3. Stress, Damage Value, and Drawing Force

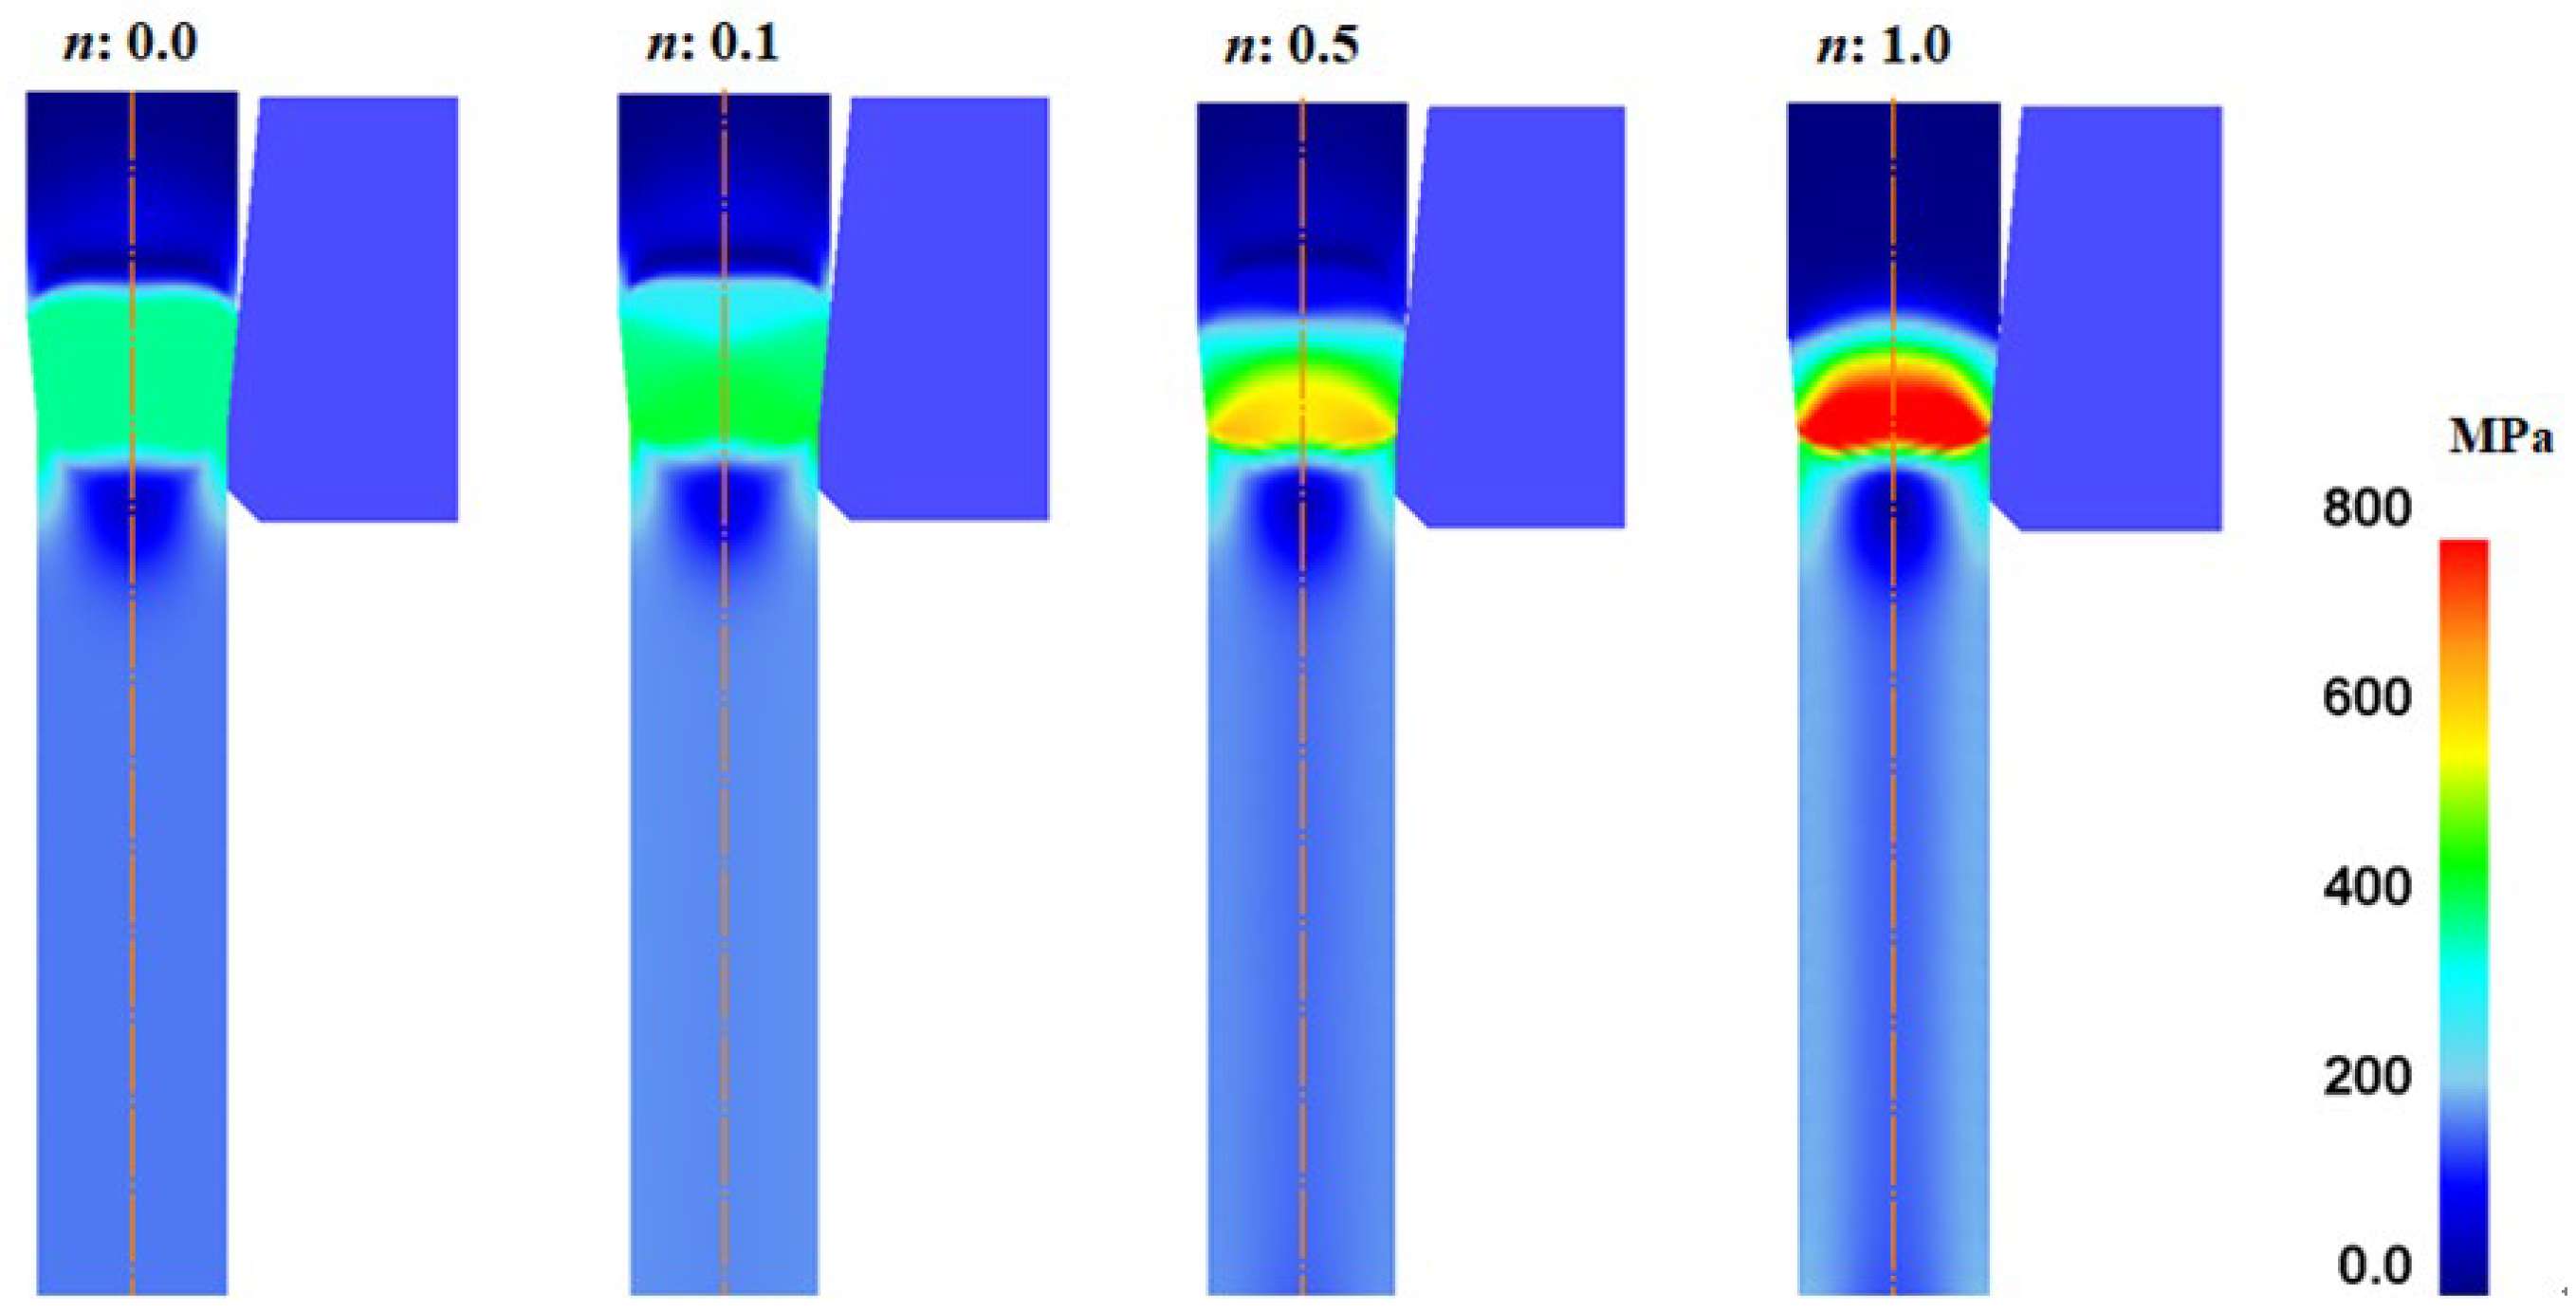
Figure 9 shows the effective stress (σeff) of the specimens with the n. Regardless of the n, the maximum σeff occurred in the surface region. Meanwhile, σeff increased with the n of the specimen because of the higher strengthening of the wire with the applied strain as the n of the wire increased (Figure 3).
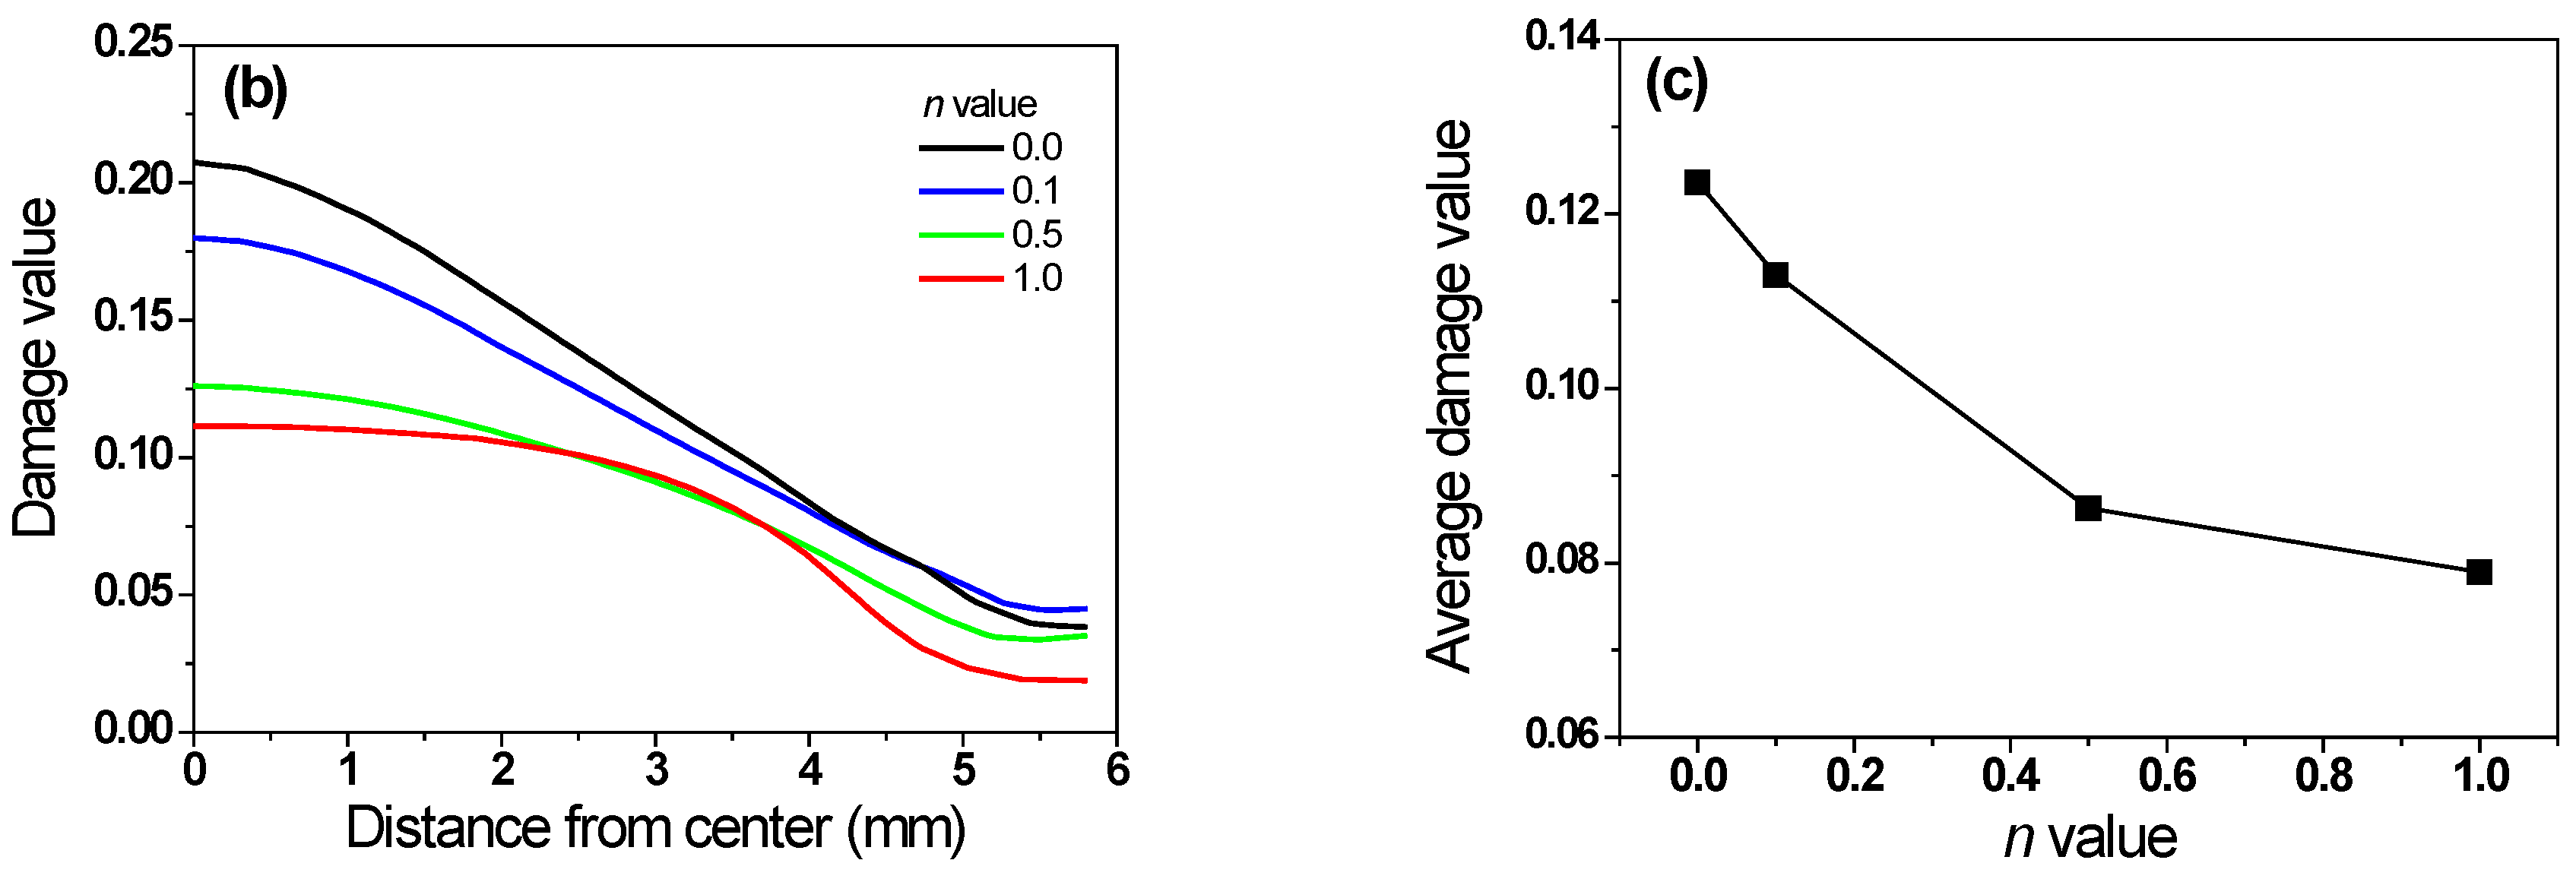
The damage value of the wire (Dw) was analyzed during the process to evaluate the formability with the n of the specimen. The normalized Cockcroft and Latham fracture criterion [39,40] shown below was applied:
  D w = 0 ε f σ m σ e f f d σ e f f
where σm is the maximum tensile stress. Figure 10a compares the contours of Dw for the drawn wire with the n. The distribution of Dw varied with the n. The center region exhibited the maximum Dw and the surface region exhibited the minimum value during the drawing process, which is consistent with the previous results of Cao et al. [41]. The maximum and average Dw values decreased as the n of the specimen increased, as shown in Figure 10b,c, because σeff increased with increasing n of the specimen (Figure 9). This implies that the non-hardening wire was easy to fracture in the center region during wire drawing. In other words, the probability of a central burst increased during wire drawing as the n of the specimen decreased. In fact, there are several reports regarding the central burst in metals with low n values, whereas there are no such reports in metals with high n values [42,43,44]. In addition, Haghighat and Parghazeh [45] reported that the probability of a central burst decreased with increasing the n of the specimen during rod extrusion.
Figure 11 shows a comparison of Ft with the n of the specimen. Ft increased with the n of the wire. The non-hardening wire exhibited the minimum Ft of 19.8 kN, and the linear-hardening wire exhibited the maximum Ft of 22.5 kN. Ft showed a pattern similar to that of ΔTt with the n. Figure 12 shows the relationship between Ft and ΔTt during wire drawing. Specifically, Ft and ΔTt exhibited a linear relationship as follows:
F t = 9.83 + 0.27 Δ T t ,                 R 2 = 0.98
Vega et al. [7] suggested that Ft varies linearly with the temperature rise of die based on the experimental drawing test, which is consistent with the present result.

5. Discussion

The most prominent result of this study is the higher ΔTt, Ft, and εeff values of high-hardening wires, compared with those of low-hardening wires during wire drawing. In other words, ΔTt, Ft, and εeff increased with the n of the wire.
According to classical theory [46], the Ft for wire drawing includes three factors: an ideal drawing force (Fi) by the homogeneous deformation, an additional drawing force caused by the frictional effect (Ff) at the specimen and die interface, and redundant effect (Fr) owing to the die shape. Accordingly, Ft can be calculated from the three aforementioned forces, as follows:
Ft = Fi + Ff + Fr
In addition, ΔTt comprises ΔTi, temperature increase caused by frictional work (ΔTf), and temperature increase caused by redundant work (ΔTr) as follows:
ΔTt = ΔTi + ΔTf + ΔTr
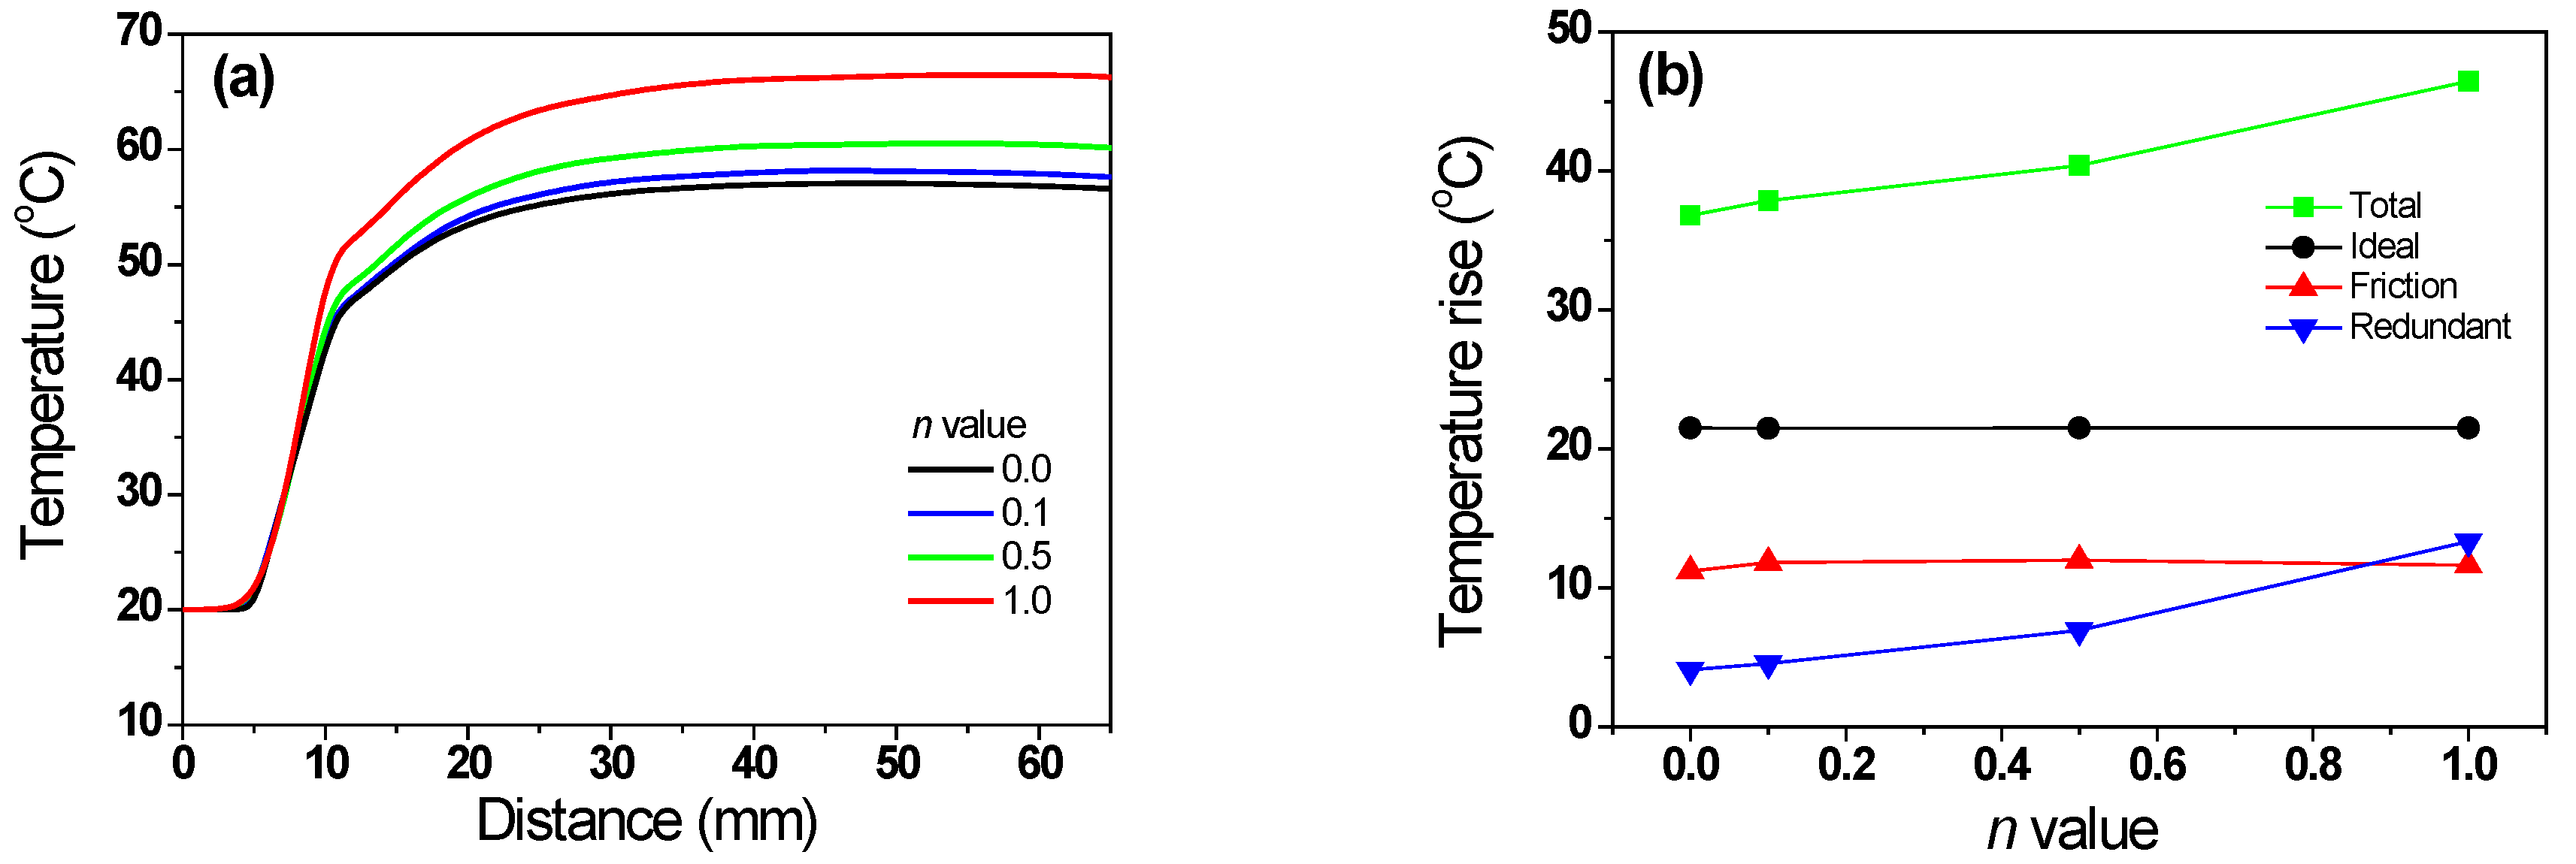
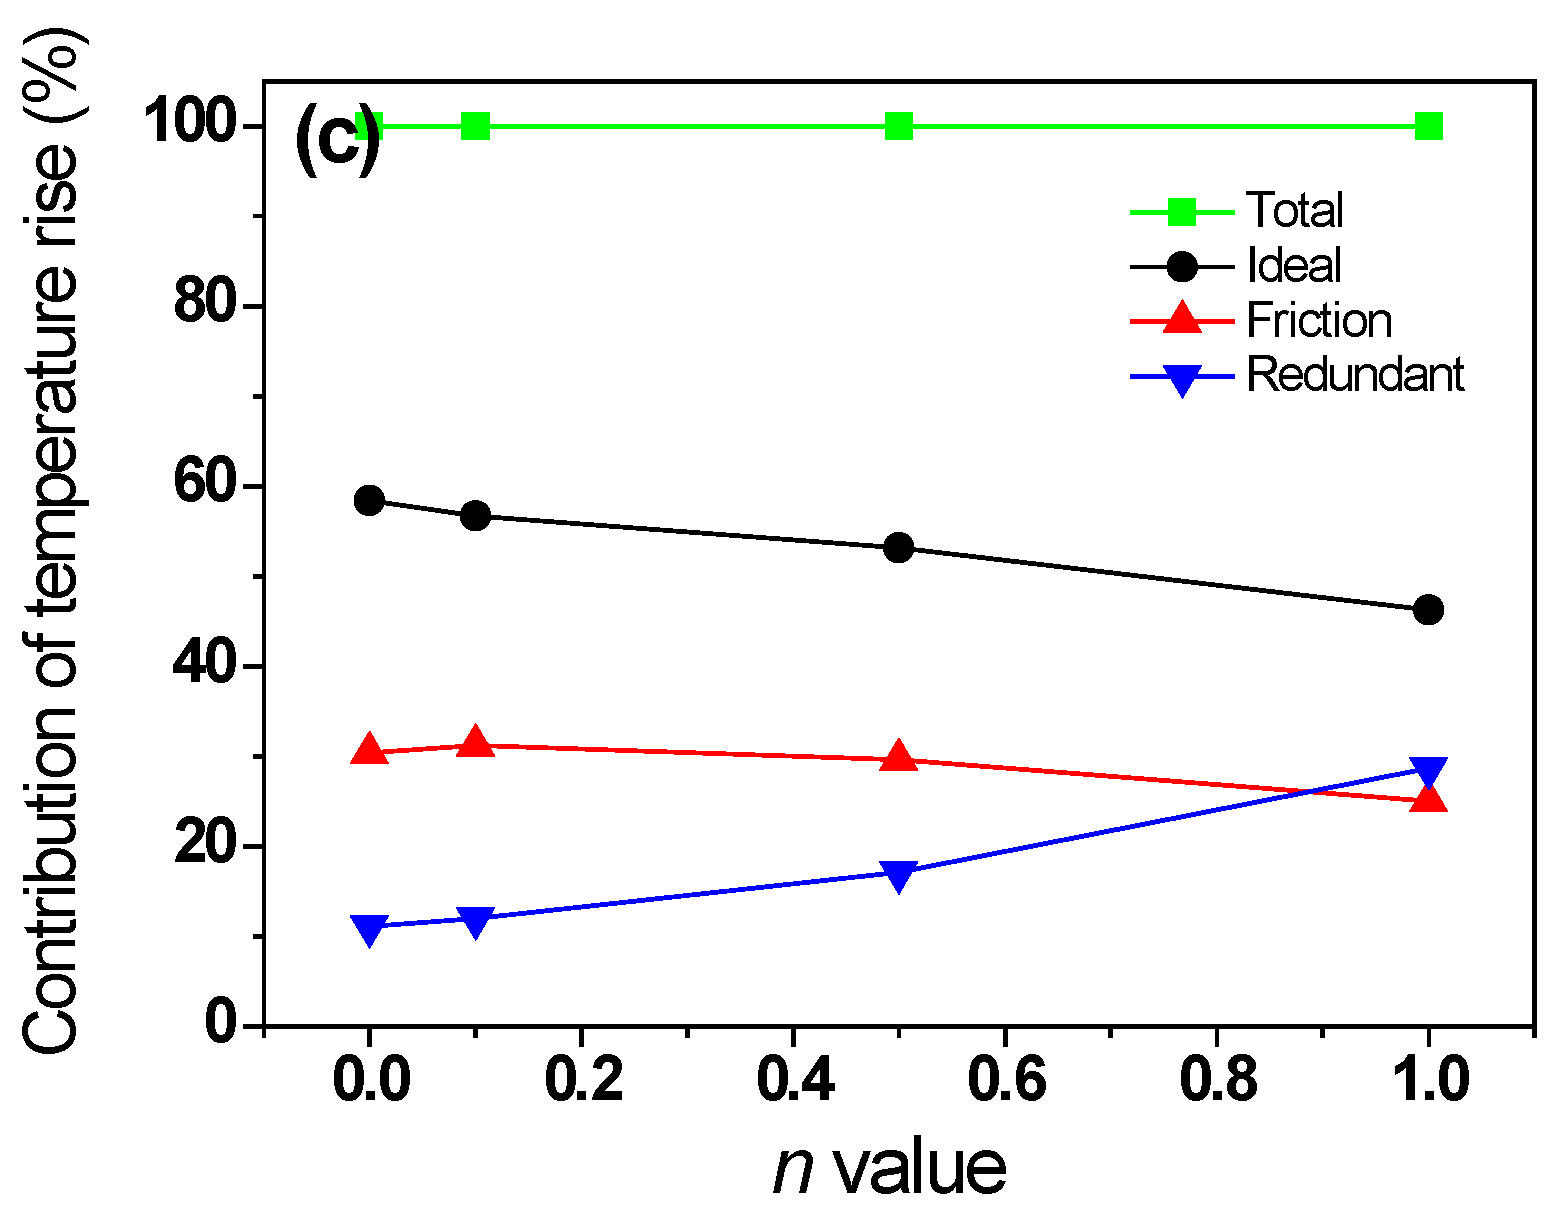
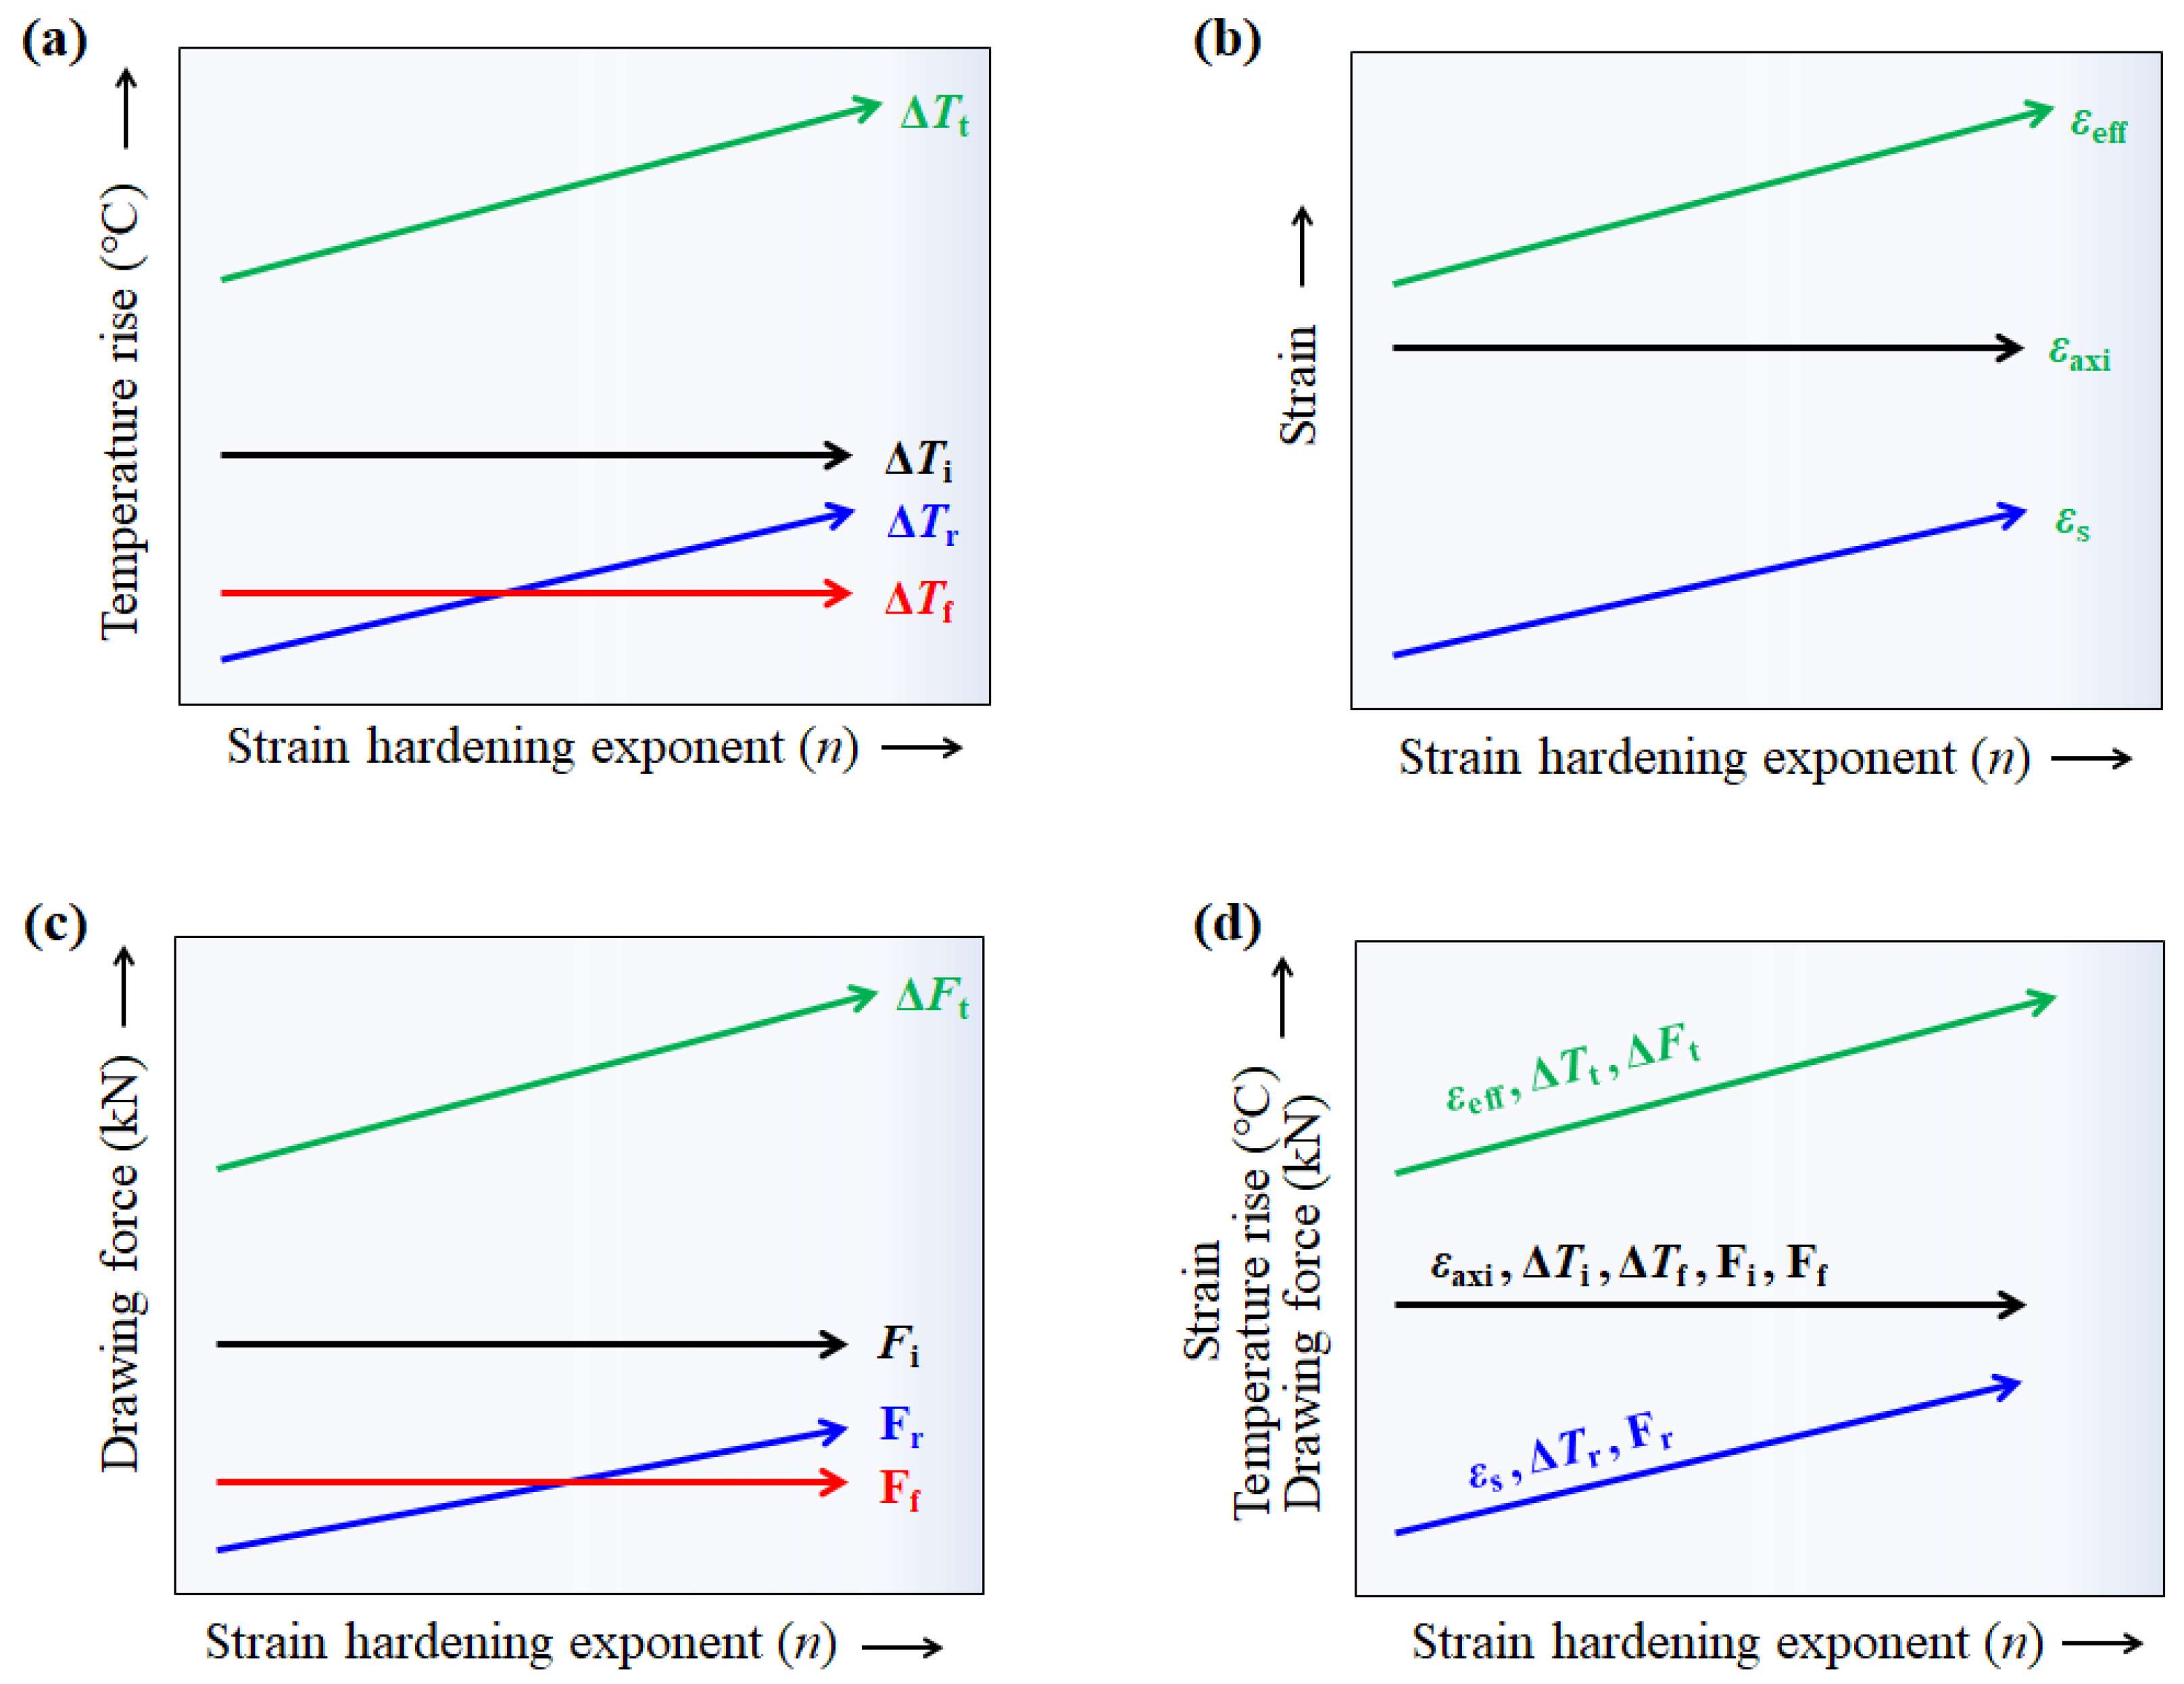
where ΔTi was associated with Fi; thus, ΔTi can be calculated using Equation (5). In this study, the flow stresses of the four specimens were designed to generate the same ΔTi regardless of the n; therefore, the initial increase in Tc of all specimens was the same, as shown in Figure 5b. The ΔTr of the four specimens can be calculated using the profile of εeff (Figure 6b), because it can include the additional redundant work due to the conical die design. The ΔTr of the four specimens was obtained using Figure 6b and Equation (5). Finally, ΔTf was calculated using Equation (10). From the FEA, the average temperature can be defined as the temperature of the quarter region in the wire, and these temperature profiles were shown in Figure 13a with the n of the wire. Figure 13b compares the ΔTt, ΔTi, ΔTf, and ΔTr with the n of the specimen. As expected, ΔTi remained unchanged regardless of the wire. Additionally, ΔTf was similar for all four specimens. However, ΔTr increased with the n of the specimen. For example, the ΔTr of the non-hardening wire was 4.1 °C, which is 11.2% of ΔTt. By contrast, the ΔTr of the linear-hardening wire was 13.3 °C, which is 28.8% of ΔTt. Therefore, the increase in ΔTt of the specimen with the n is associated with redundant work, as schematically shown in Figure 14a. Notably, εs increased with the n of the specimen, as shown in Figure 14b and based on Figure 7, and this εs resulted in redundant work, leading to high ΔTr.
Similarly, the increase in Ft with the n of the specimen is associated closely with Fr during wire drawing (Figure 14c). Figure 14d summarizes the influence of εs on the temperature rise and drawing force with the n of the wire. The increases in temperature and drawing force with the n of the wire were strongly related to εs during wire drawing, and not εaxi because εaxi, ΔTi, ΔTf, Fi, and Ff remained almost constant regardless of the n of the wire. Finally, it should be noted that the drawing speed should be decreased with increasing n of the specimen, because the product quality, as well as die wear, is associated with the temperature increase of the wire in the deformation zone [3,47]. From the results of this study, engineers need to choose optimum drawing conditions based on the variation of the drawing force and wire temperature with process conditions and materials. However, it is not easy to present quantitative suggestions for engineers based on the results of this study. Currently, various studies are being conducted to find optimal process conditions using artificial intelligence [48,49]. Further research under more industrially specific conditions is required to design the optimum wire-drawing process with n value of material.

6. Conclusions

Temperature rise of a specimen is a significant issue in drawing industries for wire, rod, and bar products, because an excessive increase in temperature during the drawing process can deteriorate the product quality and die life. The effect of the n value of a wire on the temperature and strain distributions is investigated during wire drawing using finite element analysis and experiments. Based on a comparative study with n values of the wire with 0.0, 0.1, 0.5, and 1.0, the following conclusions were inferred:
  • The temperature increase of the wire augmented as the n of the specimen increased despite the same amount of ideal plastic deformation, which is associated closely with redundant work. The shear strain increased with the n of the specimen, and this shear strain generated redundant work, leading to a high temperature rise.
  • The drawing force increased with the n of the wire during wire drawing, which is related to the high redundant work with increasing n of the wire. In addition, the drawing force varied linearly with the temperature rise of the wire.
  • The damage value in the center region of the wire reduced with increasing n of the wire during wire drawing, because the effective stress increased with increasing the n of the wire
  • The drawing speed should be reduced and/or the cooling of wire and die should be strengthened during wire drawing with increasing n value of the wire, because product quality and die wear are highly associated with the temperature rise of the wire in the deformation zone.
  • From the results of the present study, engineers need to choose optimum drawing condition based on the variation of the drawing force and wire temperature with process conditions and materials. However, it is not easy to present quantitative suggestions for engineers based on the results of this study. Further research under more industrially specific conditions is required to design the optimum wire-drawing process with n value of material.

Funding

This study was supported by the National Research Foundation of Korea (NRF) grant funded by the Korea government (MSIT, South Korea) (No. 2021R1A2C1011700).

Institutional Review Board Statement

Not applicable.

Informed Consent Statement

Not applicable.

Data Availability Statement

Not applicable.

Conflicts of Interest

The author declares no conflict of interest.

References

  1. Lee, S.K.; Lee, S.B.; Kim, B.M. Process design of multi-stage wet wire drawing for improving the drawing speed for 0.72 wt% C steel wire. J. Mater. Process. Technol. 2010, 210, 776–783. [Google Scholar] [CrossRef]
  2. Lee, S.K.; Kim, D.W.; Jeong, M.S.; Kim, B.M. Evolution of axial surface residual stress in 0.82 carbon steel wire during multi pass drawing process considering heat generation. Mater. Des. 2012, 34, 363–371. [Google Scholar] [CrossRef]
  3. Lee, S.K.; Ko, D.C.; Kim, B.M. Pass schedule of wire drawing process to prevent delamination for high strength steel cord wire. Mater. Des. 2009, 30, 2919–2927. [Google Scholar] [CrossRef]
  4. Jo, H.H.; Lee, S.K.; Kim, M.A.; Kim, B.M. Pass schedule design system in the dry wire-drawing process of high carbon steel. Proc. Inst. Mech. Eng. Part B J. Eng. Manuf. 2002, 216, 365–373. [Google Scholar] [CrossRef]
  5. Haddi, A.; Imad, A.; Vega, G. Analysis of temperature and speed effects on the drawing stress for improving the wire drawing process. Mater. Des. 2011, 32, 4310–4315. [Google Scholar] [CrossRef]
  6. Cetinarslan, C.S.; Guzey, A. Tensile properties of cold-drawn low-carbon steel wires under different process parameters. Mater. Technol. 2013, 47, 245–252. [Google Scholar]
  7. Vega, G.; Haddi, A.; Imad, A. Temperature effects on wire-drawing process: Experimental investigation. Int. J. Mater. Form. 2009, 2, 229–232. [Google Scholar] [CrossRef]
  8. Suliga, M.; Kruzel, R.; Garstka, T.; Gazdowicz, J. The influence of drawing speed on structure changes in high carbon steel wires. Metalurgija 2015, 54, 161–164. [Google Scholar]
  9. Pilarczyk, J.W.; Markowski, J.; Dyja, H.; Golis, B. FEM modeling of drawing of wires for prestressed concrete. Wire J. Int. 2004, 37, 118–123. [Google Scholar]
  10. Nemec, I.; Golis, B.; Pilarczyk, J.W.; Budzik, R.; Waszkielewicz, W. Effect of high-speed drawing on properties of high-carbon steel wires. Wire J. Int. 2007, 40, 63–68. [Google Scholar]
  11. Zhang, G.L.; Wang, Z.W.; Zhang, S.H.; Cheng, M.; Song, H.W. A fast optimization approach for multipass wire drawing processes based on the analytical model. Proc. Inst. Mech. Eng. Part B J. Eng. Manuf. 2013, 227, 1023–1031. [Google Scholar] [CrossRef]
  12. Hwang, J.K. Effect of drawing speed on microstructure distribution and drawability in twinning-induced plasticity steel during wire drawing. J. Iron Steel Res. Int. 2020, 27, 577–587. [Google Scholar] [CrossRef]
  13. El-Domiaty, A.; Kassab, S.Z. Temperature rise in wire-drawing. J. Mater. Process. Technol. 1998, 83, 72–78. [Google Scholar] [CrossRef]
  14. Dixit, U.S.; Dixit, P.M. An analysis of the steady-state wire drawing of strain-hardening materials. J. Mater. Process. Technol. 1995, 47, 201–229. [Google Scholar] [CrossRef]
  15. Atkins, A.G.; Caddell, R.M. The incorporation of work hardening and redundant work in rod drawing analyses. Int. J. Mech. Sci. 1968, 10, 15–28. [Google Scholar] [CrossRef] [Green Version]
  16. Shi, M.F.; Meuleman, D.J. On certain aspects of strain rate sensitivity of sheet metals. J. Mater. Eng. Perform. 1995, 4, 321–333. [Google Scholar] [CrossRef]
  17. Ghosh, A.K. Strain localization in the diffuse neck in sheet metal. Metall. Trans. 1974, 5, 1607–1616. [Google Scholar] [CrossRef]
  18. Tsuchida, N.; Inoue, T.; Enami, K. Estimations of the true stress and true strain until just before fracture by the stepwise tensile test and bridgman equation for various metals and alloys. Mater. Trans. 2012, 53, 133–139. [Google Scholar] [CrossRef] [Green Version]
  19. Yang, H.K.; Tian, Y.Z.; Zhang, Z.J.; Zhang, Z.F. Different strain rate sensitivities between Fe-22Mn-0.6C and Fe-30Mn-3Si-3Al twinning-induced plasticity steels. Mater. Sci. Eng. A 2016, 655, 251–255. [Google Scholar] [CrossRef]
  20. Shen, Y.F.; Jia, N.; Misra, R.D.K.; Zuo, L. Softening behavior by excessive twinning and adiabatic heating at high strain rate in a Fe-20Mn-0.6C TWIP steel. Acta Mater. 2016, 103, 229–242. [Google Scholar] [CrossRef]
  21. Hwang, J.K. Strain and strain rate hardening effects on the macroscopic shear bands and deformation shape of a caliber-rolled wire. J. Manuf. Process. 2022, 79, 102–114. [Google Scholar] [CrossRef]
  22. Lee, S.Y.; Lee, S.I.; Hwang, B. Effect of strain rate on tensile and serration behaviors of an austenitic Fe-22Mn-0.7C twinning-induced plasticity steel. Mater. Sci. Eng. A 2018, 711, 22–28. [Google Scholar]
  23. Paul, S.K. Non-linear correlation between uniaxial tensile properties and shear-edge hole expansion ratio. J. Mater. Eng. Perform. 2014, 23, 3610–3619. [Google Scholar] [CrossRef]
  24. De Maddi, M.; Spena, P.R. Plastic flow behavior of twinning induced plasticity steel from low to warm temperatures. J. Mater. Res. Technol. 2020, 9, 1708–1719. [Google Scholar] [CrossRef]
  25. Yu, H.Y.; Lee, S.M.; Nam, J.H.; Lee, S.J.; Fabregue, D.; Park, M.H.; Tsuji, N.; Lee, Y.K. Post-uniform elongation and tensile fracture mechanisms of Fe-18Mn-0.6C-xAl twinning-induced plasticity steels. Acta Mater. 2017, 131, 435–444. [Google Scholar] [CrossRef]
  26. Kim, S.J.; Lee, T.; Hwang, J.K. High-strength bolt manufactured by an extrusion-based forming process using twinning-induced plasticity steel. J. Manuf. Process. 2020, 59, 33–42. [Google Scholar] [CrossRef]
  27. Grassel, O.; Kruger, L.; Frommeyer, G.; Meyer, L.W. High strength Fe-Mn-(Al, Si) TRIP/TWIP steels development-properties-application. Int. J. Plast. 2000, 16, 1391–1409. [Google Scholar] [CrossRef]
  28. Bouaziz, O.; Allain, S.; Scott, C.P.; Cugy, P.; Barbier, D. High manganese austenitic twinning induced plasticity steels: A review of the microstructure properties relationships. Curr. Opin. Solid State Mater. Sci. 2011, 15, 141–168. [Google Scholar] [CrossRef]
  29. Hwang, J.K. The temperature distribution and underlying cooling mechanism of steel wire rod in the Stelmor type cooling process. Appl. Therm. Eng. 2018, 142, 311–320. [Google Scholar] [CrossRef]
  30. Wright, R.N. Wire Technology: Process Engineering and Metallurgy; Butterworth-Heinemann: Oxford, UK, 2011. [Google Scholar]
  31. Hwang, J.K.; Son, I.H.; Yoo, J.Y.; Zargaran, A.; Kim, N.J. Effect of reduction of area on microstructure and mechanical properties of twinning-induced plasticity steel during wire drawing. Met. Mater. Int. 2015, 21, 815–822. [Google Scholar] [CrossRef]
  32. Hasani, G.H.; Mahmudi, R.; Karimi-Taheri, A. On the strain inhomogeneity in drawn copper wires. Int. J. Mater. Form. 2010, 3, 59–64. [Google Scholar] [CrossRef]
  33. Cho, D.; Jang, Y.C.; Lee, Y. Evaluation of the prediction ability of ductile fracture criteria over a wide range of drawing conditions. J. Mech. Sci. Technol. 2019, 33, 4245–4254. [Google Scholar] [CrossRef]
  34. Moon, C.; Kim, N. Analysis of wire-drawing process with friction and thermal conditions obtained by inverse engineering. J. Mech. Sci. Technol. 2012, 26, 2903–2911. [Google Scholar] [CrossRef]
  35. Yang, H.K.; Zhang, Z.J.; Dong, F.Y.; Duan, Q.Q.; Zhang, Z.F. Strain rate effects on tensile deformation behaviors for Fe-22Mn-0.6C-(1.5Al) twinning-induced plasticity steel. Mater. Sci. Eng. A 2014, 607, 551–558. [Google Scholar] [CrossRef]
  36. Curtze, S.; Kuokkala, V.T. Dependence of tensile deformation behavior of TWIP steels on stacking fault energy, temperature and strain rate. Acta Mater. 2010, 58, 5129–5141. [Google Scholar] [CrossRef]
  37. Neu, R.W. Performance and characterization of TWIP steels for automotive applications. Mater. Perform. Charact. 2013, 2, 244–284. [Google Scholar] [CrossRef]
  38. Felder, E.; Levrau, C.; Mantel, M.; Truong Dinh, N.G. Identification of the work of plastic deformation and the friction shear stress in wire drawing. Wear 2012, 286–287, 27–34. [Google Scholar] [CrossRef]
  39. Cockcroft, M.G.; Latham, D.J. Ductility and the workability of metals. J. Inst. Met. 1968, 96, 33–39. [Google Scholar]
  40. Oh, S.I.; Chen, C.C.; Kobayashi, S. Ductile Fracture in Axisymmetric Extrusion and Drawing-Part 2: Workability in Extrusion and Drawing. J. Manuf. Sci. Eng. 1979, 101, 36–44. [Google Scholar] [CrossRef]
  41. Cao, T.S.; Bobadilla, C.; Montmitonnet, P.; Bouchard, P.O. A comparative study of three ductile damage approaches for fracture prediction in cold forming processes. J. Mater. Process. Technol. 2015, 216, 385–404. [Google Scholar] [CrossRef]
  42. Haddi, A.; Imad, A.; Vega, G. The influence of the drawing parameters and temperature rise on the prediction of chevron crack formation in wire drawing. Int. J. Fract. 2012, 176, 171–180. [Google Scholar] [CrossRef]
  43. Ko, D.C.; Kim, B.M. The prediction of central burst defects in extrusion and wire drawing. J. Mater. Process. Technol. 2000, 102, 19–24. [Google Scholar] [CrossRef]
  44. Mcallen, P.; Phelan, P. Ductile fracture by central bursts in drawn 2011 aluminium wire. Int. J. Fract. 2005, 135, 19–33. [Google Scholar] [CrossRef]
  45. Haghighat, H.; Parghazeh, A. An investigation into the effect of strain hardening on the central bursting defects in rod extrusion process. Int. J. Adv. Manuf. Technol. 2017, 93, 1127–1137. [Google Scholar] [CrossRef]
  46. Caddell, R.M.; Atkins, A.G. Optimum Die Angles and Maximum Attainable Reductions in Rod-Drawing. J. Eng. Ind. 1969, 9, 664–671. [Google Scholar] [CrossRef]
  47. Hollinger, S.; Depraetere, E.; Giroux, O. Wear mechanism of tungsten carbide dies during wet drawing of steel tyre cords. Wear 2003, 255, 1291–1299. [Google Scholar] [CrossRef]
  48. Fang, H.; Gao, L.; Zhou, X.; Yan, H.; Wang, Y.; Ji, H. Enhanced compressive strength of preheated limonite pellets with biomass-derived binders. Adv. Powder Technol. 2023, 34, 104154. [Google Scholar] [CrossRef]
  49. Cho, D.; Lee, Y. Development of a machine learning based fast running model to determine rapidly the process conditions in drawing process. Int. J. Automot. Technol. 2019, 20, 9–17. [Google Scholar] [CrossRef]
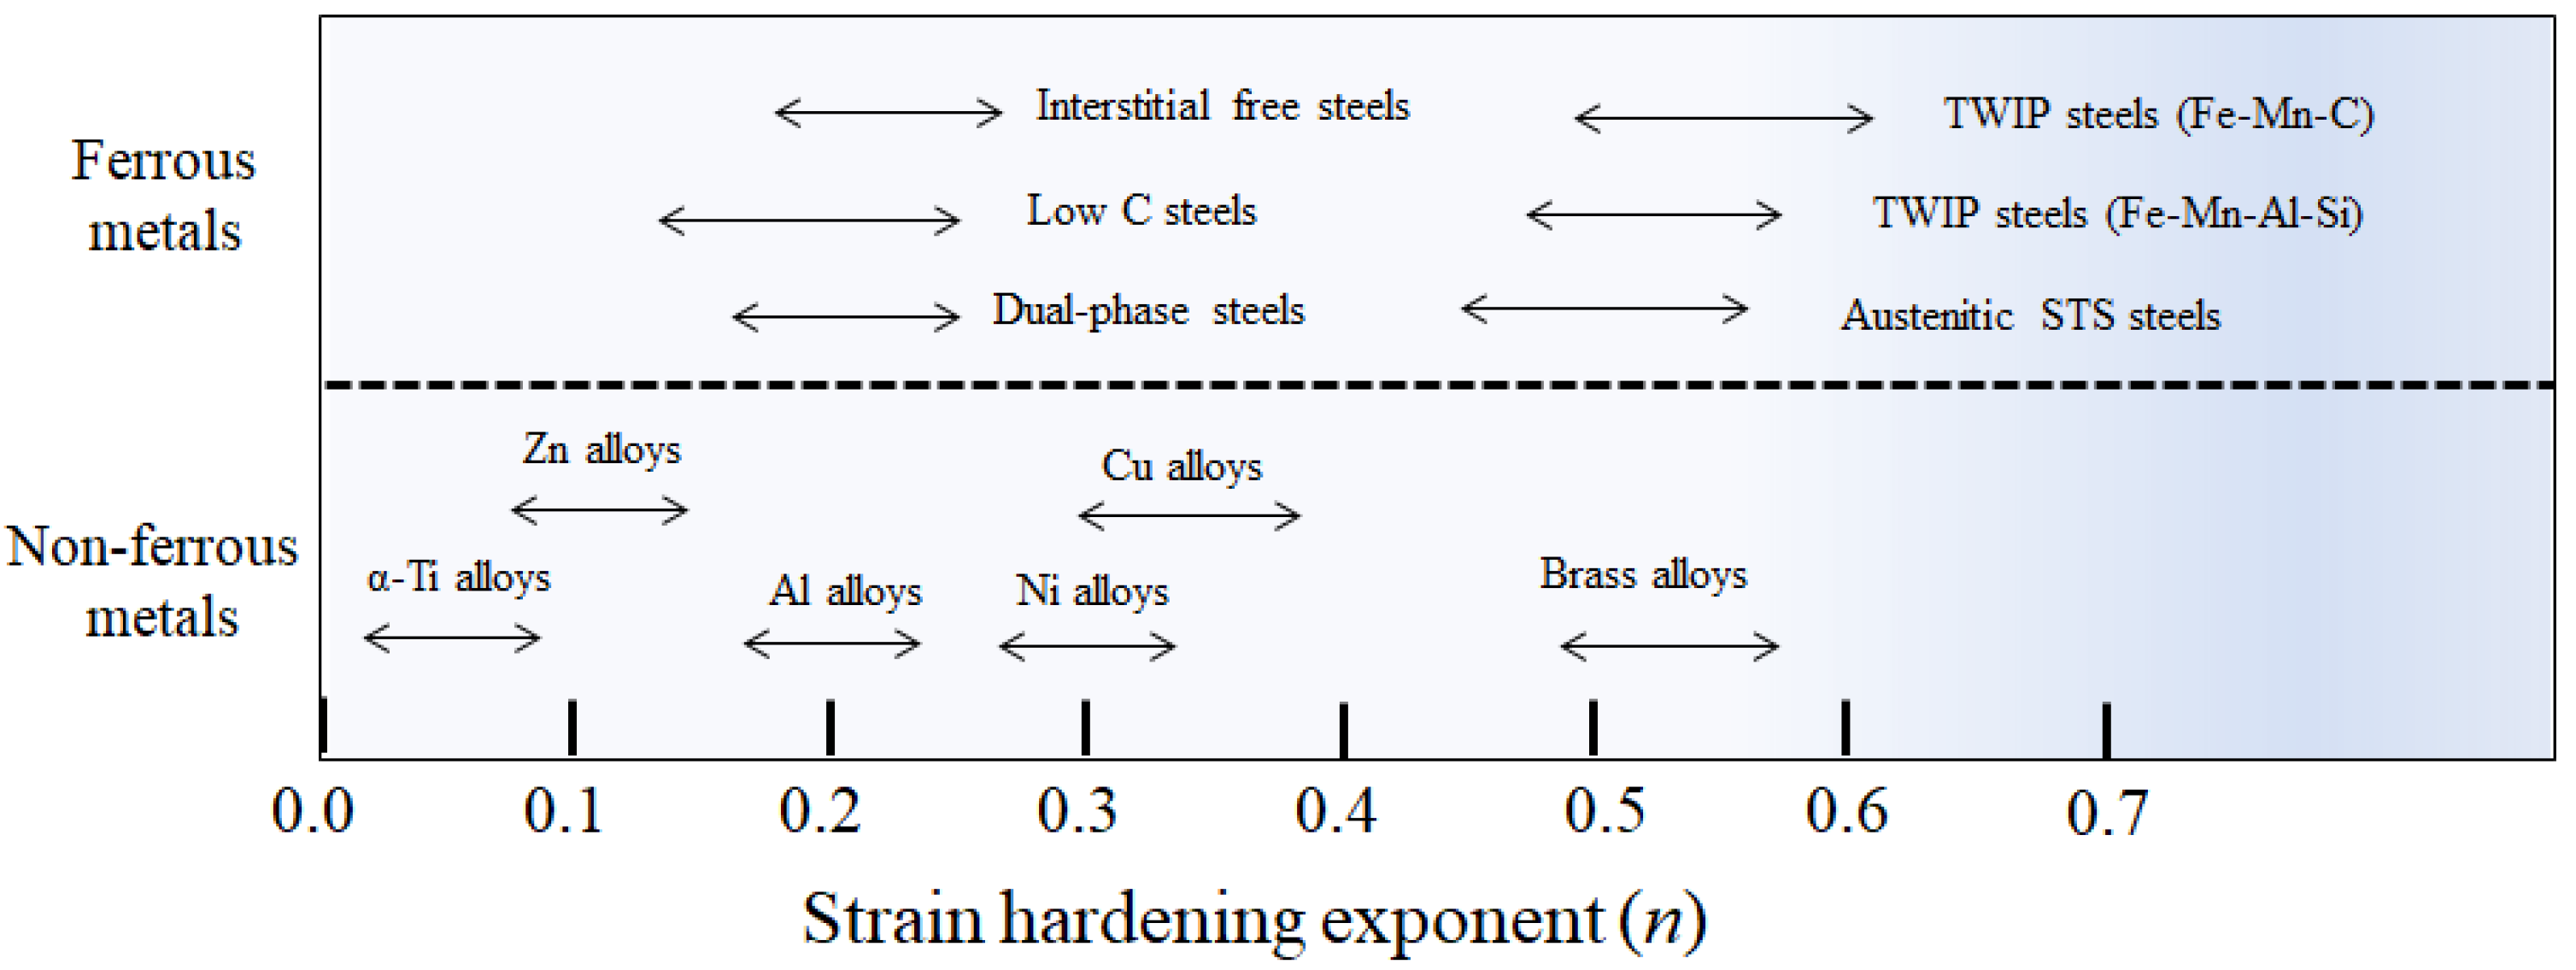
Figure 1. Schematic illustration of n values of various ferrous and non-ferrous metals; adapted from [16,17,18,19,20,21,22,23,24,25].
Materials 16 05203 g001
Figure 2. Comparison of true stress–strain curves of ferritic and TWIP steels used in current study.
Materials 16 05203 g002
Figure 3. Comparison of flow stress of metals with different n values.
Materials 16 05203 g003
Figure 4. Comparison of equilibrium (a) total drawing force and (b) center temperature of two steels between experimental and FEA results.
Materials 16 05203 g004
Figure 5. Comparison of temperature (a) contours and (b) profiles along drawing direction at center and surface regions, and (c) temperature difference between center and surface regions of specimens with different n values; (d) comparison of temperature profiles along radial direction of specimen at 50 mm from die exit and (e) average temperature with different n values.
Materials 16 05203 g005
Figure 6. Comparison of effective strain (a) contours and (b) profiles along radial direction of specimens with different n values. (c) Variation in average effective strain as a function of n of wire.
Materials 16 05203 g006
Figure 7. Comparison of shear strain (a) contours and (b) profiles along radial direction of specimens with different n values. (c) Variation in average shear strain as a function of n of wire.
Materials 16 05203 g007aMaterials 16 05203 g007b
Figure 8. Comparison of axial strain (a) contours and (b) profiles along radial direction of specimens with the different n values. (c) Variation in average axial strain as a function of n of wire.
Materials 16 05203 g008
Figure 9. Comparison of effective stress contours of wire with different n values.
Materials 16 05203 g009
Figure 10. Comparison of damage value (a) contours and (b) profiles along radial direction of specimen with different n values. (c) Variation in average damage value as a function of n of wire.
Materials 16 05203 g010aMaterials 16 05203 g010b
Figure 11. Comparison of (a) profiles and (b) average values of drawing force with different n values of wire.
Materials 16 05203 g011
Figure 12. Relationship between drawing force and temperature increase during wire drawing.
Materials 16 05203 g012
Figure 13. (a) Comparison of FEA results of quarter temperature of wires based on Figure 5a. Variations in (b) amount and (c) percentage of temperature increase of wire with n during wire drawing.
Materials 16 05203 g013aMaterials 16 05203 g013b
Figure 14. Schematic illustration showing effect of n of wire on (a) temperature increase, (b) strain, and (c) drawing force. (d) Schematic illustration showing effect of redundant strain with n of wire on wire-drawing behavior.
Materials 16 05203 g014
Table 1. Operating conditions of wire-drawing test performed in present study.
ParameterValue
Initial wire diameter (do)13.00 mm
Final wire diameter (df)11.63 mm
Reduction in area per pass (Rp)20%
Semi-die angle (θ)
Drawing velocity (Vd)0.07 m/s
Table 2. Thermal properties of specimen and die used in present FEA.
Process ConditionsWire RodDie
Thermal conductivity [k] (W/m/°C)59 [37]70 [38]
Heat capacity [ρCp] (N/mm2/°C)3.6 [36]3.6
Fraction factor (ξ)0.9-
Table 3. Flow stress of specimen used in current simulation.
MaterialFlow Stress (MPa)
Non-hardening wireσ = 391ε0.0
Low-hardening wireσ = 500ε0.1
High-hardening wireσ = 1250ε0.5
Linear-hardening wireσ = 3554ε1.0
Disclaimer/Publisher’s Note: The statements, opinions and data contained in all publications are solely those of the individual author(s) and contributor(s) and not of MDPI and/or the editor(s). MDPI and/or the editor(s) disclaim responsibility for any injury to people or property resulting from any ideas, methods, instructions or products referred to in the content.