
Effect of Imperial Smelting Process Slag Addition in Self Compacting Concrete Concrete on the Efficiency of Electrochemical Chloride Extraction


Abstract
:1. Introduction
2. Materials
3. Test Methods
3.1. Migration Tests on Concrete
3.2. Extraction of Chloride Ions from Concrete
3.3. Determination of the Distribution of Chloride and Hydroxide Ion Concentration at the Depth of Concrete Cover and Determination of Coefficients of Migration and Extraction in Concrete
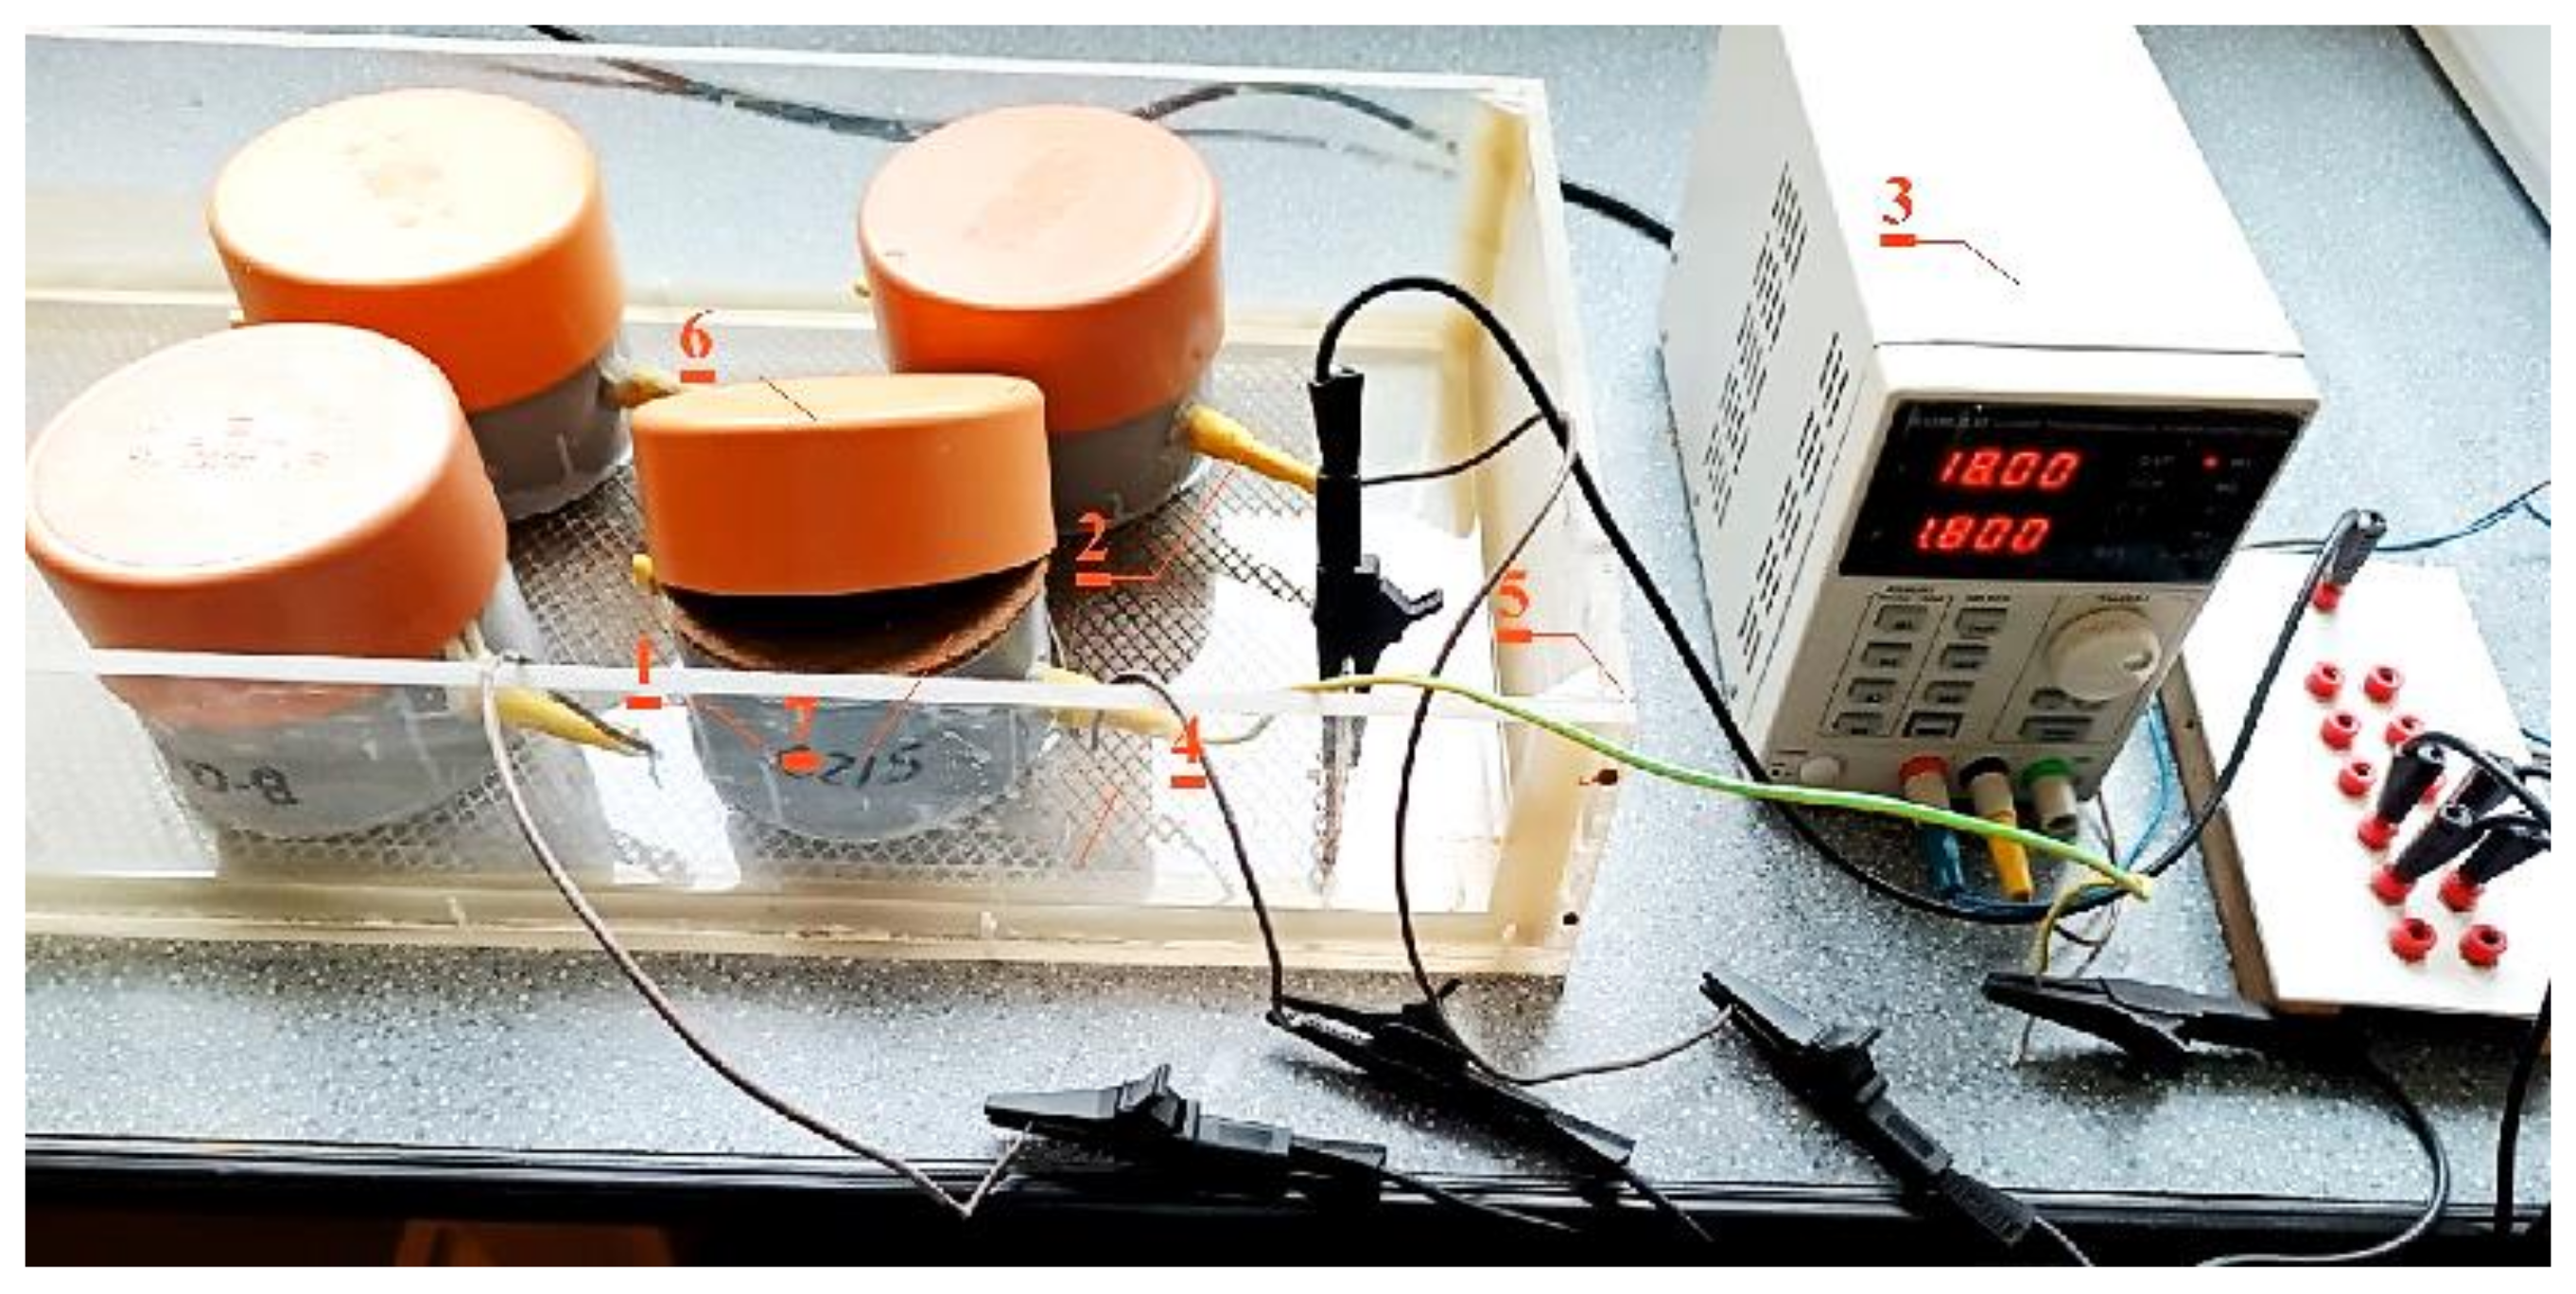
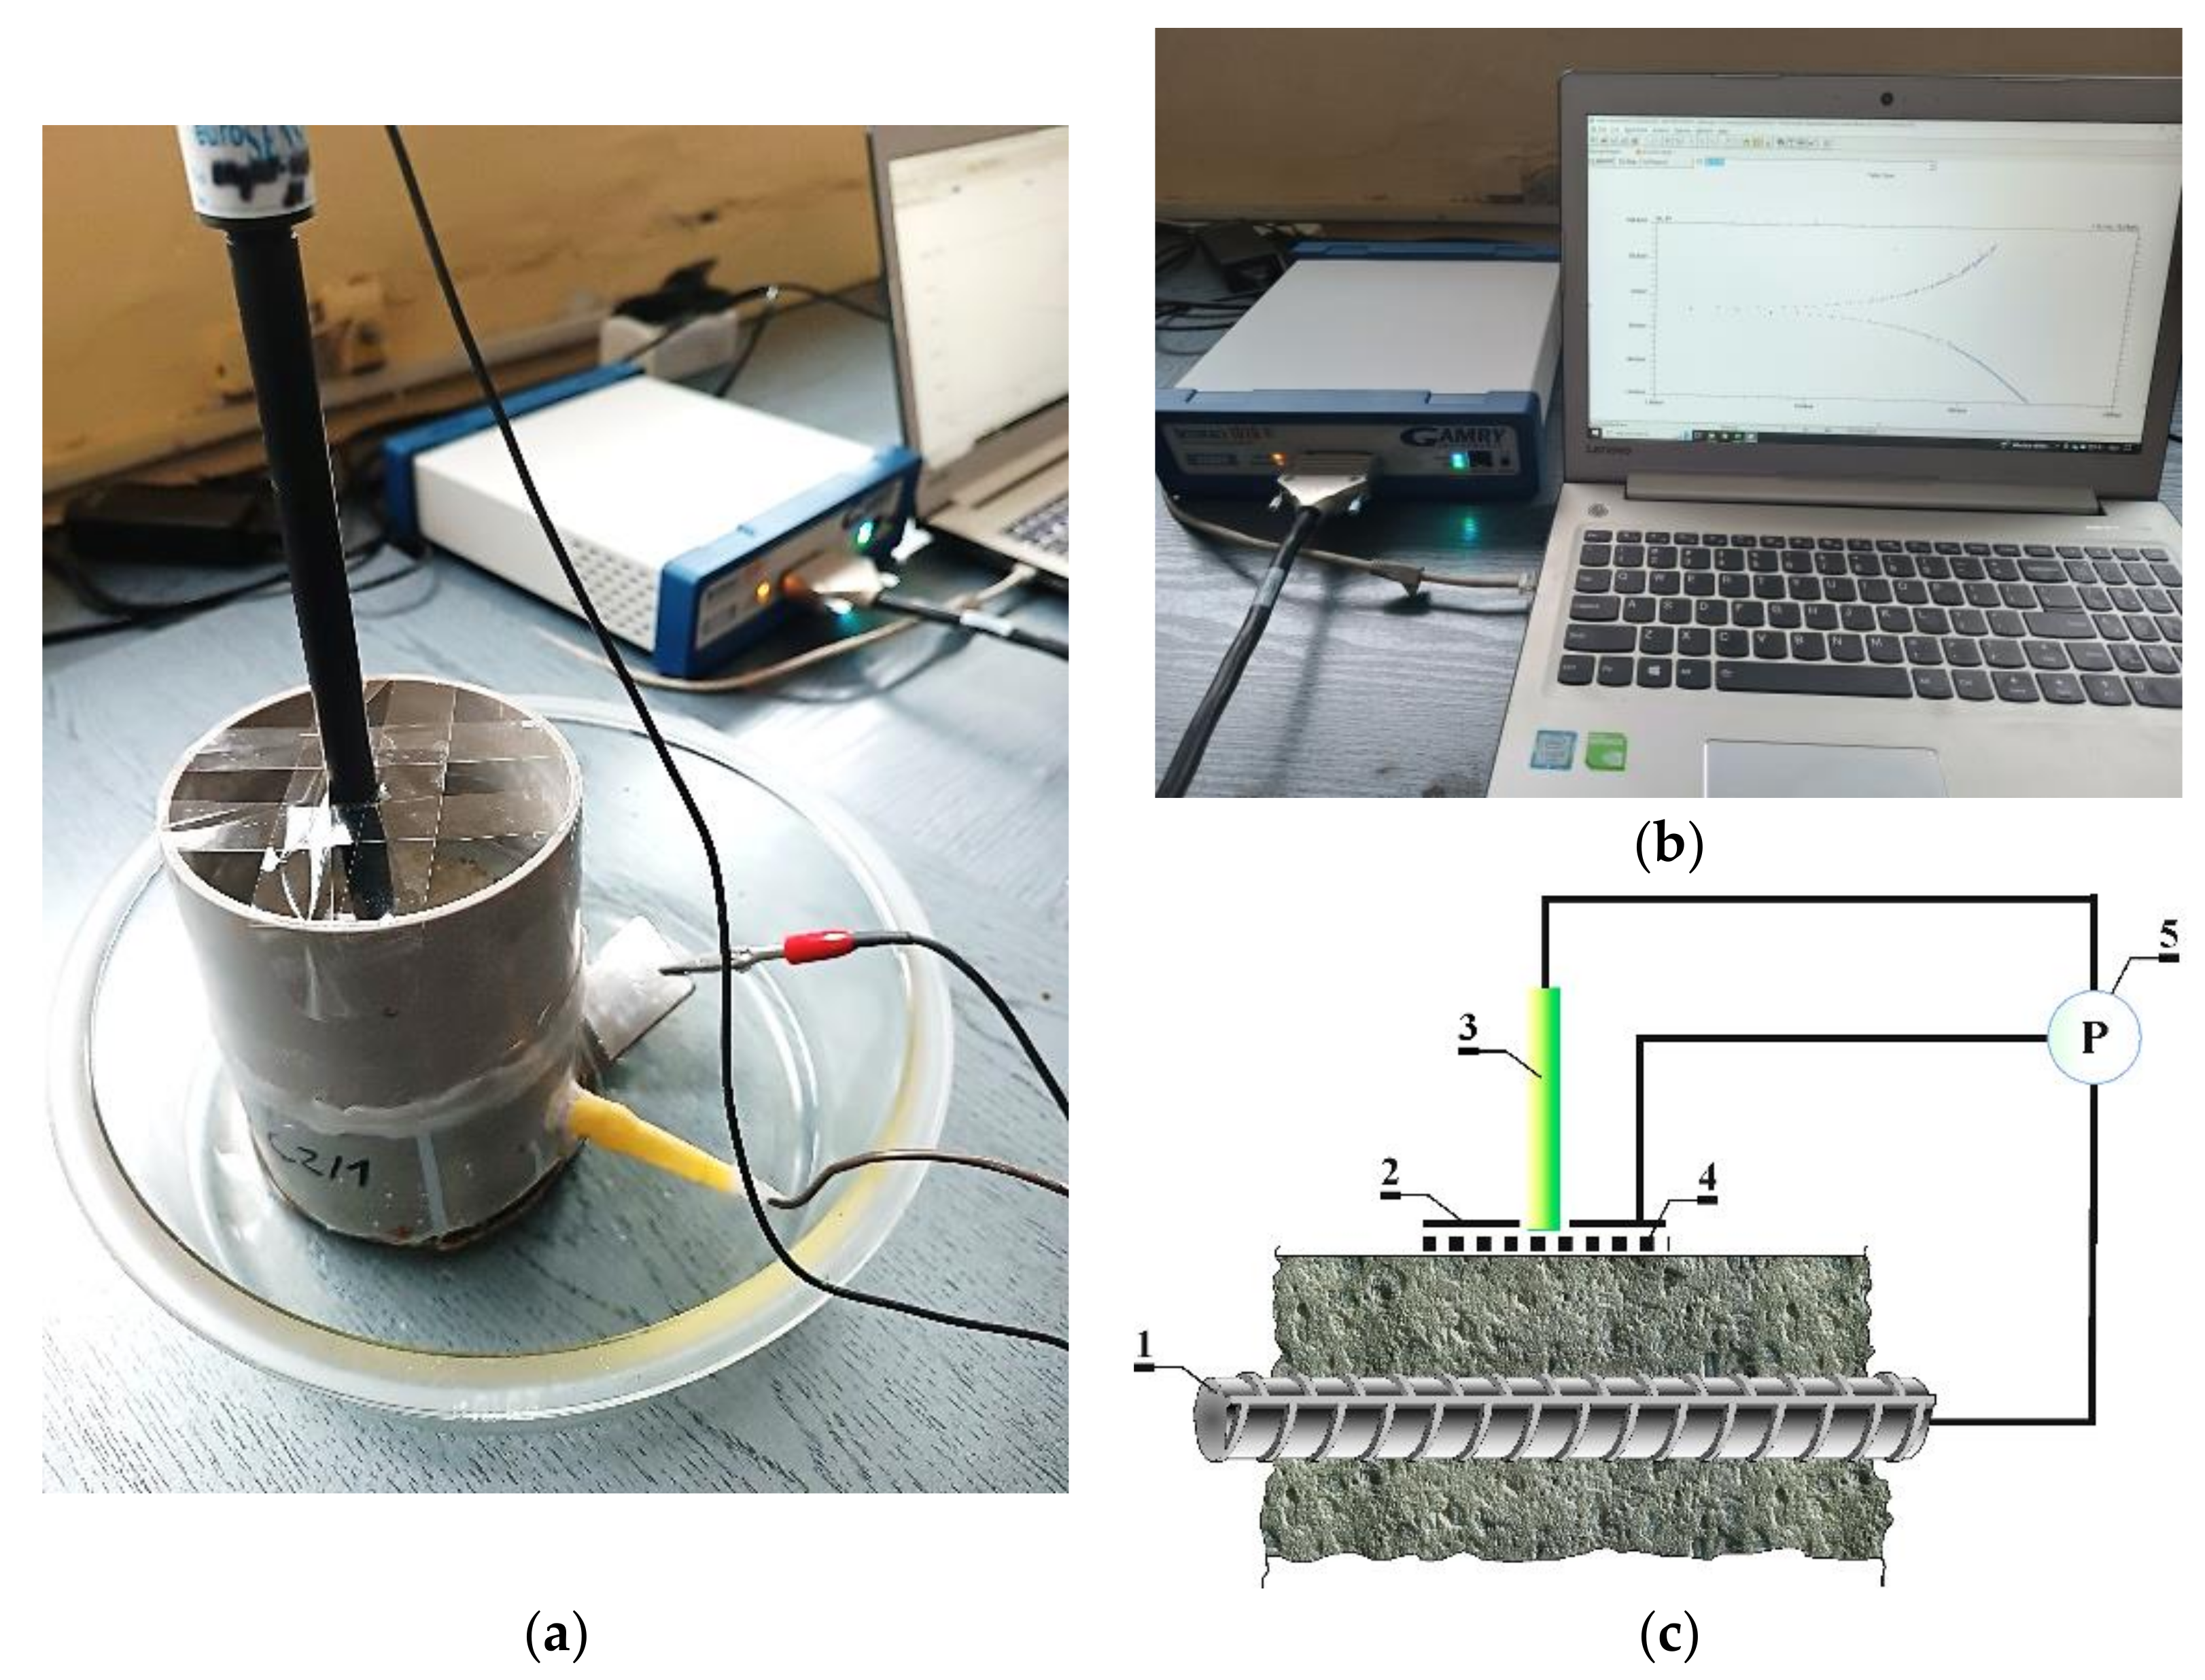
3.4. Monitoring of Reinforcement Corrosion Using the Method of Linear Polarization Resistance (LPR)
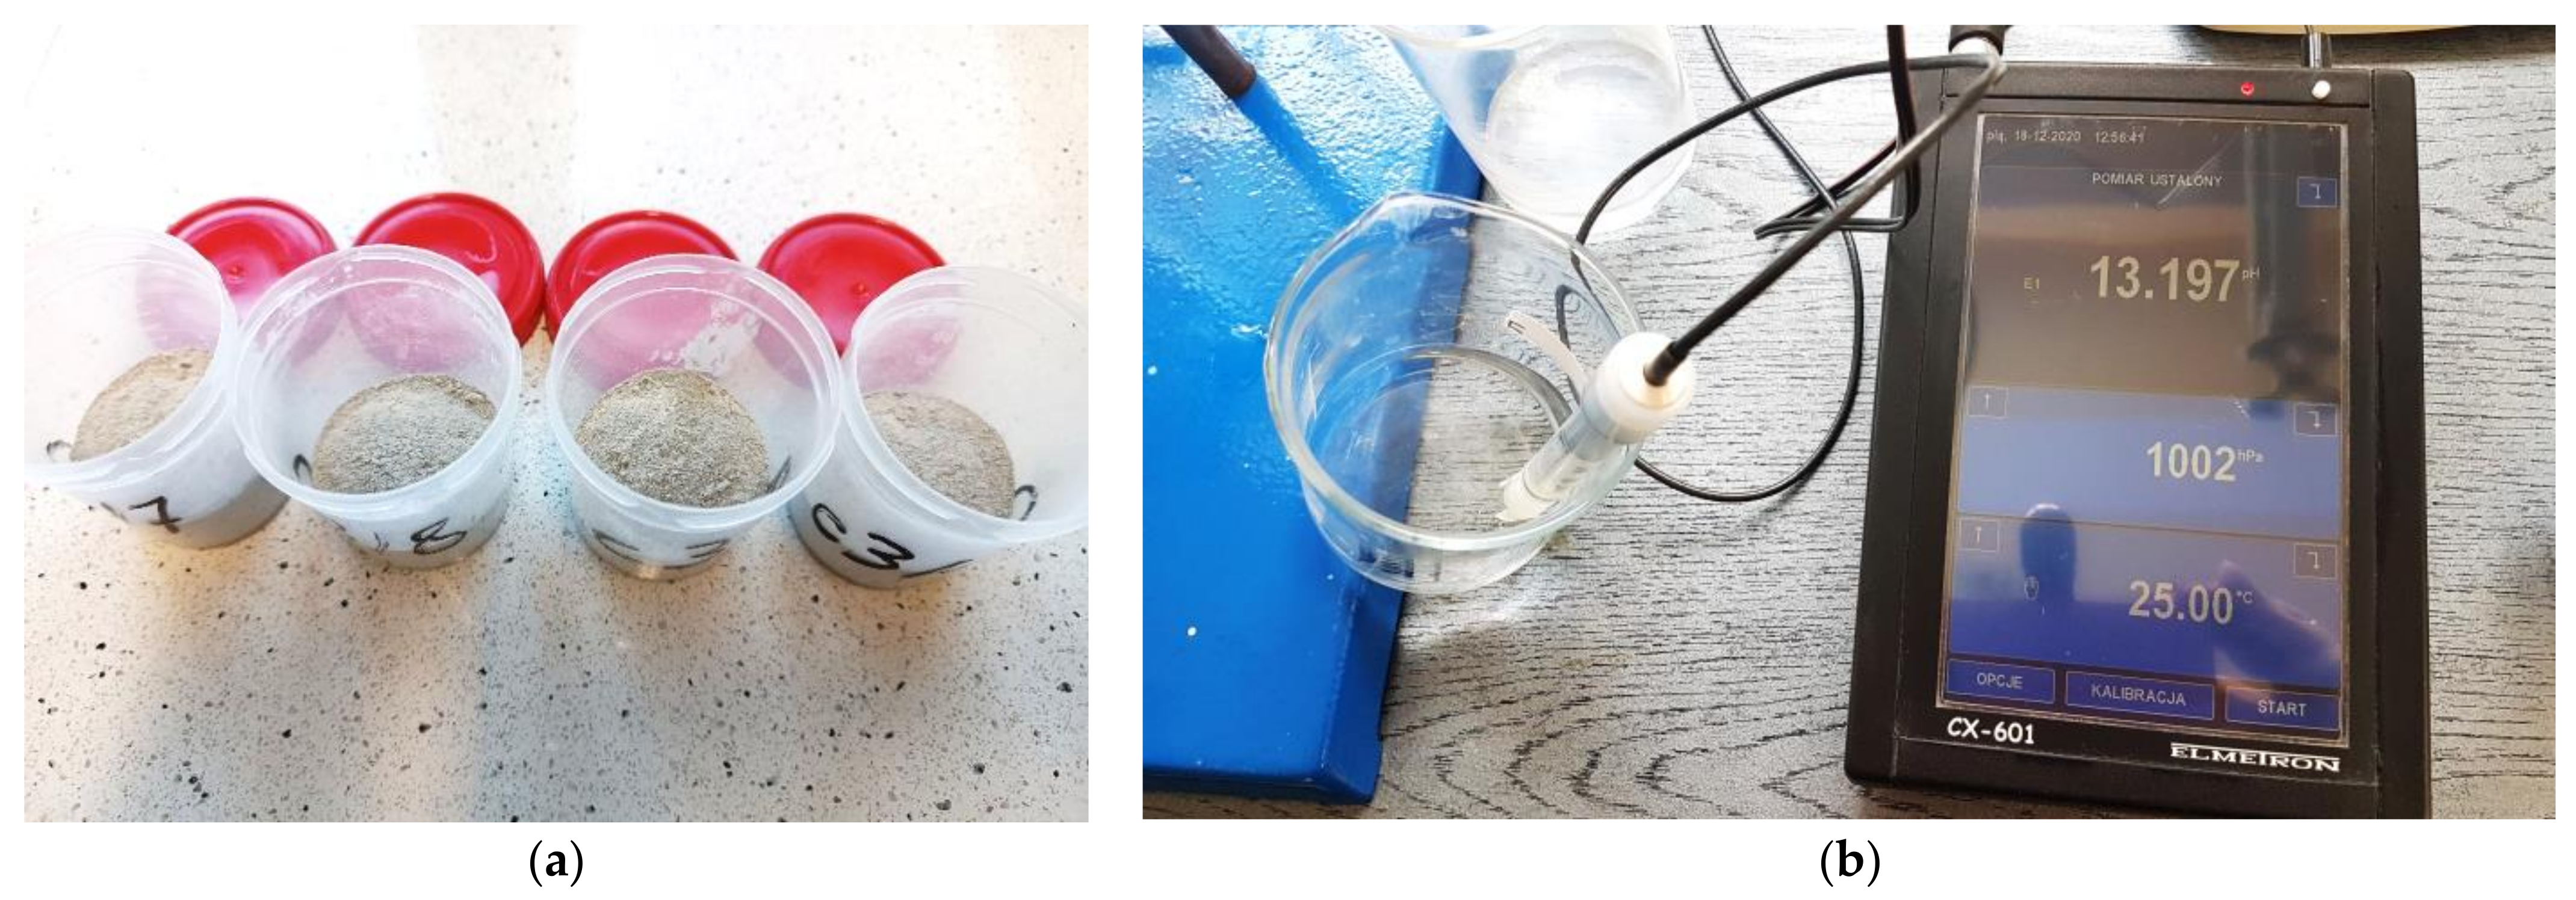
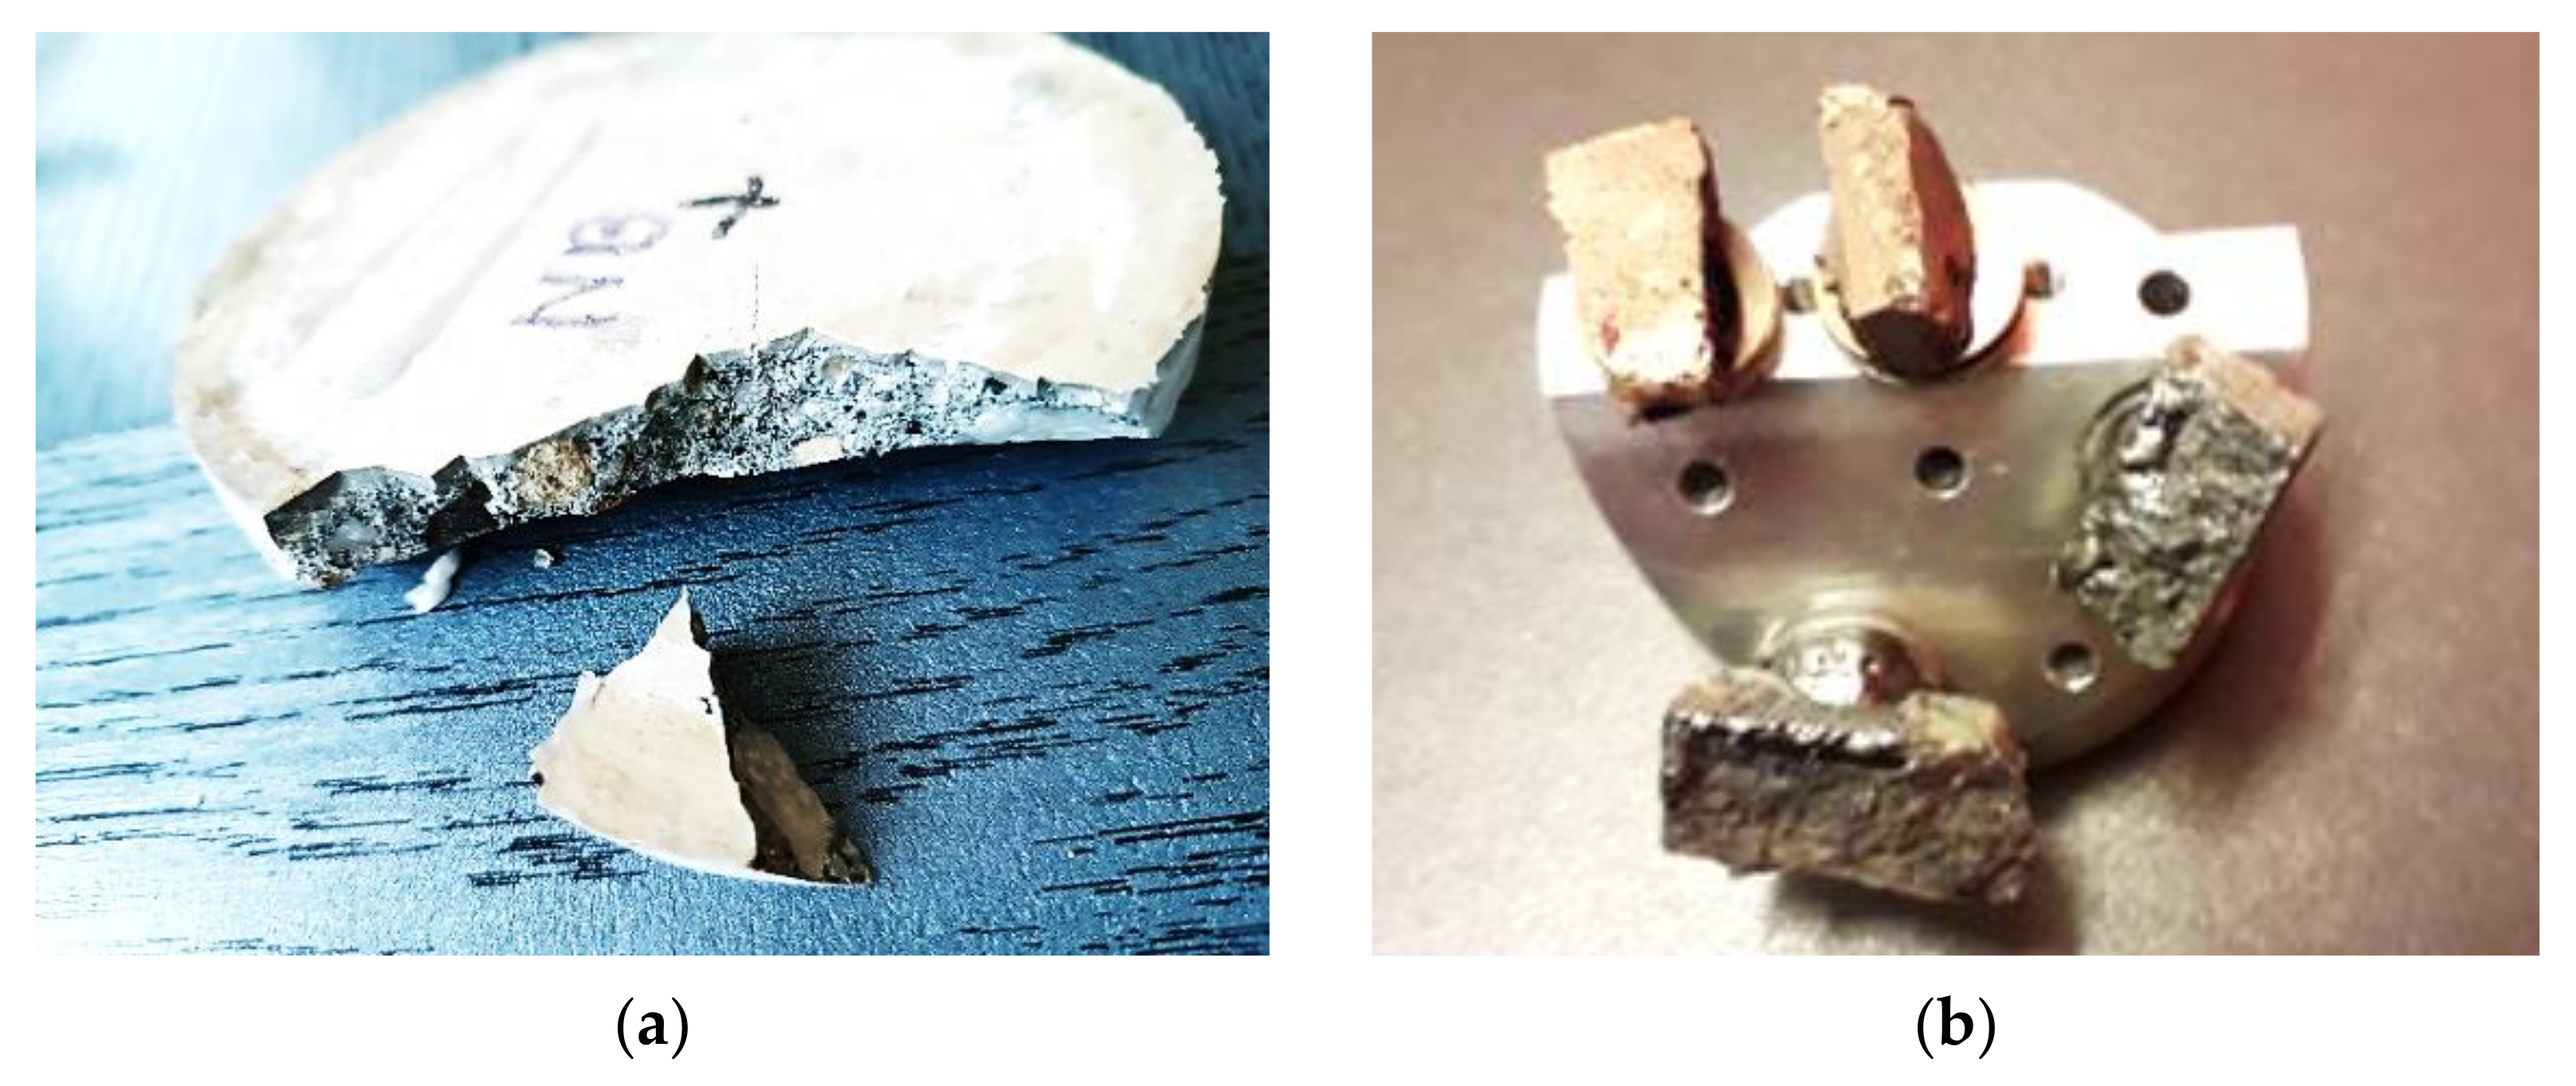
3.5. Analysis of Content of Elements at the Concrete Edge
4. Results and Discussion
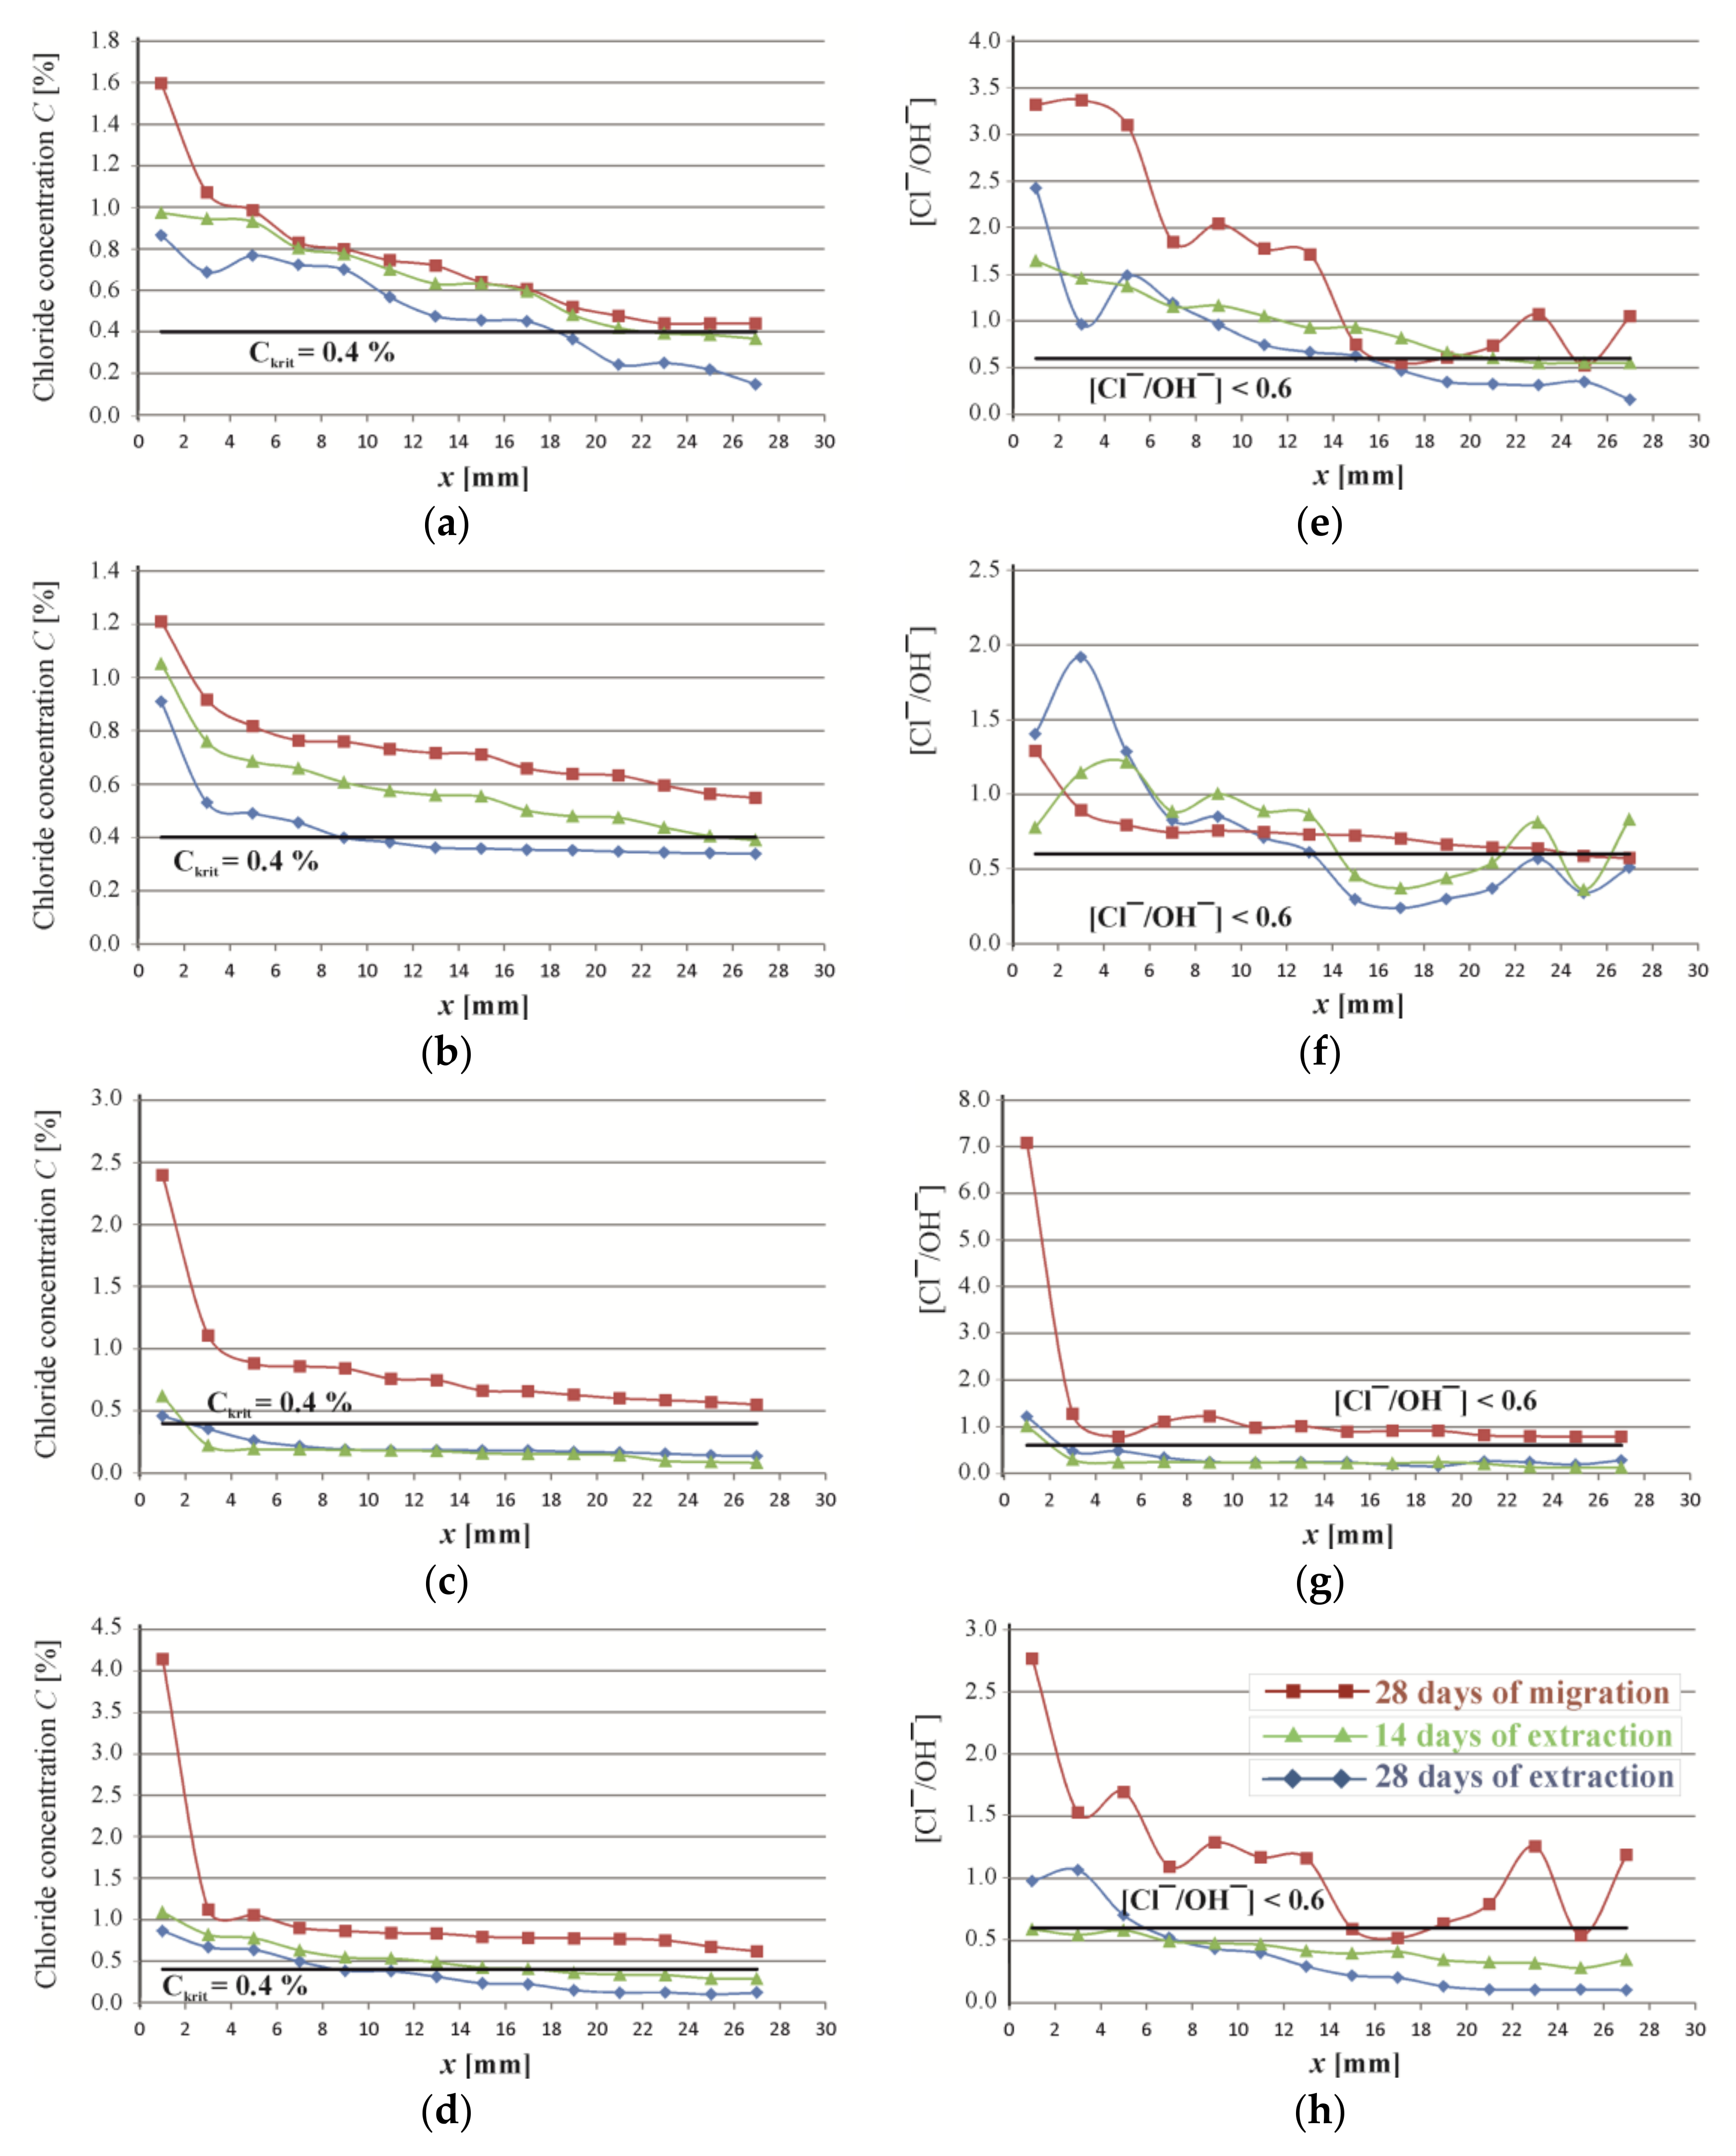
4.1. Concentrations of Chloride and Hydroxide Ions in Concrete during Migration and Extraction of Chlorides
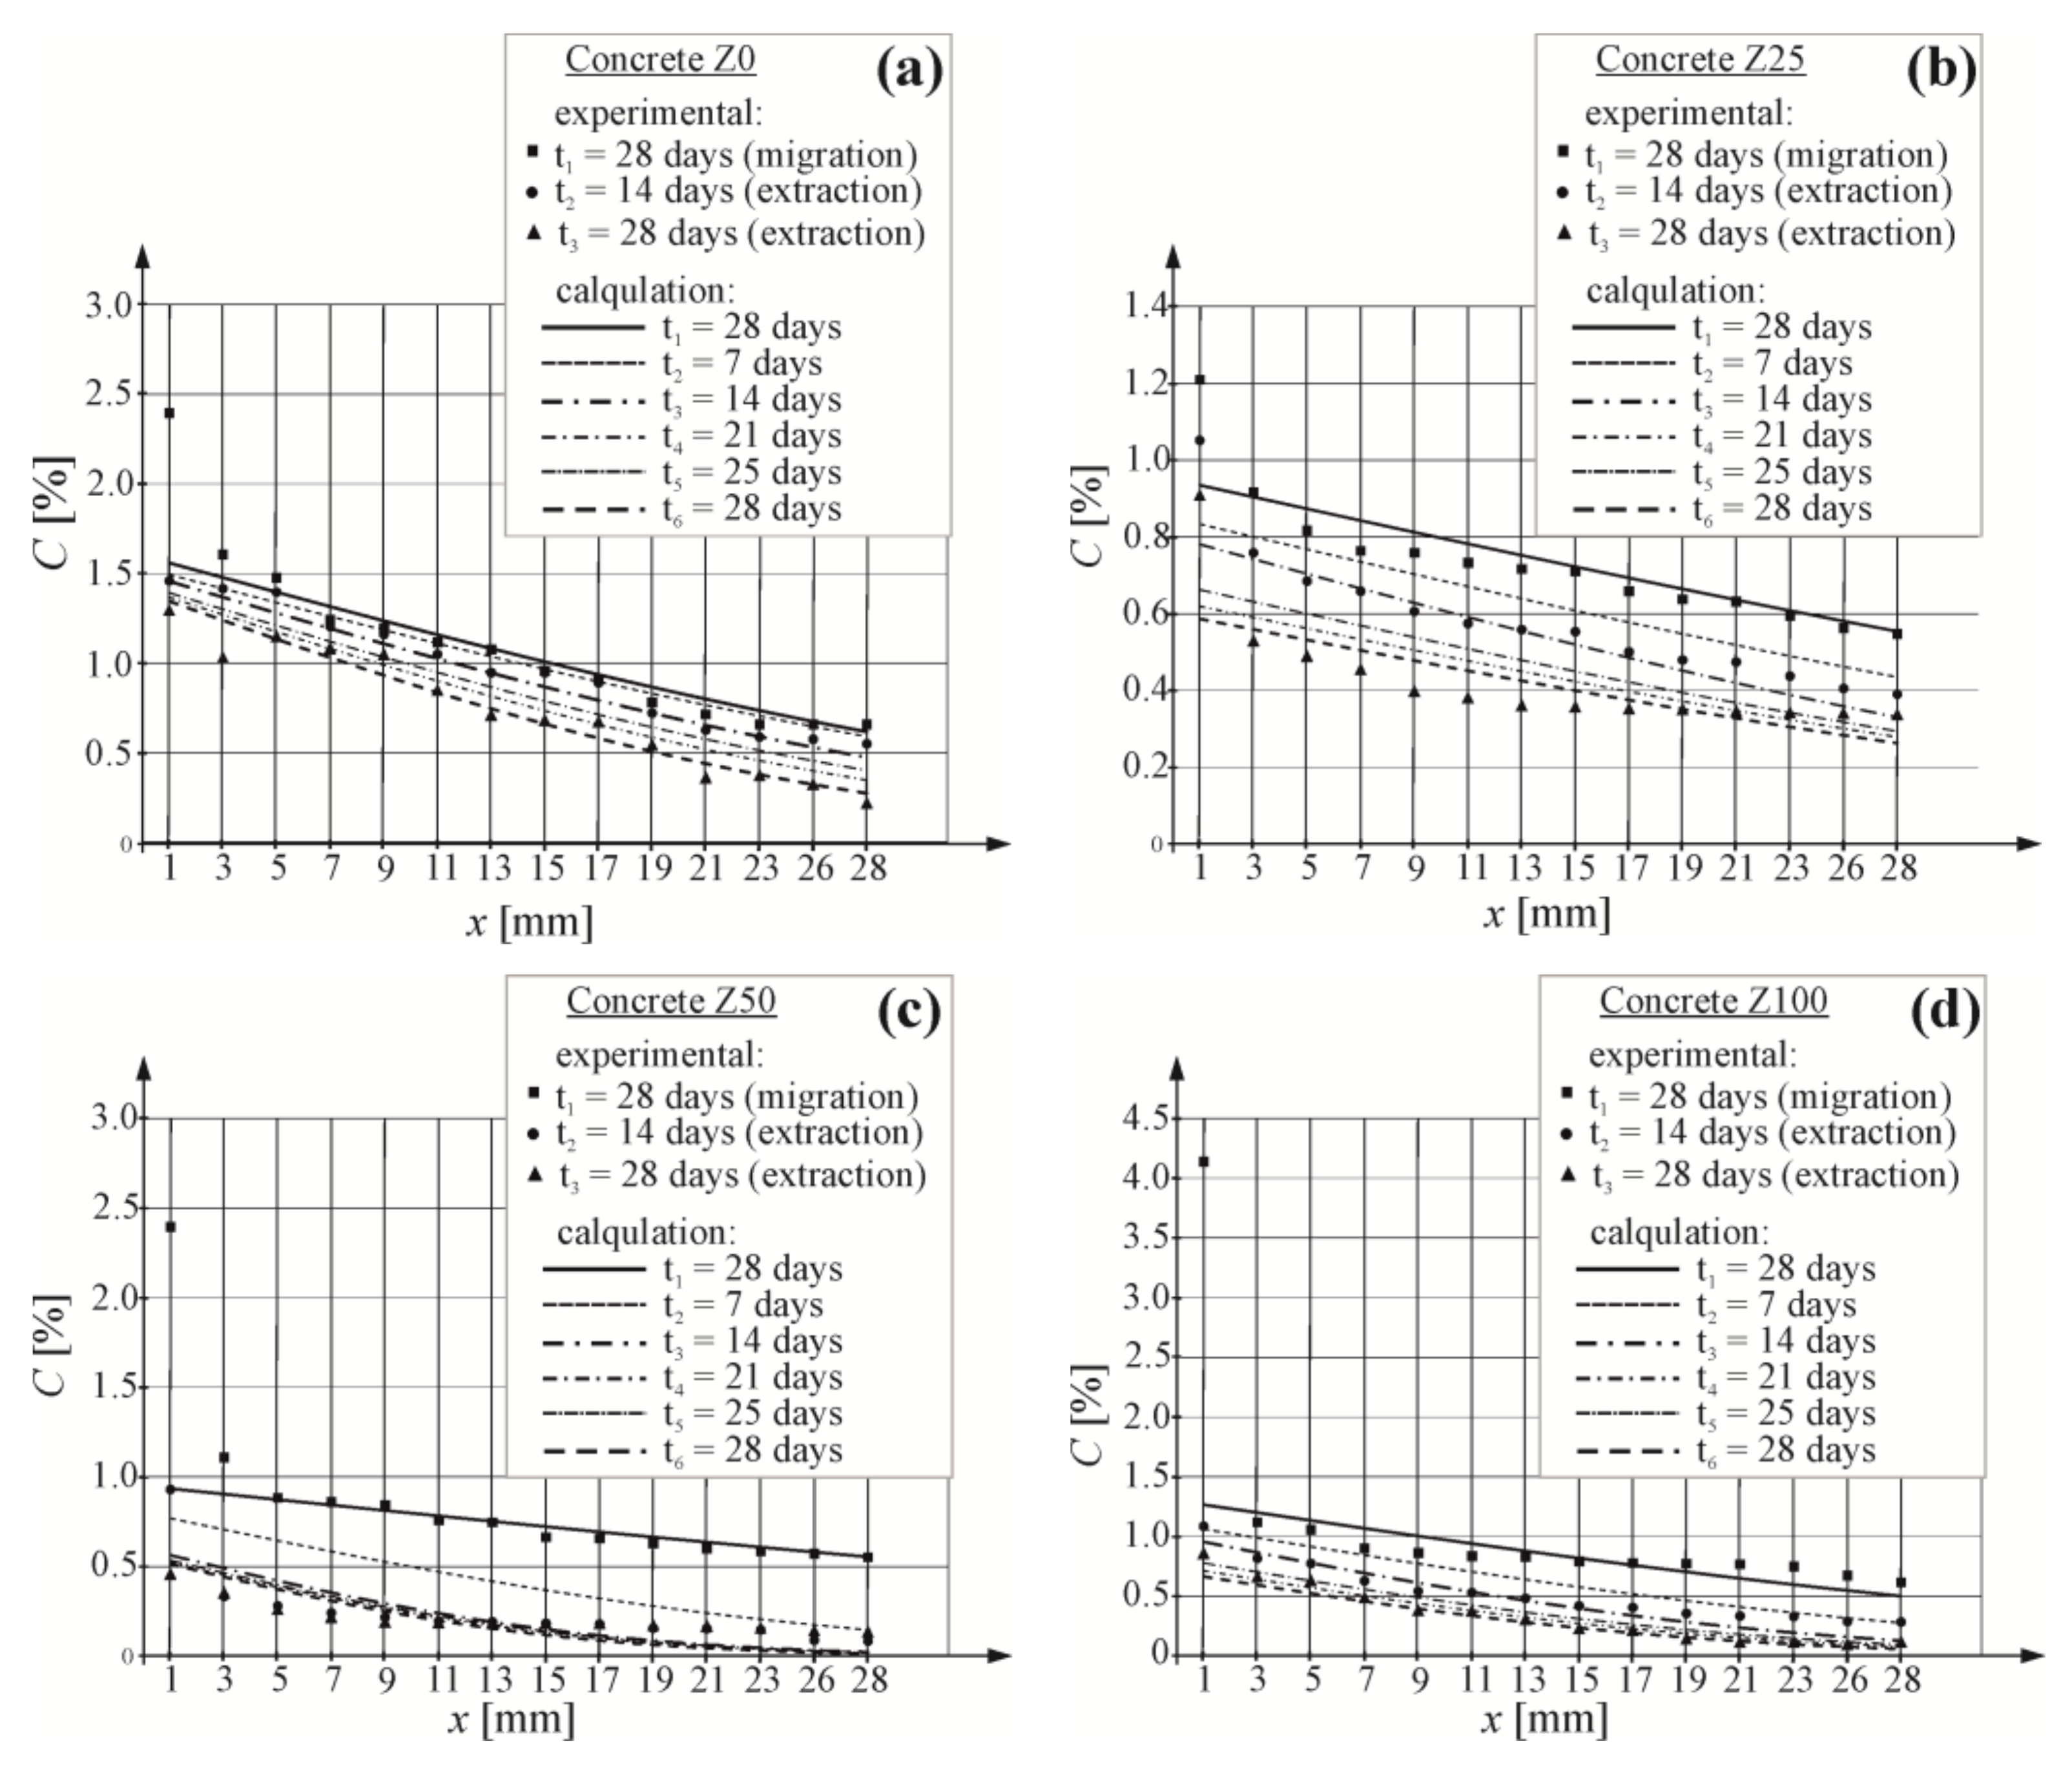
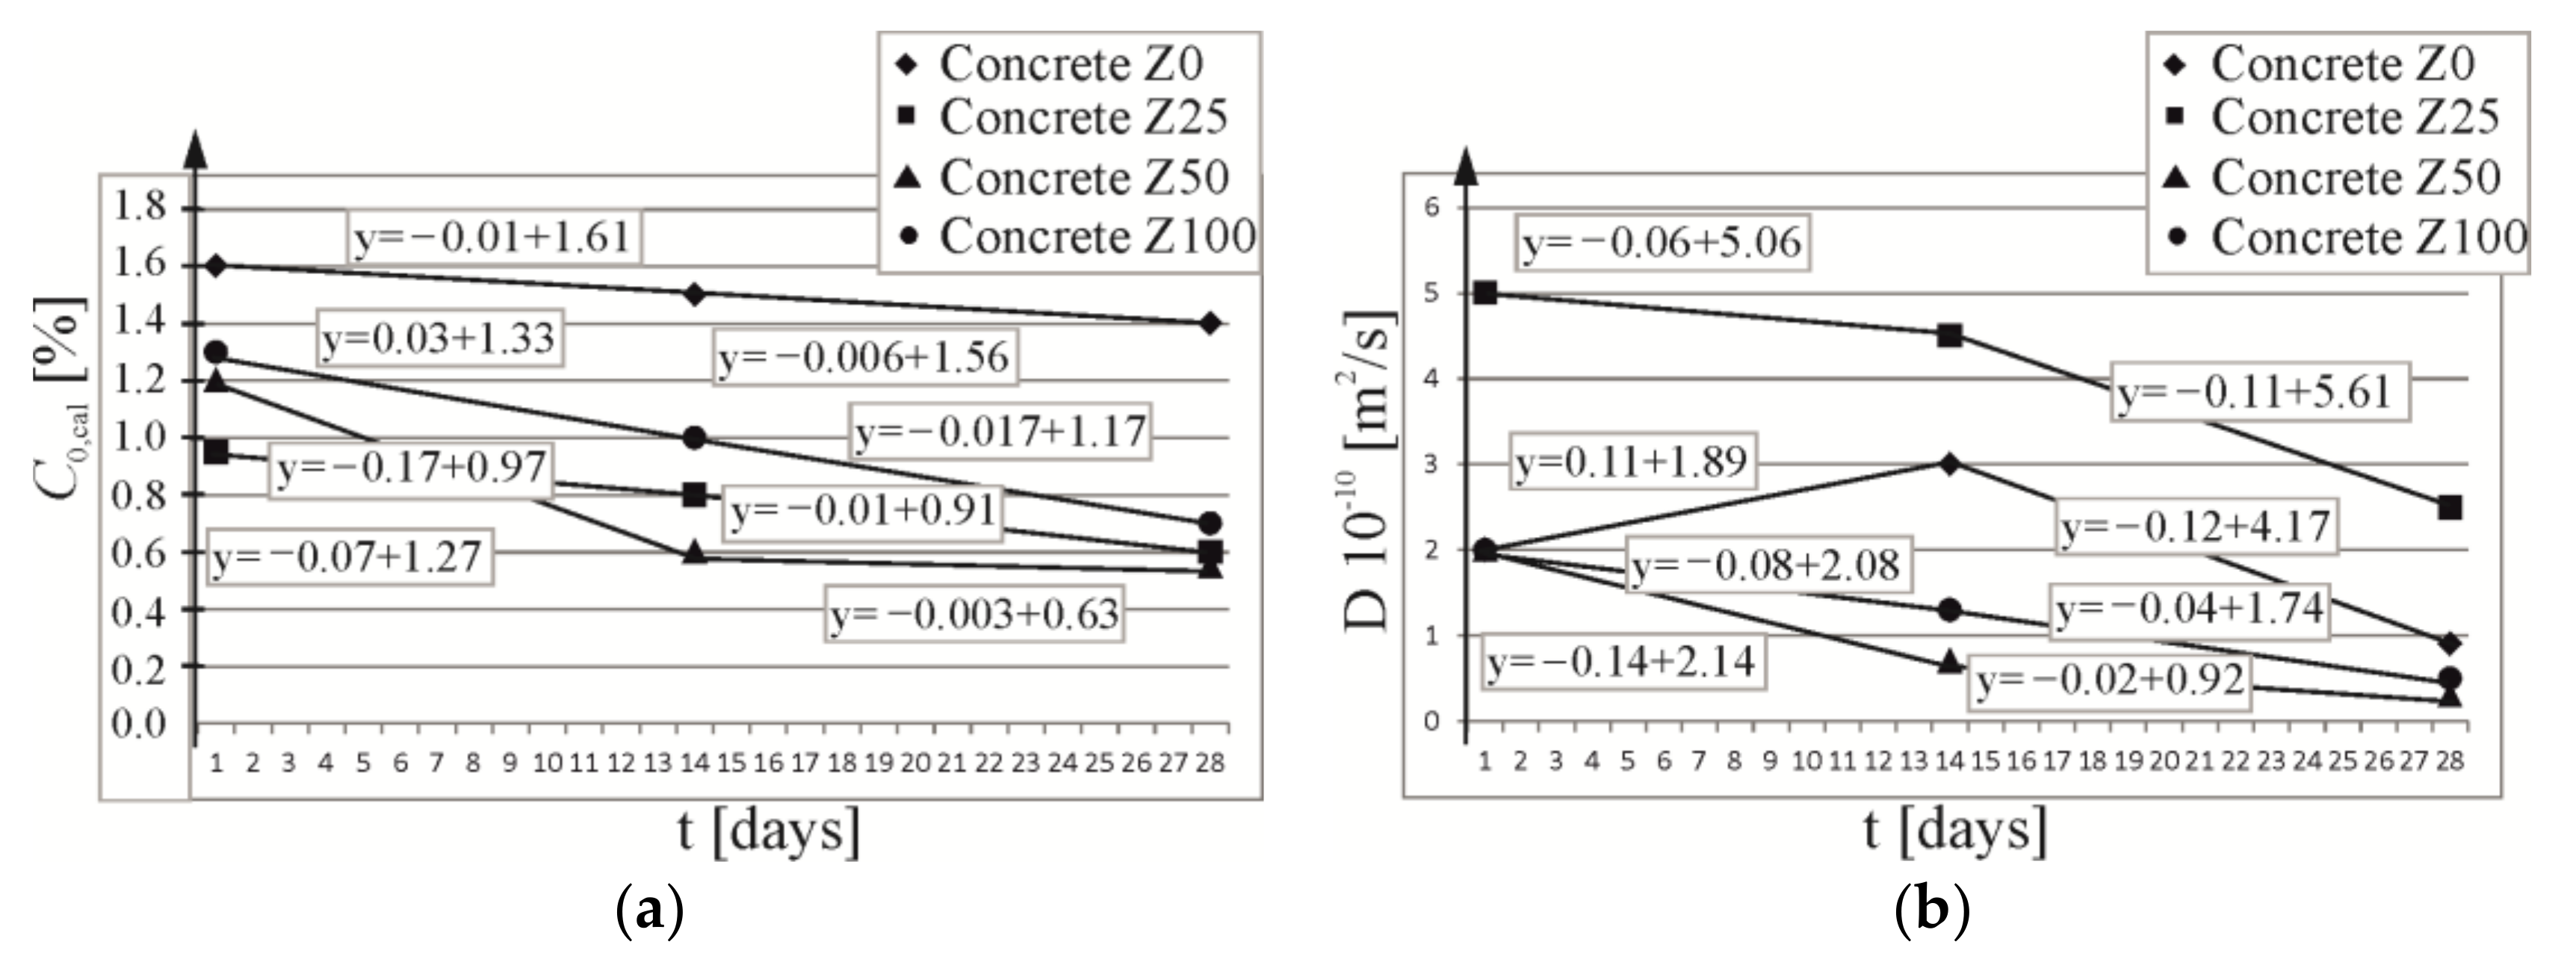
4.2. Coefficients of Chloride Extraction and Forecasting Extraction
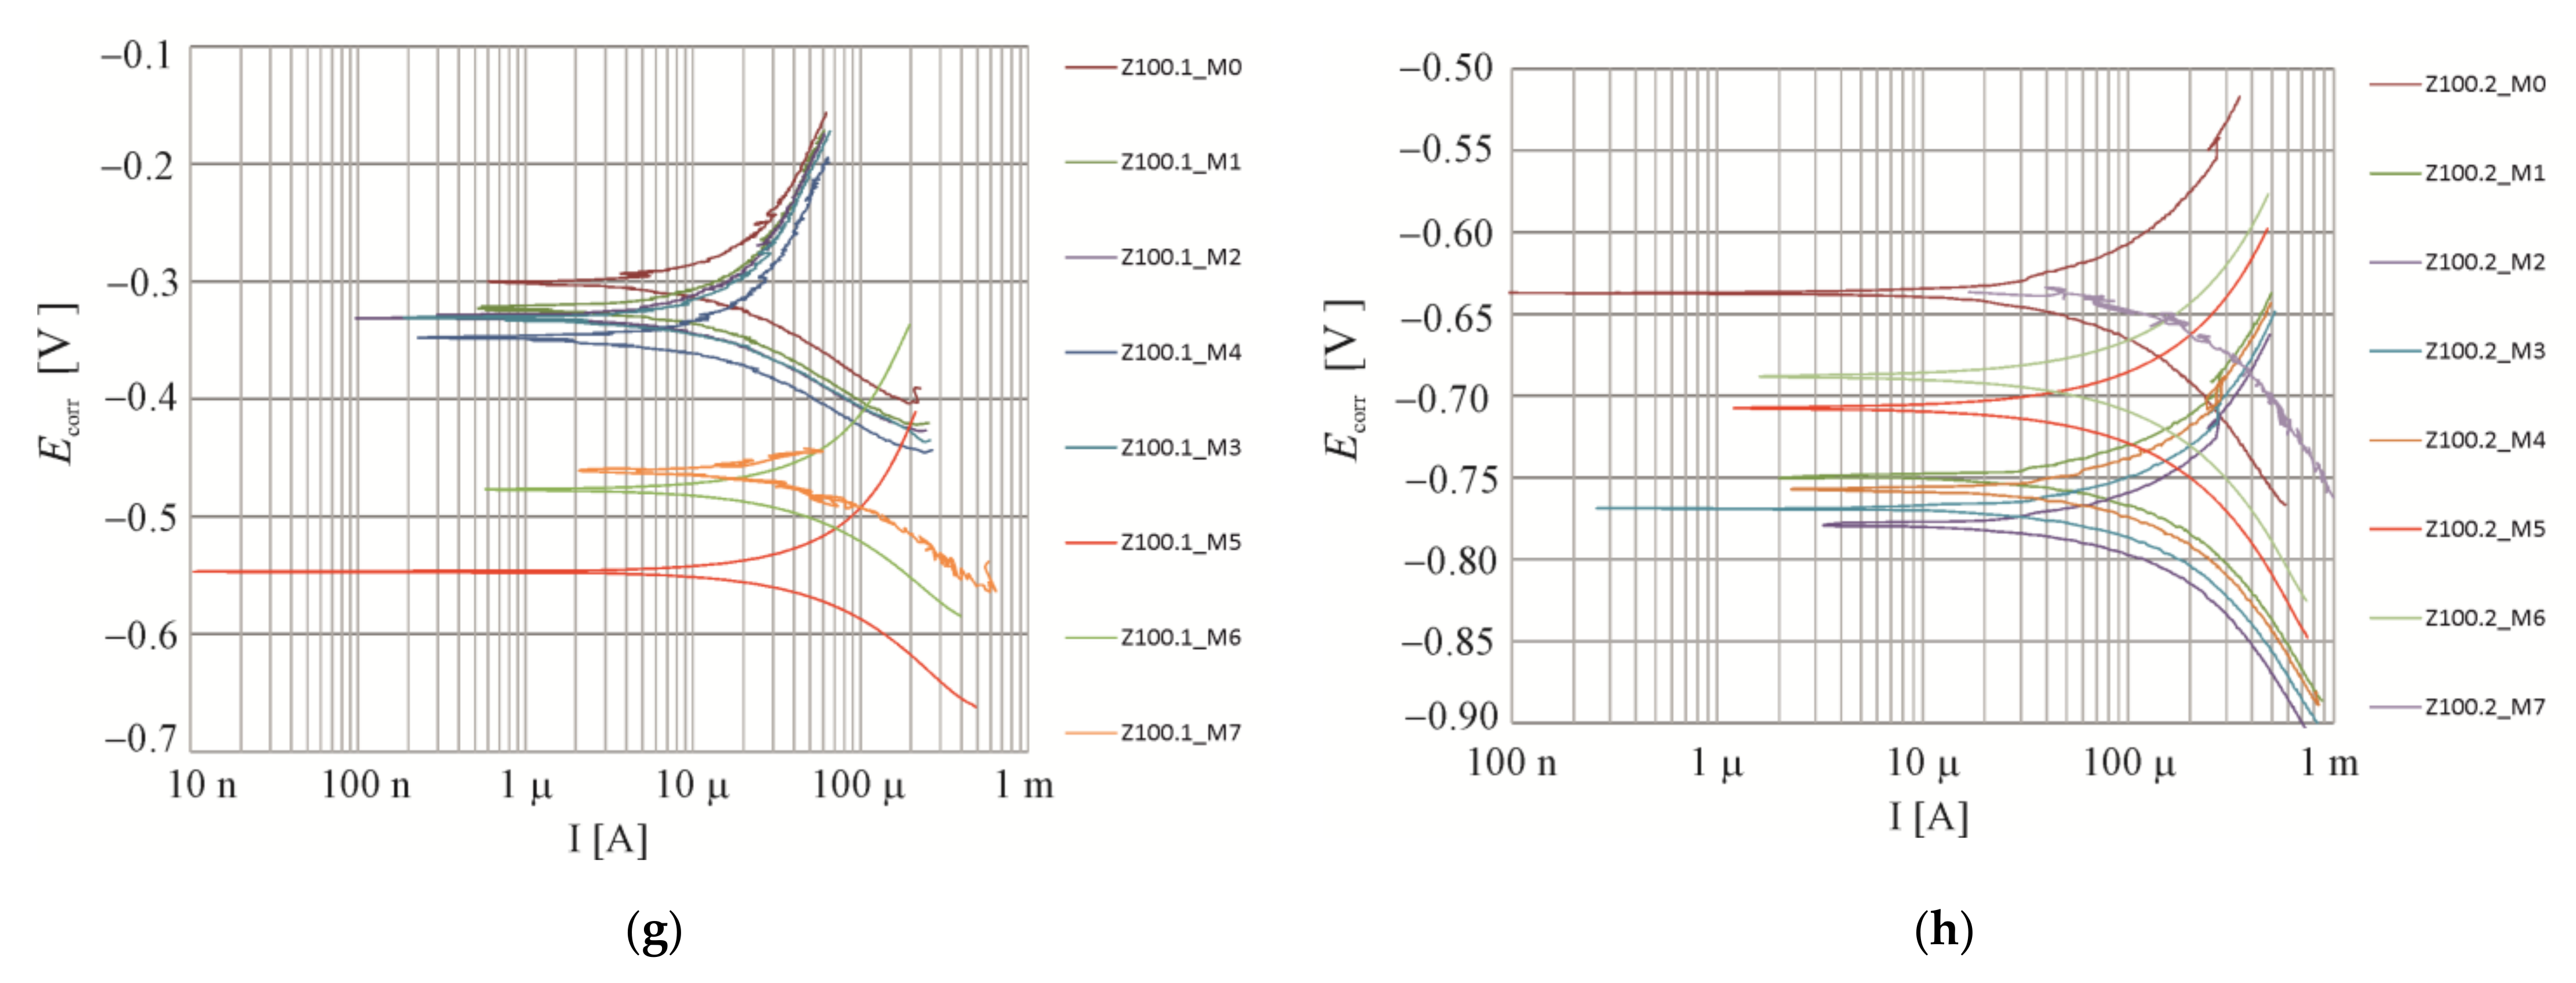
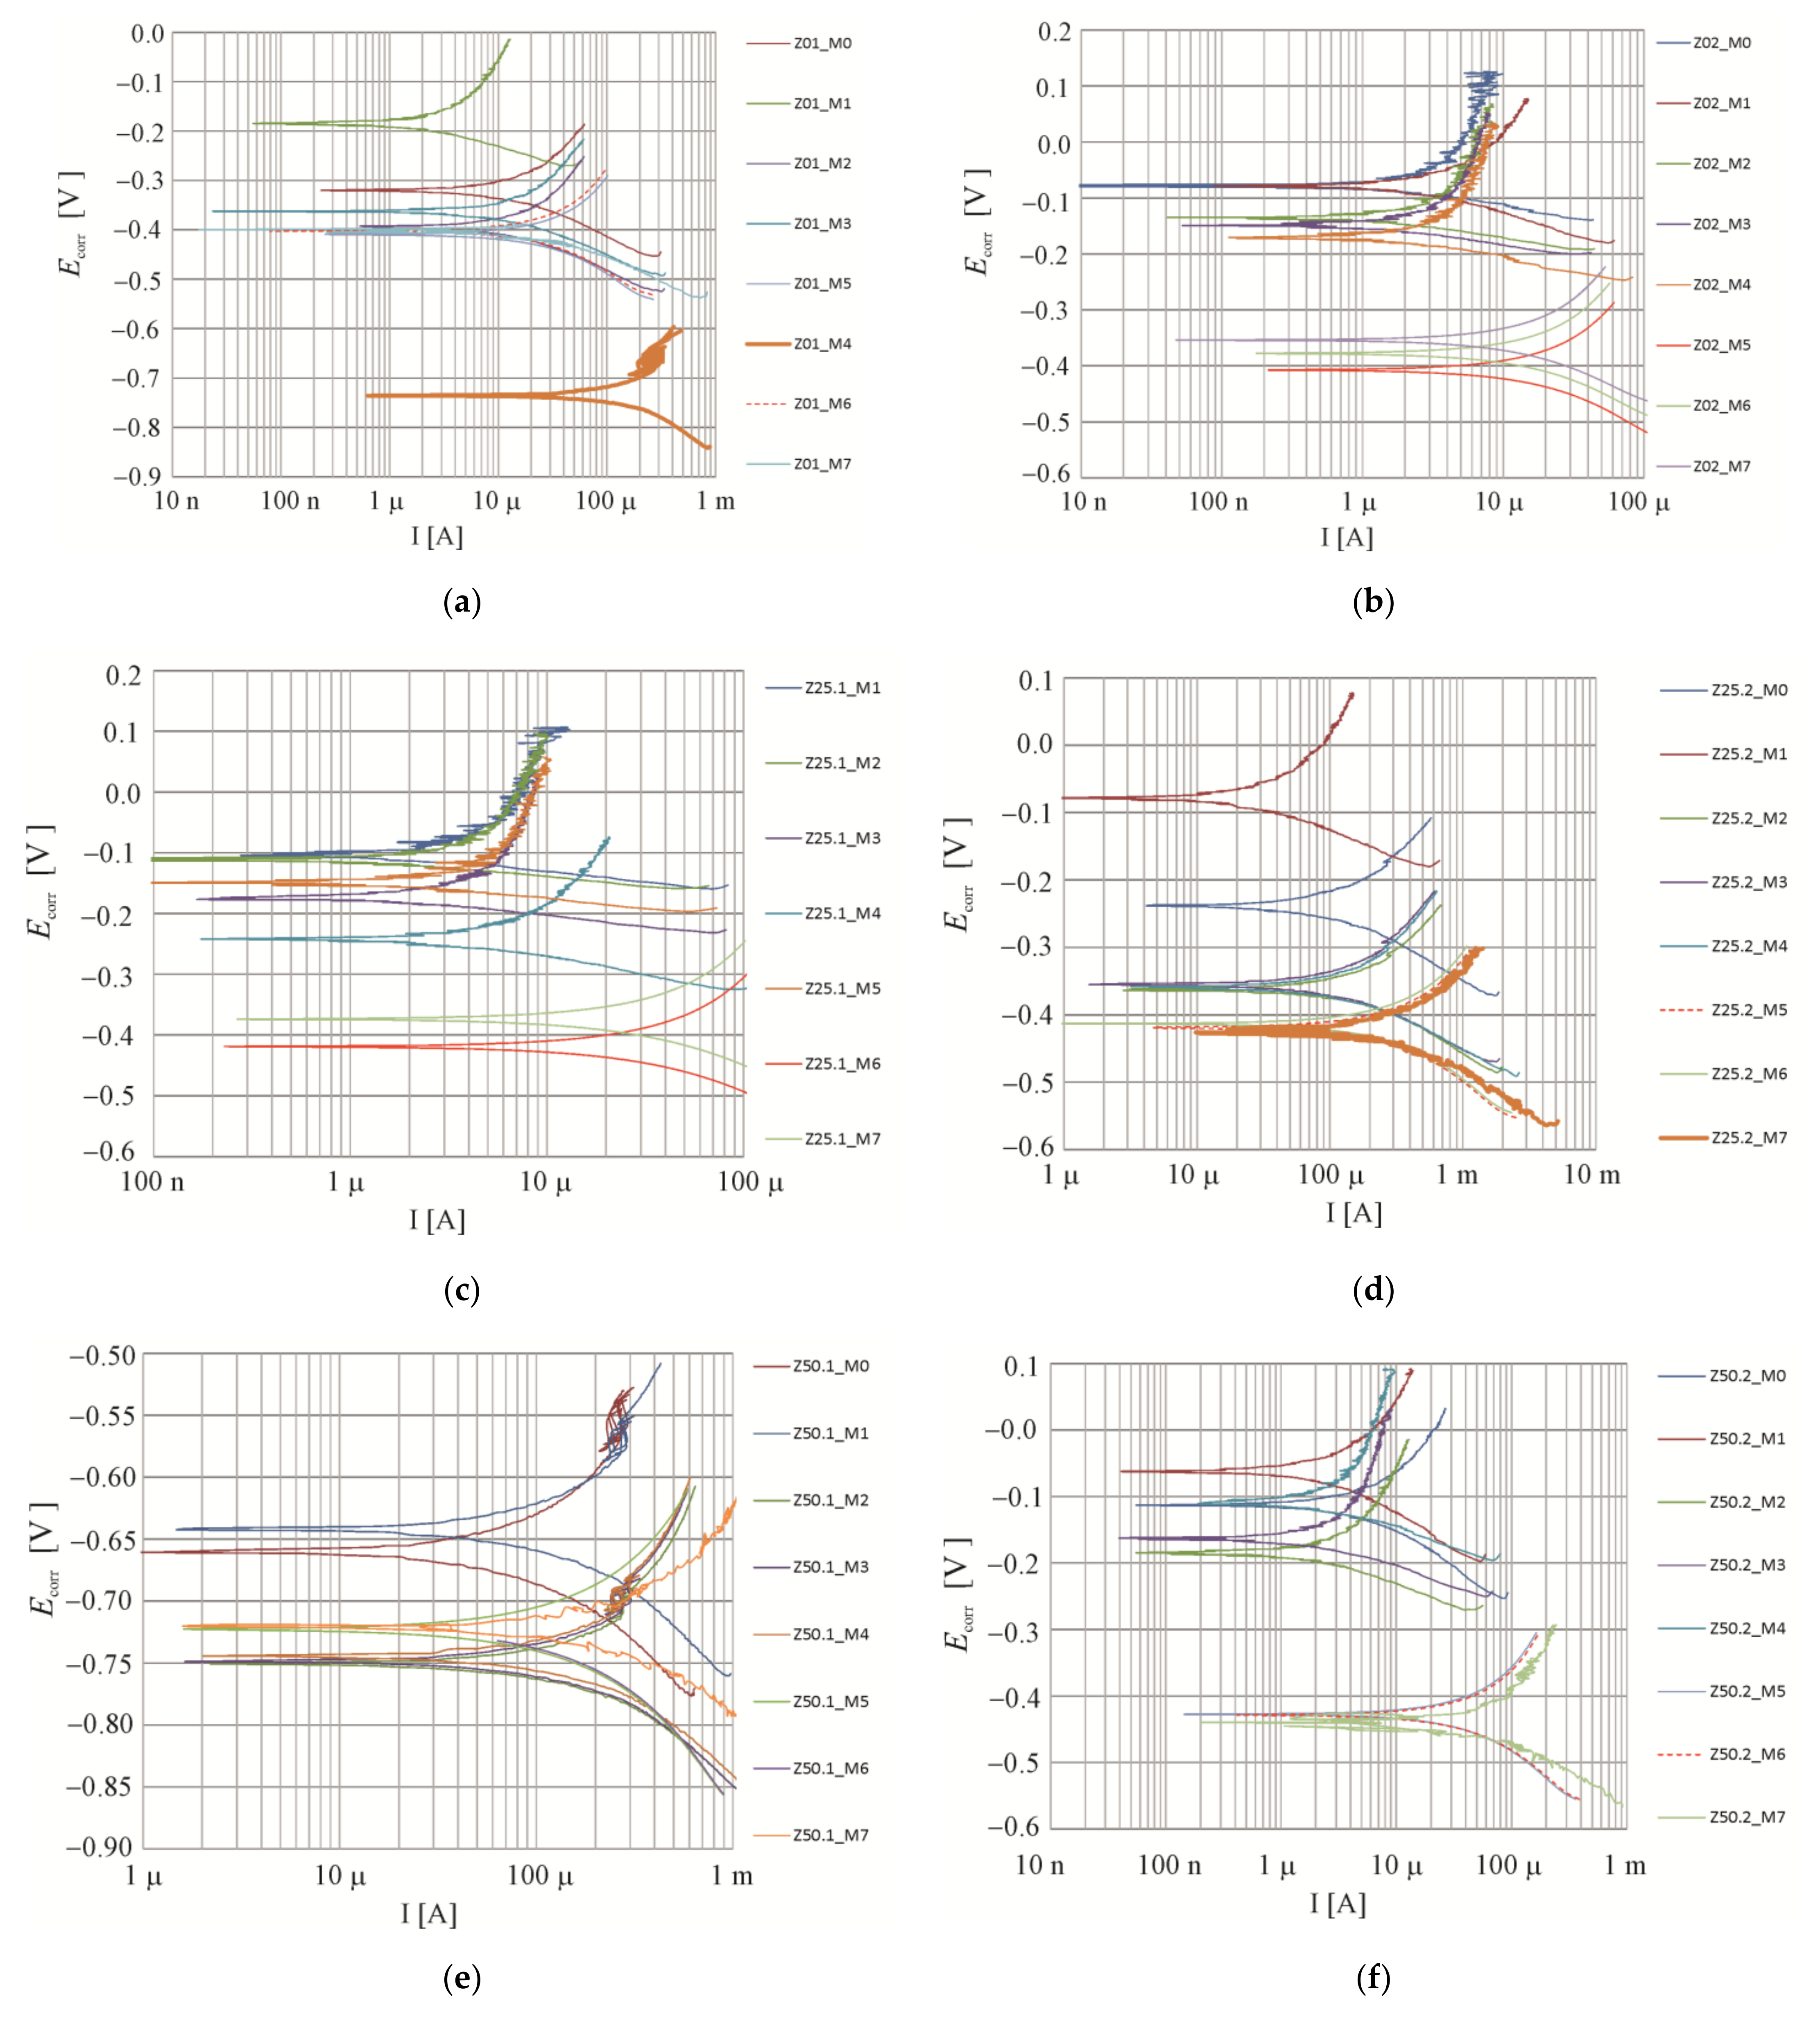
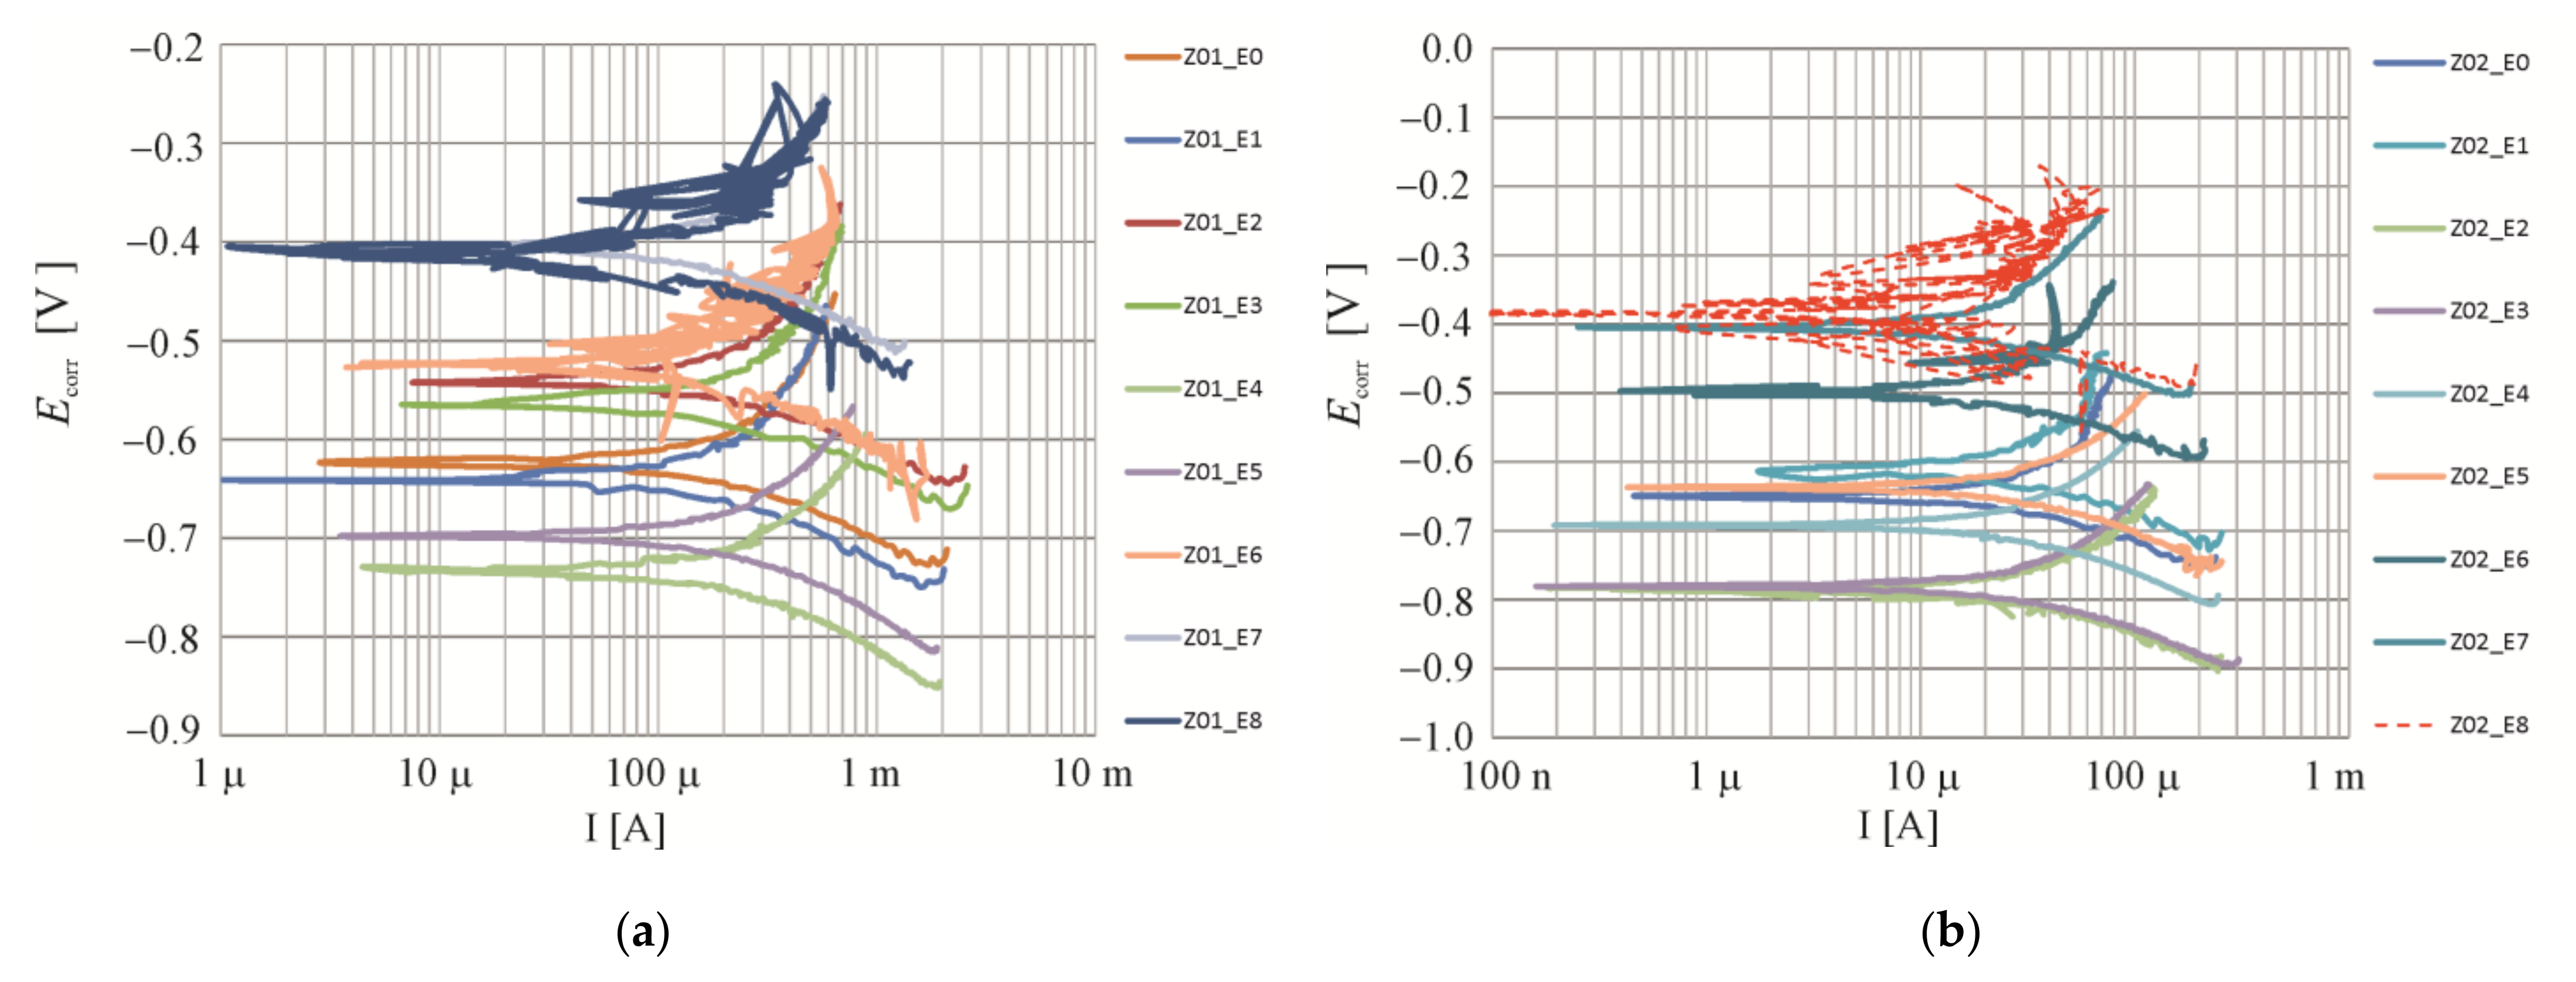
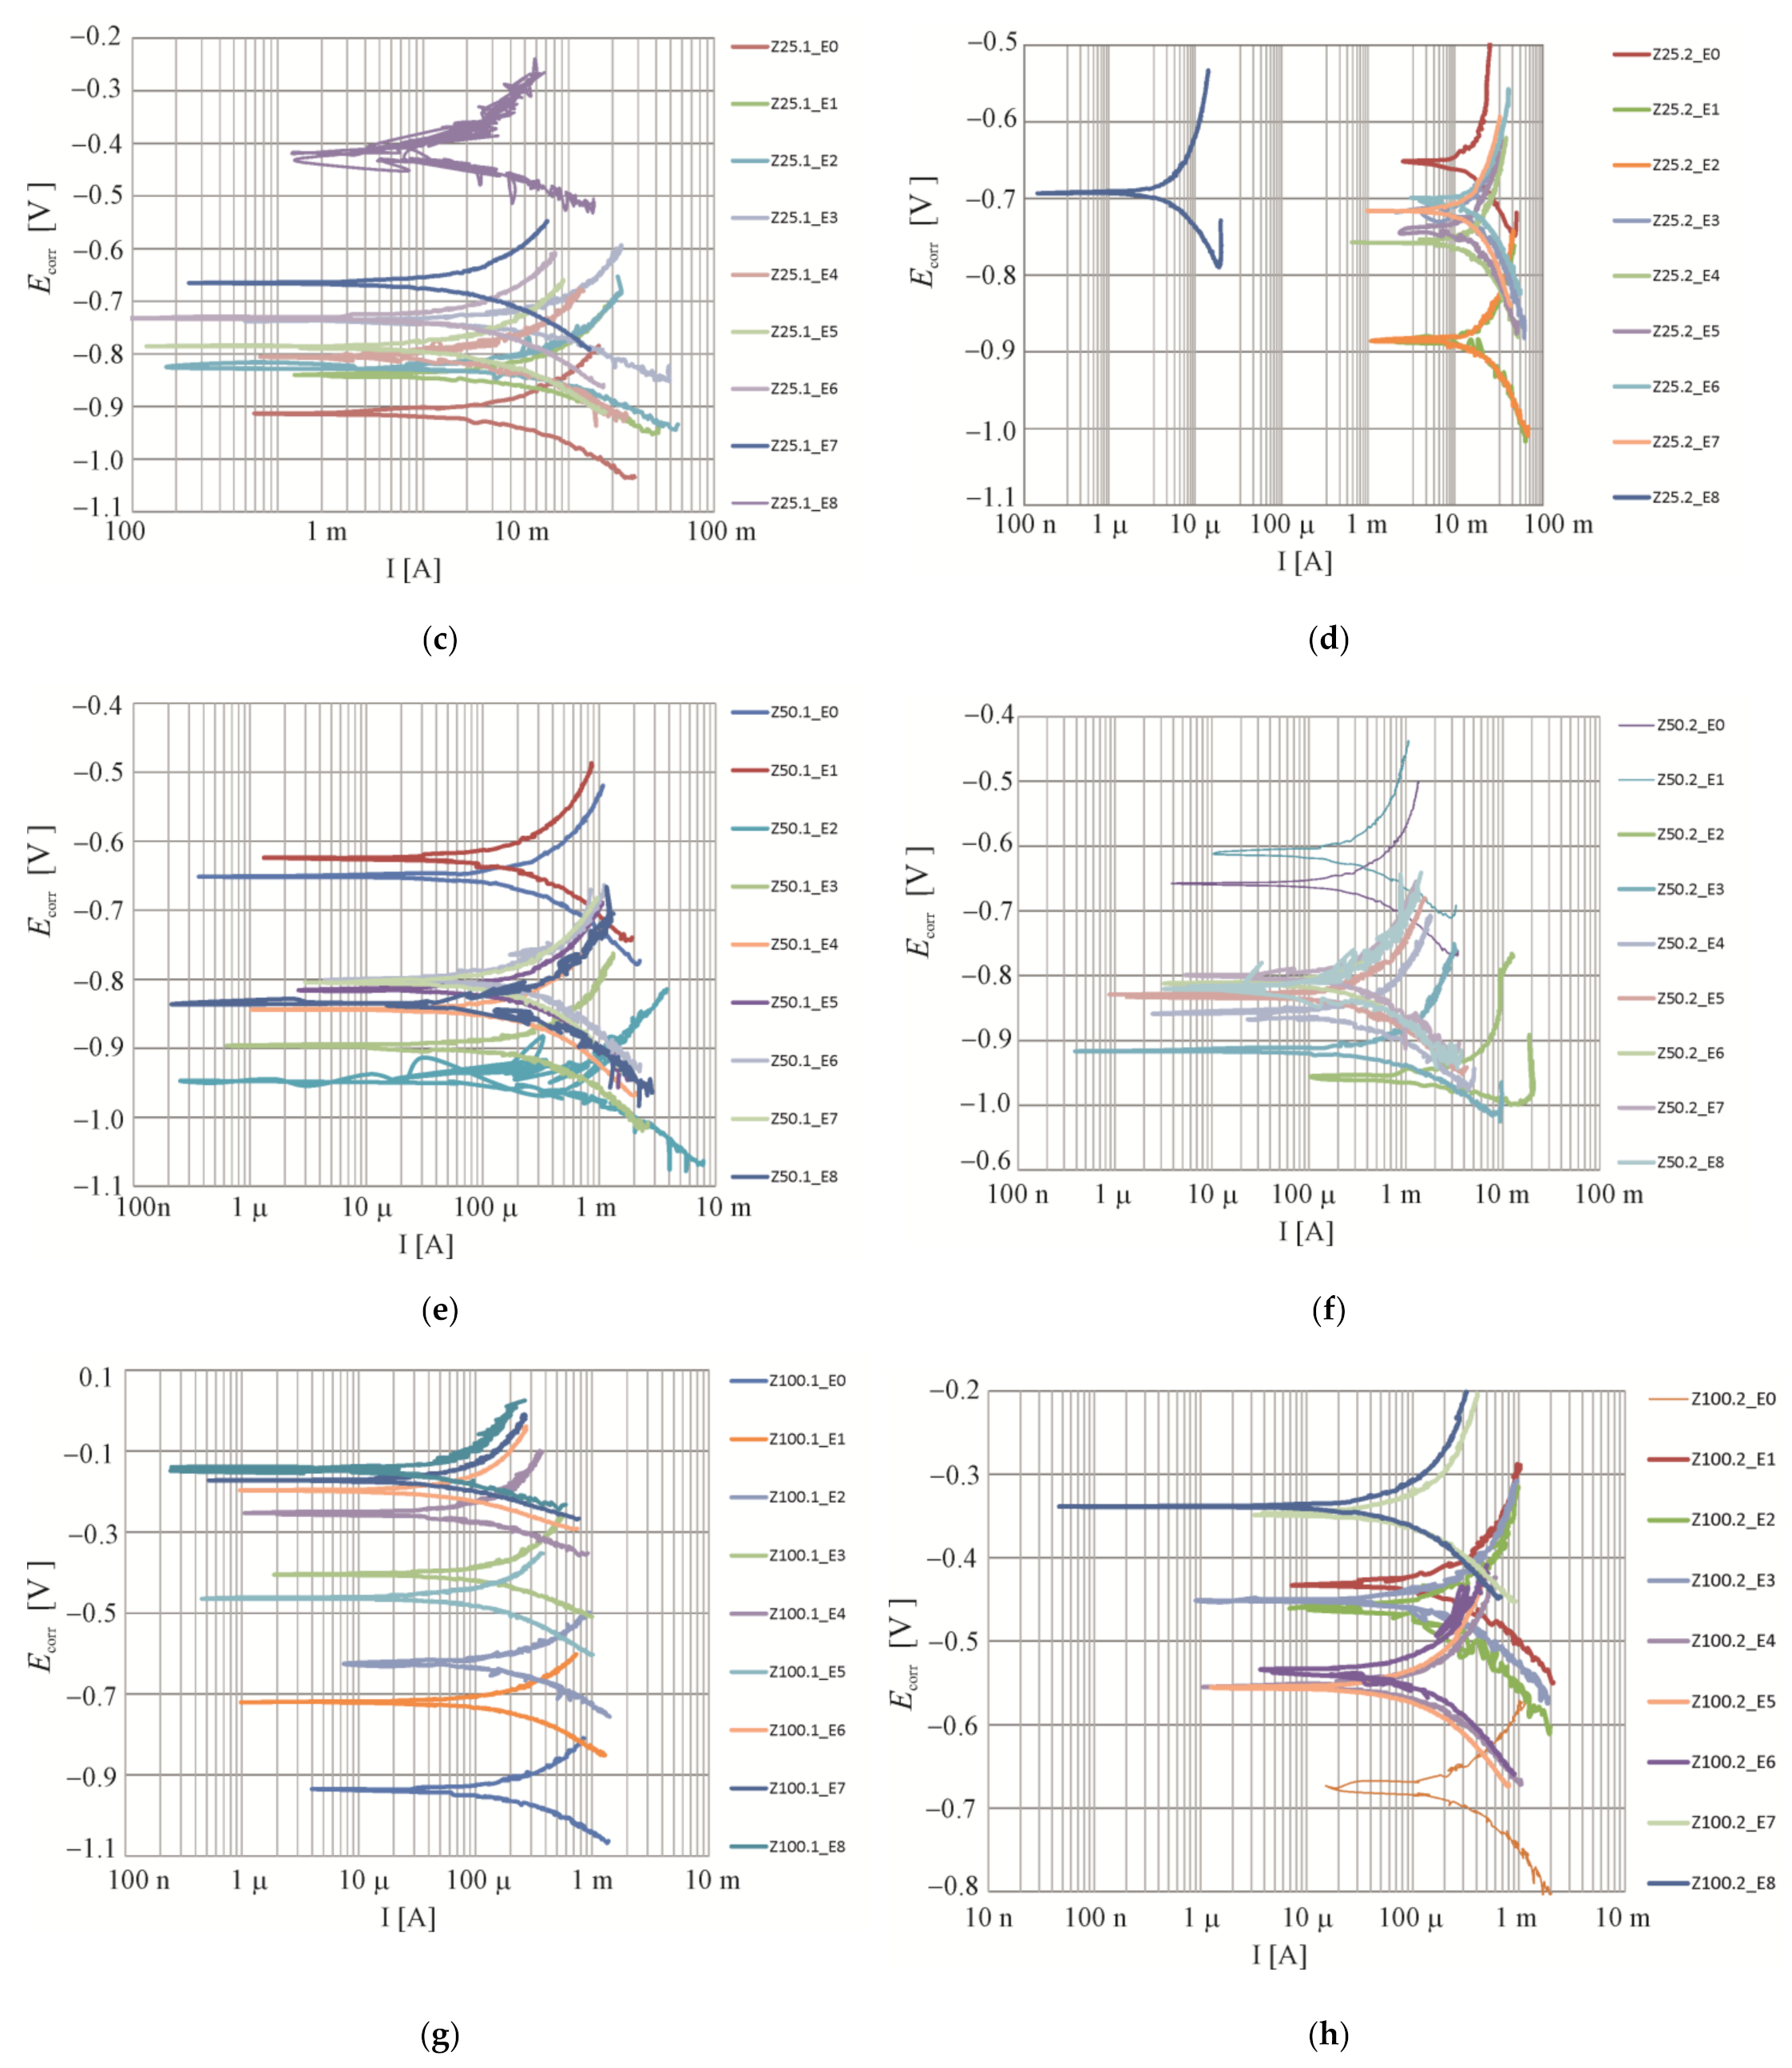
4.3. Test Results for the Corrosion Rate of Reinforcement Using the Method of Linear Polarization Resistance
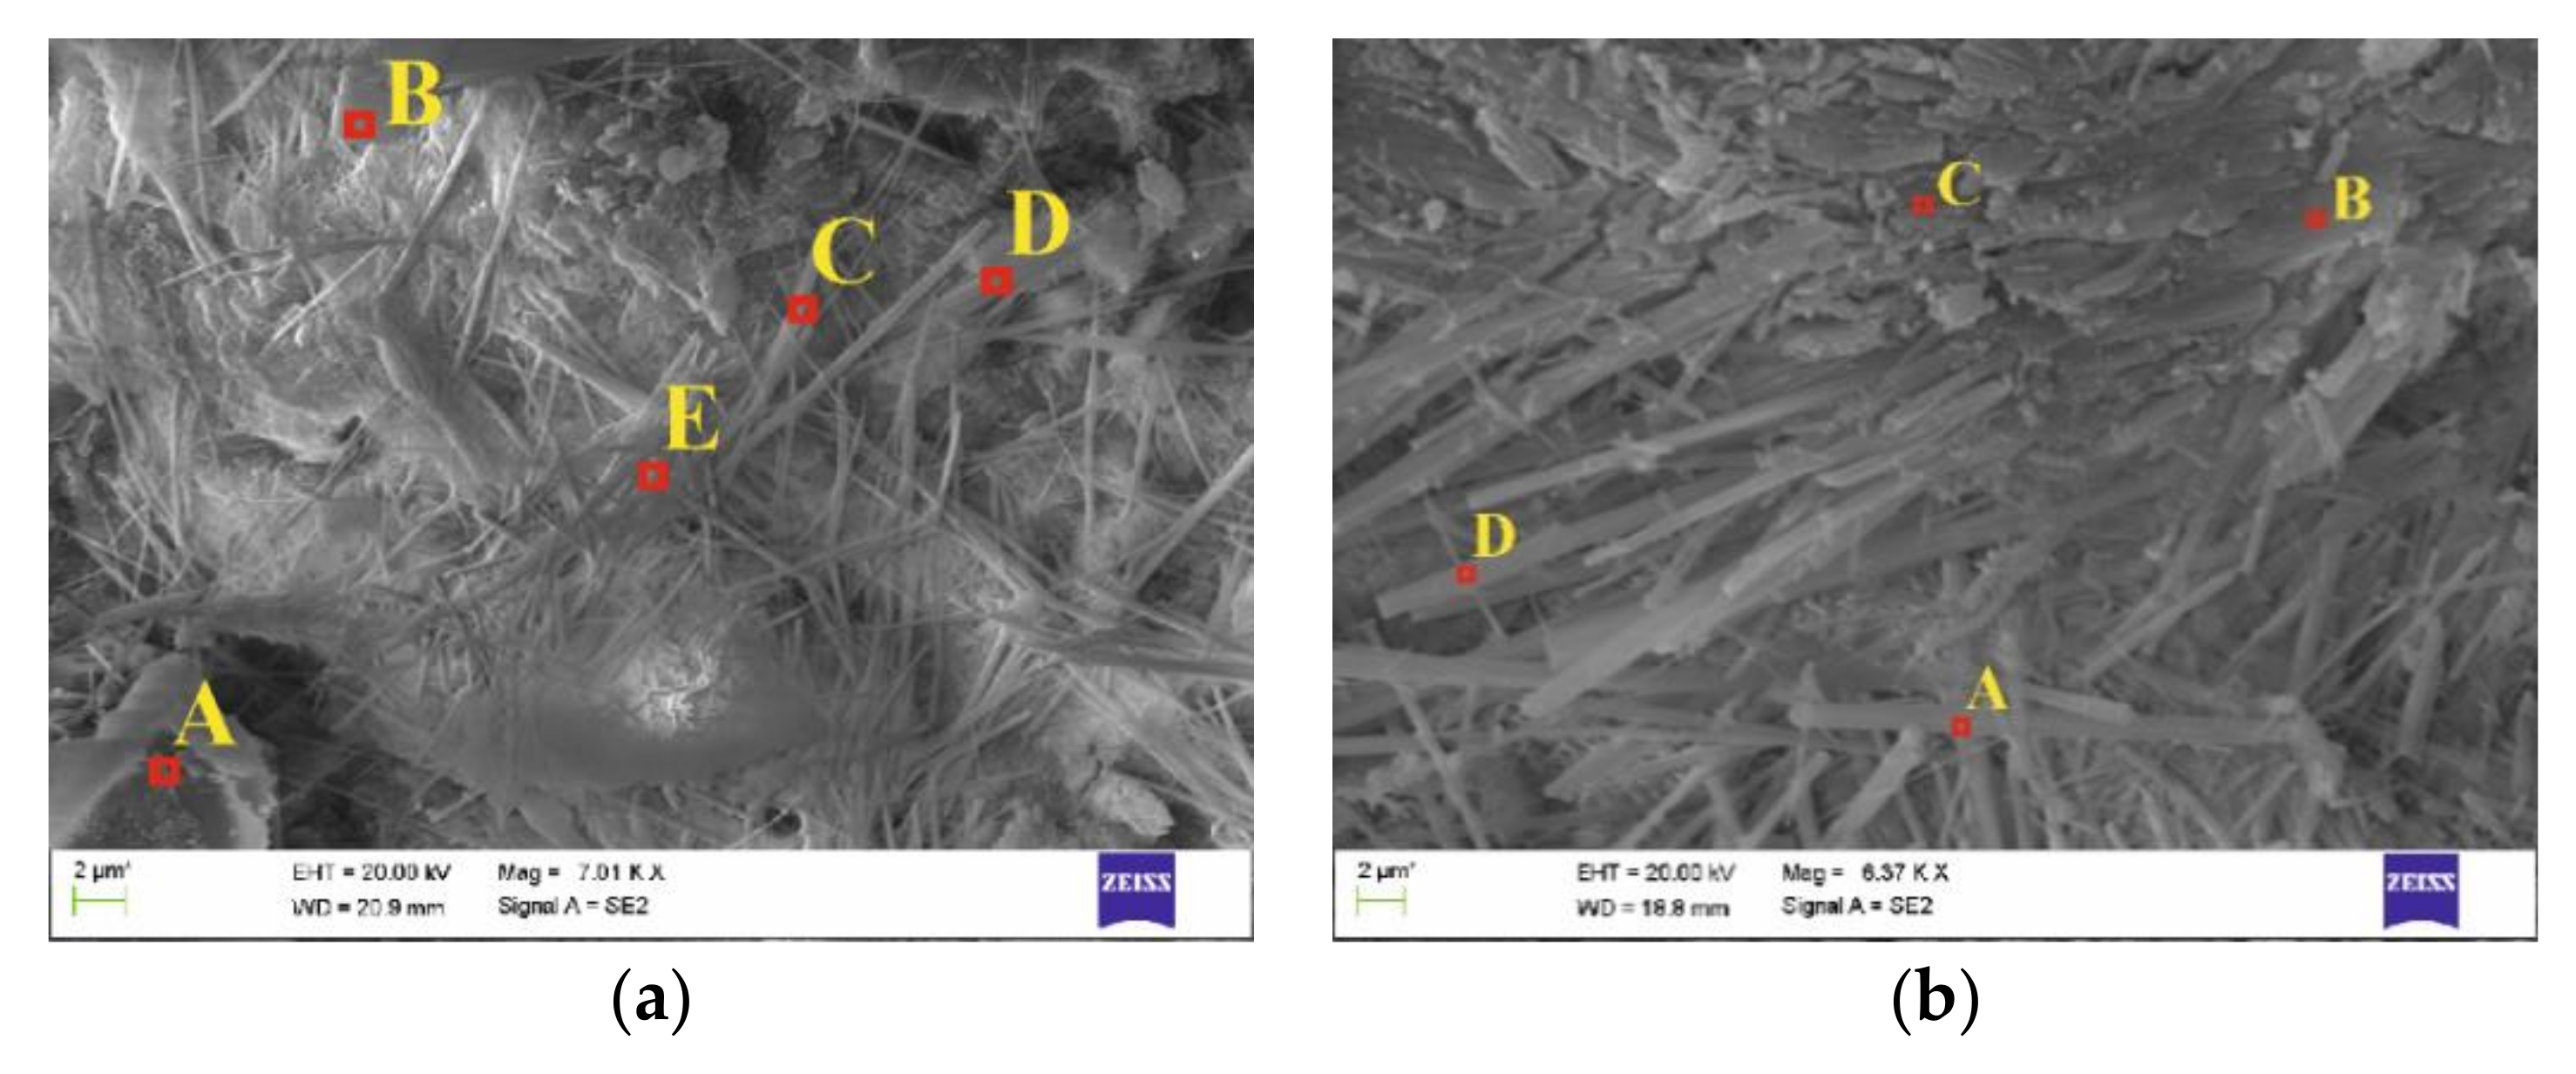
4.4. Results from Microscopic Tests
5. Conclusions
- A 14-day electrochemical extraction clearly reduced the concentration of chloride ions at the reinforcement surface in concretes Z25, Z50 and Z100. Another 14 days of desalination only slightly reduced the concentration of chloride ions;
- A different trend was observed only for concrete Z0, where extending extraction by another 14 days considerably reduced the concentration of chloride ions.
- Corrosion could be still expected in concretes Z0 and Z25 after 14 days of extraction, which was confirmed by results from testing the corrosion current;
- No risk of reinforcement corrosion which was only confirmed for concrete Z-100;
- Only after a 28-day extraction was conducted for all types of concrete, the Hausman criterion dropped below the critical value and the measured corrosion current was significantly reduced.
Author Contributions
Funding
Institutional Review Board Statement
Informed Consent Statement
Data Availability Statement
Acknowledgments
Conflicts of Interest
Appendix A

| Measure | Time | Ecorr | ba | bc | Rp | RpA | Icorr | Vr |
|---|---|---|---|---|---|---|---|---|
| No. | Days | mV | mV | mV | kΩ | kΩ cm2 | μA/cm2 | μm/Year |
| Z0.1-M0 | 0 | −317 | 173 | 109 | 1.63 | 45.26 | 0.64 | 0.71 |
| Z0.2-M0 | 0 | −109 | 427 | 33 | 7.71 | 213.57 | 0.06 | 0.07 |
| Z0.1-M1 | 7 | −354 | 172 | 108 | 1.73 | 47.95 | 0.60 | 0.66 |
| Z0.2-M1 | 7 | −76 | 372 | 42 | 7.86 | 217.72 | 0.08 | 0.08 |
| Z0.1-M2 | 14 | −392 | 199 | 107 | 1.58 | 43.88 | 0.69 | 0.76 |
| Z0.2-M2 | 14 | −134 | 359 | 48 | 8.38 | 232.13 | 0.08 | 0.09 |
| Z0.1-M3 | 21 | −362 | 262 | 99 | 1.76 | 48.86 | 0.64 | 0.70 |
| Z0.2-M3 | 21 | −149 | 572 | 40 | 8.12 | 225.01 | 0.07 | 0.08 |
| Z0.1-M4 | 28 | −409 | 223 | 204 | 0.77 | 27.06 | 1.71 | 1.88 |
| Z0.2-M4 | 28 | −170 | 394 | 51 | 6.67 | 184.68 | 0.11 | 0.12 |
| Z0.1-M5 | 35 | −402 | 181 | 145 | 1.04 | 28.81 | 1.21 | 1.33 |
| Z0.2-M5 | 35 | −407 | 288 | 144 | 1.63 | 45.21 | 0.92 | 1.01 |
| Z0.1-M6 | 42 | −403 | 181 | 145 | 1.11 | 30.83 | 1.13 | 1.25 |
| Z0.2-M6 | 42 | −377 | 263 | 132 | 1.79 | 49.69 | 0.77 | 0.84 |
| Z0.1-M7 | 49 | −400 | 104 | 98 | 0.08 | 2.22 | 9.89 | 10.88 |
| Z0.2-M7 | 49 | −354 | 274 | 120 | 1.97 | 54.54 | 0.66 | 0.73 |
| Z0.1-E0 | 0 | −623 | 206 | 89 | 0.12 | 3.38 | 7.99 | 8.78 |
| Z0.2-E0 | 0 | −650 | 537 | 138 | 0.10 | 2.66 | 17.93 | 19.72 |
| Z0.1-E1 | 7 | −641 | 327 | 89 | 0.15 | 4.13 | 7.36 | 8.10 |
| Z0.2-E1 | 7 | −909 | 539 | 107 | 0.09 | 2.49 | 15.55 | 17.10 |
| Z0.1-E2 | 14 | −542 | 245 | 101 | 0.12 | 3.30 | 9.42 | 10.36 |
| Z0.2-E2 | 14 | −785 | 236 | 159 | 0.10 | 2.63 | 15.68 | 17.24 |
| Z0.1-E3 | 21 | −564 | 539 | 108 | 013 | 3.46 | 11.28 | 12.41 |
| Z0.2-E3 | 21 | −780 | 283 | 122 | 0.08 | 2.19 | 16.92 | 18.61 |
| Z0.1-E4 | 28 | −728 | 369 | 150 | 0.10 | 2.74 | 16.89 | 18.58 |
| Z0.2-E4 | 28 | −692 | 238 | 133 | 0.08 | 2.30 | 16.11 | 17.73 |
| Z0.1-E5 | 35 | −697 | 296 | 145 | 0.11 | 2.94 | 14.39 | 15.83 |
| Z0.2-E5 | 35 | −637 | 252 | 139 | 0.08 | 2.08 | 18.72 | 20.60 |
| Z0.1-E6 | 42 | −527 | 139 | 90 | 0.21 | 5.76 | 4.12 | 4.53 |
| Z0.2-E6 | 42 | −497 | 314 | 98 | 0.11 | 2.94 | 11.05 | 12.15 |
| Z0.1-E7 | 49 | −404 | 38 | 121 | 0.15 | 4.10 | 3.06 | 3.37 |
| Z0.2-E7 | 49 | −404 | 314 | 98 | 0.12 | 3.41 | 9.52 | 10.47 |
| Z0.1-E8 | 56 | −404 | 114 | 94 | 0.25 | 6.87 | 3.26 | 3.58 |
| Z0.2-E8 | 56 | −384 | 114 | 113 | 0.38 | 10.64 | 2.32 | 2.55 |
| Measure | Time | Ecorr | ba | bc | Rp | RpA | Icorr | Vr |
|---|---|---|---|---|---|---|---|---|
| No. | Days | mV | mV | mV | kΩ | kΩ cm2 | μA/cm2 | μm/Year |
| Z25.1-M0 | 0 | −131 | 260 | 116 | 5.25 | 145.48 | 0.24 | 0.26 |
| Z25.2-M0 | 0 | −78 | 327 | 97 | 5.73 | 158.69 | 0.20 | 0.02 |
| Z25.1-M1 | 7 | −104 | 279 | 32 | 4.85 | 134.26 | 0.09 | 0.10 |
| Z25.2-M1 | 7 | −238 | 194 | 112 | 1.74 | 48.14 | 0.64 | 0.06 |
| Z25.1-M2 | 14 | −112 | 371 | 28 | 5.16 | 14.90 | 0.08 | 0.09 |
| Z25.2-M2 | 14 | −363 | 203 | 124 | 1.45 | 40.22 | 0.83 | 0.08 |
| Z25.1-M3 | 21 | −177 | 515 | 35 | 5.90 | 16.29 | 0.09 | 0.10 |
| Z25.2-M3 | 21 | −355 | 232 | 107 | 1.72 | 47.75 | 0.67 | 0.07 |
| Z25.1-M4 | 28 | −242 | 280 | 64 | 3.85 | 10.62 | 0.21 | 0.23 |
| Z25.2-M4 | 28 | −358 | 243 | 102 | 1.59 | 43.90 | 0.71 | 0.07 |
| Z25.1-M5 | 35 | −149 | 234 | 102 | 4.58 | 12.,95 | 0.24 | 0.27 |
| Z25.2-M5 | 35 | −418 | 175 | 138 | 0.92 | 25.37 | 1.32 | 0.13 |
| Z25.1-M6 | 42 | −419 | 234 | 134 | 0.92 | 25.35 | 1.46 | 1.61 |
| Z25.2-M6 | 42 | −413 | 177 | 132 | 0.95 | 26.29 | 1.25 | 0.12 |
| Z25.1-M7 | 49 | −374 | 250 | 125 | 0.98 | 27.17 | 1.33 | 1.46 |
| Z25.2-M7 | 49 | −691 | 369 | 147 | 0.12 | 319 | 14.33 | 1.43 |
| Z25.1-E0 | 0 | −913 | 162 | 107 | 0.07 | 1.80 | 15.54 | 17.09 |
| Z25.2-E0 | 0 | −882 | 245 | 160 | 0.09 | 2.44 | 17.24 | 1.72 |
| Z25.1-E1 | 7 | −840 | 331 | 131 | 0.05 | 1.39 | 29.42 | 32.37 |
| Z25.2-E1 | 7 | −554 | 715 | 90 | 0.10 | 2.77 | 12.53 | 1.25 |
| Z25.1-E2 | 14 | −824 | 332 | 131 | 0.05 | 1.30 | 31.33 | 34.46 |
| Z25.2-E2 | 14 | −885 | 290 | 145 | 0.06 | 1.66 | 25.26 | 2.53 |
| Z25.1-E3 | 21 | −738 | 307 | 124 | 0.05 | 1.36 | 28.26 | 31.08 |
| Z25.2-E3 | 21 | −717 | 182 | 196 | 0.11 | 2.94 | 13.96 | 1.40 |
| Z25.1-E4 | 28 | −804 | 287 | 138 | 0.10 | 2.63 | 15.38 | 16.91 |
| Z25.2-E4 | 28 | −752 | 333 | 103 | 0.08 | 2.16 | 15.81 | 1.58 |
| Z25.1-E5 | 35 | −785 | 253 | 117 | 0.11 | 2.91 | 11.94 | 13.14 |
| Z25.2-E5 | 35 | −783 | 246 | 126 | 0.09 | 2.52 | 14.35 | 1.44 |
| Z25.1-E6 | 42 | −732 | 240 | 152 | 0.10 | 2.83 | 14.30 | 15.73 |
| Z25.2-E6 | 42 | −699 | 238 | 145 | 0.07 | 1.83 | 21.40 | 2.14 |
| Z25.1-E7 | 49 | −665 | 266 | 150 | 0.11 | 2.96 | 14.05 | 15.46 |
| Z25.2-E7 | 49 | −715 | 205 | 178 | 0.09 | 2.49 | 16.59 | 1.66 |
| Z25.1-E8 | 56 | −420 | 207 | 113 | 0.21 | 5.93 | 5.35 | 5.89 |
| Z25.2-E8 | 56 | −693 | 313 | 72 | 6.89 × 10⁵ | 1.91 × 10⁷ | 0.00 | 0.00 |
| Measure | Time | Ecorr | ba | bc | Rp | RpA | Icorr | Vr |
|---|---|---|---|---|---|---|---|---|
| No. | Days | mV | mV | mV | kΩ | kΩ cm2 | μA/cm2 | μm/Year |
| Z50.1-M0 | 0 | −660 | 334 | 159 | 0.26 | 7.20 | 6.49 | 7.14 |
| Z50.2-M0 | 0 | −63 | 254 | 107 | 8.29 | 229.63 | 0.14 | 0.16 |
| Z50.1-M1 | 7 | −642 | 225 | 155 | 0.19 | 5.18 | 7.69 | 8.46 |
| Z50.2-M1 | 7 | −113 | 361 | 123 | 4.47 | 123.82 | 0.32 | 0.35 |
| Z50.1-M2 | 14 | −750 | 339 | 139 | 0.12 | 3.35 | 12.77 | 1.05 |
| Z50.2-M2 | 14 | −186 | 294 | 60 | 7.40 | 204.98 | 0.11 | 0.12 |
| Z50.1-M3 | 21 | −748 | 295 | 146 | 0.13 | 3.63 | 11.69 | 12.86 |
| Z50.2-M3 | 21 | −164 | 477 | 56 | 7.87 | 218.00 | 0.10 | 0.11 |
| Z50.1-M4 | 28 | −744 | 330 | 137 | 0.12 | 3.27 | 12.86 | 14.15 |
| Z50.2-M4 | 28 | −109 | 436 | 60 | 7.17 | 198.61 | 0.12 | 0.13 |
| Z50.1-M5 | 35 | −722 | 183 | 209 | 0.18 | 4.88 | 8.69 | 9.56 |
| Z50.2-M5 | 35 | −428 | 131.0 | 129 | 0.63 | 17.48 | 1.61 | 1.78 |
| Z50.1-M6 | 42 | −721 | 177 | 214 | 0.18 | 4.90 | 8.58 | 9.44 |
| Z50.2-M6 | 42 | −429 | 137 | 126 | 0.59 | 16.45 | 1.73 | 1.91 |
| Z50.1-M7 | 49 | −720 | 172 | 158 | 0.08 | 2.30 | 15.55 | 17.11 |
| Z50.2-M7 | 49 | −658 | 178 | 106 | 0.06 | 1.55 | 18.60 | 20.46 |
| Z50.1-E0 | 0 | −652 | 300 | 170 | 0.10 | 2.77 | 17.01 | 18.71 |
| Z50.2-E0 | 0 | −611 | 518 | 149 | 0.09 | 2.55 | 19.72 | 21.69 |
| Z50.1-E1 | 7 | −624 | 377 | 156 | 0.10 | 2.85 | 16.79 | 18.47 |
| Z50.2-E1 | 7 | −592 | 484 | 133 | 0.09 | 2.52 | 19.16 | 21.08 |
| Z50.1-E2 | 14 | −948 | 297 | 89 | 0.06 | 1.72 | 17.31 | 19.05 |
| Z50.2-E2 | 14 | −955 | 857 | 36 | 0.02 | 0.55 | 27.08 | 29.79 |
| Z50.1-E3 | 21 | −896 | 246 | 159 | 0.08 | 2.19 | 19.16 | 21.08 |
| Z50.2-E3 | 21 | −917 | 839 | 49 | 0.03 | 0.83 | 24.19 | 26.61 |
| Z50.1-E4 | 28 | −844 | 242 | 160 | 0.09 | 2.47 | 16.96 | 18.66 |
| Z50.2-E4 | 28 | −860 | 319 | 86 | 0.05 | 1.39 | 21.24 | 23.36 |
| Z50.1-E5 | 35 | −815 | 243 | 167 | 0.10 | 2.71 | 15.83 | 17.42 |
| Z50.2-E5 | 35 | −829 | 304 | 126 | 0.07 | 2.02 | 19.13 | 21.04 |
| Z50.1-E6 | 42 | −801 | 230 | 160 | 0.11 | 2.96 | 13.82 | 15.21 |
| Z50.2-E6 | 42 | −812 | 268 | 122 | 0.08 | 2.11 | 17.29 | 19.02 |
| Z50.1-E7 | 49 | −804 | 225 | 169 | 0.12 | 3.21 | 13.04 | 14.35 |
| Z50.2-E7 | 49 | −799 | 273 | 122 | 0.07 | 1.99 | 18.36 | 20.19 |
| Z50.1-E8 | 56 | −836 | 246 | 112 | 0.12 | 3.19 | 10.49 | 11.54 |
| Z50.2-E8 | 56 | −820 | 249 | 127 | 0.14 | 3.85 | 9.48 | 10.43 |
| Measure | Time | Ecorr | ba | bc | Rp | RpA | Icorr | Vr |
|---|---|---|---|---|---|---|---|---|
| No. | Days | mV | mV | mV | kΩ | kΩ cm2 | μA/cm2 | μm/Year |
| Z100.1-M0 | 0 | −300 | 304 | 94 | 1.42 | 39.33 | 0.79 | 0.87 |
| Z100.2-M0 | 0 | −779 | 204 | 213 | 0.19 | 5.21 | 8.69 | 8.69 |
| Z100.1-M1 | 7 | −323 | 323 | 85 | 1.46 | 40.36 | 0.72 | 0.80 |
| Z100.2-M1 | 7 | −796 | 216 | 192 | 0.18 | 5.07 | 8.71 | 8.71 |
| Z100.1-M2 | 14 | −331 | 294 | 81 | 1.58 | 43.71 | 0.63 | 0.69 |
| Z100.2-M2 | 14 | −757 | 195 | 207 | 0.18 | 4.85 | 8.99 | 8.99 |
| Z100.1-M3 | 21 | −331 | 294 | 80 | 1.39 | 38.56 | 0.71 | 0.78 |
| Z100.2-M3 | 21 | −711 | 174 | 176 | 0.24 | 6.76 | 5.62 | 5.62 |
| Z100.1-M4 | 28 | −348 | 319 | 82 | 1.41 | 39.08 | 0.72 | 0.80 |
| Z100.2-M4 | 28 | −707 | 176 | 172 | 0.22 | 6.04 | 6.26 | 6.26 |
| Z100.1-M5 | 35 | −547 | 275 | 119 | 0.46 | 12.74 | 2.83 | 3.11 |
| Z100.2-M5 | 35 | −688 | 179 | 170 | 0.22 | 6.01 | 6.30 | 6.30 |
| Z100.1-M6 | 42 | −476 | 276 | 113 | 0.53 | 14.60 | 2.38 | 2.62 |
| Z100.2-M6 | 42 | −628 | 199 | 156 | 0.17 | 4.74 | 8.02 | 8.02 |
| Z100.1-M7 | 49 | −461 | 270 | 110 | 0.37 | 10.14 | 3.35 | 3.68 |
| Z100.2-M7 | 49 | −827 | 200 | 170 | 0.15 | 4.02 | 9.93 | 9.93 |
| Z100.1-E0 | 0 | −934 | 256 | 102 | 0.13 | 3.66 | 8.66 | 9.53 |
| Z100.2-E0 | 0 | −675 | 143 | 216 | 0.08 | 2.27 | 16.45 | 16.45 |
| Z100.1-E1 | 7 | −720 | 274 | 168 | 0.17 | 4.65 | 9.72 | 10.69 |
| Z100.2-E1 | 7 | −432 | 378 | 128 | 0.10 | 2.66 | 15.61 | 15.61 |
| Z100.1-E2 | 14 | −624 | 206 | 172 | 0.15 | 4.24 | 9.60 | 10.56 |
| Z100.2-E2 | 14 | −461 | 305 | 159 | 0.14 | 3.74 | 12.14 | 12.14 |
| Z100.1-E3 | 21 | −405 | 398 | 118 | 0.16 | 4.38 | 9.03 | 9.93 |
| Z100.2-E3 | 21 | −451 | 263 | 114 | 0.11 | 3.02 | 11.44 | 11.44 |
| Z100.1-E4 | 28 | −254 | 355 | 112 | 0.26 | 7.09 | 5.21 | 5.73 |
| Z100.2-E4 | 28 | −554 | 303 | 149 | 0.16 | 4.46 | 9.73 | 9.73 |
| Z100.1-E5 | 35 | −465 | 246 | 173 | 0.27 | 7.42 | 5.94 | 6.54 |
| Z100.2-E5 | 35 | −555 | 275 | 174 | 0.20 | 5.60 | 8.27 | 8.27 |
| Z100.1-E6 | 42 | −197 | 429 | 90 | 0.32 | 8.95 | 3.61 | 3.97 |
| Z100.2-E6 | 42 | −537 | 213 | 181 | 0.19 | 5.37 | 7.91 | 7.91 |
| Z100.1-E7 | 49 | −172 | 393 | 82 | 0.27 | 7.56 | 3.90 | 4.29 |
| Z100.2-E7 | 49 | −335 | 246 | 186 | 0.28 | 7.84 | 5.87 | 5.87 |
| Z100.1-E8 | 56 | −148 | 305 | 179 | 0.51 | 14.21 | 3.45 | 3.79 |
| Z100.2-E8 | 56 | −339 | 412 | 136 | 0.28 | 7.73 | 5.74 | 5.74 |
Appendix B
| By Weight [%] | ||||||||
|---|---|---|---|---|---|---|---|---|
| Na | Al | Si | S | Cl | Ca | Fe | ||
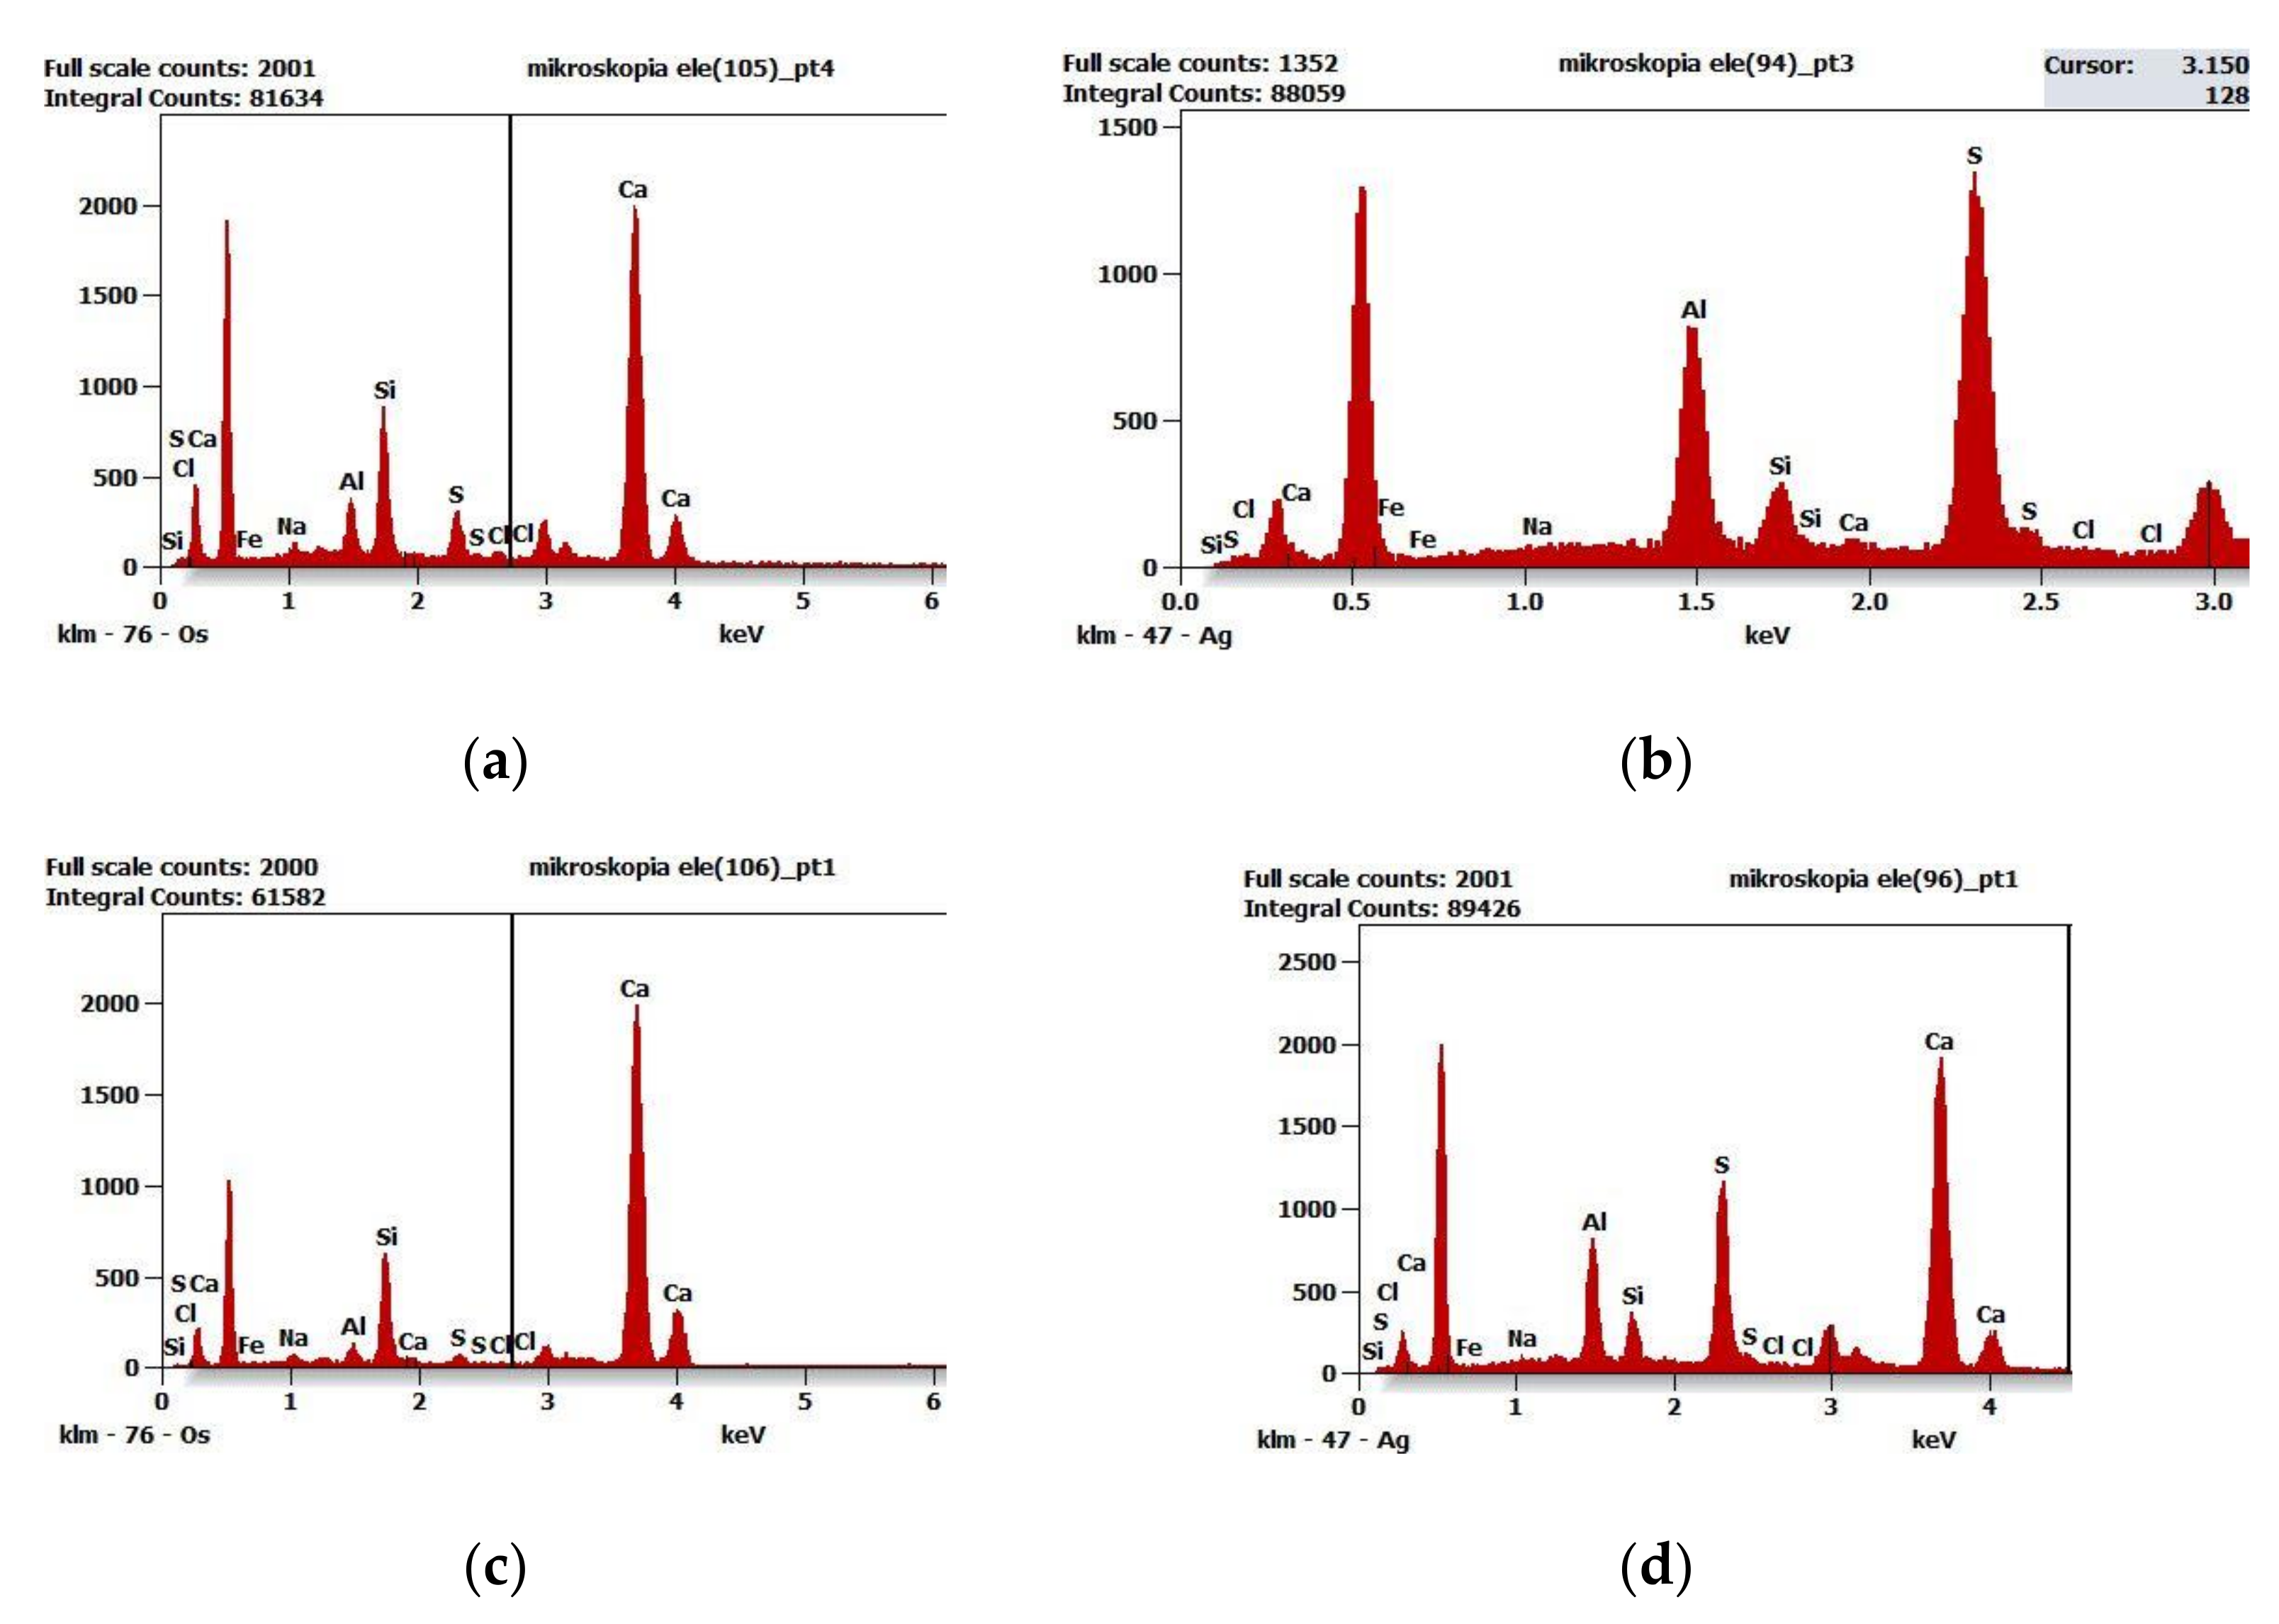
| Figure 14a | pt A | 0.6 | 0.5 | 1.0 | 0.3 | 0.1 | 97.3 | 0.1 |
| pt B | 0.9 | 1.4 | 36.0 | 2.8 | 2.3 | 52.8 | 3.8 | |
| pt C | 1.8 | 6.1 | 12.1 | 5.7 | 1.2 | 71.5 | 1.6 | |
| pt D | 1.3 | 5.0 | 14.0 | 5.9 | 1.9 | 70.2 | 1.9 | |
| pt E | 1.6 | 7.3 | 8.6 | 9.1 | 2.6 | 69.5 | 1.4 | |
| Figure 14b | pt A | 0.5 | 8.9 | 6.6 | 15.1 | 1.1 | 66.2 | 1.6 |
| pt B | 0.1 | 11.8 | 2.2 | 23.5 | 0.3 | 61.9 | 0.2 | |
| pt C | 0.1 | 11.3 | 3.1 | 22.2 | 1.8 | 60.4 | 1.0 | |
| pt D | 0.1 | 6.8 | 9.6 | 12.7 | 2.1 | 67.4 | 1.3 | |
| Figure 14c | pt A | 1.3 | 1.8 | 12.1 | 1.2 | 0.1 | 81.0 | 2.5 |
| pt B | 0.5 | 2.6 | 21.7 | 1.4 | 0.4 | 70.4 | 3.0 | |
| pt C | 1.4 | 2.8 | 16.6 | 1.8 | 0.2 | 74.6 | 2.6 | |
| Figure 14d | pt A | 0.7 | 10.7 | 4.3 | 20.4 | 1.7 | 60.9 | 1.3 |
| pt B | 0.1 | 9.8 | 5.7 | 17.6 | 2.4 | 63.2 | 1.3 | |
| pt C | 0.4 | 6.2 | 9.4 | 10.4 | 2.0 | 70.1 | 1.4 | |
| pt D | 0.6 | 4.9 | 10.1 | 7.6 | 1.9 | 72.6 | 2.2 | |
| Atomic [%] | ||||||||
|---|---|---|---|---|---|---|---|---|
| Na | Al | Si | S | Cl | Ca | Fe | ||
| Figure 14a | pt A | 1.0 | 0.8 | 1.5 | 0.4 | 0.2 | 96.2 | 0.1 |
| pt B | 1.3 | 1.8 | 44.0 | 3.0 | 2.3 | 45.3 | 2.3 | |
| pt C | 2.8 | 8.2 | 15.6 | 6.5 | 1.3 | 64.6 | 1.0 | |
| pt D | 2.1 | 6.7 | 18.0 | 6.6 | 1.9 | 63.5 | 1.2 | |
| pt E | 2.5 | 9.8 | 11.1 | 10.3 | 2.6 | 62.8 | 0.9 | |
| Figure 14b | pt A | 0.8 | 11.9 | 8.5 | 17.1 | 1.1 | 59.6 | 1.0 |
| pt B | 0.1 | 15.5 | 2.8 | 26.1 | 0.3 | 55.0 | 0.2 | |
| pt C | 0.1 | 15.0 | 4.0 | 24.7 | 1.8 | 53.7 | 0.6 | |
| pt D | 0.1 | 9.1 | 12.4 | 14.3 | 2.1 | 61.0 | 0.9 | |
| Figure 14c | pt A | 2.2 | 2.5 | 16.2 | 1.4 | 0.1 | 75.9 | 1.7 |
| pt B | 0.8 | 3.5 | 28.0 | 1.6 | 0.4 | 63.7 | 2.0 | |
| pt C | 2.3 | 3.8 | 21.7 | 2.0 | 0.2 | 68.3 | 1.7 | |
| Figure 14d | pt A | 1.1 | 14.1 | 5.5 | 22.7 | 1.7 | 54.1 | 0.8 |
| pt B | 0.1 | 13.0 | 7.3 | 19.7 | 2.4 | 56.7 | 0.8 | |
| pt C | 0.7 | 8.4 | 12.2 | 11.9 | 2.0 | 63.9 | 0.9 | |
| pt D | 1.0 | 6.7 | 13.2 | 8.8 | 2.0 | 66.8 | 1.5 | |
| By Weight [%] | ||||||||
|---|---|---|---|---|---|---|---|---|
| Na | Al | Si | S | Cl | Ca | Fe | ||
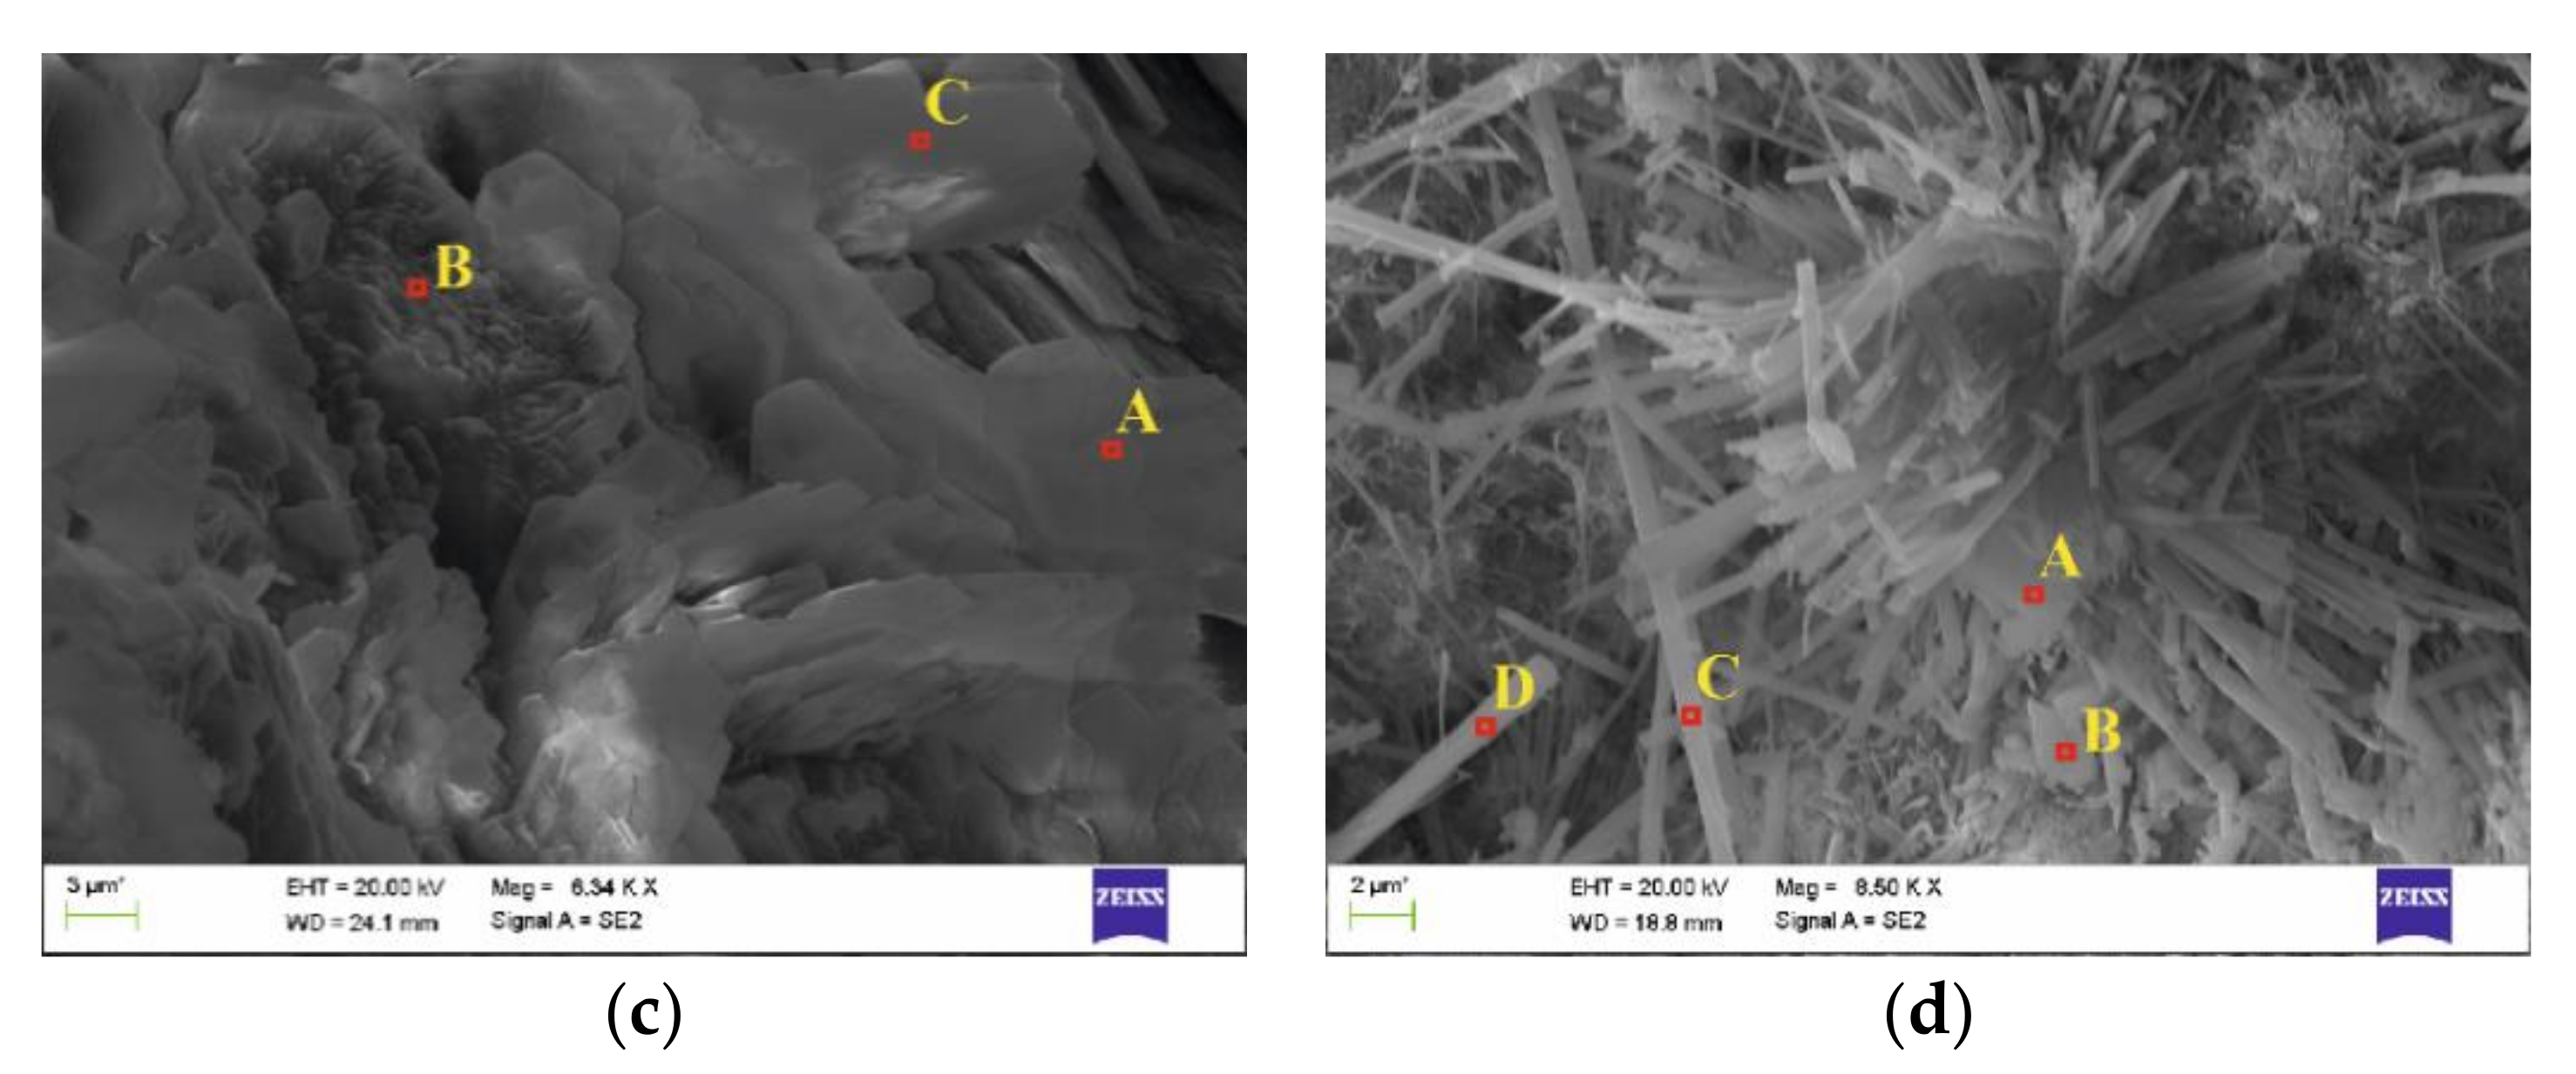
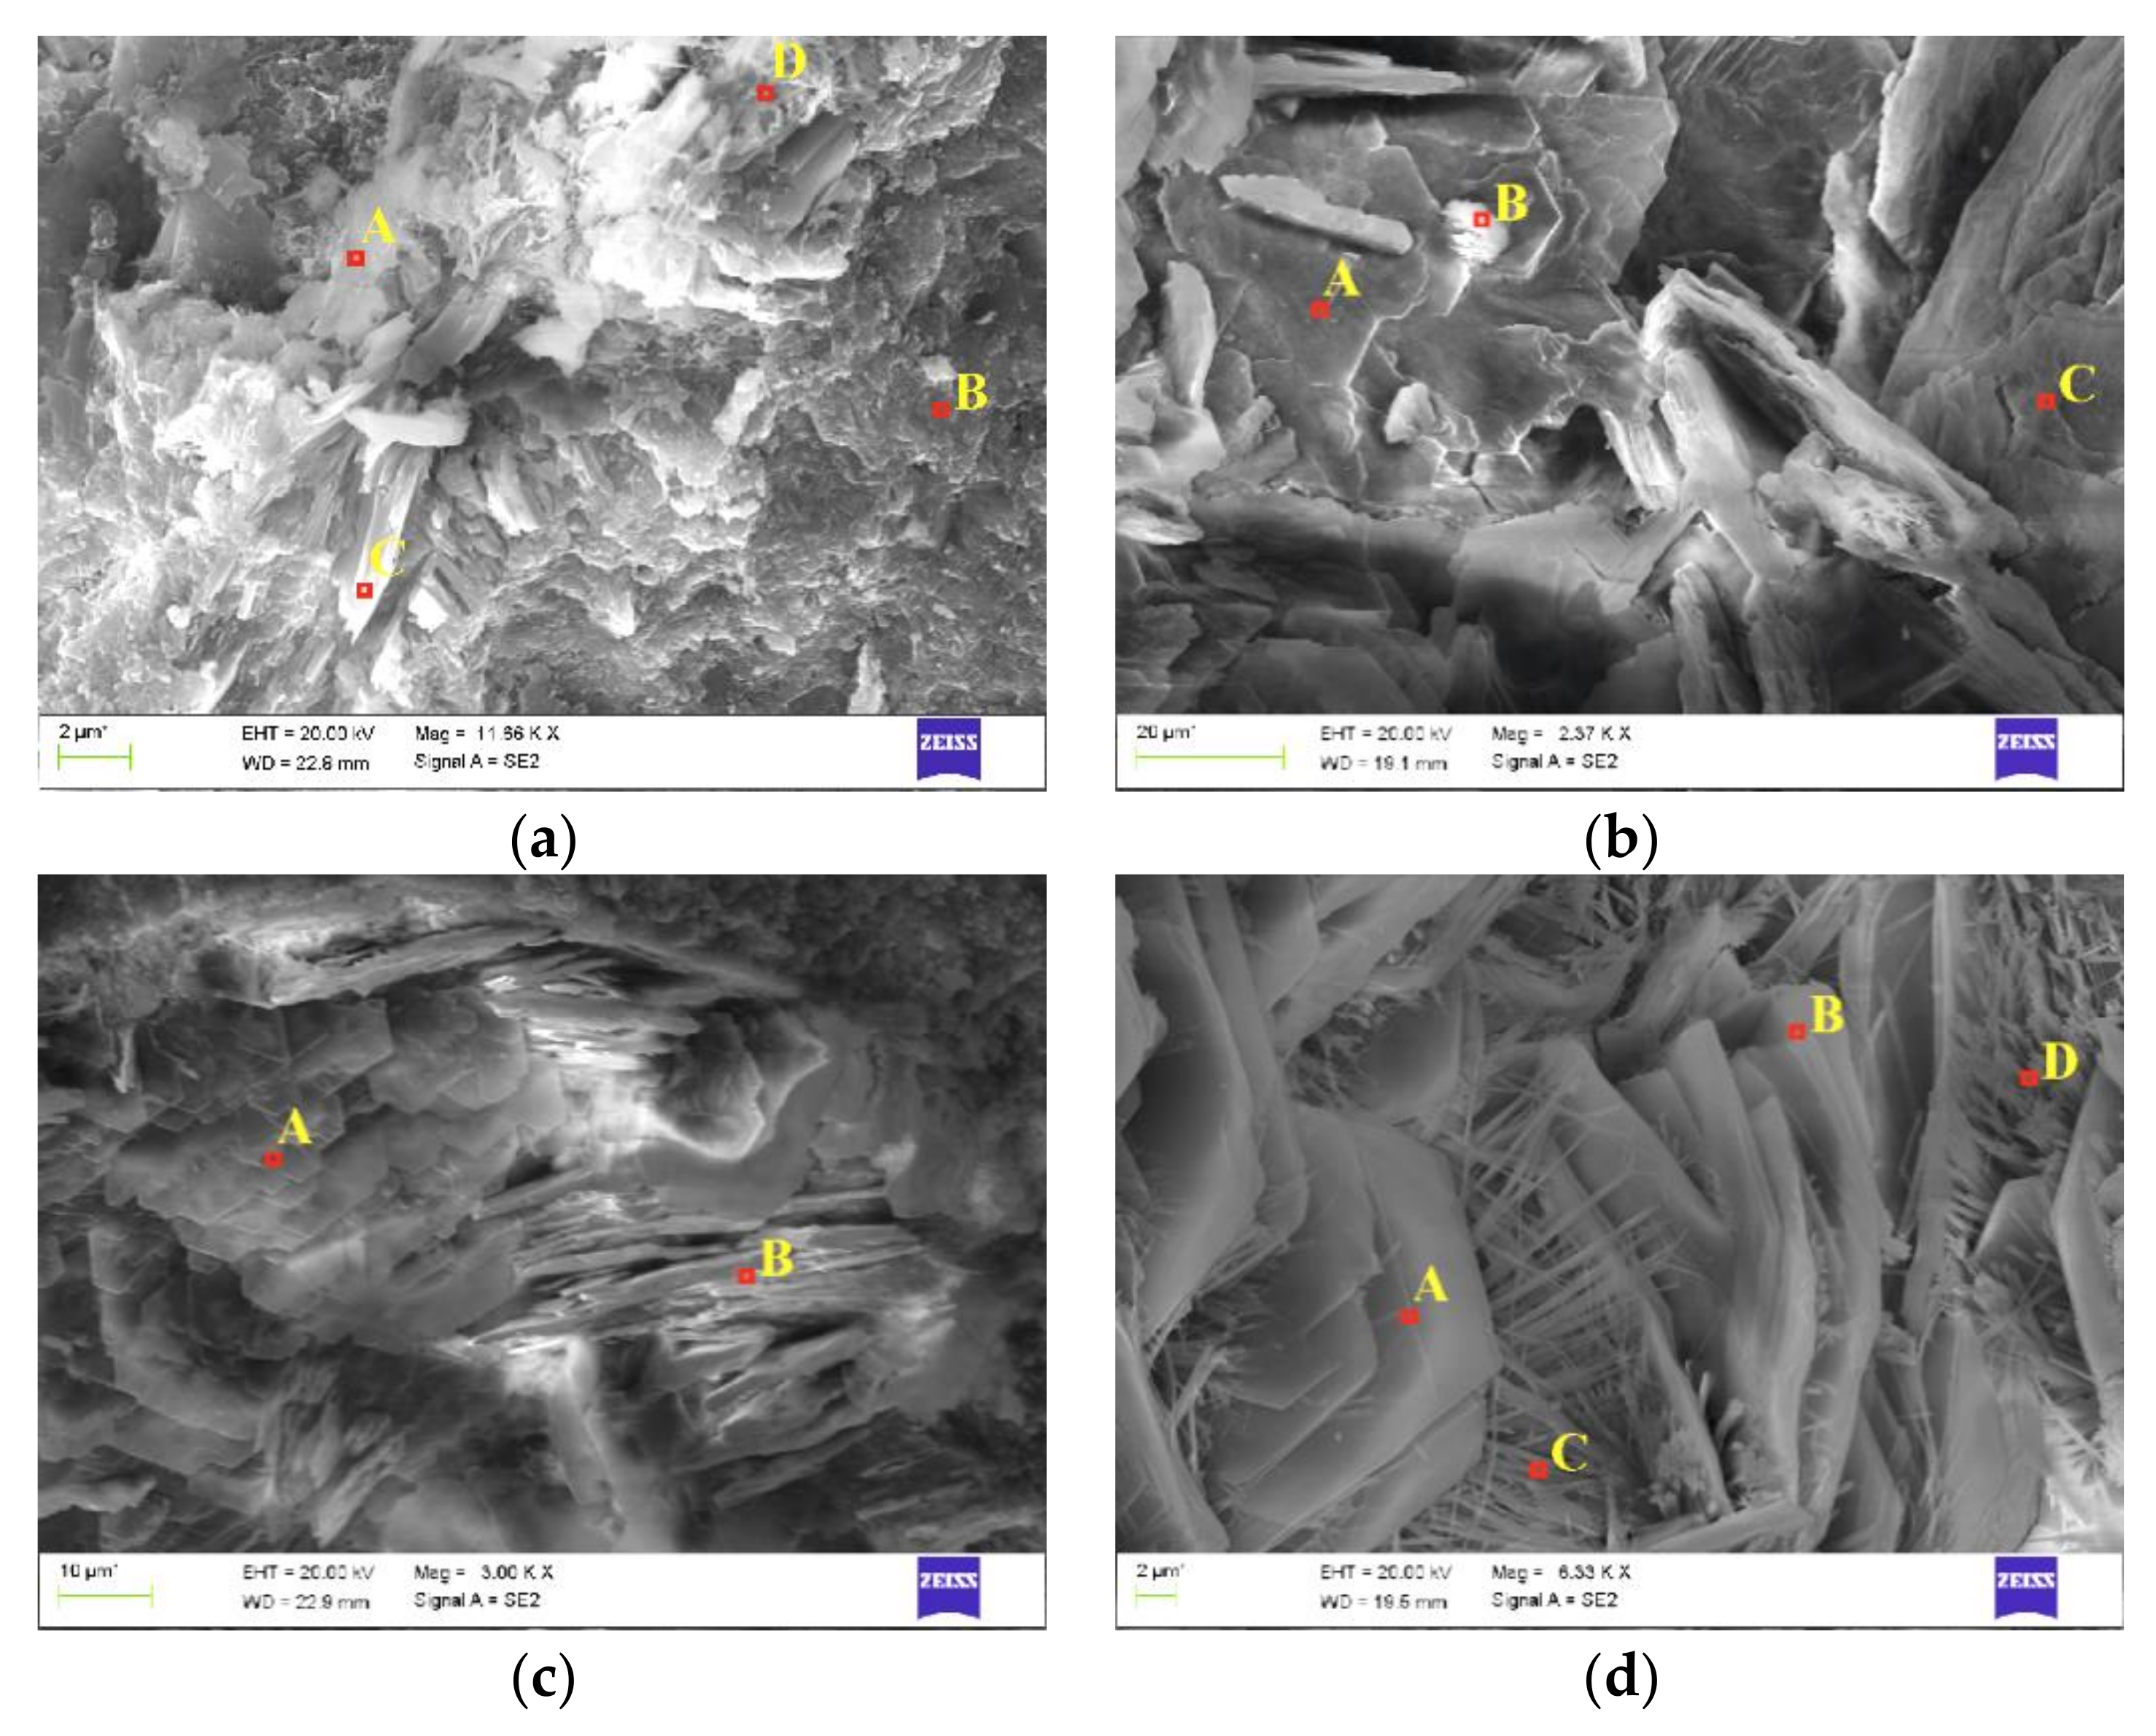
| Figure 16a | pt A | 0.0 | 0.9 | 28.4 | 1.6 | 0.1 | 68.1 | 0.9 |
| pt B | 0.2 | 0.9 | 76.8 | 2.0 | 0.1 | 19.7 | 0.3 | |
| pt C | 0.3 | 3.7 | 9.9 | 2.8 | 1.9 | 79.7 | 1.7 | |
| pt D | 0.3 | 1.2 | 35.1 | 2.1 | 0.2 | 60.0 | 1.0 | |
| Figure 16b | pt A | 3.4 | 4.4 | 30.0 | 4.5 | 0.0 | 43.0 | 14.7 |
| pt B | 2.6 | 4.1 | 41.1 | 1.6 | 0.9 | 32.3 | 17.3 | |
| pt C | 0.9 | 1.9 | 41.9 | 4.7 | 0.2 | 39.1 | 11.4 | |
| Figure 16c | pt A | 0.6 | 1.8 | 5.3 | 3.3 | 0.3 | 87.2 | 1.5 |
| pt B | 0.5 | 1.9 | 5.3 | 4.1 | 0.1 | 86.4 | 1.5 | |
| Figure 16d | pt A | 0.3 | 3.4 | 4.3 | 3.7 | 1.1 | 84.1 | 3.2 |
| pt B | 0.4 | 4.9 | 4.9 | 4.6 | 1.2 | 79.8 | 4.3 | |
| pt C | 0.1 | 2.2 | 3.7 | 3.2 | 0.2 | 86.5 | 4.0 | |
| pt D | 0.6 | 2.4 | 4.8 | 4.3 | 0.1 | 84.0 | 3.7 | |
| Atomic [%] | ||||||||
|---|---|---|---|---|---|---|---|---|
| Na | Al | Si | S | Cl | Ca | Fe | ||
| Figure 16a | pt A | 0.0 | 1.1 | 35.9 | 1.8 | 0.1 | 60.4 | 0.6 |
| pt B | 0.3 | 1.0 | 81.9 | 1.8 | 0.1 | 14.7 | 0.2 | |
| pt C | 0.4 | 5.2 | 13.3 | 3.3 | 2.0 | 74.7 | 1.1 | |
| pt D | 0.5 | 1.5 | 43.1 | 2.3 | 0.2 | 51.7 | 0.6 | |
| Figure 16b | pt A | 5.2 | 5.8 | 37.4 | 4.9 | 0.0 | 37.6 | 9.2 |
| pt B | 3.9 | 5.2 | 50.1 | 1.7 | 0.9 | 27.6 | 10.6 | |
| pt C | 1.3 | 2.4 | 50.9 | 5.0 | 0.2 | 33.2 | 6.9 | |
| Figure 16c | pt A | 1.0 | 2.6 | 7.3 | 3.9 | 0.3 | 83.8 | 1.0 |
| pt B | 0.9 | 2.7 | 7.3 | 5.0 | 0.1 | 82.9 | 1.1 | |
| Figure 16d | pt A | 0.4 | 4.9 | 5.8 | 4.4 | 1.2 | 81.0 | 2.2 |
| pt B | 0.6 | 7.0 | 6.6 | 5.4 | 1.3 | 76.1 | 2.9 | |
| pt C | 0.2 | 3.2 | 5.1 | 3.9 | 0.2 | 84.5 | 2.8 | |
| pt D | 1.0 | 3.5 | 6.7 | 5.2 | 0.1 | 81.0 | 2.6 | |
References
- Ramezanianpour, A.A.; Ghahari, S.A.; Esmaeili, M. Effect of combined carbonation and chloride ion ingress by an accelerated test method on microscopic and mechanical properties of concrete. Constr. Build. Mater. 2014, 58, 138–146. [Google Scholar] [CrossRef]
- Yang, C.C. On the relationship between pore structure and chloride diffusivity from accelerated chloride migration test in cement-based materials. Cem. Concr. Res. 2006, 36, 1304–1311. [Google Scholar] [CrossRef]
- Marcotte, T.D.; Hansson, C.M.; Hope, B.B. The Effect of the Electrochemical Chloride Extraction Treatment on Steel-Reinforced Mortar Part II: Microstructural Characterization; Elsevier: Amsterdam, The Netherlands, 1999; Volume 29. [Google Scholar]
- Siegwart, M.; Lyness, J.F.; McFarland, B.J. Change of pore size in concrete due to electrochemical chloride extraction and possible implications for the migration of ions. Cem. Concr. Res. 2003, 33, 1211–1221. [Google Scholar] [CrossRef]
- ACI 201.2R-08. Guide to Durable Concrete; American Concrete Institute: Farmington Hills, MI, USA, 2008; ISBN 9780870312847.
- ACI Committee 357. Anon Revisions to: Guide for the Design and Construction of Fixed Offshore Concrete Structures. J. Am. Concr. Inst. 1984, 81, 632–639. [Google Scholar] [CrossRef]
- PN-EN 206-1; Beton Część 1: Wymagania, Właściwości i Zgodność. Polish Committee for Standardization: Warsaw, Poland, 2004; pp. 1–70. (In Polish)
- BS 8110; Part 1, Structural Use of Concrete–Code of Practice for Design and Construction. British Standards Institute: London, UK, 1985; Volume 38.
- ACI 222R-01; Protection of Metals in Concrete against Corrosion. ACI Committee 222: Farmington Hills, MI, USA, 2001; pp. 1–41.
- Xu, J.; Zhan, P.; Zhou, W.; Zuo, J.; Shah, S.P.; He, Z. Design and assessment of eco-friendly ultra-high performance concrete with steel slag powder and recycled glass powder. Powder Technol. 2023, 419, 118356. [Google Scholar] [CrossRef]
- Zhan, P.; Xu, J.; Wang, J.; Zuo, J.; He, Z. Structural supercapacitor electrolytes based on cementitious composites containing recycled steel slag and waste glass powders. Cem. Concr. Compos. 2023, 137, 104924. [Google Scholar] [CrossRef]
- Huang, H.; Ye, G.; Damidot, D. Cement and Concrete Research Effect of blast furnace slag on self-healing of microcracks in cementitious materials. Cem. Concr. Res. 2014, 60, 68–82. [Google Scholar] [CrossRef]
- Alwaeli, M. Application of granulated lead—Zinc slag in concrete as an opportunity to save natural resources. Radiat. Phys. Chem. 2013, 83, 54–60. [Google Scholar] [CrossRef]
- Weeks, C.; Hand, R.J.; Sharp, J.H. Cement & Concrete Composites Retardation of cement hydration caused by heavy metals present in ISF slag used as aggregate. Cem. Concr. Compos. 2008, 30, 970–978. [Google Scholar] [CrossRef]
- Kanneboina, Y.Y.; Kabeer KS, A.; Bisht, K. Valorization of lead and zinc slags for the production of construction materials—A review for future research direction. Constr. Build. Mater. 2023, 367, 130314. [Google Scholar] [CrossRef]
- Alwaeli, M. Investigation of gamma radiation shielding and compressive strength properties of concrete containing scale and granulated lead-zinc slag wastes. J. Clean. Prod. 2017, 166, 157–162. [Google Scholar] [CrossRef]
- Morrison, C.; Hooper, R.; Lardner, K. The use of ferro-silicate slag from ISF zinc production as a sand replacement in concrete. Cem. Concr. Res. 2003, 33, 2085–2089. [Google Scholar] [CrossRef]
- Alex, T.C.; Kalinkin, A.M.; Nath, S.K.; Gurevich, B.I.; Kalinkina, E.V.; Tyukavkina, V.V.; Kumar, S. Utilization of zinc slag through geopolymerization: Influence of milling atmosphere. Int. J. Miner. Process. 2013, 123, 102–107. [Google Scholar] [CrossRef]
- Xia, M.; Muhammad, F.; Zeng, L.; Li, S.; Huang, X.; Jiao, B.; Shiau, Y.; Li, D. Solidification/stabilization of lead-zinc smelting slag in composite based geopolymer. J. Clean. Prod. 2019, 209, 1206–1215. [Google Scholar] [CrossRef]
- Zhang, P.; Muhammad, F.; Yu, L.; Xia, M.; Lin, H.; Huang, X.; Jiao, B.; Shiau, Y.; Li, D. Self-cementation solidification of heavy metals in lead-zinc smelting slag through alkali-activated materials. Constr. Build. Mater. 2020, 249, 118756. [Google Scholar] [CrossRef]
- Saedi, A.; Jamshidi-zanjani, A.; Khodadadi, A.; Mohseni, M.; Nejati, H. Utilization of lead—Zinc mine tailings as cement substitutes in concrete construction: Effect of sulfide content. J. Build. Eng. 2022, 57, 104865. [Google Scholar] [CrossRef]
- Chen, W.; Peng, R.; Straub, C.; Yuan, B. Promoting the performance of one-part alkali-activated slag using fine lead-zinc mine tailings. Constr. Build. Mater. 2020, 236, 117745. [Google Scholar] [CrossRef]
- Tripathi, B.; Chaudhary, S. Performance based evaluation of ISF slag as a substitute of natural sand in concrete. J. Clean. Prod. 2016, 112, 672–683. [Google Scholar] [CrossRef]
- Szweda, Z.; Ponikiewski, T.; Katzer, J. A study on replacement of sand by granulated ISP slag in SCC as a factor formatting its durability against chloride ions. J. Clean. Prod. 2017, 156, 569–576. [Google Scholar] [CrossRef]
- De Almeida Souza, L.R.; de Medeiros, M.H.F.; Pereira, E.; Capraro, A.P.B. Electrochemical chloride extraction: Efficiency and impact on concrete containing 1% of NaCl. Constr. Build. Mater. 2017, 145, 435–444. [Google Scholar] [CrossRef]
- Szweda, Z.; Jaśniok, T.; Jaśniok, M. Evaluation of the effectiveness of electrochemical chloride extraction from concrete on the basis of testing reinforcement polarization and chloride concentration. Ochr. Przed Korozją 2018, 61, 3–9. [Google Scholar]
- Melara, E.K.; Mendes, A.Z.; Andreczevecz, N.C.; Bragança, M.O.G.P.; Carrera, G.T.; Medeiros-Junior, R.A. Monitoring by electrochemical impedance spectroscopy of mortars subjected to ingress and extraction of chloride ions. Constr. Build. Mater. 2020, 242, 118001. [Google Scholar] [CrossRef]
- Chen, X.; Fu, F.; Wang, H.; Liang, Q.; Yu, A.; Qian, K.; Chen, P. A multi-phase mesoscopic simulation model for the long-term chloride ingress and electrochemical chloride extraction. Constr. Build. Mater. 2021, 270, 121826. [Google Scholar] [CrossRef]
- Zhu, Z.; Chu, H.; Guo, M.Z.; Shen, M.; Jiang, L.; Yu, L. Effect of silica fume and fly ash on the stability of bound chlorides in cement mortar during electrochemical chloride extraction. Constr. Build. Mater. 2020, 256, 119481. [Google Scholar] [CrossRef]
- Jin, Z.; Hou, D.; Zhao, T. Electrochemical chloride extraction (ECE) based on the high performance conductive cement-based composite anode. Constr. Build. Mater. 2018, 173, 149–159. [Google Scholar] [CrossRef]
- Mao, J.; Yu, K.; Xu, Y.; Wu, X.; Jin, W.; Xu, C.; Pan, C. Experimental research on the distribution of chloride ion migration in concrete cover during electrochemical chloride extraction treatment. Int. J. Electrochem. Sci. 2016, 11, 4076–4083. [Google Scholar] [CrossRef]
- Miranda, J.M.; Cobo, A.; Otero, E.; González, J.A. Limitations and advantages of electrochemical chloride removal in corroded reinforced concrete structures. Cem. Concr. Res. 2007, 37, 596–603. [Google Scholar] [CrossRef]
- Chang, C.C.; Yeih, W.; Chang, J.J.; Huang, R. Effects of stirrups on electrochemical chloride removal efficiency. Constr. Build. Mater. 2014, 68, 692–700. [Google Scholar] [CrossRef]
- Nguyen, T.H.Y.; Tran, V.M.; Pansuk, W.; Cao, N.T.; Bui, V.H.L. Electrochemical chloride extraction on reinforced concrete contaminated external chloride: Efficiencies of intermittent applications and impacts on hydration products. Cem. Concr. Compos. 2021, 121, 104076. [Google Scholar] [CrossRef]
- Swamy, R.N.; McHugh, S. Effectiveness and structural implications of electrochemical chloride extraction from reinforced concrete beams. Cem. Concr. Compos. 2006, 28, 722–733. [Google Scholar] [CrossRef]
- Brito, P.S.D. Monitoring of Electrochemical Chloride Extraction (Ece) From Reinforced Concrete Elements. J. Mater. Sci. Eng. Adv. Technol. 2013, 8, 1–26. [Google Scholar]
- Muralidharan, S.; Ha, T.H.; Bae, J.H.; Ha, Y.C.; Lee, H.G.; Kim, D.K. A promising potential embeddable sensor for corrosion monitoring application in concrete structures. Meas. J. Int. Meas. Confed. 2007, 40, 600–606. [Google Scholar] [CrossRef]
- Katzer, J. Median diameter as a grading characteristic for fine aggregate cement composite designing. Constr. Build. Mater. 2012, 35, 884–887. [Google Scholar] [CrossRef]
- Adamczyk, Z.; Nowińska, K.; Melaniuk-Wolny, E.; Szewczenko, J. Variation of the content of accompanying elements in galena in pyrometallurgical process of zinc and lead production. Acta Montan. Slovaca 2013, 18, 158–163. [Google Scholar]
- Szweda, Z.; Gołaszewski, J.; Ghosh, P.; Lehner, P.; Konečný, P. Comparison of Standardized Methods for Determining the Diffusion Coefficient of Chloride in Concrete with Thermodynamic Model of Migration. Materials 2023, 16, 637. [Google Scholar] [CrossRef] [PubMed]
- Szweda, Z.; Zybura, A. Theoretical model and experimental tests on chloride diffusion and migration processes in concrete. Procedia Eng. 2013, 57, 1121–1130. [Google Scholar]
- Kayyali, O.A.; Haque, M.N. The C1−/OH− ratio in chloride-contaminated concrete—A most important criterion. Mag. Concr. Res. 1995, 47, 235–242. [Google Scholar] [CrossRef]
- Scully, J.R. Polarization Resistance Method for Determination of Instantaneous Corrosion Rates. Corrosion 2000, 56, 199–218. [Google Scholar] [CrossRef]
- Szweda, Z. Estimating coefficient of chloride extraction from concrete. Ochr. Przed Koroz. 2019, 12, 393–398. [Google Scholar] [CrossRef]
- Szweda, Z. Evaluating the Impact of Concrete Design on the Effectiveness of the Electrochemical Chloride Extraction Process. Materials 2023, 16, 666. [Google Scholar] [CrossRef]
- Szweda, Z.; Jaśniok, T.; Jaśniok, M. Ocena skuteczności zabiegu elektrochemicznej ekstrakcji chlorków z betonu na podstawie badań polaryzacyjnych zbrojenia i stężenia chlorków. Ochr. Przed Korozją 2018, 1, 5–11. [Google Scholar] [CrossRef]
- Raczkiewicz, W. Use of polypropylene fi bres to increase the resistance of reinforcement to chloride corrosion in concretes. Sci. Eng. Compos. Mater. 2021, 22, 555–567. [Google Scholar] [CrossRef]
- Ki Beom, K.; Pil Hwang, J.; Yong Ann, K. Influence of cementitious binder on chloride removal under. Constr. Build. Mater. 2016, 104, 191–197. [Google Scholar] [CrossRef]


| No. | Compressive Strength [MPa] | Volume Weight [kg/m3] | Porosity [%] |
|---|---|---|---|
| Z0 | 48.6 | 2320 | 8 |
| Z25 | 47.5 | 2370 | 8 |
| Z50 | 46.8 | 2470 | 7 |
| Z100 | 42.4 | 2620 | 10 |
| Constituent | SiO2 | Al2O3 | Fe2O3 | CaO | MgO | K2O | Na2O | Eq. Na2O | SO3 | Cl |
|---|---|---|---|---|---|---|---|---|---|---|
| % mass | 19.38 | 4.57 | 3.59 | 63.78 | 1.38 | 0.58 | 0.21 | 0.59 | 3.26 | 0.069 |
| Time of Extraction t (Hour (Days)) | 24 | 168 | 336 | 504 | 600 | 672 | |
|---|---|---|---|---|---|---|---|
| (1) | (7) | (14) | (21) | (25) | (28) | ||
| initial concentration (%) | Z0 | 1.6 | 1.53 | 1.48 | 1.44 | 1.42 | 1.40 |
| Z25 | 0.95 | 0.85 | 0.76 | 0.68 | 0.63 | 0.60 | |
| Z50 | 1.2 | 0.8 | 0.59 | 0.57 | 0.56 | 0.55 | |
| Z100 | 1.3 | 1.1 | 0.93 | 0.82 | 0.75 | 3.07 | |
| extraction coefficient (10−10 m2/s) | Z0 | 2.0 | 2.67 | 2.53 | 1.72 | 1.25 | 0.9 |
| Z25 | 5.0 | 4.67 | 4.06 | 3.28 | 2.83 | 2.5 | |
| Z50 | 2.0 | 1.13 | 0.61 | 0.46 | 0.37 | 0.3 | |
| Z100 | 2.0 | 1.53 | 1.12 | 0.81 | 0.63 | 0.5 | |
| Another Measurement Day | Type of Measurement | Another Measurement Day | Type of Measurement |
|---|---|---|---|
| M0 (1 day) | reference measurement prior to migration | E0 (266 day) | reference measurement prior to extraction |
| M1 (15 day) | measurement after 7 days of chloride migration to concrete and after 7 days of waiting after turning off the system | E1 (280 day) | measurement after 7 days of chloride extraction and after 7 days of waiting after turning off the system |
| M2 (22 day) | measurement after 7 days from the previous measurement | E2 (287 day) | measurement after 7 days from the previous measurement |
| M3 (36 day) | measurement after 14 days of chloride migration to concrete and after 7 days of waiting after turning off the system | E3 (301 day) | measurement after 14 days of chloride extraction and after 7 days of waiting after turning off the system |
| M4 (43 day) | measurement after 7 days from the previous measurement | E4 (308 day) | measurement after 7 days from the previous measurement |
| M5 (57 day) | measurement after 21 days of chloride migration to concrete and after 7 days of waiting after turning off the system | E5 (322 day) | measurement after 21 days of chloride migration to concrete and after 7 days of waiting after turning off the system |
| M6 (64 day) | measurement after 7 days from the previous measurement | E6 (329 day) | measurement after 7 days from the previous measurement |
| M7 (78 day) | measurement after 28 days of chloride migration to concrete and after 7 days of waiting after turning off the system | E7 (343 day) | measurement after 28 days of chloride extraction and after 7 days of waiting after turning off the system |
| break in the study lasting 6 months | E8 (350 day) | measurement after 7 days from the previous measurement |
Disclaimer/Publisher’s Note: The statements, opinions and data contained in all publications are solely those of the individual author(s) and contributor(s) and not of MDPI and/or the editor(s). MDPI and/or the editor(s) disclaim responsibility for any injury to people or property resulting from any ideas, methods, instructions or products referred to in the content. |
© 2023 by the authors. Licensee MDPI, Basel, Switzerland. This article is an open access article distributed under the terms and conditions of the Creative Commons Attribution (CC BY) license (https://creativecommons.org/licenses/by/4.0/).
Share and Cite
Szweda, Z.; Mazurkiewicz, J.; Konečný, P.; Ponikiewski, T. Effect of Imperial Smelting Process Slag Addition in Self Compacting Concrete Concrete on the Efficiency of Electrochemical Chloride Extraction. Materials 2023, 16, 5159. https://doi.org/10.3390/ma16145159
Szweda Z, Mazurkiewicz J, Konečný P, Ponikiewski T. Effect of Imperial Smelting Process Slag Addition in Self Compacting Concrete Concrete on the Efficiency of Electrochemical Chloride Extraction. Materials. 2023; 16(14):5159. https://doi.org/10.3390/ma16145159
Chicago/Turabian StyleSzweda, Zofia, Janusz Mazurkiewicz, Petr Konečný, and Tomasz Ponikiewski. 2023. "Effect of Imperial Smelting Process Slag Addition in Self Compacting Concrete Concrete on the Efficiency of Electrochemical Chloride Extraction" Materials 16, no. 14: 5159. https://doi.org/10.3390/ma16145159
APA StyleSzweda, Z., Mazurkiewicz, J., Konečný, P., & Ponikiewski, T. (2023). Effect of Imperial Smelting Process Slag Addition in Self Compacting Concrete Concrete on the Efficiency of Electrochemical Chloride Extraction. Materials, 16(14), 5159. https://doi.org/10.3390/ma16145159