Abstract
In this work, the structural characteristics and DC electrical conductivity of firstly synthesized organic–inorganic nanocomposites of thermoelectric Te0 nanoparticles (1.4, 2.8, 4.3 wt%) and poly(1-vinyl-1,2,4-triazole) (PVT) were analyzed. The composites were characterized by high-resolution transmission electron microscopy, X-ray diffractometry, UV-Vis spectroscopy, and dynamic light scattering analysis. The study results showed that the nanocomposite nanoparticles distributed in the polymer matrix had a shape close to spherical and an average size of 4–18 nm. The average size of the nanoparticles was determined using the Brus model relation. The optical band gap applied in the model was determined on the basis of UV-Vis data by the Tauc method and the 10% absorption method. The values obtained varied between 2.9 and 5.1 nm. These values are in good agreement with the values of the nanoparticle size, which are typical for their fractions presented in the nanocomposite. The characteristic sizes of the nanoparticles in the fractions obtained from the Pesika size distribution data were 4.6, 4.9, and 5.0 nm for the nanocomposites with percentages of 1.4, 2.8, and 4.3%, respectively. The DC electrical conductivity of the nanocomposites was measured by a two-probe method in the temperature range of 25–80 °C. It was found that the formation of an inorganic nanophase in the PVT polymer as well as an increase in the average size of nanoparticles led to an increase in the DC conductivity over the entire temperature range. The results revealed that the DC electrical conductivity of nanocomposites with a Tellurium content of 2.8, 4.3 wt% at 80 °C becomes higher than the conventional boundary of 10−10 S/cm separating dielectrics and semiconductors.
1. Introduction
Electronic devices that consume electrical energy and inevitably produce parasitic heat are now widespread. The demand for systems that convert heat into electrical energy is therefore growing critically. It is known that the construction of the systems is possible in the form of a combination of thermoelectric coolers (TEC) and thermoelectric generators (TEG) [1]. The conversion efficiency of TEC and TEG is directly related to the thermoelectric figure of merit (ZT) of the materials implemented as thermoelectric cell legs. Currently, an active search for high-ZT thermoelectrics is underway. Particular attention is paid to the development of polymer-based thermoelectrics (PTs) due to their advantages over completely inorganic systems [2], such as low cost, environmental friendliness and diversity of synthesis methods, low thermal conductivity, relatively light weight, mechanical flexibility, etc. [3]. One important class of PTs are organo–inorganic nanocomposites that combine the thermoelectric properties of their inorganic nanophase (metal chalcogenides and oxides as well as elemental chalcogenes, in particular Te0 [4,5,6,7,8,9,10]) with the performance and mechanical properties of polymer matrices. The PTs exhibit a relatively high Seebeck coefficient and low thermal conductivity. The use of insulating polymers as matrices for nanocomposites compared to conducting polymers allows the production of cheaper and more stable thermoelectrics with features important in practice (flexibility, extensibility, thermoplasticity).
The most widely applied polymers in PT creation are polyvinylidene fluoride [11], polyvinyl alcohol [12], polymethyl methacrylate [6], cellulose [5], and polyvinylpyrrolidone [13], etc. According to the literature, the direct incorporation of nanoparticles into the polymer matrix is achieved by combining the pre-synthesized nanoparticles and polymer in a solution with a subsequent drop casting, hot compaction [11,14], or vacuum filtration [11], mechanical pressing [11], or screen printing [15]. It should be noted that the above methods of PT creation are time consuming, often based on the application of special equipment providing sonication [16,17], high-pressure action [13], and high temperatures [10,12], as well as the use of organic toxic solvents and an extensive range of nanoparticle precursors (NaBr [5], Na2TeO3 [10], NaBH4 [10], Na2SeO3 [11], TeO2 [6,14], SeO2 [13], NH2OH [14], CuSO4 [18]), which have toxic and environmentally unfriendly properties.
In this regard, the use of previously developed simple and environmentally friendly methods of producing chalcogen containing nanoparticles [19,20], particularly Te0 ones from the commercially available bulk Te powder, as well as the application of the original polymer poly(1-vinyl-1,2,4-triazole) (PVT) in the form of a polymeric stabilizing matrix for the nanoparticle formation, seems highly promising for the synthesis of thermoelectric nanocomposites. The PVT exhibits a complex of practically important properties such as high hydrophilicity, solubility in polar organic solvents, ability for complexation and quaternization, chemical stability, biocompatibility, and thermal stability. In addition, triazole-containing polymers were previously experimentally found to behave as effective stabilizing matrices when forming metal-containing nanocomposites, exhibiting a synergy of unique polymer properties (solubility, biocompatibility, high coordination ability) and the optical, catalytic, and biological properties of metal nanoparticles [21,22,23,24]. At the same time, Te as a thermoelectric direct-gap semiconductor has been successfully used in the creation of polymeric organic–inorganic thermoelectrics with a p-type conductivity and both a conductive [25] and insulating matrix [10,26,27,28].
The paper presents the results of the polymer thermoelectrics synthesis of a Te nanophase and a PVT original polymer matrix with p-type conductivity and the study of the influence of nanocomposite structural features determined by the PVT: Te relation on their DC electrical conductivity.
2. Materials and Methods
2.1. Materials
NaOH (Reahim, Moscow, Russia), hydrazine hydrate (Reahim, Moscow, Russia), acetone (Reahim, Moscow, Russia), azobisisobutyronitrile (Sigma Aldrich, Burlington, VT, USA), dimethylformamide (Reahim, Moscow, Russia), and tellurium powder (Thermo Fisher, Kandel, Germany) were used without additional purification.
2.2. Methods
2.2.1. Synthesis of PVT
The synthesis of PVT was carried out by a radical polymerization method of 1-vinyl-1,2,4-triazole (VT) in the presence of an azobisisobutyronitrile (AIBN) initiator in a dimethylformamide (DMFA) medium under an argon atmosphere and a temperature of 60 °C during 6 h, according to the protocol detailed in the paper [24].
Briefly, VT (1.5 g, 16.0 mmol), AIBN (0.015 g, 0.09 mmol), and DMFA (1.0 g) were placed in a glass ampoule, flasked with argon, then sealed and incubated in the thermostat at 60 °C for 6 h. The resulting PVT was isolated and purified by a double resuspension in a mixture of ethanol and acetone (1:2), and then dried to a constant mass in a vacuum oven over phosphorus pentoxide at 50 °C. The average molecular weight of the polymer was 110 kDa and the weight average molecular weight was 211 kDa. The polydispersity coefficient was 1.92 (Figure 1). The PVT obtained in a 92% yield was a white powder, well soluble in water, DMF, and DMSO. The calculated % were C 50.52; H 5.26; and N 44.22 The found % were C 50.61; H 5.25; and N 44.14.
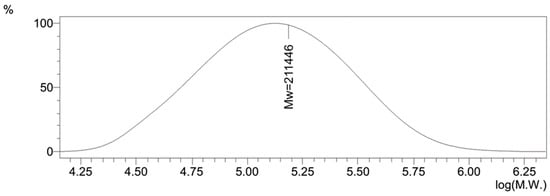
Figure 1.
The molecular weight distribution of PVT.
Using the method of nuclear magnetic resonance 1H and 13C, the structure of the obtained polymer was confirmed (Figure 2). The 1H NMR (DMSO- d6, δ, ppm) was 8.08–7.41 (br m., 2H, triazole ring), 4.15–2.66 (br m., 1H, CH in the polymer backbone), 2.25–1.60 (br, 2H, CH2 in the polymer backbone); the 13C NMR (DMSO- d6, δ, ppm) was 152.50–150.50, 145.00–142.5 (CH, triazole ring), 55.00–52.20 (CH in the polymer backbone), and 41.40–38.20 (probably the signals of carbon atoms of methylene groups CH2 of the polymer backbone overlap with solvent signals).
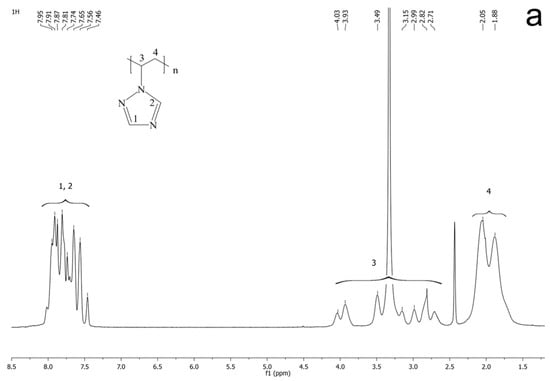
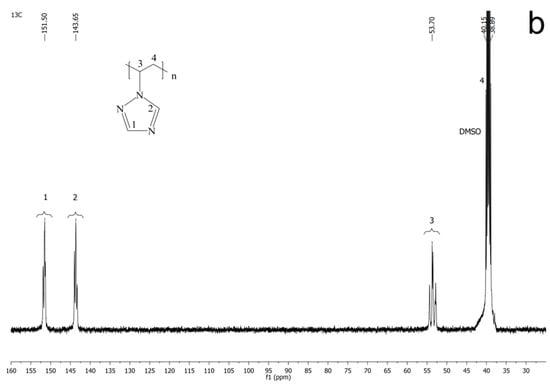
Figure 2.
The 1H (a) and 13C NMR (b) spectra of PVT.
2.2.2. Synthesis of PVT–Te0NPs
To synthesize the PVT–Te0NPs, the PVT (1 g) and distilled water (50 mL) were placed in the 100 mL flask. The reaction mixture was then stirred for 3 h at the temperature of 40 °C until the PVT was completely dissolved. The solution containing PVT was cooled to room temperature. The reaction mixture with tellurium anions (120–400 µL) that were pre-synthesized in accordance with the technique described in the articles [19,20] was added into a Te solution flask under constant stirring with a magnetic stirrer. The formation of the Te0 nanoparticles was identified by a change in the color of the reaction mixture from colorless (native PVT solution) or red–purple (reaction mixture containing Te2− anions) to gray. The synthesis duration was 25 min, after which the reaction mixture was precipitated in acetone cooled to 7 °C. The resulting fine precipitate was separated by centrifugation at 4000 rpm at 9 °C, washed three times with acetone, and dried in a vacuum at room temperature. For the PVT–Te0NP (1.4%), the yield was 62%; calculated % were C 49.53; H 5.50; N 43.27; and Te 1.7. The found % were C 49.64; H 5.52; N 43.44; and Te 1.4. For the PVT–Te0NPs (2.8%), the yield was 71%; the calculated % were C 48.05; H 5.36; N 43.19; and Te 3.4. The found % were C 48.95; H 5.56; N 42.71; Te 2.80. For the PVT–Te0NPs (4.3%), the yield was 58%; the calculated % were C 48.00; H 5.56; N 41.04; and Te 5.4. The found % were C 48.30; H 5.67; N 41.73; and Te 4.3.
2.3. Equipment
2.3.1. Elemental Analysis (EA)
The elemental composition was determined by X-ray energy dispersive microanalysis using a Hitachi TM 3000 scanning electron microscope (Tokyo, Japan) with an SDD XFlash 430-4 X-ray detector and a Thermo Fisher Scientific Flash 2000 CHNS analyzer (Kandel, Germany).
2.3.2. X-ray Diffraction (XRD) Analysis
The XRD study was performed on a Bruker D8 ADVANCE diffractometer (Billerica, MA, USA) equipped with a Hebbel mirror, with Cu radiation in the locked coupled mode, with an exposure of 1 s for phase analysis and 3 s for the estimation of the cell parameter and the coherent scattering region size.
2.3.3. UV-Vis Spectroscopy
The UV-Vis spectra of 0.025% water solutions of PVT and the nanocomposites were recorded relative to distilled water in a 1 cm quartz cell on a Perkin Elmer LAMBDA 35 UV-Vis spectrophotometer (Waltham, MA, USA) in the wavelength range of 200–700 nm.
2.3.4. Dynamic Light Scattering (DLS)
The hydrodynamic radii (Rh) of pure PVT and PVT–Te0NPs were determined by dynamic light scattering on a Photocor Compact-Z correlation spectrometer (Moscow, Russia) equipped by a 20 mV thermostabilized semiconductor laser (λ = 638 нм) at an angle of 90°. The autocorrelation function was analyzed by Dynals v.2 software (Tirat Carmel, Israel). The solutions for analysis were prepared by dissolving a 5 mg sample in 20 mL of distilled water at room temperature for 5 hours, pre-filtered through a 200 µm syringe filter. The time for each measurement was at least 200 s. The measurements were taken in triplicate and the mean was used.
2.3.5. Gel Permeation Chromatography
The molecular weight distribution of the PVT was measured using a gel permeation chromatograph Shimadzu LC-20 Prominence (Kyoto, Japan) with a differential refractive index detector, Shimadzu RID-20A. The chromatographic column was Agilent PolyPore 7.5 × 300 mm, PL1113-6500 (Santa Clara, CA, USA) with an appropriate pre-column. High purity N,N-dimethylformamide was used as a mobile phase (1 ml/min). The calibration was carried out using a series of polystyrene standards, consisting of samples with molecular weights from 162 to 6,570,000 g/mol.
2.3.6. Nuclear Magnetic Resonance
1H and 13C NMR spectra were recorded on a Bruker DPX-400 spectrometer (Billerica, MA, USA) at room temperature; 1H, 400.13 MHz; 13C, 100.62 MHz. The chemical shifts are given relative to the TMS.
2.3.7. High Resolution–Transmission Electron Microscopy (HR-TEM)
The transmission electron microphotographs were obtained with an FEI Tecnai G2 20F S-TWIN transmission electron microscope (Hillsboro, OR, USA) according to the procedure detailed in [29]. The nanoparticle size distribution was determined by the statistical treatment of the microphotographs using Gatan DigitalMicrograph v.3.5 software (Pleasanton, CA, USA) and Microsoft Office Excel (Redmond, WA, USA). The electronograms from the transmission electron microscope were processed and indicated with Process Diffraction v.8.7.1 (Budapest, Hungary) and CrysTBox v.1.1 software (Prague, Czech Republic) and the crystallographic database JCPDS-ICDD PDF-2.
2.3.8. Direct Current Electrical Conductivity Measurement
The DC conductivity was measured by a standard E6-13A teraohmmeter (Moscow, Russia) using a two-probe method within temperature range of 25–80 °C. A thermostat was used to maintain the temperature in the measuring cell. The powder samples were pressed in the form of pellets with a height of 0.2–0.6 mm and a radius of 1.5 mm. The DC conductivity was calculated using the following equation:
where A is the cross-section area (cm2), d is thickness of the pellet (cm), and R is the resistance of the sample (Ω).
3. Results and Discussion
3.1. Synthesis of PVT–Te0NPs
Water-soluble aggregation-stable PVT–Te0NPs (1.4–4.3 wt% Te) were obtained by the oxidation of Te2− anions to zero-valent tellurium (Te0) in an aqueous PVT solution. The Te2− anions were pre-generated by the reduction (activation) in commercial powdered tellurium with hydrazine hydrate in an alkaline medium (Figure 3), according to the method previously proposed in [19,20].
Figure 3.
Scheme of PVT–Te0NPs synthesis.
The process resulted in the powdered tellurium being completely dissolved to form highly reactive Te2− anions in accordance with Equation (2):
2Te + 4NaOH + N2H4 · H2O = 2Na2Te + N2↑ + 5H2O,
The weight content of tellurium in the nanocomposites was varied by changing the PVT:Te2− ratio from 1:59 to 1:17. The conversion of Te2− anions to the zero-valent state varied between 84% and 80%, decreasing with increasing PVT: Te2− ratio. The Te2− anions obtained have a limited time stability and high sensitivity to the conditions of synthesis because of their extremely high reactivity. Presumably, the formed sodium telluride is hydrolyzed in an aqueous medium to form H2Te, which is further either removed from the reaction medium or oxidized by the oxygen present in the aqueous solution to Te0 followed by the condensation of its atoms into nanoparticles and their subsequent stabilization. Probably the reason for the decrease in the Te2− anion conversion to Te0 is the part of H2Te that is hydrolyzed and then volatilized from the reaction medium. The process can be identified by the presence of a radish smell associated with H2Te. Under these conditions, we obtained Te0-containing PVT-based nanocomposites with yields of 58–71%, which are water soluble powders of grey color.
3.2. XRD Analysis
According to X-ray diffraction analysis, the PVT–Te0NP (1.4 wt% Te) is X-ray amorphous, whereas the nanocomposites with a higher weight content have a two-phase amorphous-crystalline structure. Their diffractograms are characterized by an amorphous halo of the PVT phase as well as a number of reflexes corresponding to the crystalline phase of Te0 nanoparticles (Figure 4). We assume that the formation of Te0NPs in the hexagonal modification under the selected soft experimental conditions is probably due to the presence of the stabilizing matrix PVT in the reaction medium. In this case, the PVT molecules are capable of limiting the growth tendency of the material, which leads to the formation of hexagonal Te0 nanoparticles. Moreover, even in the case of the formation of a mixture of amorphous and crystalline tellurium under low-temperature conditions, the amorphous tellurium particles, due to their extremely low stability, are prone to re-dissolution during Ostwald ripening, and the released tellurium atoms can go to the completion of the crystal lattice of more stable hexagonal tellurium particles [30,31,32].
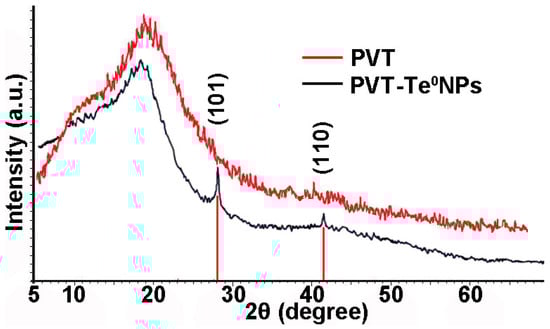
Figure 4.
Typical XRD patterns for pure PVT and PVT–Te0NPs (4.3 wt% Te).
Thus, two broadened reflexes observed at angles of 27.55° and 40.45° in diffractograms for PVT–Te0NPs (4.3% Te) can be ascribed to the (101) and (110) planes of the Te0 hexagonal lattice, respectively. The Te0 nanocrystallite average size in the nanocomposite calculated by the Scherer formula is 40.7 nm.
3.3. HR-TEM Analysis
On the basis of HR-TEM data, it was found that PVT–Te0NPs are formed as high-contrast particles distributed in the PVT polymer matrix with a shape close to spherical. The nanoparticles have a pronounced tendency to partially agglomerate and aggregate into chains and dimers (Figure 5a). The size of the Te0 nanoparticles formed in the PVT–Te0NPs (2.8 wt%) varies in the rather narrow range of 6–11 nm with a predominance (64%) of 8–9 nm particles and Te0 nanoparticle average size of 8.5 nm (Figure 5b). The dark-field images reveal that the nanoparticles are clearly visualized as they contrast significantly with the surrounding matrix, confirming their crystalline structure (Figure 5c).
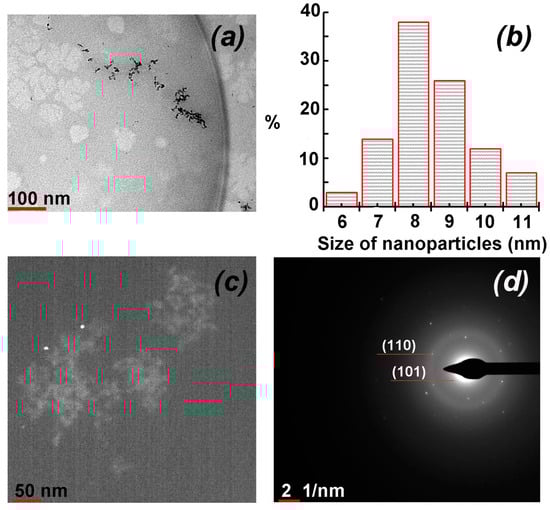
Figure 5.
TEM image of PVT–Te0 nanocomposite (2.8 wt%) (a) in light field mode; (b) nanoparticle size distribution histogram of PVT–Te0 nanocomposite (2.8 wt%); (c) TEM image of PVT–Te0 nanocomposite (2.8 wt%) in dark field mode; (d) electronographic image of Te nanoparticles in PVT–Te0 nanocomposite (2.8 wt%).
The internal microstructure of the nanoparticles was also investigated by HR-TEM. The selected area electron diffraction (SAED) pattern of PVT–Te0NPs exhibits clear and discrete over-emission points, indicating a pronounced crystallinity of the nanoparticles (Figure 5d). The symmetrical rings with randomly distributed contrasting dots with no preferred orientation are observed in the nanocomposite (2.8 wt%) SAED pattern, indicating its polycrystalline nature. The two rings clearly visible in the SAED pattern were used as an initial data for the calculation of the interplanar distances of the nanoparticles. The distances were was found to be 3.2 Å and 2.2 Å for the first and second ring, respectively. These values are very close to the interplanar distance values of the elemental tellurium hexagonal lattice and correspond to its (101) and (110) crystallographic planes.
3.4. Dynamic Light Scattering Analysis
The study of aqueous solutions of PVT–Te0NPs by the DLS method shows that the particle size distribution in terms of the scattering intensity is featured by bimodality. The colloids are characterized by two particle fractions (Figure 6).
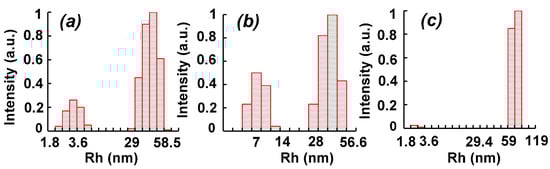
Figure 6.
Distribution of the hydrodynamic radii (Rh) over the scattering intensity in PVT–Te0NP nanocomposites with a Te content of (a) 1.4 wt%, (b) 2.8%, and (c) 4.3%.
Thus, the particle fractions with a hydrodynamic radius (Rh) of 3.6 nm and 45 nm were detected in an aqueous solution of PVT–Te0NPs containing 1.4 wt% of Te (Figure 6a). Presumably, the first fast particle fraction is related to the presence of the individual PVT macromolecules in the nanocomposite water solution (Rh equals to 4.1 nm for PVT, whereas one is 3.1 nm for PVT–Te0NPs). The second particle fraction with an average Rh of 45 nm probably originates from Te0 nanoparticles formed in the PVT matrix or their agglomerates, which we detected by SEM. The increase in the Te weight content in the nanocomposite up to 4.3% is accompanied by a decrease in the fraction of the fast particle in its aqueous solution as well as an increase in the slow particle fraction. At the same time, there is an increase in the average Rh value of the slow particle fraction up to 75 nm, probably due to a growth of the average size of Te0 nanoparticles themselves (Figure 6c). In addition, a significant narrowing of the particle dispersion of both slow and fast fractions of the PVT–Te0NP solution with the highest Te content, as compared to the samples containing 1.4 and 2.8 wt% Te, should be noted. Thus, the minimum particle Rh range is observed to be 2.3–3.0 nm and 59–75 nm for the fast and slow particle fraction of PVT–Te0NPs (4.3 wt%), respectively.
3.5. UV-Vis Spectroscopy
The study of optical absorption spectra in the range 200–700 nm of 0.025% aqueous solutions of PVT and PVT–Te0NPs showed that the presence of an absorption band in the region of 276 nm (4.5 eV) is typical for all the samples (Figure 7). The 5 eV absorption band in the PVT spectrum isolated by deconvolution seems to be due to the availability of the C=N chromophore group in the polymer chains, which is characterized by a band at 4.7–5.4 eV in the absorption spectrum [33]. The deconvolution also reveals the presence of three bands in the region of 3.1, 4.5, and 5.6 eV in the absorption spectra of the nanocomposites under study. In contrast to the 4.5 eV absorption band, associated with the availability of PVT in nanocomposites and invariably present in the spectra of nanocomposites with different content of inorganic nanophase, the other two absorption bands undergo a blue shift with an increasing Te weight content. Thus, with a change in the inorganic nanophase content from 1.4 to 4.3% Te, a shift of the absorption bands from 5.8 to 4.5 and from 4.5 to 2.9 eV is observed (Figure 7).
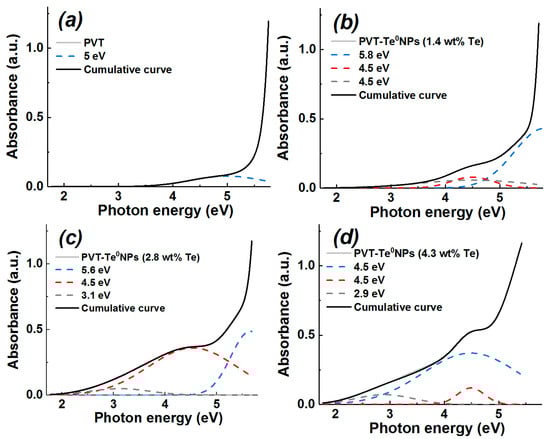
Figure 7.
UV-Vis spectra and cumulative curves (solid lines) of 0.025% water solution of (a) pure PVT, and PVT–Te0NPs with a Te weight content of (b) 1.4%, (c) 2.8%, and (d) 4.3%. Photon energies corresponding to the peaks of the Gaussians are shown in the legends (dashed lines).
According to available data [34,35], the Te0 nanoparticles are characterized by the presence of an absorption band in the 270–300 nm region (4.6–4.1 eV). At the same time, the absorption spectrum of Te nanowires is featured by the availability of two bands in the region of 278 nm (4.5 eV) and 586 nm (2.1 eV) [36]. Hence, it can be concluded that the absorption bands in the region of 5.8–4.5 eV and 4.5–2.9 eV are directly related to the presence of Te0 nanoparticles in PVT–Te0NPs.
Based on the nanocomposite optical absorption spectra obtained, we determined their optical band gap, the average radius of nanoparticles, and the size particle distribution of the nanocomposite Te0 nanoparticles. The optical band gap was obtained in two ways: using the wavelength corresponding to 10% absorption in the measured optical absorption spectrum of the solutions studied [37] and by the Tauc method [38,39]. According to the Tauc method, the optical band gap of PVT–Te0NPs was determined by extrapolating (to the intersection with the abscissa axis) the linear sections of absorption spectra represented in Tauc coordinates (Figure 8a) using Equation (3):
where α is the absorption coefficient defined by Beer–Lambert’s law, hυ is the incident photon energy, A is a constant characterizing the degree of ordering of the material structure (for calculations we assumed that A = 1), Eg is the optical band gap, γ is an index describing transition process, and γ = 1/2 for direct allowed transitions. The resulting values are shown in Table 1. As can be seen from the table, the optical band gap decreases from 3.17 to 2.16 eV (Figure 8a) or from 2.79 to 2.05 eV with increasing inorganic nanophase content in the nanocomposites studied, depending on the method of Eg determination.
αhν = A (hν − Eg)γ,
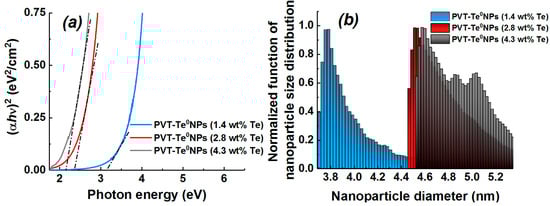
Figure 8.
(a) Tauc plots for PVT–Te0NPs nanocomposites with different Te weight content, (b) dependence of the normalized nanoparticle size distribution function on nanoparticle diameter for PVT–Te0NPs with different Te weight content.

Table 1.
Calculated values of the optical band gap, the mean nanoparticle diameter, and the “blue shift” for PVT–Te0 nanocomposites. Note: : optical band gap calculated by Tauc method (eV); : mean nanoparticle diameter determined by the Brus equation using the value (nm); : “blue” shift of value from optical band gap of bulk Te (eV); : the optical band gap calculated by the Tauc method (eV); : mean nanoparticle diameter determined by the Brus equation using the value (nm); : “blue” shift of value from the optical band gap of bulk Te (eV).
As these values are larger than the band gap of bulk Te [40] (Figure 8a), one can assume an appearance of the quantum confinement effect resulting in an Eg increase at the transition of material from a bulk to nanoscale state (“blue shift” of Eg). The effect has been well described in the literature [41]. The possibility of setting the band gap by controlling the size of semiconductor nanoparticles has previously been reported in studies of Se colloidal solutions [42], cobalt selenide nanostructure films [43], and ZnS nanoparticles stabilized with a PVA [44]. Taking into account the approximate spherical shape of the nanoparticles, it is possible to estimate the average size of the Te0 nanoparticles formed according to the Equation (4) proposed by L. Brus:
where is the nanoscale Te energy band gap, is the energy band gap of bulk Te, denotes the dielectric permittivity of the bulk Te, is the effective mass of the hole in Te, is the effective mass of electron in Te [40], represents the electron mass, is the reduced Planck constant, r denotes the radius of the nanoparticle, is the electric constant, and e represents the electron charge. The values of the nanoparticle average size (diameter) calculated without considering the third term in Equation (2) are shown in Table 1. The calculation results show that the average Te0 nanoparticle size in the nanocomposite increases with a growing inorganic nanophase content. In this case, the value of the optical band gap, and therefore the “blue shift” is reduced. A similar trend was observed by Singh et al. in their study of the optical properties of Se quantum dots [42].
In order to determine the characteristic diameters of Te nanoparticles in the nanocomposites, the corresponding particle size distribution function curves were plotted according to the method proposed by Pesika [45]. This method makes it possible to determine the particle size distribution using the relation between the nanoparticle radius and the shift of the band gap formulated by Brus (Equation (4)):
where N(r) is the particle size distribution, D denotes the optical density obtained from the optical absorption spectra, r is the nanoparticle radius, V is the volume of a spherical nanoparticle, λ is a wavelength, denotes the optical band gap of the nanoscale semiconductor, h is a Plank constant, and c is a light constant.
Figure 8b shows the calculated curves of the particle size distribution function of PVT–Te0NPs as histograms. It was found that the PVT–Te0NPs with inorganic nanophase content of 1.4 and 2.8% are characterized by log-normal size distributions with maximum values corresponding to 3.8 and 4.5 nm, respectively. The particle size distribution for the PVT–Te0NP (4.3 wt%) has a more complex multimodal structure. The highest value of the distribution function is observed at 4.6 nm, while the peaks of the other two modes correspond to 4.9 and 5.0 nm. The resulting Te0 nanoparticle diameters are of the same order of magnitude as their dimensional characteristics determined using HR-TEM and the Brus equation (Equation (4)).
3.6. DC Electrical Conductivity
The dependences of the specific DC electrical conductivity of PVT and PVT–Te0NPs on temperature (in the temperature range of 25–80 °C) and the weight content of the inorganic nanophase were experimentally obtained to determine the presence of a particle dimensional effect on the electrical conductivity of the nanocomposites under study (Figure 9).
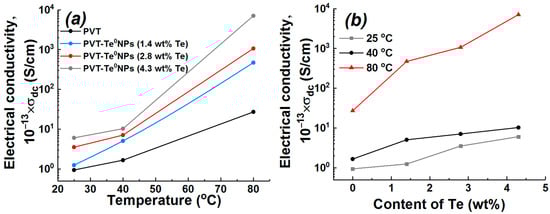
Figure 9.
The dependence of electrical conductivity (a) on temperature and (b) on Te weight content for PVT and PVT–Te0NPs.
The electrical conductivity values and the nature of its change with increasing temperature allow the initial PVT polymer to be classified as a dielectric (Figure 9a). The introduction of Te nanoparticles into the PVT matrix was found to result in an increase in the DC electrical conductivity of the nanocomposite. The electrical conductivity of the composite increases as the weight content of the inorganic nanophase rises (Figure 9b). At the same time, the electrical conductivity of the nanocomposites grows with increasing temperature (Figure 9a). It should be noted that the electrical conductivity of PVT–Te0NPs with a Te content of 2.8 and 4.3% becomes greater than 10−10 S/cm at 80 °C, i.e., it overcomes the conventional dielectric-semiconductor boundary noted in the classification of materials by electrical conductivity value [46]. The behavior of the samples DC conductivity is common to dielectrics and semiconductors. The exponential growth of conductivity with an increasing temperature is characteristic of both semiconductor nanoparticles [47,48] and nanocomposites of dielectric polymers and semiconductor nanoparticles [49,50]. The variation of DC conductivity of PVA–Se nanocomposite with temperature showed the presence of nearly linear part and the part well described by the Vogel–Fulcher–Tammann relationship [49]. Sinha et al. attributed the conductivity behavior to the thermally activated hopping transport ions decoupled from the matrix and 3D variable range hopping of charge carriers. According to the literature data, the authors of paper [50] observed conductivity behavior most similar to the one we obtained. The introduction of TiO2 nanoparticles into PVA–PEG–PVP matrix resulted in a grow of DC electrical conductivity. Meanwhile, the increase in weight content of inorganic nanophase from 2% to 8% also led to a rise in the nanocomposite DC conductivity. The authors have explained the behavior of PVA–PEG–PVP/TiO2 nanocomposite conductivity by a reduction in their band gap and therefore thermally activated enhancement of charge carriers hopping motion between trapped sites.
The PVT–Te0NPs nanocomposite is semiconductor nanoparticles non-uniformly distributed in the volume of the dielectric matrix. It can be represented as an organic–inorganic system of components, each exhibiting different physical properties (in particular, electrical conductivity) due to its microscopic characteristics. The macroscopic physical properties of a nanocomposite are due to its microstructural features [51]. Not only the matrix and nanofillers, but also the interphase, which is a system of formed interfaces at the nanoparticle-matrix interfaces, are considered to be components of a nanocomposite. Therefore, an increase in temperature does not uniformly affect the electrical conductivity of the nanocomposite components due to the different nature of the nanocomposite components. In a dielectric, for example, as the temperature rises, some of the electrons gain energy and participate in electrical conductivity. This happens more efficiently in a semiconductor. The transport of charge carriers in the interphase is enabled by an electron tunneling effect. This effect is particularly influential when the distance between the nanoparticles is significantly reduced. However, at high temperatures, the interface conductivity decreases due to an increase in the number of electron collisions. In addition, as the temperature rises, the thickness of the interface layer may decrease, resulting in a reduction in electrical conductivity.
In the case of PVT–Te0NPs, the increase in their electrical conductivity, in comparison with the matrix, can be explained by the appearance of the charge-carrier transport across the crystalline semiconductor and interface conduction due to the electron tunneling effect. As the weight content of the inorganic nanophase increases, the nanoparticles become larger, i.e., the regions of successful charge carrier transport through the semiconductor increase with a simultaneous decrease in the interphase effect. This leads to an increase in the degree of ordering in the composite system, which translates into the increased electrical conductivity. In addition, the observed increase in DC electrical conductivity may be related to the possible formation and increase in the number of local conductive channels created when the average interparticle distance decreases [52].
4. Conclusions
Thus, we have first obtained the nanocomposites of an original poly(1-vinyl-1,2,4-triazole) polymer matrix and Te0 thermoelectric nanoparticles with varying amounts of inorganic phase in the range of 1.4–4.3%. The synthesized nanocomposites have been characterized using a set of complementary modern methods (HR-TEM, XRD, DLS, UV-Vis spectroscopy). Nanocomposites have been found to form as nanoparticles dispersed in a polymeric matrix and sized between 4 and 18 nm. Using the optical spectroscopy data as well as computational values calculated by the Brus formula and the Pesika method, the mean diameters and characteristic nanoparticle diameters of the nanoparticle fractions present in the composite, in the range of 4.2–5.1 and 3.8–5.0 nm, were determined for the nanocomposites containing 1.4%, 2.8%, and 4.3%. Based on the temperature dependence of the DC electrical conductivity in the range 25–80 °C, it was found that the introduction of the inorganic nanophase in the PVT dielectric polymer as well as an increase in the average size of Te0 nanoparticles leads to an increase in electrical conductivity over the entire temperature range. Herewith, the DC electrical conductivity values of PVT–Te0NPs with a Te weight content of 2.8% and 4.3% become higher than 10−10 S/cm at 80 °C, i.e., they exceed the conventional boundary of dielectric–semiconductor in the classification of materials by electrical conductivity value. The results obtained suggest that varying the Te weight content in the synthesis process of PVT-based nanocomposites enables one to obtain nanocomposites with a required value of electrical conductivity. Taking into account the rather high Seebeck coefficient of Te0 nanoparticles and probably the low thermal conductivity provided by dielectric polymer PVT matrix, this could result in the directional design of thermoelectric nanocomposites with a high thermoelectric figure of merit.
Author Contributions
Conceptualization, A.V.Z. and M.V.Z.; methodology, A.V.Z., M.V.Z. and G.F.P.; software, A.V.Z. and M.V.Z.; validation, A.V.Z., M.V.Z. and G.F.P.; formal analysis, A.V.Z., M.V.Z., G.F.P. and A.S.P.; investigation, A.V.Z., M.V.Z., G.F.P. and S.A.K.; resources, A.V.Z., M.V.Z. and S.A.K.; data curation, M.V.Z.; writing—original draft preparation, M.V.Z., A.V.Z. and G.F.P.; writing—review and editing, M.V.Z., A.V.Z., A.S.P. and G.F.P.; visualization, M.V.Z. and A.V.Z.; supervision, M.V.Z.; project administration, M.V.Z., A.V.Z. and A.S.P. All authors have read and agreed to the published version of the manuscript.
Funding
This research was funded by the Ministry of Science and Higher Education of the Russian Federation.
Institutional Review Board Statement
Not applicable.
Informed Consent Statement
Not applicable.
Data Availability Statement
The data presented in this study are available from the corresponding author upon request.
Acknowledgments
The authors wish to thank the Isotopegeochemical research center for Collective Use (A.P. Vinogradov Institute of Geochemistry of the Siberian Branch of the Russian Academy of Sciences) and the Baikal Analytical Centre (Irkutsk Institute of Chemistry of the Siberian Branch of the Russian Academy of Sciences) for providing the equipment. The high-resolution transmission electron microscopy was performed using equipment from the Baikal Nanotechnology Center, Irkutsk National Research Technical University.
Conflicts of Interest
The authors declare no conflict of interest.
References
- Kwan, T.H.; Wu, X.; Yao, Q. Complete implementation of the combined TEG-TEC temperature control and energy harvesting system. Control Eng. Pract. 2020, 95, 104224. [Google Scholar] [CrossRef]
- Pan, S.; Wang, T.; Jin, K.; Cai, X. Understanding and designing metal matrix nanocomposites with high electrical conductivity: A review. J. Mater. Sci. 2022, 57, 6487–6523. [Google Scholar] [CrossRef]
- Li, J.; Huckleby, A.B.; Zhang, M. Polymer-based thermoelectric materials: A review of power factor improving strategies. J. Mater. 2022, 8, 204–220. [Google Scholar] [CrossRef]
- Zhou, C.; Dun, C.; Ge, B.; Wang, K.; Shi, Z.; Liu, G.; Carroll, D.L.; Qiao, G. Highly robust and flexible n-type thermoelectric film based on Ag2Te nanoshuttle/polyvinylidene fluoride hybrids. Nanoscale 2018, 10, 14830–14834. [Google Scholar] [CrossRef] [PubMed]
- Zhao, X.; Han, W.; Jiang, Y.; Zhao, C.; Ji, X.; Kong, F.; Xu, W.; Zhang, X. A honeycomb-like paper-based thermoelectric generator based on a Bi2Te3/bacterial cellulose nanofiber coating. Nanoscale 2019, 11, 17725–17735. [Google Scholar] [CrossRef] [PubMed]
- Kim, S.; Ryu, S.H.; Kwon, Y.-T.; Lim, H.-R.; Park, K.-R.; Song, Y.; Choa, Y.-H. Synthesis and thermoelectric characterization of high density Ag2Te nanowire / PMMA nanocomposites. Mater. Chem. Phys. 2017, 190, 187–193. [Google Scholar] [CrossRef]
- Andzane, J.; Buks, K.; Bitenieks, J.; Bugovecka, L.; Kons, A.; Merijs-Meri, R.; Svirksts, J.; Zicans, J.; Erts, D. p-Type PVA/MWCNT-Sb2Te3 Composites for Application in Different Types of Flexible Thermoelectric Generators in Combination with n-Type PVA/MWCNT-Bi2Se3 Composites. Polymers 2022, 14, 5130. [Google Scholar] [CrossRef]
- Morad, M.; Fadlallah, M.M.; Hassan, M.A.; Sheha, E. Evaluation of the effect of V2O5 on the electrical and thermoelectric properties of poly (vinyl alcohol)/graphene nanoplatelets nanocomposite. Mater. Res. Express 2016, 3, 035015. [Google Scholar] [CrossRef]
- Wang, J.; Du, Y.; Qin, J.; Wang, L.; Meng, Q.; Li, Z.; Shen, S.Z. Flexible Thermoelectric Reduced Graphene Oxide/Ag2S/Methyl Cellulose Composite Film Prepared by Screen Printing Process. Polymers 2022, 14, 5437. [Google Scholar] [CrossRef]
- Dun, C.; Hewitt, C.A.; Huang, H.; Montgomery, D.S.; Xu, J.; Carroll, D.L. Flexible thermoelectric fabrics based on self-assembled tellurium nanorods with a large power factor. Phys. Chem. Chem. Phys. 2015, 17, 8591–8595. [Google Scholar] [CrossRef]
- Pammi, S.V.N.; Jella, V.; Choi, J.S.; Yoon, S.G. Enhanced thermoelectric properties of flexible Cu2−xSe (x ≥ 0.25) NW/polyvinylidene fluoride composite films fabricated via simple mechanical pressing. J. Mater. Chem. C 2017, 5, 763–769. [Google Scholar] [CrossRef]
- Oopathump, C.; Boonthuma, D.; Smith, S.M. Effect of Poly (Vinyl Alcohol) on thermoelectric properties of sodium cobalt oxide. In Key Engineering Materials. Key Eng. Mater. 2019, 798, 304–309. [Google Scholar] [CrossRef]
- Jiang, C.; Wei, P.; Ding, Y.; Cai, K.; Tong, L.; Gao, Q.; Lu, Y.; Zhao, W.; Chen, S. Ultrahigh performance polyvinylpyrrolidone/Ag2Se composite thermoelectric film for flexible energy harvesting. Nano Energy 2021, 80, 105488. [Google Scholar] [CrossRef]
- Kim, S.; Lee, Y.-I.; Ryu, S.H.; Hwang, T.-Y.; Song, Y.; Seo, S.; Yoo, B.; Lim, J.-H.; Cho, H.-B.; Myung, N.V.; et al. Synthesis and thermoelectric characterization of bulk-type tellurium nanowire/polymer nanocomposites. J. Mater. Sci. 2017, 52, 12724–12733. [Google Scholar] [CrossRef]
- Li, X.; Du, Y.; Meng, Q. Flexible ball-milled Bi0.4Sb1.6Te3/methyl cellulose thermoelectric films fabricated by screen-printing method. Funct. Mater. Lett. 2021, 14, 2151034. [Google Scholar] [CrossRef]
- Dun, C.; Hewitt, C.A.; Huang, H.; Hu, J.; Montgomery, D.S.; Nie, W.; Jiang, Q.; Carroll, D.L. Layered Bi2Se3 nanoplate/polyvinylidene fluoride composite based n-type thermoelectric fabrics. ACS Appl. Mater. Inter. 2015, 7, 7054–7059. [Google Scholar] [CrossRef]
- Bitenieks, J.; Buks, K.; Merijs-Meri, R.; Andzane, J.; Ivanova, T.; Bugovecka, L.; Voikiva, V.; Zicans, J.; Erts, D. Flexible N-Type Thermoelectric Composites Based on Non-Conductive Polymer with Innovative Bi2Se3-CNT Hybrid Nanostructured Filler. Polymers 2021, 13, 4264. [Google Scholar] [CrossRef]
- Qin, J.; Du, Y.; Meng, Q.; Ke, Q. Flexible thermoelectric Cu–Se nanowire/methyl cellulose composite films prepared via screen printing technology. Compos. Commun. 2023, 38, 101467. [Google Scholar] [CrossRef]
- Lesnichaya, M.V.; Zhmurova, A.V.; Sapozhnikov, A.N. Synthesis and Characterization of Water-Soluble Arabinogalactan-Stabilized Bismuth Telluride Nanoparticles. Russ. J. Gen. Chem. 2021, 91, 1379–1386. [Google Scholar] [CrossRef]
- Zvereva, M.V.; Zhmurova, A.V. Synthesis, structure, and spectral properties of ZnTe-containing nanocomposites based on arabinogalactan. Russ. J. Gen. Chem. 2022, 92, 1995–2004. [Google Scholar] [CrossRef]
- Pozdnyakov, A.; Emel’yanov, A.; Kuznetsova, N.; Ermakova, T.; Bolgova, Y.; Trofimova, O.; Albanov, A.; Borodina, T.; Smirnov, V.; Prozorova, G. A Polymer Nanocomposite with CuNP Stabilized by 1-Vinyl-1,2,4-Triazole and Acrylonitrile Copolymer. Synlett 2015, 27, 900–904. [Google Scholar] [CrossRef]
- Zezin, A.; Danelyan, G.; Emel’yanov, A.; Zharikov, A.; Prozorova, G.; Zezina, E.; Korzhova, S.; Fadeeva, T.; Abramchuk, S.; Shmakova, N.; et al. Synthesis of Antibacterial Polymer Metal Hybrids in Irradiated Poly-1-vinyl-1,2,4-triazole Complexes with Silver Ions: PH Tuning of Nanoparticle Sizes. Appl. Organomet. Chem. 2022, 36, e6581. [Google Scholar] [CrossRef]
- Pozdnyakov, A.; Emel’yanov, A.; Ivanova, A.; Kuznetsova, N.; Semenova, T.; Bolgova, Y.; Korzhova, S.; Trofimova, O.; Fadeeva, T.; Prozorova, G. Strong Antimicrobial Activity of Highly Stable Nanocomposite Containing AgNPs Based on Water-Soluble Triazole-Sulfonate Copolymer. Pharmaceutics 2022, 14, 206. [Google Scholar] [CrossRef] [PubMed]
- Prozorova, G.F.; Pozdnyakov, A.S. Synthesis, Properties, and Biological Activity of Poly(1-vinyl-1,2,4-triazole) and Silver Nanocomposites Based on It. Polym. Sci. Ser. C 2022, 64, 62–72. [Google Scholar] [CrossRef]
- Li, C.; Jiang, F.; Liu, C.; Wang, W.; Li, X.; Wang, T.; Xu, J. A simple thermoelectric device based on inorganic/organic composite thin film for energy harvesting. Chem. Eng. J. 2017, 320, 201–210. [Google Scholar] [CrossRef]
- Lin, S.; Li, W.; Chen, Z.; Shen, J.; Ge, B.; Pei, Y. Tellurium as a high-performance elemental thermoelectric. Nat. Commun. 2016, 7, 10287. [Google Scholar] [CrossRef]
- Blackburn, J.L.; Ferguson, A.J.; Cho, C.; Grunlan, J.C. Thermoelectric materials: Carbon-nanotube-based thermoelectric materials and devices. Adv. Mater. 2018, 30, 1870072. [Google Scholar] [CrossRef]
- Fan, Z.; Zhang, Y.; Pan, L.; Ouyang, J.; Zhang, Q. Recent developments in flexible thermoelectrics: From materials to devices. Renew. Sustain. Energy Rev. 2021, 137, 110448. [Google Scholar] [CrossRef]
- Lesnichaya, M.V.; Tsivileva, O.M. Arabinogalactan-Stabilized Selenium Sulfide Nanoparticles and Their Fungistatic Activity Against Phytophthora cactorum. J. Clust. Sci. 2022, 1–12. [Google Scholar] [CrossRef]
- Hu, H.; Zeng, Y.; Gao, S.; Wang, R.; Zhao, J.; You, K.; Song, Y.; Xiao, Q.; Cao, R.; Li, J.; et al. Fast solution method to prepare hexagonal tellurium nanosheets for optoelectronic and ultrafast photonic applications. J. Mater. Chem. C 2021, 9, 508–516. [Google Scholar] [CrossRef]
- Liu, C.; Wang, R.; Zhang, Y. Tellurium Nanotubes and Chemical Analogues from Preparation to Applications: A Minor Review. Nanomaterials 2022, 12, 2151. [Google Scholar] [CrossRef]
- Lu, Q.; Gao, F.; Komarneni, S. Biomolecule-Assisted Reduction in the Synthesis of Single-Crystalline Tellurium Nanowires. Adv. Mater. 2004, 16, 1629–1632. [Google Scholar] [CrossRef]
- Ioffe, B.V.; Kostikov, R.R.; Razin, V.V. Physical Methods for Determining the Structure of Organic Molecules; Leningrad University Press: Leningrad, USSR, 1976. [Google Scholar]
- Rosales-Conrado, N.; Gómez-Gómez, B.; Matías-Soler, J.; Pérez-Corona, M.T.; Madrid-Albarrán, Y. Comparative study of tea varieties for green synthesis of tellurium-based nanoparticles. Microchem. J. 2021, 169, 106511. [Google Scholar] [CrossRef]
- Zambonino, M.C.; Quizhpe, E.M.; Jaramillo, F.E.; Rahman, A.; Vispo, N.S.; Jeffryes, C.; Dahoumane, S.A. Green synthesis of selenium and tellurium nanoparticles: Current trends, biological properties and biomedical applications. Int. J. Mol. Sci. 2021, 22, 989. [Google Scholar] [CrossRef] [PubMed]
- Qian, H.-S.; Yu, S.-H.; Gong, J.-Y.; Luo, L.-B.; Fei, L.-F. High-quality luminescent tellurium nanowires of several nanometers in diameter and high aspect ratio synthesized by a poly (vinyl pyrrolidone)-assisted hydrothermal process. Langmuir 2006, 22, 3830–3835. [Google Scholar] [CrossRef]
- Wallace, A.M.; Curiac, C.; Delcamp, J.H.; Fortenberry, R.C. Accurate determination of the onset wavelength (λonset) in optical spectroscopy. J. Quant. Spectrosc. Radiat. Transf. 2021, 265, 107544. [Google Scholar] [CrossRef]
- Tauc, J.; Grigorovici, R.; Vancu, A. Optical properties and electronic structure of amorphous germanium. Phys. Stat. Sol. 1966, 15, 627–637. [Google Scholar] [CrossRef]
- Davis, E.A.; Mott, N.F. Conduction in non-crystalline systems V. Conductivity, optical absorption and photoconductivity in amorphous semiconductors. Philos. Mag. 1970, 22, 0903–0922. [Google Scholar] [CrossRef]
- Madelung, O. (Ed.) Elements. In Semiconductors: Other than Group IV Elements and III–V Compounds; Springer: Berlin, Germany, 1992; pp. 4–7. [Google Scholar] [CrossRef]
- De Mello Donega, C. Nanoparticles: Workhorses of Nanoscience; Springer: Berlin, Germany, 2014. [Google Scholar]
- Singh, S.C.; Mishra, S.K.; Srivastava, R.K.; Gopal, R. Optical properties of Selenium quantum dots produced with laser irradiation of water suspended Sc nanoparticles. J. Phys. Chem. C. 2010, 114, 17374–17384. [Google Scholar] [CrossRef]
- Ghobadi, N.; Khazaie, F. Fundamental role of the pH on the nanoparticle size and optical band gap in cobalt selenide nanostructure films. Opt. Quant. Electron. 2016, 48, 165. [Google Scholar] [CrossRef]
- Borah, J.P.; Barman, J.; Sarma, K.C. Structural and optical properties of ZnS nanoparticles. Chalcogenide Lett. 2008, 5, 201–208. [Google Scholar]
- Pesika, N.S.; Stebe, K.J.; Searson, P.C. Relationship between absorbance spectra and particle size distributions for quantum-sized nanocrystals. J. Phys. Chem. B. 2003, 107, 10412–10415. [Google Scholar] [CrossRef]
- Prokhorov, A.M. (Ed.) Physical Encyclopedic Dictionary; Soviet Encyclopedia: Moscow, USSR, 1983. [Google Scholar]
- Ansari, M.M.N.; Khan, S. Structural, electrical and optical properties of sol-gel synthesized cobalt substituted MnFe2O4 nanoparticles. Physica B. 2017, 520, 21–27. [Google Scholar] [CrossRef]
- Mehraj, S.; Ansari, M.S.; Al-Ghamdi, A.A. Annealing dependent oxygen vacancies in SnO2 nanoparticles: Structural, electrical and their ferromagnetic behavior. Mater. Chem. Phys. 2016, 171, 109–118. [Google Scholar] [CrossRef]
- Sinha, S.; Chatterjee, S.K.; Ghosh, J.; Meikap, A.K. Electrical transport properties of polyvinyl alcohol–selenium nanocomposite films at and above room temperature. J. Mater. Sci. 2015, 50, 1632–1645. [Google Scholar] [CrossRef]
- Agool, I.R.; Kadhim, K.J.; Hashim, A. Preparation of (polyvinyl alcohol–polyethylene glycol–polyvinyl pyrrolidinone–titanium oxide nanoparticles) nanocomposites: Electrical properties for energy storage and release. Int. J. Plast. Technol. 2016, 20, 121–127. [Google Scholar] [CrossRef]
- Xia, X.; Weng, G.J.; Zhang, J.; Li, Y. The effect of temperature and graphene concentration on the electrical conductivity and dielectric permittivity of graphene–polymer nanocomposites. Acta Mech. 2020, 231, 1305–1320. [Google Scholar] [CrossRef]
- Du, B.X.; Han, C.; Li, J.; Li, Z. Temperature-dependent DC conductivity and space charge distribution of XLPE/GO nanocomposites for HVDC cable insulation. IEEE Trans. Dielectr. Electr. Insul. 2020, 27, 418–426. [Google Scholar] [CrossRef]


Disclaimer/Publisher’s Note: The statements, opinions and data contained in all publications are solely those of the individual author(s) and contributor(s) and not of MDPI and/or the editor(s). MDPI and/or the editor(s) disclaim responsibility for any injury to people or property resulting from any ideas, methods, instructions or products referred to in the content. |
© 2023 by the authors. Licensee MDPI, Basel, Switzerland. This article is an open access article distributed under the terms and conditions of the Creative Commons Attribution (CC BY) license (https://creativecommons.org/licenses/by/4.0/).