
Development and Preliminary Application of Temperature Stress Test Machine for Cast-in-Place Inner Shaft Lining


Abstract
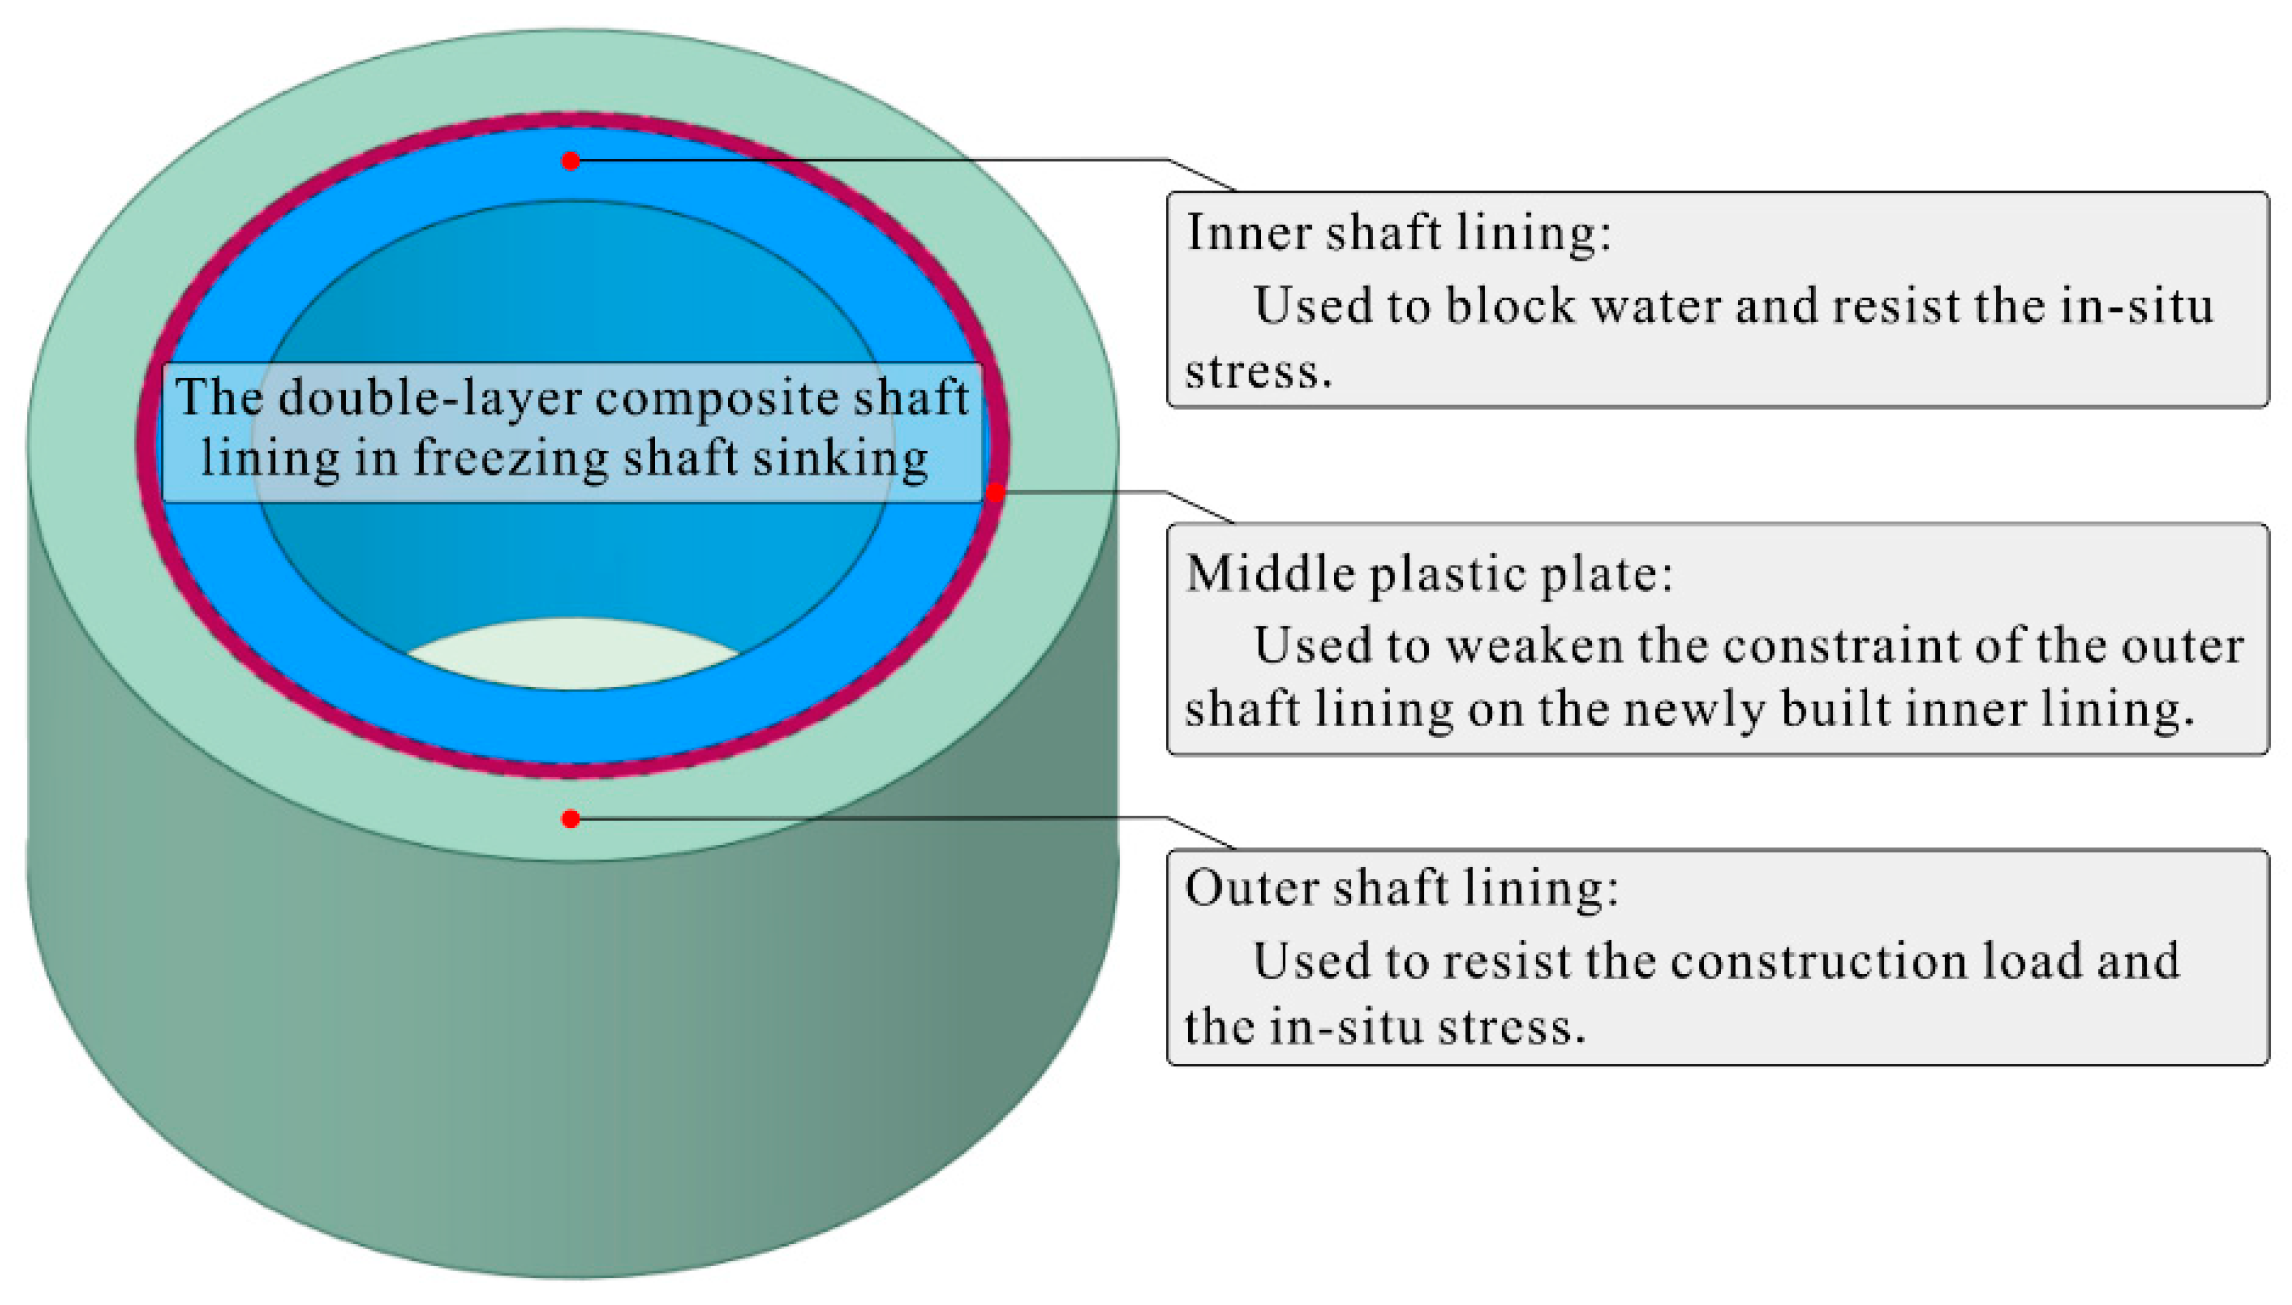
1. Introduction
2. Test Methodology
2.1. Development of the Testing Machine
2.2. Temperature Field Measurement Method of the Simulated Inner Wall
2.3. Testing Procedure
2.4. Sensor Layout
3. Results
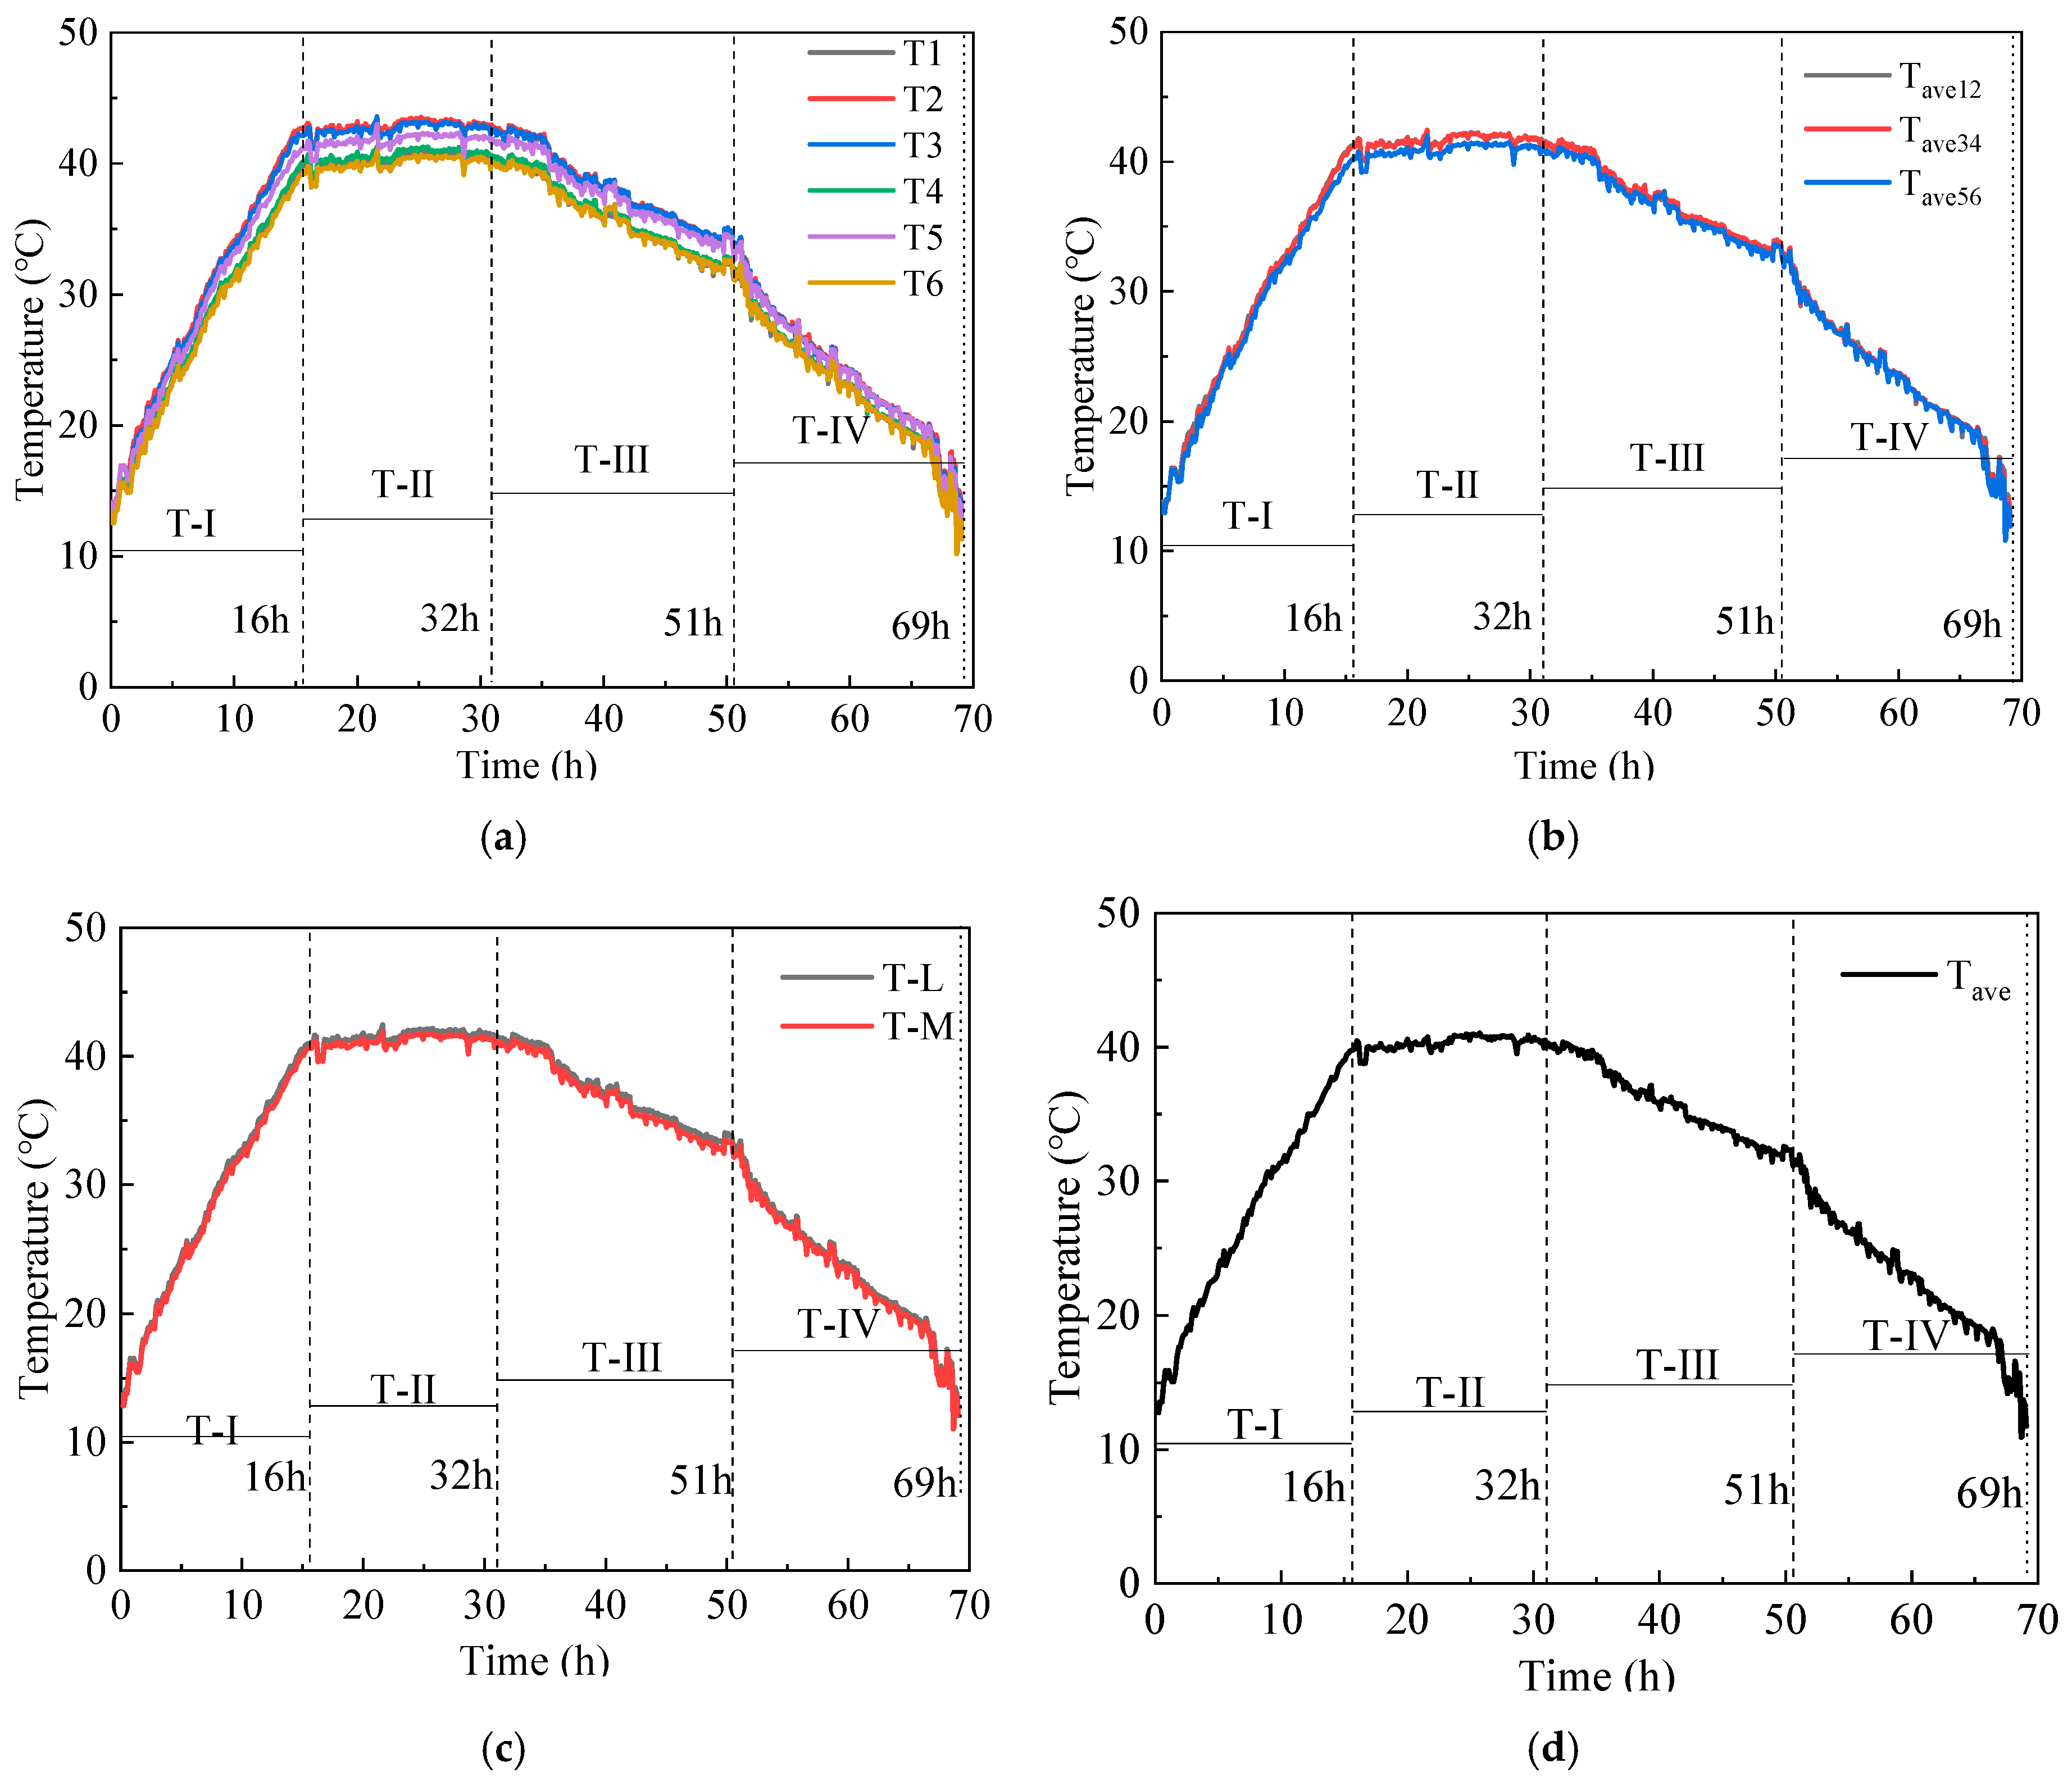
3.1. Temperature Field of the Inner Shaft Lining Scaled Model
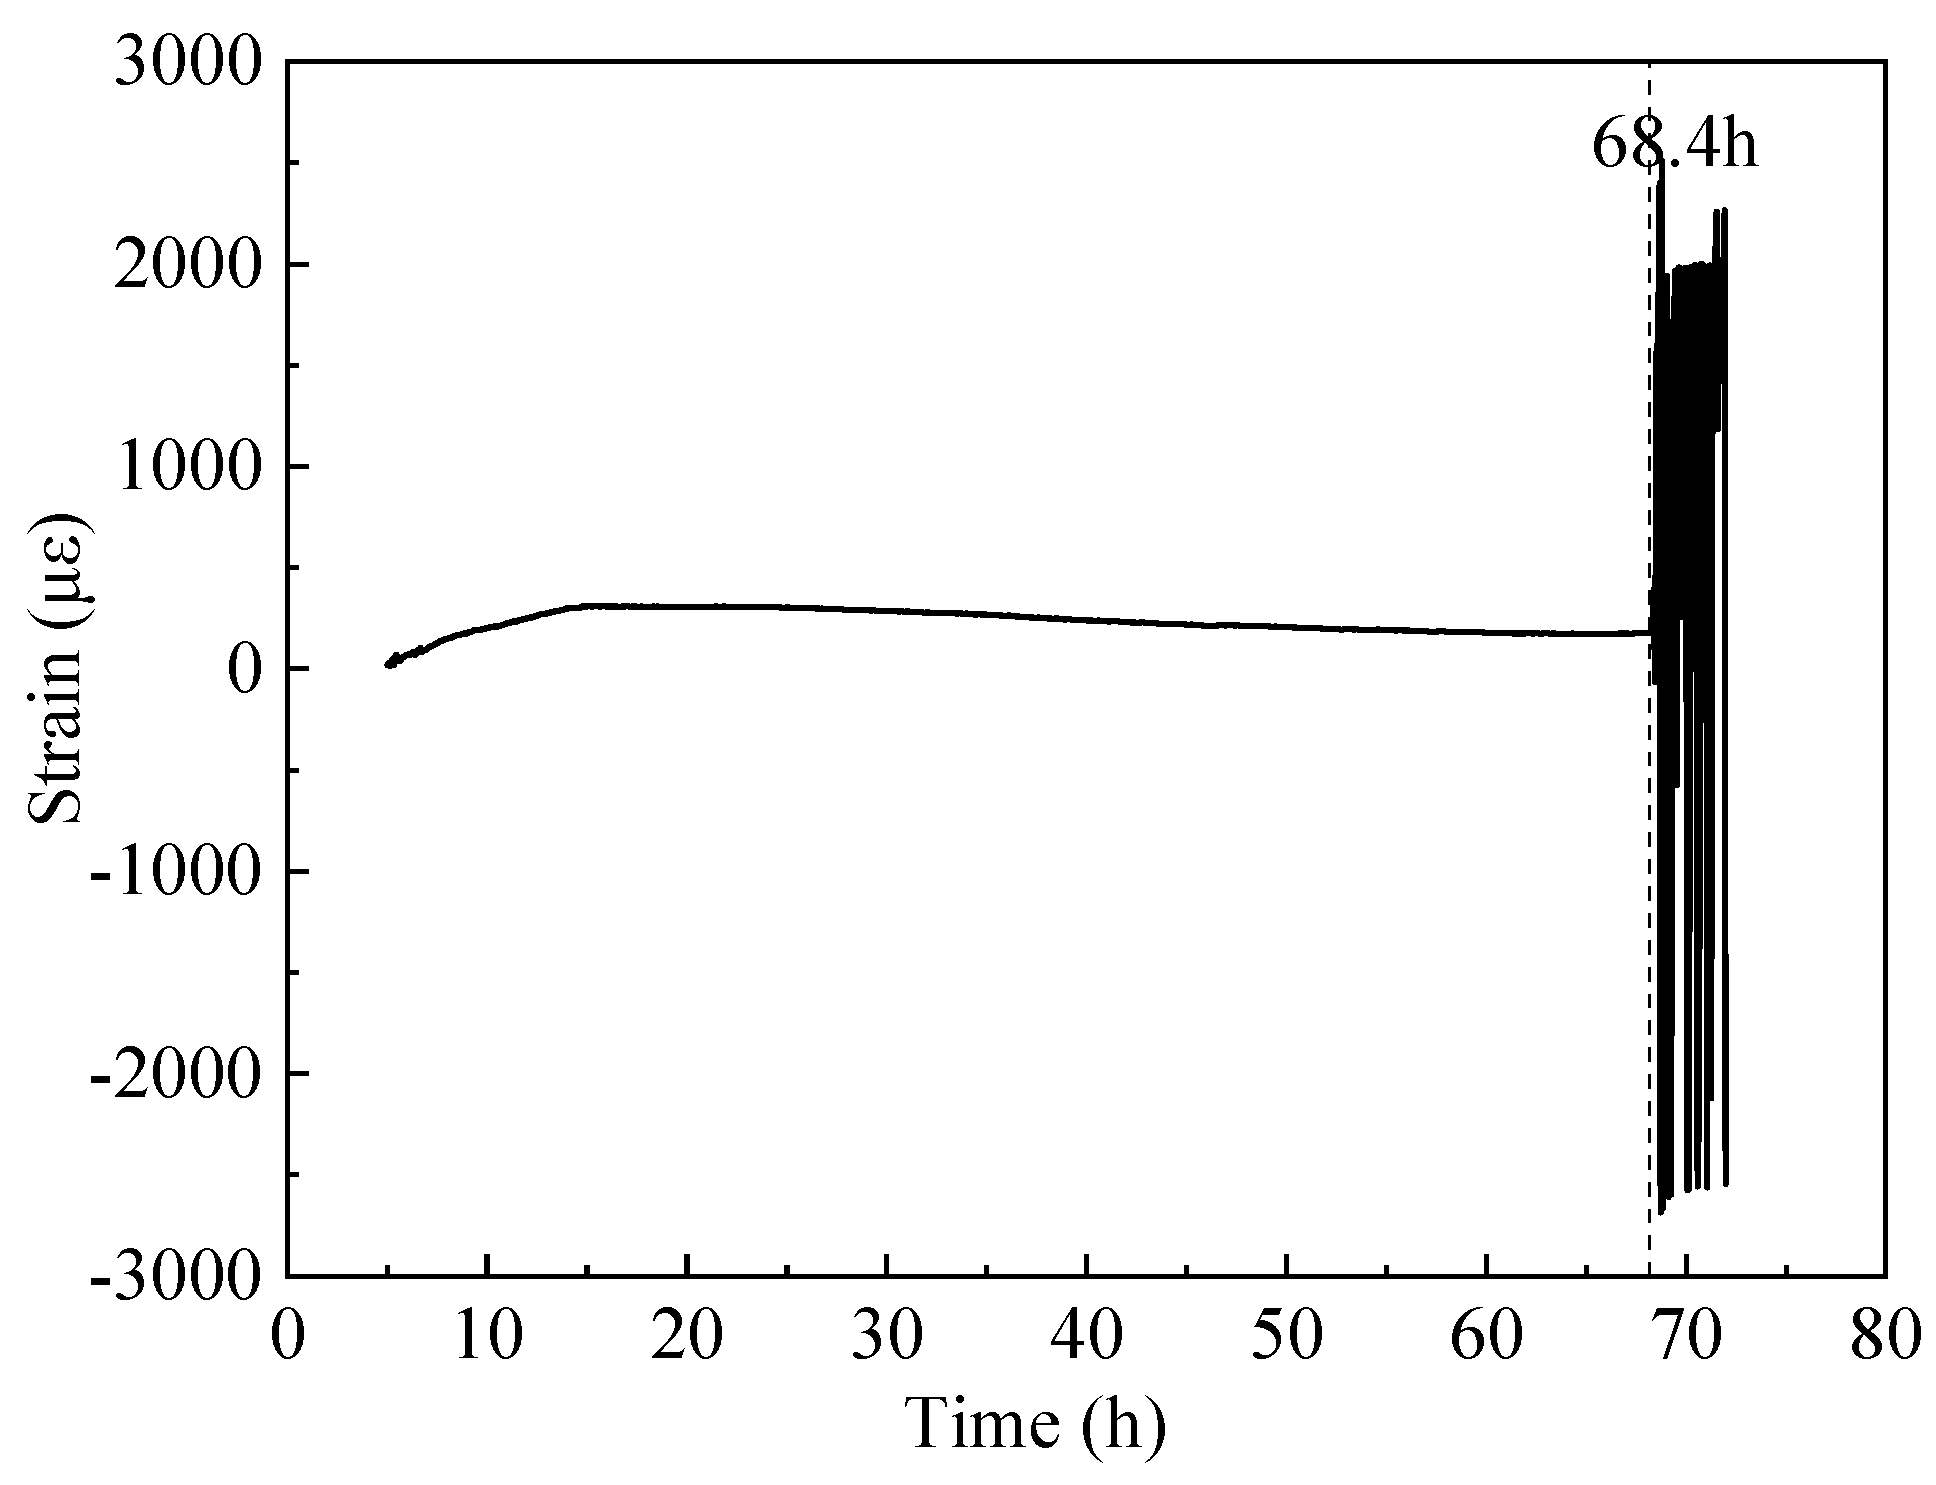
3.2. Cumulative Strain
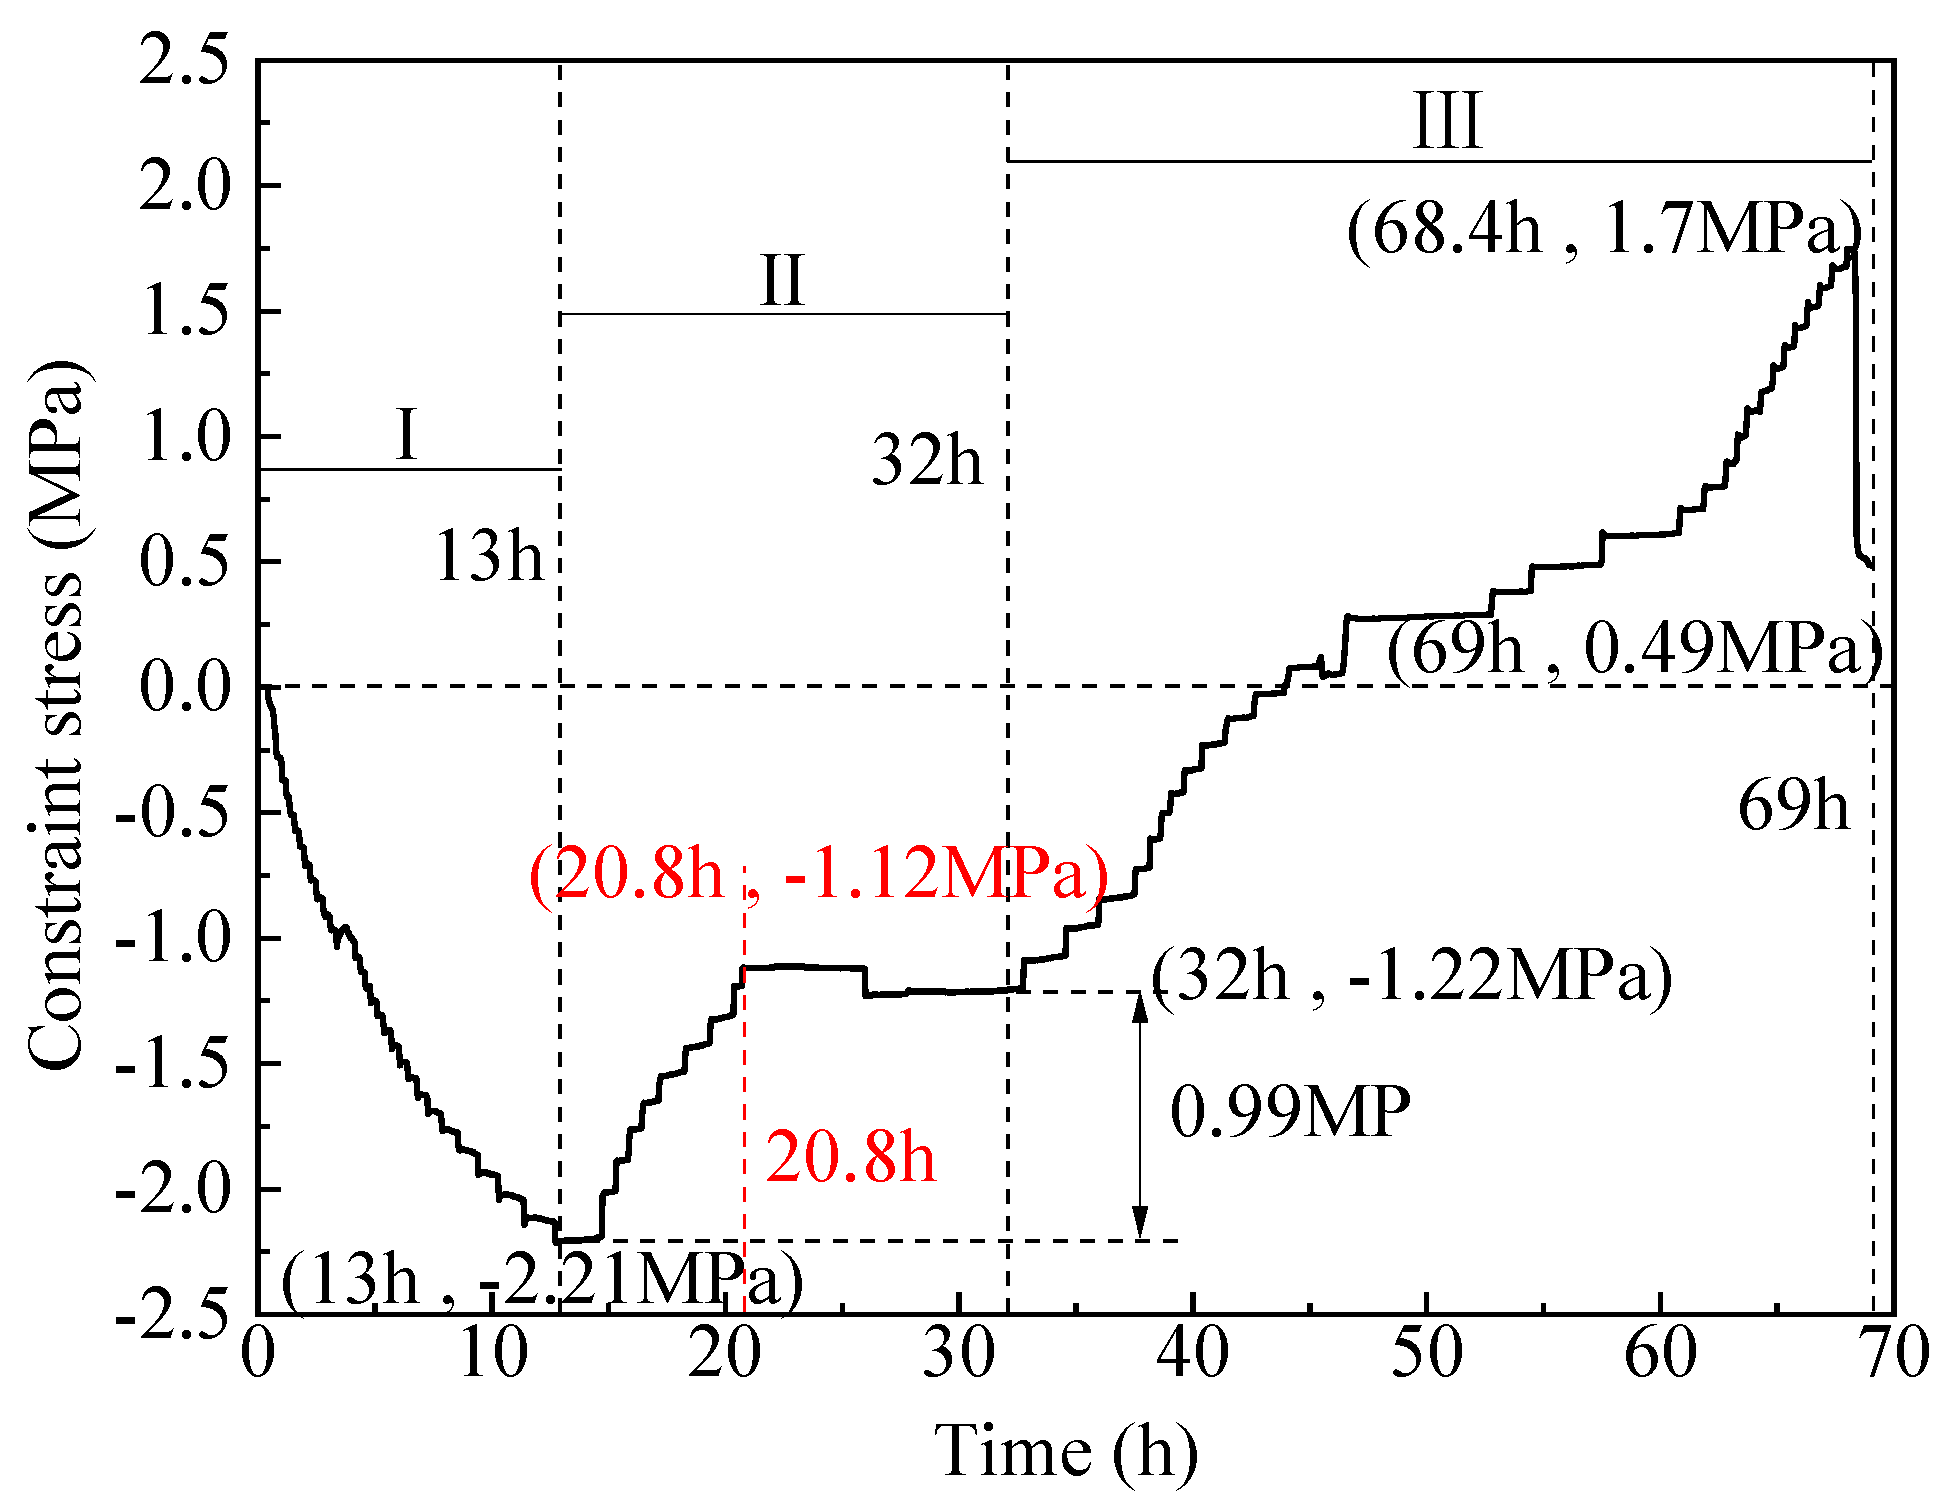
3.3. Constraint Stress
4. Conclusions
- (1)
- The average temperature at the inner edge of the inner shaft lining scaled model is close to the average temperature in the middle, and both are slightly higher than the average temperature at the outer edge of the model by 0.3 °C to 1.0 °C. The temperature distribution in the height direction of the inner shaft lining scaled model is relatively uniform, with a maximum difference of 0.5 °C;
- (2)
- The average temperature variation can be divided into four stages: rapid heating stage (T-I), steady temperature stage (T-II), slow cooling stage (T-III), and rapid cooling stage (T-IV). In stage T-I (0~16 h), the temperature of the shaft model rises rapidly from the initial temperature of 13.0 °C to 41.4 °C with an average temperature rising rate of 1.78 °C/h, which is attributed to the excellent conductivity under the action of 300 V direct current. In stage T-II (16~32 h), the shaft model reaches thermal equilibrium with the ambient temperature of 5 °C, and the temperature smoothly maintains at 39.8~40.5 °C. In stage T-III (32~51 h), the concrete strength continues to grow, and the electrical conductivity further decreases. The shaft model slowly cools down with an average cooling rate of 0.45 °C/h. In stage T-IV (51~69 h), the shaft model rapidly cools with an average cooling rate of 1.01 °C/h due to the low-temperature brine;
- (3)
- The trends in the cumulative relative displacement and cumulative strain at the end of the inner shaft lining scaled model can be divided into three stages. From 0 to 13 h, the cumulative relative displacement at the model end increases to a maximum value of 129.2 mm at 13 h, and the cumulative strain of the inner shaft lining scaled model decreases to a maximum compressive strain of −99.4 με at 13 h. From 13 to 32 h, the cumulative relative displacement of the model gradually decreases and decreases to 0 at 32 h when the model height is restored to 1200 mm, and the cumulative strain of the inner shaft lining scaled model increases from −99.4 με to 0. From 32 to 69 h, the cumulative relative displacement of the model gradually decreases and decreases to −244.2 mm at 69 h. The scaled model changes from a compressed state to a tensile state, and the cumulative strain of the model gradually increases to 187.8 με at 69 h;
- (4)
- The change in the constrained stress of the inner shaft lining scaled model can be divided into three stages. From 0 to 13 h, the constrained stress of the scaled model decreases to a maximum compressive stress of −2.21 MPa at 13 h. From 13 to 32 h, the constrained compressive stress at the model end gradually transitions to tensile stress, and the constrained stress of the scaled model increases to −1.22 MPa at 32 h. From 32 to 69 h, the constrained tensile stress at the model end gradually increases, and the constrained tensile stress increases to a maximum tensile stress of 1.7 MPa at 68.4 h. Then, the constrained stress of the scaled model rapidly unloads until the test ends at 69 h;
- (5)
- It is feasible to determine the location and time of cracking in the scaled model by judging whether the tensile strain values at each measurement point of the distributed fiber optic sensor exceed the ultimate tensile strain of concrete. The abnormal points of the tensile strain value of the distributed fiber optic sensor are located at a distance of 0.25 m and 0.36 m from the movable end clamp. A certain concrete strain value near the crack of the scaled model showed a sharp increase in tensile strain at 68.4 h.
Author Contributions
Funding
Institutional Review Board Statement
Informed Consent Statement
Data Availability Statement
Conflicts of Interest
References
- He, M. Research progress of deep shaft construction mechanics. Meitan Xuebao/J. China Coal Soc. 2021, 46, 726–746. [Google Scholar] [CrossRef]
- Zhang, T.; Zhang, C.; Song, F.; Zou, J.; Gao, Y.; Yang, W. Breakage behavior of silica sands during high-pressure triaxial loading using X-ray microtomography. Acta Geotech. 2023. [Google Scholar] [CrossRef]
- Zhang, T.; Zhang, C.; Luo, T. Effect of stress anisotropy on deformation and particle breakage of silica sand at high-pressure compression tests. Constr. Build. Mater. 2022, 316, 125835. [Google Scholar] [CrossRef]
- Gao, Y.; Yu, Z.; Chen, W.; Yin, Q.; Wu, J.; Wang, W. Recognition of rock materials after high- temperature deterioration based on SEM images via deep learning. J. Mater. Res. Technol. 2023, 25, 273–284. [Google Scholar] [CrossRef]
- Wu, Y.; Cui, J.; Huang, J.; Zhang, W.; Yoshimoto, N.; Wen, L. Correlation of Critical State Strength Properties with Particle Shape and Surface Fractal Dimension of Clinker Ash. Int. J. Geomech. 2021, 21, 04021071. [Google Scholar] [CrossRef]
- Xiao, Y.; Xiao, W.; Wu, H.; Liu, Y.; Liu, H. Fracture of Interparticle MICP Bonds under Compression. Int. J. Geomech. 2023, 23, 04022316. [Google Scholar] [CrossRef]
- Bo, D.; Yang, W.; Han, T.; Zhang, C. Monitoring and Analysis on Loads of Monolayer Shaft Lining in Porous Rock Aquifer. Chinese J. Undergr. Sp. Eng. 2016, 12, 450–455. [Google Scholar]
- Deng, W.; Shen, J.; Qiao, G. Some problems in the construction of coal mines in western China. Min. Eng. 2010, 31, 29–33. [Google Scholar] [CrossRef]
- Yao, Z.; Zhao, L.; Cheng, H.; Xu, H. Optimization design and measurement analysis on inter lining of high strength reinforced concrete frozen shaft lining with deep topsoil. Meitan Xuebao/J. China Coal Soc. 2019, 44, 2125–2132. [Google Scholar] [CrossRef]
- Song, L.; Wang, G.; Yang, C.; Han, L.; Li, H.; Yang, W. Model test study on freezing temperature field of seepage fissure rock mass. Caikuang yu Anquan Gongcheng Xuebao/J. Min. Saf. Eng. 2019, 36, 1256–1263. [Google Scholar] [CrossRef]
- Wang, Q.; Yang, W.; Wang, Y. Study on concrete strain of inclined shaft lining in deep alluvium during freezing sinking period. Caikuang Yu Anquan Gongcheng Xuebao/J. Min. Saf. Eng. 2016, 33, 655–661. [Google Scholar] [CrossRef]
- Yang, W. Development and prospect of freeze drilling technology in China over the past ten years. In Proceedings of the High-Level Academic Forum on the 50th Anniversary of the Establishment of China Coal Society, Beijing, China, 13 November 2012; pp. 1–7. [Google Scholar]
- Cheng, H.; Cai, H. Safety Situation and Thinking about Deep Shaft Construction with Freezing Method in China. J. Anhui Univ. Sci. Technol. Nat. Sci. 2013, 33, 1–6. [Google Scholar]
- GB-50384-2016; Design Specification for Coal Mine Shafts and Chambers. Ministry of Housing and Urban-Rural Development of the People’s Republic of China: Beijing, China, 2016.
- Zhou, Y.; Zhou, G.Q. Axisymmetric deformation analysis for the double layer shaft with a plastic interlayer. Meitan Xuebao/J. China Coal Soc. 2010, 35, 1470–1475. [Google Scholar] [CrossRef]
- Zhang, T.; Zhang, C.; Zou, J. Interface shear behavior of a shaft lining concrete-high density polyethylene material under different pre-imposed normal stresses. PLoS ONE 2022, 17, e0264691. [Google Scholar] [CrossRef]
- Zhou, J.; Zhou, G.; Shang, X.; Hu, K.; Li, T. Optimization calculation of double-layer shaft lining considering vertical additional force and temperature stress. J. Xi’an Univ. Archit. Technol. 2010, 42, 283–287. [Google Scholar] [CrossRef]
- Zhang, C.; Zhang, Y.; Yang, W.; Yin, J.; Zhang, T. Study on Evolution of the Thermophysical and Mechanical Properties of Inner Shaft Lining Concrete during Construction Period. Appl. Sci. 2022, 12, 10141. [Google Scholar] [CrossRef]
- Kodur, V.K.R.; Bhatt, P.P.; Soroushian, P.; Arablouei, A. Temperature and stress development in ultra-high performance concrete during curing. Constr. Build. Mater. 2016, 122, 63–71. [Google Scholar] [CrossRef]
- Yu, Y.; Jin, Z.; Shao, S.; Zhang, X.; Li, N.; Xiong, C. Evolution of temperature stress and tensile properties of concrete during steam-curing process. Constr. Build. Mater. 2021, 305, 124691. [Google Scholar] [CrossRef]
- Wei, Y.; Liang, S.; Guo, W.; Hansen, W. Stress prediction in very early-age concrete subject to restraint under varying temperature histories. Cem. Concr. Compos. 2017, 83, 45–56. [Google Scholar] [CrossRef]
- Zhang, T.; Yang, W.; Chen, G.; Huang, J.; Han, T.; Zhang, C. Monitoring and analysis of hydration heat temperature field for high performance mass concrete freezing shaft lining. Caikuang Yu Anquan Gongcheng Xuebao/J. Min. Saf. Eng. 2016, 33, 290–296. [Google Scholar] [CrossRef]
- Nguyen, D.H.; Nguyen, V.T.; Lura, P.; Dao, V.T.N. Temperature-stress testing machine—A state-of-the-art design and its unique applications in concrete research. Cem. Concr. Compos. 2019, 102, 28–38. [Google Scholar] [CrossRef]
- Zhao, Z.; Zhang, H.; Fang, B.; Sun, Y.; Zhong, Y.; Shi, T. Tensile creep model of slab concrete based on microprestress-solidification theory. Materials 2020, 13, 3157. [Google Scholar] [CrossRef] [PubMed]
- Kheir, J.; Klausen, A.; Hammer, T.A.; De Meyst, L.; Hilloulin, B.; Van Tittelboom, K.; Loukili, A.; De Belie, N. Early age autogenous shrinkage cracking risk of an ultra-high performance concrete (UHPC) wall: Modelling and experimental results. Eng. Fract. Mech. 2021, 257, 108024. [Google Scholar] [CrossRef]
- Estensen, A.; Terje, K.; Øyvind, K.; Sellevold, E.J. The effect of realistic curing temperature on the strength and E-modulus of concrete. Mater. Struct. 2018, 51, 168. [Google Scholar] [CrossRef]
- Ou, G.; Lin, Z.; Kishi, T. The practical application of a self-developed temperature stress testing machine in development of expansive concrete blended with calcium sulfoaluminate additives. Cem. Concr. Res. 2023, 164, 107045. [Google Scholar] [CrossRef]
- Liu, L.; Ouyang, J.; Li, F.; Xin, J.; Huang, D.; Gao, S. Research on the crack risk of early-age concrete under the temperature stress test machine. Materials 2018, 11, 1822. [Google Scholar] [CrossRef]
- Zhu, H.; Li, Q.; Hu, Y.; Ma, R. Double feedback control method for determining early-age restrained creep of concrete using a temperature stress testing machine. Materials 2018, 11, 1079. [Google Scholar] [CrossRef]
- Xin, J.; Liu, Y.; Zhang, G.; Wang, Z.; Wang, J.; Yang, N.; Qiao, Y. Evaluation of early-age thermal cracking resistance of high w/b, high volume fly ash (HVFA) concrete using temperature stress testing machine. Case Stud. Constr. Mater. 2022, 16, e00825. [Google Scholar] [CrossRef]
- Riding, K.A.; Poole, J.L.; Schindler, A.K.; Juenger, M.C.G.; Folliard, K.J. Quantification of effects of fly ash type on concrete early-age cracking. ACI Mater. J. 2008, 105, 149–155. [Google Scholar] [CrossRef]
- Kovler, K. Testing system for determining the mechanical behaviour of early age concrete under restrained and free uniaxial shrinkage. Mater. Struct. 1994, 27, 324–330. [Google Scholar] [CrossRef]
- Shen, D.; Liu, C.; Kang, J.; Yang, Q.; Li, M.; Li, C.; Zeng, X. Early-age autogenous shrinkage and tensile creep of hooked-end steel fiber reinforced concrete with different thermal treatment temperatures. Cem. Concr. Compos. 2022, 131, 104550. [Google Scholar] [CrossRef]
- Abdi Moghadam, M.; Izadifard, R.A. Prediction of the tensile strength of normal and steel fiber reinforced concrete exposed to high temperatures. Int. J. Concr. Struct. Mater. 2021, 15, 47. [Google Scholar] [CrossRef]
- Jiang, Y.; Ling, T.C.; Shi, C.; Pan, S.Y. Characteristics of steel slags and their use in cement and concrete—A review. Resour. Conserv. Recycl. 2018, 136, 187–197. [Google Scholar] [CrossRef]
- Li, L.; Dao, V.; Lura, P. Autogenous deformation and coefficient of thermal expansion of early-age concrete: Initial outcomes of a study using a newly-developed Temperature Stress Testing Machine. Cem. Concr. Compos. 2021, 119, 103997. [Google Scholar] [CrossRef]
- Yin, J. Thermo-Physical and Mechanical Properties of the Similar Material of Inner Shaft Lining Concrete during Construction Period; China University of Mining and Technology: Beijing, China, 2020. [Google Scholar]


| Type | Geometric Scale Ratio | Net Diameter of Inner Wall (mm) | Thickness of Inner Wall (mm) | Thickness of Plastic Plate (mm) | Height of Inner Wall (mm) |
|---|---|---|---|---|---|
| Engineering prototype | 1 | 8000 | 2000 | 3 | — |
| Similar model | 40 | 200 | 50 | 0.075 | 1200 |
| Water (kg) | Cement (kg) | Iron Slag (kg) | Fine Aggregate (kg) | Coarse Aggregate (kg) | Water Reducer (kg) |
|---|---|---|---|---|---|
| 189 | 359 | 251 | 527 | 1173 | 1.22 |
| SiO2 | Al2O3 | Fe2O3 | CaO | MgO | SO3 |
|---|---|---|---|---|---|
| 20.83 | 4.74 | 2.91 | 61.26 | 3.29 | 2.30 |
| Time/h | T1 /°C | T2 /°C | T3 /°C | T4 /°C | T5 /°C | T6 /°C | Tave-12 /°C | Tave-34 /°C | Tave-56 /°C | T-L /°C | T-M /°C | Tave /°C |
|---|---|---|---|---|---|---|---|---|---|---|---|---|
| 0 | 12.7 | 13.3 | 13.2 | 12.7 | 13.4 | 12.5 | 13.0 | 13.0 | 13.0 | 12.8 | 13.1 | 13.0 |
| 16 | 40.5 | 43.1 | 42.7 | 40.7 | 41.7 | 39.8 | 41.8 | 41.7 | 40.8 | 41.2 | 41.6 | 41.4 |
| 32 | 39.8 | 42.4 | 42.3 | 40.2 | 41.4 | 39.6 | 41.1 | 41.2 | 40.5 | 40.7 | 41.2 | 40.9 |
| 51 | 31.3 | 33.8 | 33.7 | 31.6 | 33.3 | 31.5 | 32.5 | 32.7 | 32.4 | 32.3 | 32.8 | 32.5 |
| 69 | 13.1 | 14.5 | 14.3 | 13.1 | 13.9 | 12.6 | 13.8 | 13.7 | 13.3 | 13.4 | 13.7 | 13.6 |
Disclaimer/Publisher’s Note: The statements, opinions and data contained in all publications are solely those of the individual author(s) and contributor(s) and not of MDPI and/or the editor(s). MDPI and/or the editor(s) disclaim responsibility for any injury to people or property resulting from any ideas, methods, instructions or products referred to in the content. |
© 2023 by the authors. Licensee MDPI, Basel, Switzerland. This article is an open access article distributed under the terms and conditions of the Creative Commons Attribution (CC BY) license (https://creativecommons.org/licenses/by/4.0/).
Share and Cite
Zhang, C.; Wang, S.; Zhang, T.; Li, D.; Chen, H. Development and Preliminary Application of Temperature Stress Test Machine for Cast-in-Place Inner Shaft Lining. Materials 2023, 16, 4351. https://doi.org/10.3390/ma16124351
Zhang C, Wang S, Zhang T, Li D, Chen H. Development and Preliminary Application of Temperature Stress Test Machine for Cast-in-Place Inner Shaft Lining. Materials. 2023; 16(12):4351. https://doi.org/10.3390/ma16124351
Chicago/Turabian StyleZhang, Chi, Shuaishuai Wang, Tao Zhang, Dahai Li, and Hairui Chen. 2023. "Development and Preliminary Application of Temperature Stress Test Machine for Cast-in-Place Inner Shaft Lining" Materials 16, no. 12: 4351. https://doi.org/10.3390/ma16124351
APA StyleZhang, C., Wang, S., Zhang, T., Li, D., & Chen, H. (2023). Development and Preliminary Application of Temperature Stress Test Machine for Cast-in-Place Inner Shaft Lining. Materials, 16(12), 4351. https://doi.org/10.3390/ma16124351