Article

Estimation of Stiffness of Non-Cohesive Soil in Natural State and Improved by Fiber and/or Cement Addition under Different Load Conditions

by
Katarzyna Zabielska-Adamska
*,
Patryk Dobrzycki
* and
Mariola Wasil
Faculty of Civil Engineering and Environmental Sciences, Bialystok University of Technology, ul. Wiejska 45E, 15-351 Bialystok, Poland
*
Authors to whom correspondence should be addressed.
Materials 2023, 16(1), 417; https://doi.org/10.3390/ma16010417
Submission received: 10 November 2022 / Revised: 28 November 2022 / Accepted: 28 December 2022 / Published: 1 January 2023
(This article belongs to the Special Issue Advanced Experimental Research on Pavement and Subgrade Materials)

Abstract

:
The aim of this study was to compare the stiffness of gravelly sand under various load conditions—static conditions using the CBR test and cyclic conditions using the resilient modulus test. The tests were conducted on natural soil and soil improved by the addition of polypropylene fibers and/or 1.5% cement. The impacts of the compaction and curing time of the stabilized samples were also determined. The soil was sheared during the M r tests, even after fiber reinforcement, so the resilient modulus value for the unbound sand could not be obtained. The cement addition improved M r , and the curing time also had an impact on this parameter. The fiber addition increased the value of the resilient modulus. The CBR value of the compacted gravelly sand was relatively high. It increased after adding 0.1% fibers in the case of the standard compacted samples. The greater fiber addition lowered the CBR value. For the modified compacted samples, each addition of fibers reduced the CBR value reduced the CBR value. The addition of cement influenced the CBR increase, which was also affected by the compaction method and the curing time. The addition of fibers to the stabilized sample improved the CBR value. The relationship M r = f ( C B R ) obtained for all data sets was statistically significant but characterized by a large error of estimate.

1. Introduction

The soil and granular material embedded in the base and subbase of pavements are subjected to a large number of loads at stress levels considerably below their shear strength. Under a single load on a moving wheel, pavements mainly respond in an elastic way. Nevertheless, indivertible plastic and viscous stresses may accumulate with repeated loading [1], and the thickness of the pavement layers is of great importance for maintaining flexible pavements. The impact of repetitive loadings on pavements was explained in 1955 [2], and a new term, “resilience”, was introduced. The resilient response of granular material as a modulus of resilience (later known as the resilient modulus), as the ratio of repeated deviator stress in the triaxial compression test to the recoverable (resilient) axial strain, was first defined by Seed et al. [3,4]:
M r = σ d ε r = σ 1 σ 3 ε r
This corresponds to Young’s modulus, but under cyclic loads, the elastic modulus can be replaced by the resilient modulus to account for the non-linearity and stress dependence under cyclic loading.
The resilient modulus of unbound materials has been most often evaluated in laboratories using a triaxial apparatus, but other methods, such as the simple shear test, the hollow cylinder test, the true triaxial test, and the torsional resonant column test, can also be applied. It should be noted that the tests should be performed in devices with the possibility of cyclic loading, because only then is it possible to assess the effect of stress and strain accumulation. Cyclic triaxial test procedures have been standardized; the most influential ones are the AASHTO T307 [5] and EN 13286-7 [6] standards. It should be emphasized that the European Standard [6] concerns only unbound mixtures; bound mixtures are still estimated by means of the static elastic modulus.
To date, many researchers have examined the impacts of numerous factors on the resilient modulus of several types of soil. The effects of the confining pressure and deviator stress, load frequency and duration, amount of load cycles, density, graining, and soil saturation were characterized in detail by Brown [1] and Lekarp et al. [7]. The main factors influencing the resilient modulus of unbound non-cohesive [4,8,9,10,11,12] and cohesive soils [13,14,15,16] are applied axial stress and confining pressure, but their impacts are different. In the case of non-cohesive soils, the resilient modulus increased slightly with confining pressure and significantly with repeated axial stress. The resilient modulus depended on the number of loading cycles and their frequency [17]. Tanimoto and Nishi [13] stated that, after a large number of repetitions, the resilient strains of silty clay reached a constant value after modifying the soil structure. Tang et al. [12] assessed the repetition amount of about one hundred cycles. The changeability of the accumulated plastic strain was bigger with a greater number of load cycles, a higher amplitude of dynamic stress, and a lower confining pressure the resilient modulus of cohesive soil with low plasticity [18,19] increased with an increase in matric suction and relative compaction.
Nowadays, the mechanistic design methods for pavements and pavement layers require the resilient modulus of unbounded pavement layers in order to establish layer thickness and the whole system response to traffic loads. However, the resilient modulus testing procedure is considered to be complicated, and regional road laboratories do not have cyclic triaxial apparatuses at their disposal. Therefore, the relationship between the resilient modulus value and other parameters, often even available in databases, is sought. Statistical regression models can be divided based on [20]: (I) a single strength or stiffness parameter; (II) physical soil parameters and stress state; (III) a stress invariant or a set of stress invariants; and (IV) constitutive equations for the estimation of resilient modulus values based on soil’s physical properties incorporated into the model parameters in addition to stress invariants. One such single parameter of the first group is the California Bearing Ratio (CBR).
The CBR test has been commonly applied in granular material and soil testing in road laboratories for about eighty years. The CBR parameter is defined as the ratio of the unit load (in percent), which is used so that a standardized piston may be pressed in a soil sample to a certain depth at a rate of 1.25 mm/min and standard load, corresponding to the unit load needed to press the piston at the same rate into the same depth of a crushed rock at standard compaction. In many countries, the method based on CBR remains the primary method of pavement design or even the recommended method for characterizing subgrades [1]. It needs to be mentioned that the CBR value does not reflect the shear stress caused by repeated traffic loading. The shear stress depends on several factors, none of which is fully controlled or modeled in the CBR test. However, CBR values are strongly related to compaction characteristics, so the CBR test can be applied as a method of assessing earthworks [21,22]. The CBR value is used to evaluate the subgrade or subbase penetration resistance, and it can be employed to assess the resistance to static failure.
The most frequently quoted in the literature relationship M r = f ( C B R ) is the formula given by Heukelom and Klomp [23]:
M r = 10   C B R   ( MPa )
Formula (2) has been converted into SI units. It should be mentioned here that the relationship was not originally related to the resilient modulus obtained in laboratory tests but to the dynamic modulus, which was determined based on vibration wave propagation. Nevertheless, this relationship is commonly used in the form of the relationship M r = f ( C B R ) . Although the regression coefficient provides the best fit with CBR values from 2 to 200, many researchers have limited the CBR values to less than 10 or 20. Many researchers have found that the relationship of M r = f ( C B R ) underestimates the M r value for lower CBR values and overestimates it for higher CBR values. A detailed discussion of the evaluation of the dependence of M r on CBR was carried out by Dione et al. [24]. Farell and Orr [25] confirm that Equation (2) overestimates the stiffness of fine-grained soil, especially at high CBR values. They believe that, at low CBR values, CBR corresponds to the stiffness of the material while at high values of its strength. An underestimation of the M r value of soaked gypsum sand [26] and an overestimation in the case of a soil-fly ash mixture have been found using other relationships M r = f ( C B R ) proposed in the literature [27].
The authors of this study concluded from their previous research that it may not be possible to provide the relationship of M r = f ( C B R ) for non-cohesive soil because the cyclic triaxial test can destroy unbound non-cohesive soil [28,29]. Thus, the aim of this study was to compare the stiffness tested under different load conditions in a typical non-cohesive soil used for road base and subbase construction—postglacial gravelly sand. Static and cyclic loads, represented by CBR and resilient modulus tests, were considered. The soil was tested as unbound and hydraulically bound by the addition of 1.5% cement, choosing the minimum amount that could improve the resilient characteristics of the tested soil. As the authors’ previous experiences have shown that non-cohesive soil can be sheared during the cyclic triaxial test, it was also decided to test soil samples reinforced with 18 mm-long polypropylene fibers to improve the tested material [30]. Thus, the behaviors of four different materials were considered—gravelly sand, fiber-reinforced gravelly sand, cement-stabilized gravelly sand, and cement-stabilized and fiber-reinforced gravelly sand. The impacts of compaction methods, standard and modified Proctor tests, and the curing time of the stabilized samples were also established.

2. Materials and Methods

2.1. Materials

Studies were conducted on two research samples of non-cohesive soil and cement-stabilized soils, as well as their mixtures with different quantities of polypropylene fibers.
Figure 1 illustrates the grain-size distribution curves of the different samples of the tested soils based on sieve analyses according to the EN 933-1 standard [31]. The estimated material is a coarse soil, with sand as its primary fraction and gravel as its secondary fraction. The tested soil is gravelly sand (grSa) in accordance with the EN ISO 14688-1 standard [32]. The values of the coefficient of uniformity (CU) and the coefficient of curvature (CC), calculated based on the grain-size distribution curves of the research samples I and II, were 5.45 and 0.87, and 5.04 and 0.66, respectively. The tested soil can be assessed as poorly graded based on the EN ISO 14688-2 standard [33]. The tested soil meets the standard requirements [34,35] for subbase or base materials with a lower percentage of fine fractions, which is suitable in frost areas.
Gravelly sand is a Pleistocene glaciofluvial soil characterized by a variability in the relief surface related to the high dynamics of the sedimentary environment and the variety of mineral compositions of post-glacial soils. Gravelly sand consists of well-rounded quartz crumbles, as well as angular grains, with a considerable amount of lytic particles and feldspars [28,36].
The compaction parameters, optimum water content (wopt), and maximum dry density (ρd max) were established in accordance with the standard Proctor (SP) and modified Proctor (MP) methods, following the EN 13286-2 standard [37]. The compaction curves of the two different research samples of gravelly sand, along with saturation lines, are shown in Figure 2. In the cases of both research samples, for the soil compacted by means of a higher compaction energy, the degree of saturation, ( S r ) is slightly higher than that for the soil compacted by means of a lower compaction energy. Sample I, with slightly better graining parameters, (CU)and (CC) is characterized by a greater density obtained at a lower water content in both compaction methods, standard and modified, than that of sample II.
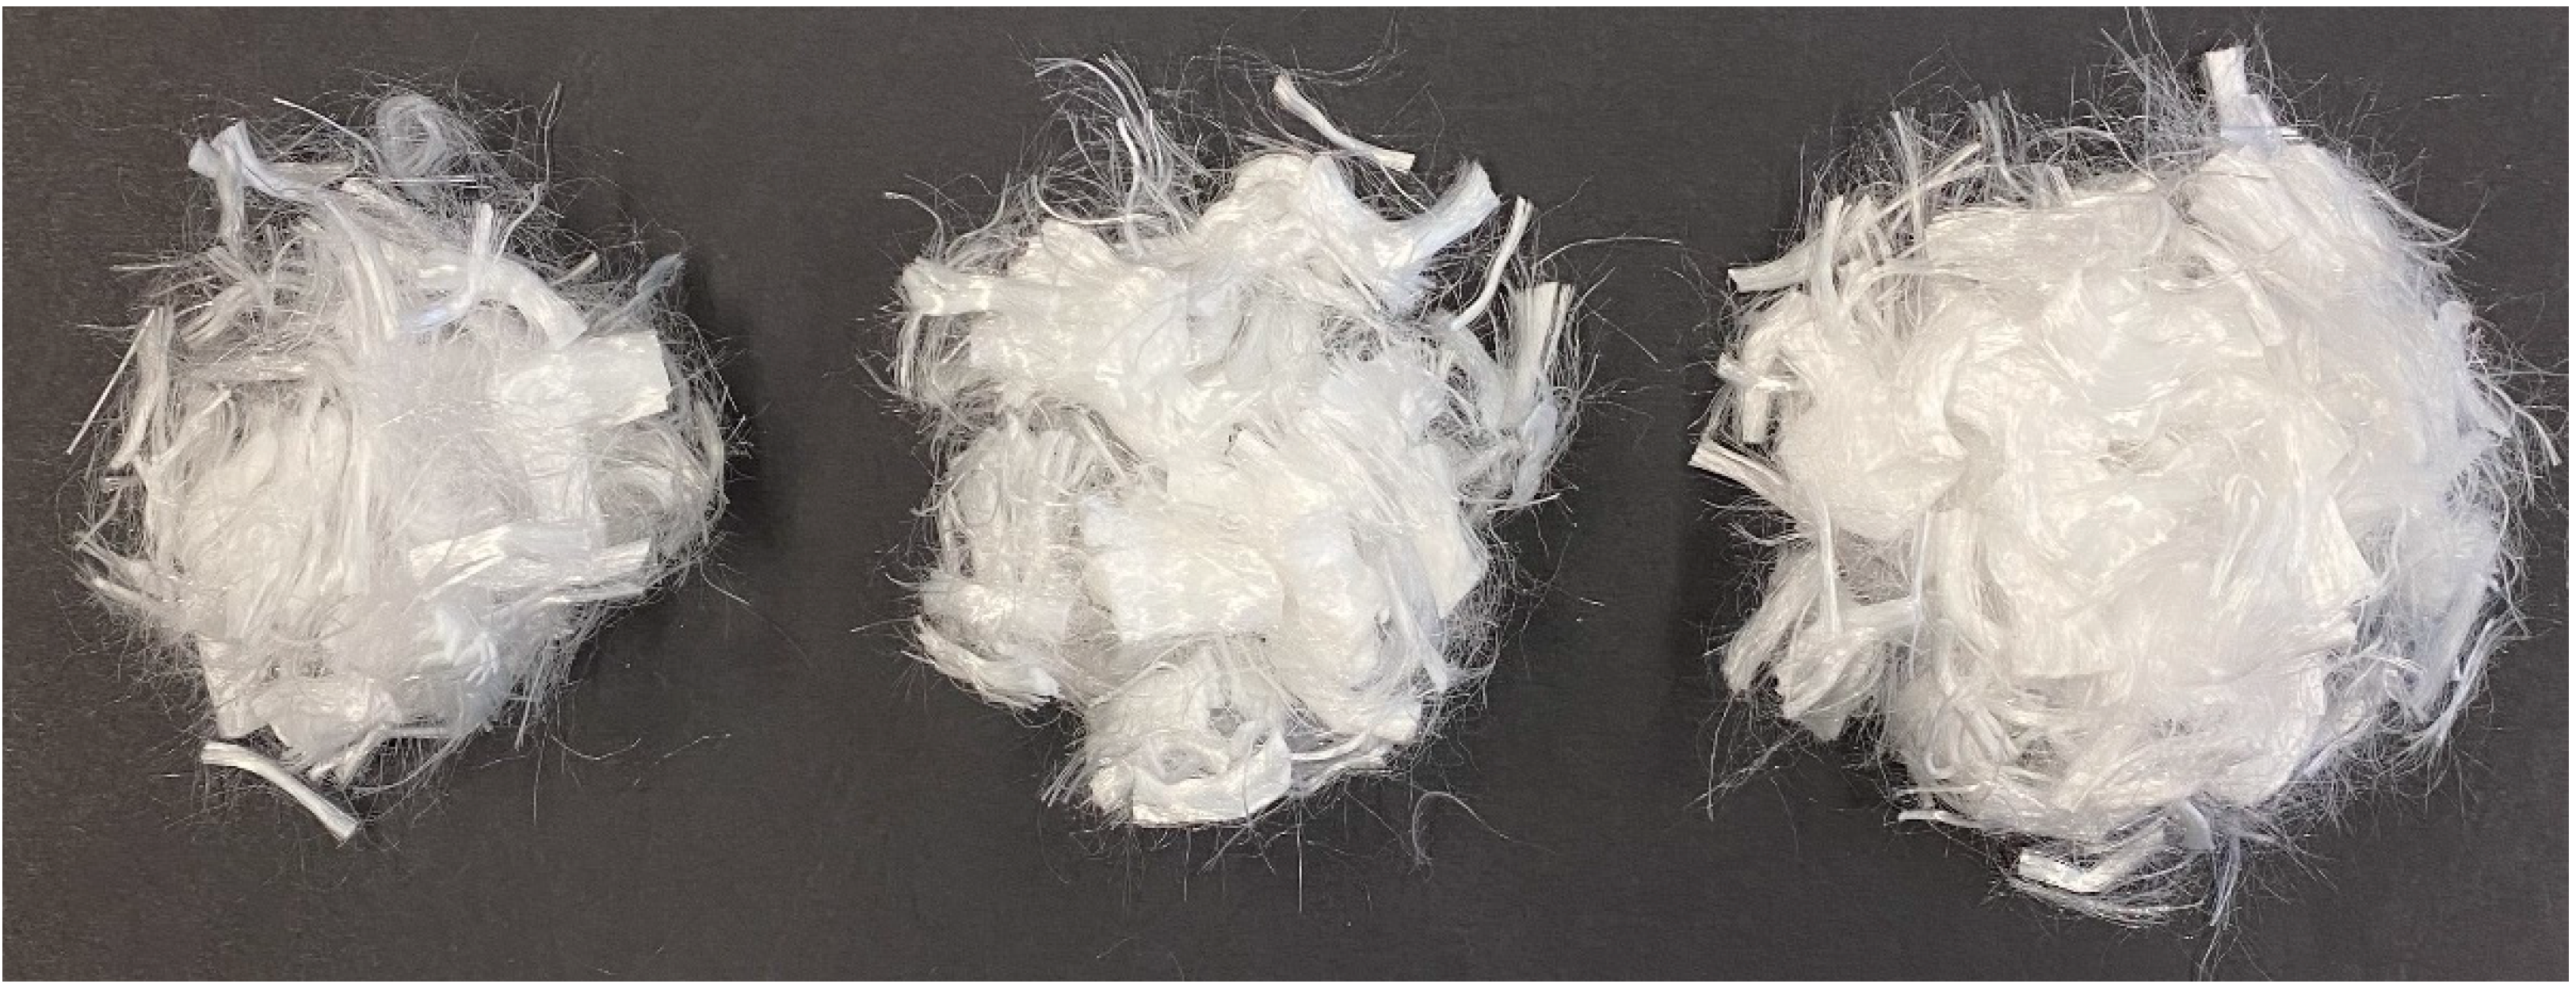
The hydraulically bound mixture of soil and cement was created with the addition of 42.5R Portland cement in the amount of 1.5% of the dry mass of the cement to the dry mass of the soil in an examined sample. An attempt was also made to test the soil samples and the soil–cement mix with dispersed reinforcement in the form of polypropylene fibers. Thus, 18 mm-long fibers were used, which were added at amounts of 0.1%, 0.2%, and 0.3% in relation to the dry mass of the compacted soil. The polypropylene fibers are shown in Figure 3. The soil and polypropylene fiber mixtures were mixed by the means of a laboratory mechanical stirrer, which is of great importance for the homogeneity of the tested samples.
The compaction parameter (ρd max and wopt), void ratio at maximum compaction (e), and specific dry density (ρs) values of all the tested materials are presented in Table 1.
For both compaction methods, it can be noted that the value of the void ratio, (e) decreases with an increase in the cement addition to the mixture. The specific dry density slightly increases with the addition of the cement to the mixture. However, the addition of the polypropylene fibers generally does not influence the specific dry density because of their low mass. The maximum dry density increases, while the void ratio decreases after the addition of the polypropylene fibers to the gravelly sand or to the sand and cement mixture. Generally, the optimum water content decreases thereafter.

2.2. Methods

2.2.1. California Bearing Ratio Test

The California Bearing Ratio (CBR) is defined as follows:
C B R = p p s 100 %
where p is the unit load used to press a standardized piston in a soil to a specific depth at a rate of 1.25 mm/min, and p s is the unit load needed to press the piston at the same rate into the same depth of a crushed rock at standard compaction.
The CBR laboratory tests were conducted on the samples of the gravelly sand and its mixtures with 1.5% cement and/or various percentages of polypropylene fibers in the amounts of 0.1%, 0.2%, and 0.3%. The percentage represents the dry mass of the additive per the dry mass of the soil in a specimen. For hydraulically bound material, dry soil was mixed with the fibers and cement by means of a laboratory mechanical stirrer; then, water was added to gain a moisture content relating to wopt (see Table 1). The samples were compacted at optimum water contents using the standard Proctor (SP) and the modified Proctor (MP) methods in CBR molds. The CBR tests were performed on the samples directly after compaction (hydraulically unstabilized) and on the samples compacted and cured for 7 and 28 days at constant humidity and a temperature of 20 °C to avoid drying. The tests presented in this paper were performed only on unsoaked samples to enable comparisons of the test conditions during the CBR and resilient modulus tests.
The samples were loaded following the ASTM D1883 standard [38], with a recommended load of 2.44 kPa (4.54 kg) in the static penetration tests. Figure 4a shows a loaded sample in a CBR mold prior to testing. The larger CBR value was accepted as a result calculated based on the piston resistance at a given depth: 2.5 or 5.0 mm. The results obtained were collected using a computer program.
In accordance with the requirements of the EN 13286-47 standard [39], immediate bearing index tests were also carried out, i.e., CBR tests without a load on the sample. The tests of the hydraulically bound mixtures in this case were carried out no later than 90 min after mixing.

2.2.2. Resilient Modulus in Cyclic Triaxial Apparatus

The resilient modulus, (Mr) is expressed by the following formula:
M r = σ c y c l i c ε r
where σ c y c l i c is the amplitude of the applied cyclic axial stress, and ε r is the relative resilient (recovered) axial strain.
Laboratory tests were executed in the cyclic triaxial test apparatus on the gravelly sand and its mixtures with 1.5% cement and/or various percentages of polypropylene fibers in the amounts of 0.1%, 0.2%, and 0.3%. The percentage represents the dry mass of the additive per the dry mass of the soil in an examined sample. At first, the dry components were mixed using the laboratory mechanical stirrer; then, water was added to obtain a moisture content corresponding to wopt (see Table 1). The cylindrical specimens, of 70 mm ID and 140 mm high, were compacted by impact in three layers in a bipartite mold to obtain the maximum dry density values found using the standard Proctor (SP) and the modified Proctor (MP) tests (Table 1), and they were then relocated to the triaxial chamber. The M r tests were conducted on the specimens directly after compaction (hydraulically unstabilized) and after 7 and 28 days of curing at a constant temperature and humidity. An image of a sample prepared for testing is shown in Figure 5.
In the cyclic triaxial apparatus, the confining pressure and axial load were put on pneumatically. The machine used repeated cycles of the haversine-shaped load pulse, where the load pulse lasted 0.1 s, and the rest period lasted 0.9 s. The variations in the sample height in the course of the tests were measured using external LVDT displacement transducers. The test settings and the results found were controlled and saved by a computer program. An image of a sample in the triaxial chamber prior to the cyclic test is shown in Figure 4b.
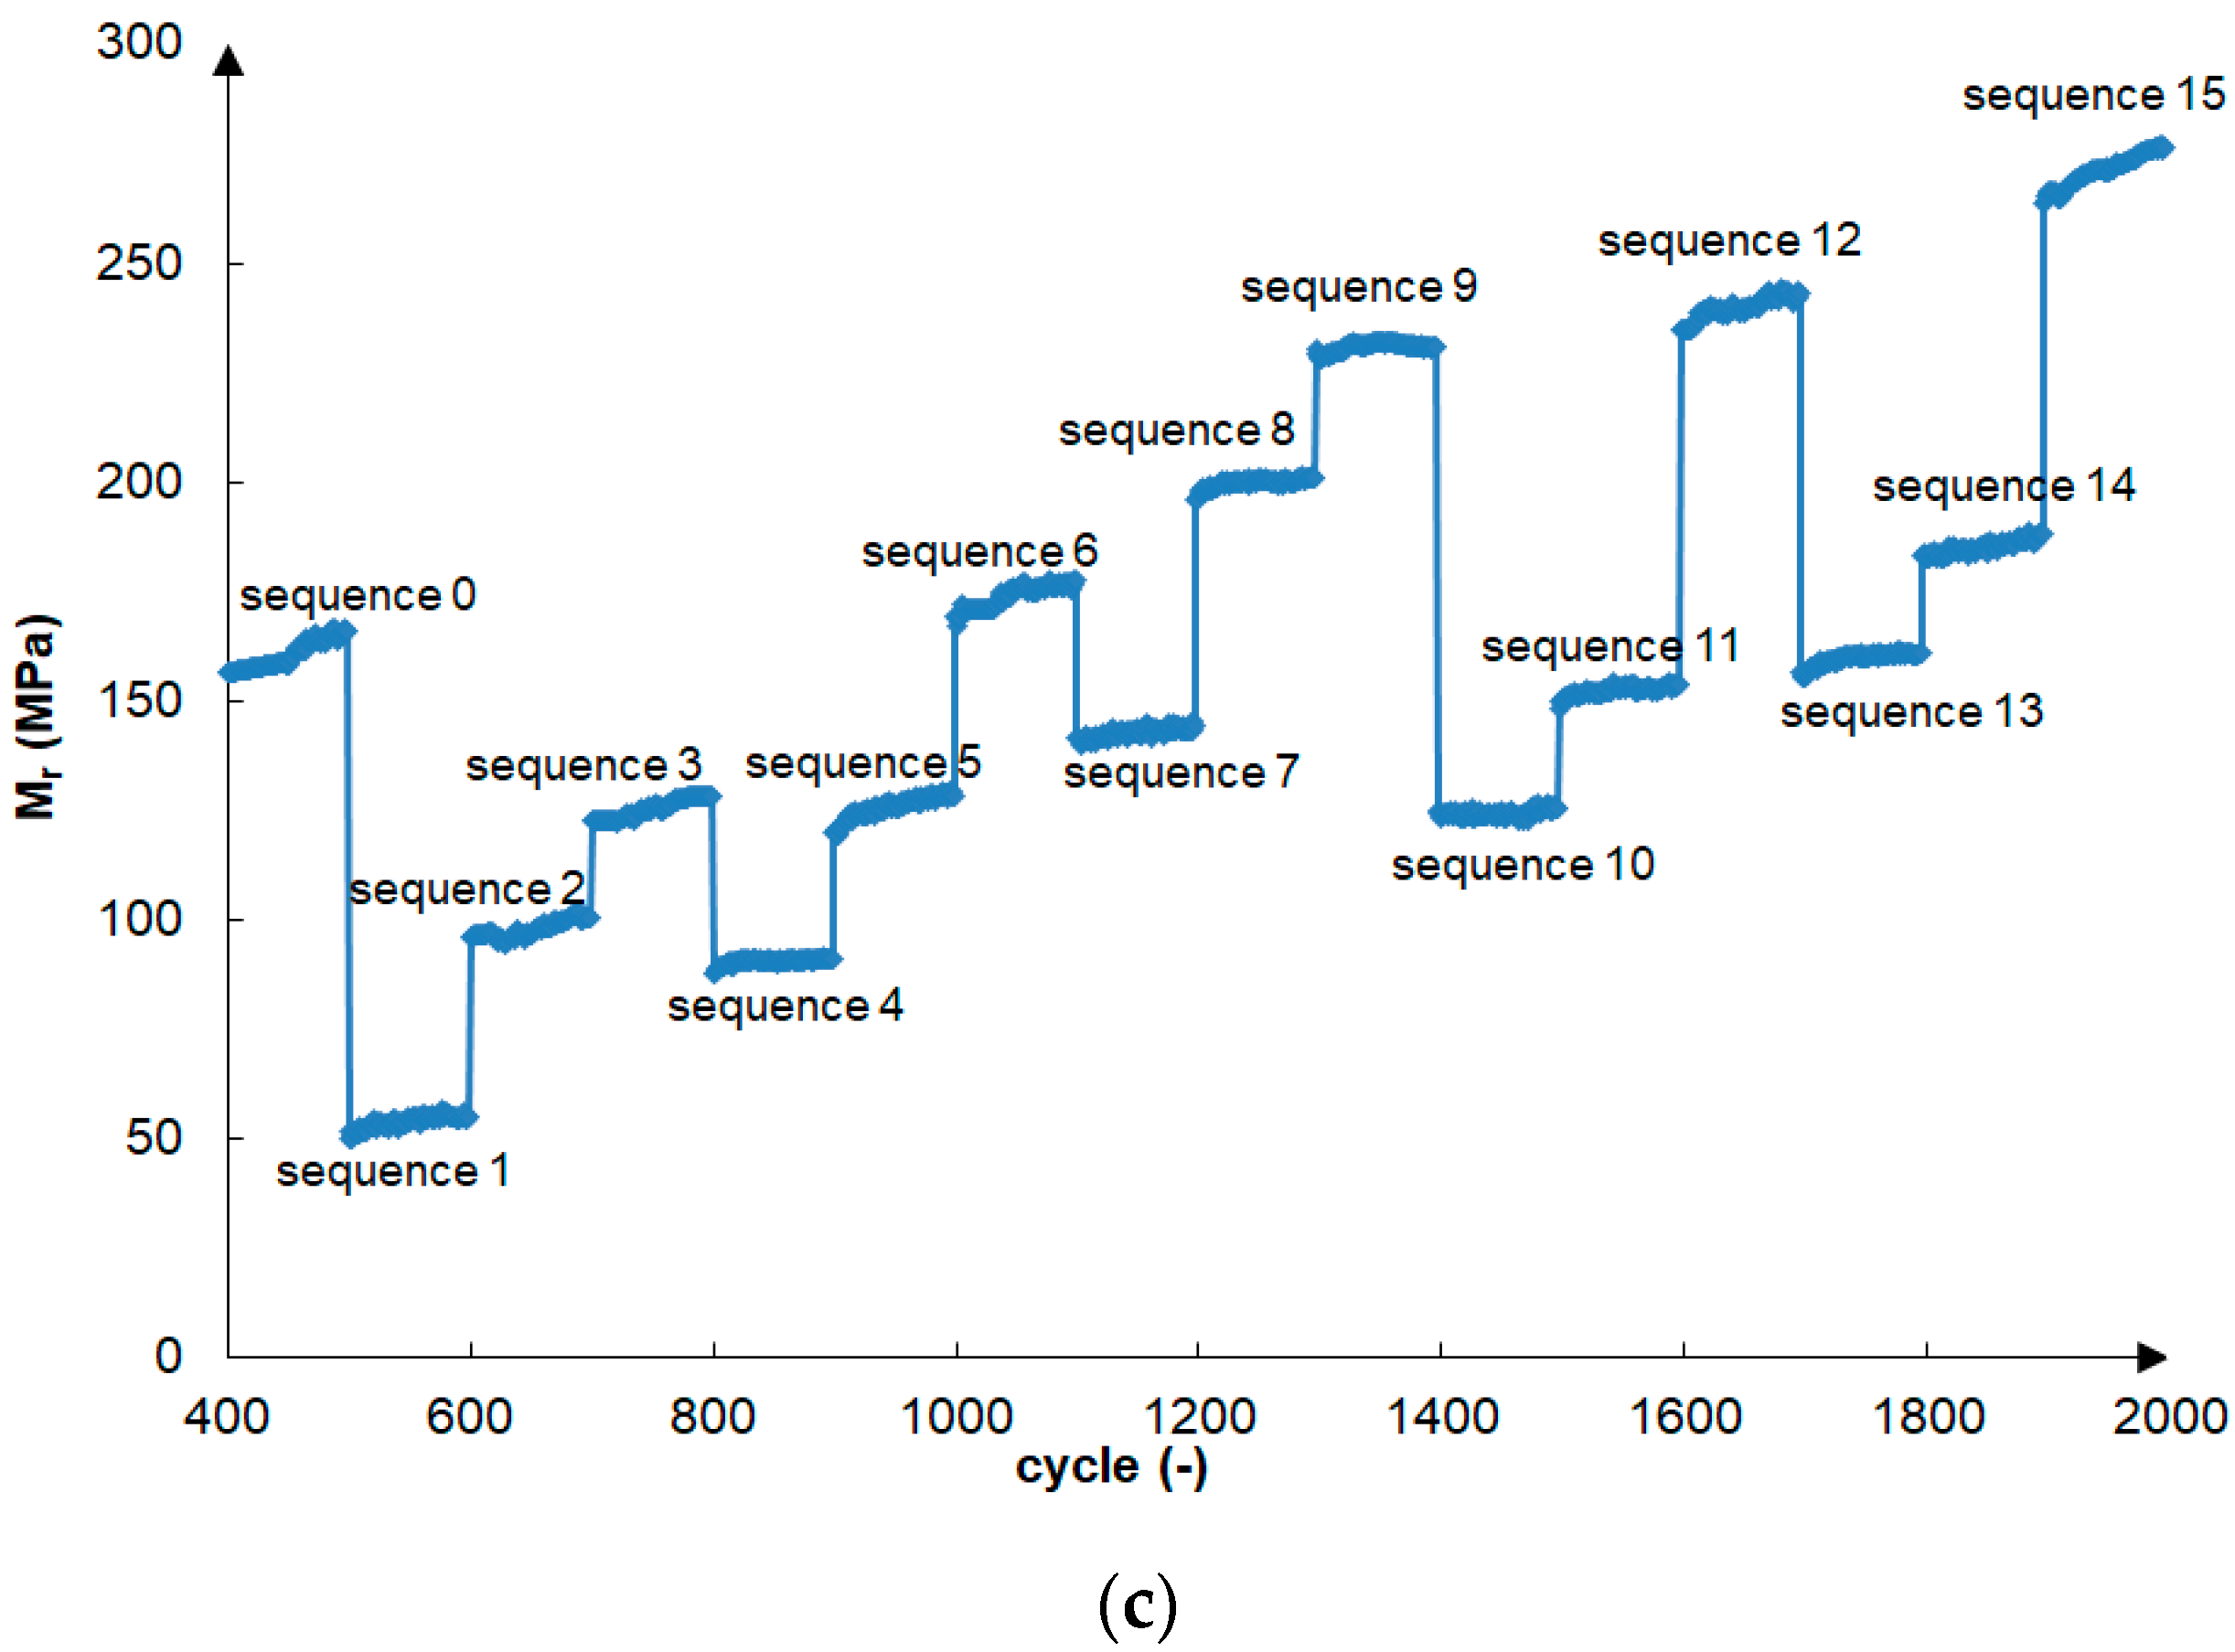
The specimens were exposed to cyclic loading in order to establish the resilient modulus M r according to the AASHTO T307 standard [7]. Table 2 describes the sequence 0–15 data for the subgrade material. Sequence “0” is the conditioning of the specimen. The number of cycles for this sequence was 500–1000 cycles; for all following sequences, it was constant and equal to 100. In the subsequent fifteen sequences, the confining pressure ranged from 20.7 to 137.9 kPa, and the maximum axial stress ranged from 20.7 to 275.8 kPa. The M r value was calculated for sequences from 1 to 15 as the average value of the previous five cycles of each load sequence.

3. Results and Discussion

Table 3 presents the California Bearing Ratio test results obtained for the gravelly sand and the sand with the 1.5% cement addition. Two different research samples taken from the same deposit were tested. All types of specimens were tested alone or improved by polypropylene fibers, with a length of 18 mm, in the amounts of 0.1%, 0.2%, and 0.3% in a mass ratio related to the dry soil mass. The specimens were compacted by means of the standard or modified Proctor method at the optimum water content. The hydraulically bound specimens were tested immediately after compaction or after 7 or 28 days of curing. The samples were tested unloaded (immediately after compaction) or loaded at 2.44 kPa.
The gravelly sand without any improvement showed relatively high CBR values, which were higher under the minimum load of 2.44 kPa than unloaded. These values are 25.9–37.0% and 56.4–90.2% for the standard and modified Proctor compaction methods, respectively. Higher CBR values were obtained for sample I, which was characterized by a slightly better particle size distribution (higher values of graining coefficients, CU and CC) and, hence, a higher density after compaction. The addition of 0.1% polypropylene fibers caused an almost 2-fold increase in the CBR value of the samples compacted using the standard method. Increasing the amount of fibers to 0.2 and 0.3% reduced the CBR value to the value obtained without the addition of fibers. The addition of 0.1% fibers to the samples compacted using the modified method resulted in an approximate 10% decrease in the CBR value, and the increase in the amount of fibers to 0.2 and 0.3%—further resulted in a slight decrease in the CBR value. A reduction in the CBR value after the addition of the fibers occurred despite the improvement in the compaction of the reinforced sand (see Table 1).
The results of the non-cohesive soil reinforced with fibers differ from those of previous tests of the shear strength of reinforced granular soils [30], where good reinforcement results were achieved; however, Yetimoglu and Salbas [40] also found a decrease in the strength of sand with the addition of fibers, especially under higher stress. They found that the reinforcement changed the brittle medium into a more plastic one. An improvement in mechanical properties with an increase in fiber addition was observed in [41] in the case of CBR results; however, these results were found for reinforced clayey soil.
The addition of cement in the amount of 1.5% to the gravelly sand improved the CBR values of the cured samples, achieving the values of 68.1–143.9% and 150.9–171.3% for the standard compaction and 82.7–198.7% and 183.6–281.0% for the modified ones after 7 and 28 days of sample curing, respectively. The samples with the cement addition, tested directly after compaction, generally obtained lower CBR values than those without the cement addition. The 0.3% addition of fibers to the cement-stabilized samples improved their CBR values immediately after compaction and after curing for 7 and 28 days. The improvement depended on the duration of the sample curing and the compaction method—in the case of a sample compacted using the standard method and tested directly after compaction, the increase in CBR was about 100%. With the time of curing, this increase reduced to about 50%. In the case of samples compacted using the modified method, this increase reduced from about 50% to 4% after sample curing.
The increase in the CBR value after the addition of a hydraulic stabilizer is well-documented in the literature, mainly for lime-stabilized cohesive soils [42]. Cement-stabilized clayey soil with polypropylene fibers was tested by Tang et al. [43]. They stated that increasing the fiber content could weaken the brittle behavior of cemented soil by increasing the peak axial stress and by decreasing the stiffness and the loss of the post-peak strength. Wang et al. [44] also stated that the fibers in lime-stabilized clay mainly acted on the ductility lifting thereof. The values of UCS of fiber-reinforced lime, and cement-stabilized clayey soil increase with an increase in the curing time [43,45].
Table 4 presents the results of the cyclic triaxial tests of the resilient modulus. The gravelly sand and the sand improved with cement and/or polypropylene fibers were tested. A set of samples was prepared for the tests in accordance with description in Table 1.
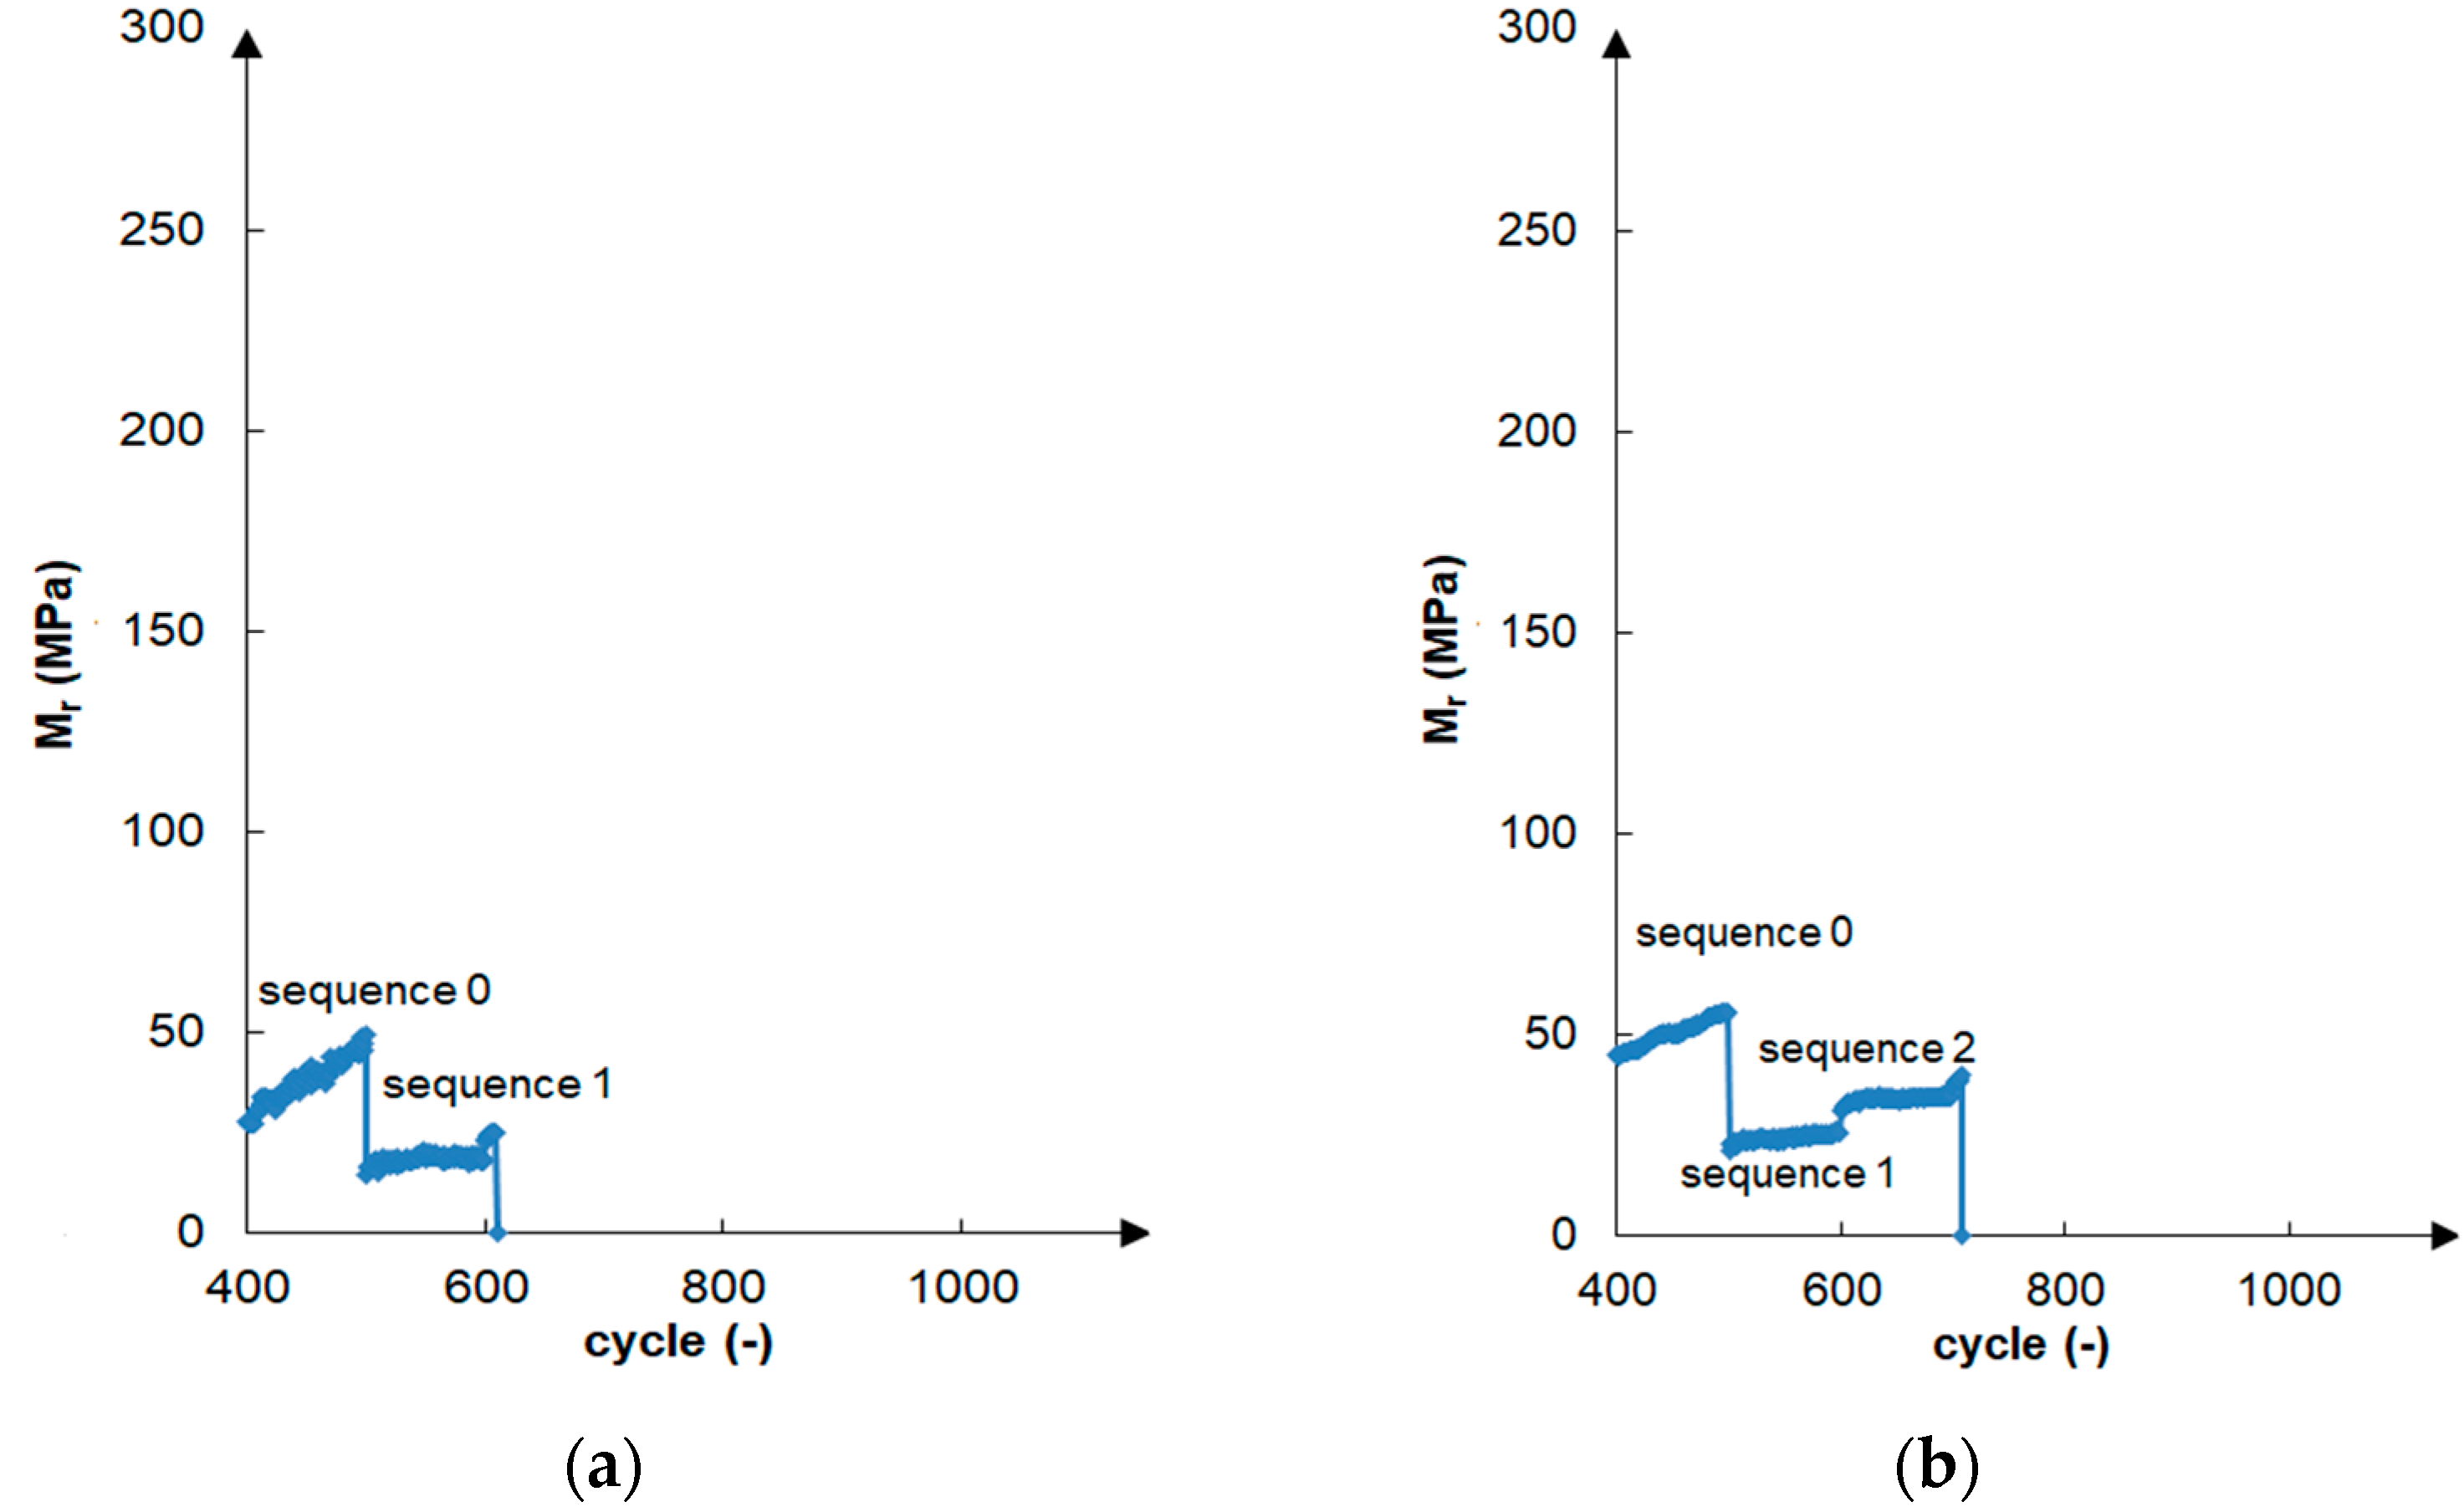
The resilient modulus values found for the unbound gravelly sand in all tests were zero for both the natural and fiber-reinforced soils. The specimen was damaged by shearing after only the first test sequence of about 600 cycles (Figure 6a). The soil fiber reinforcement enabled only one extra sequence of tests to be carried out and the extension of the test to approximately 700 load cycles (Figure 6b). Several tests did not allow for the determination of the M r value of the gravelly sand without the addition of cement, even after fiber reinforcement.
The cement additive had a significant impact on the increase in the resilient modulus value. The 1.5% cement addition significantly increased the soil resistance to cyclic loads. The resilient modulus increased from 0 to an average of 340 MPa after 28 days of curing. In the case of the gravelly sand, the soil compaction method was less important, as the results achieved for both compaction methods were similar, although they were generally higher for the specimens compacted using the modified method. For the stabilized samples after 28 days of curing, M r values equal to 245–349 MPa and 313–513 MPa were obtained for the standard and modified compaction methods, respectively. The effect of the curing time was noticeable, and a longer curing duration resulted in a generally higher M r . The exceptions were the samples compacted using the standard method with the addition of fibers, where extending the sample curing time from 7 to 28 days worsened the M r value. This phenomenon should be explored in the future by means of SEM image analyses. The samples stabilized with the 1.5% cement addition achieved resilient modulus values of 140–324 MPa after 7 days of curing and 245–513 MPa after 28 days of curing. Higher values were obtained for sample I, a soil with better graining and compaction. The addition of the fibers to the samples stabilized with 1.5% cement increased the M r value. Figure 6c presents a gravelly sand sample improved by the addition of fibers and cement and subjected to the resilient modulus test.
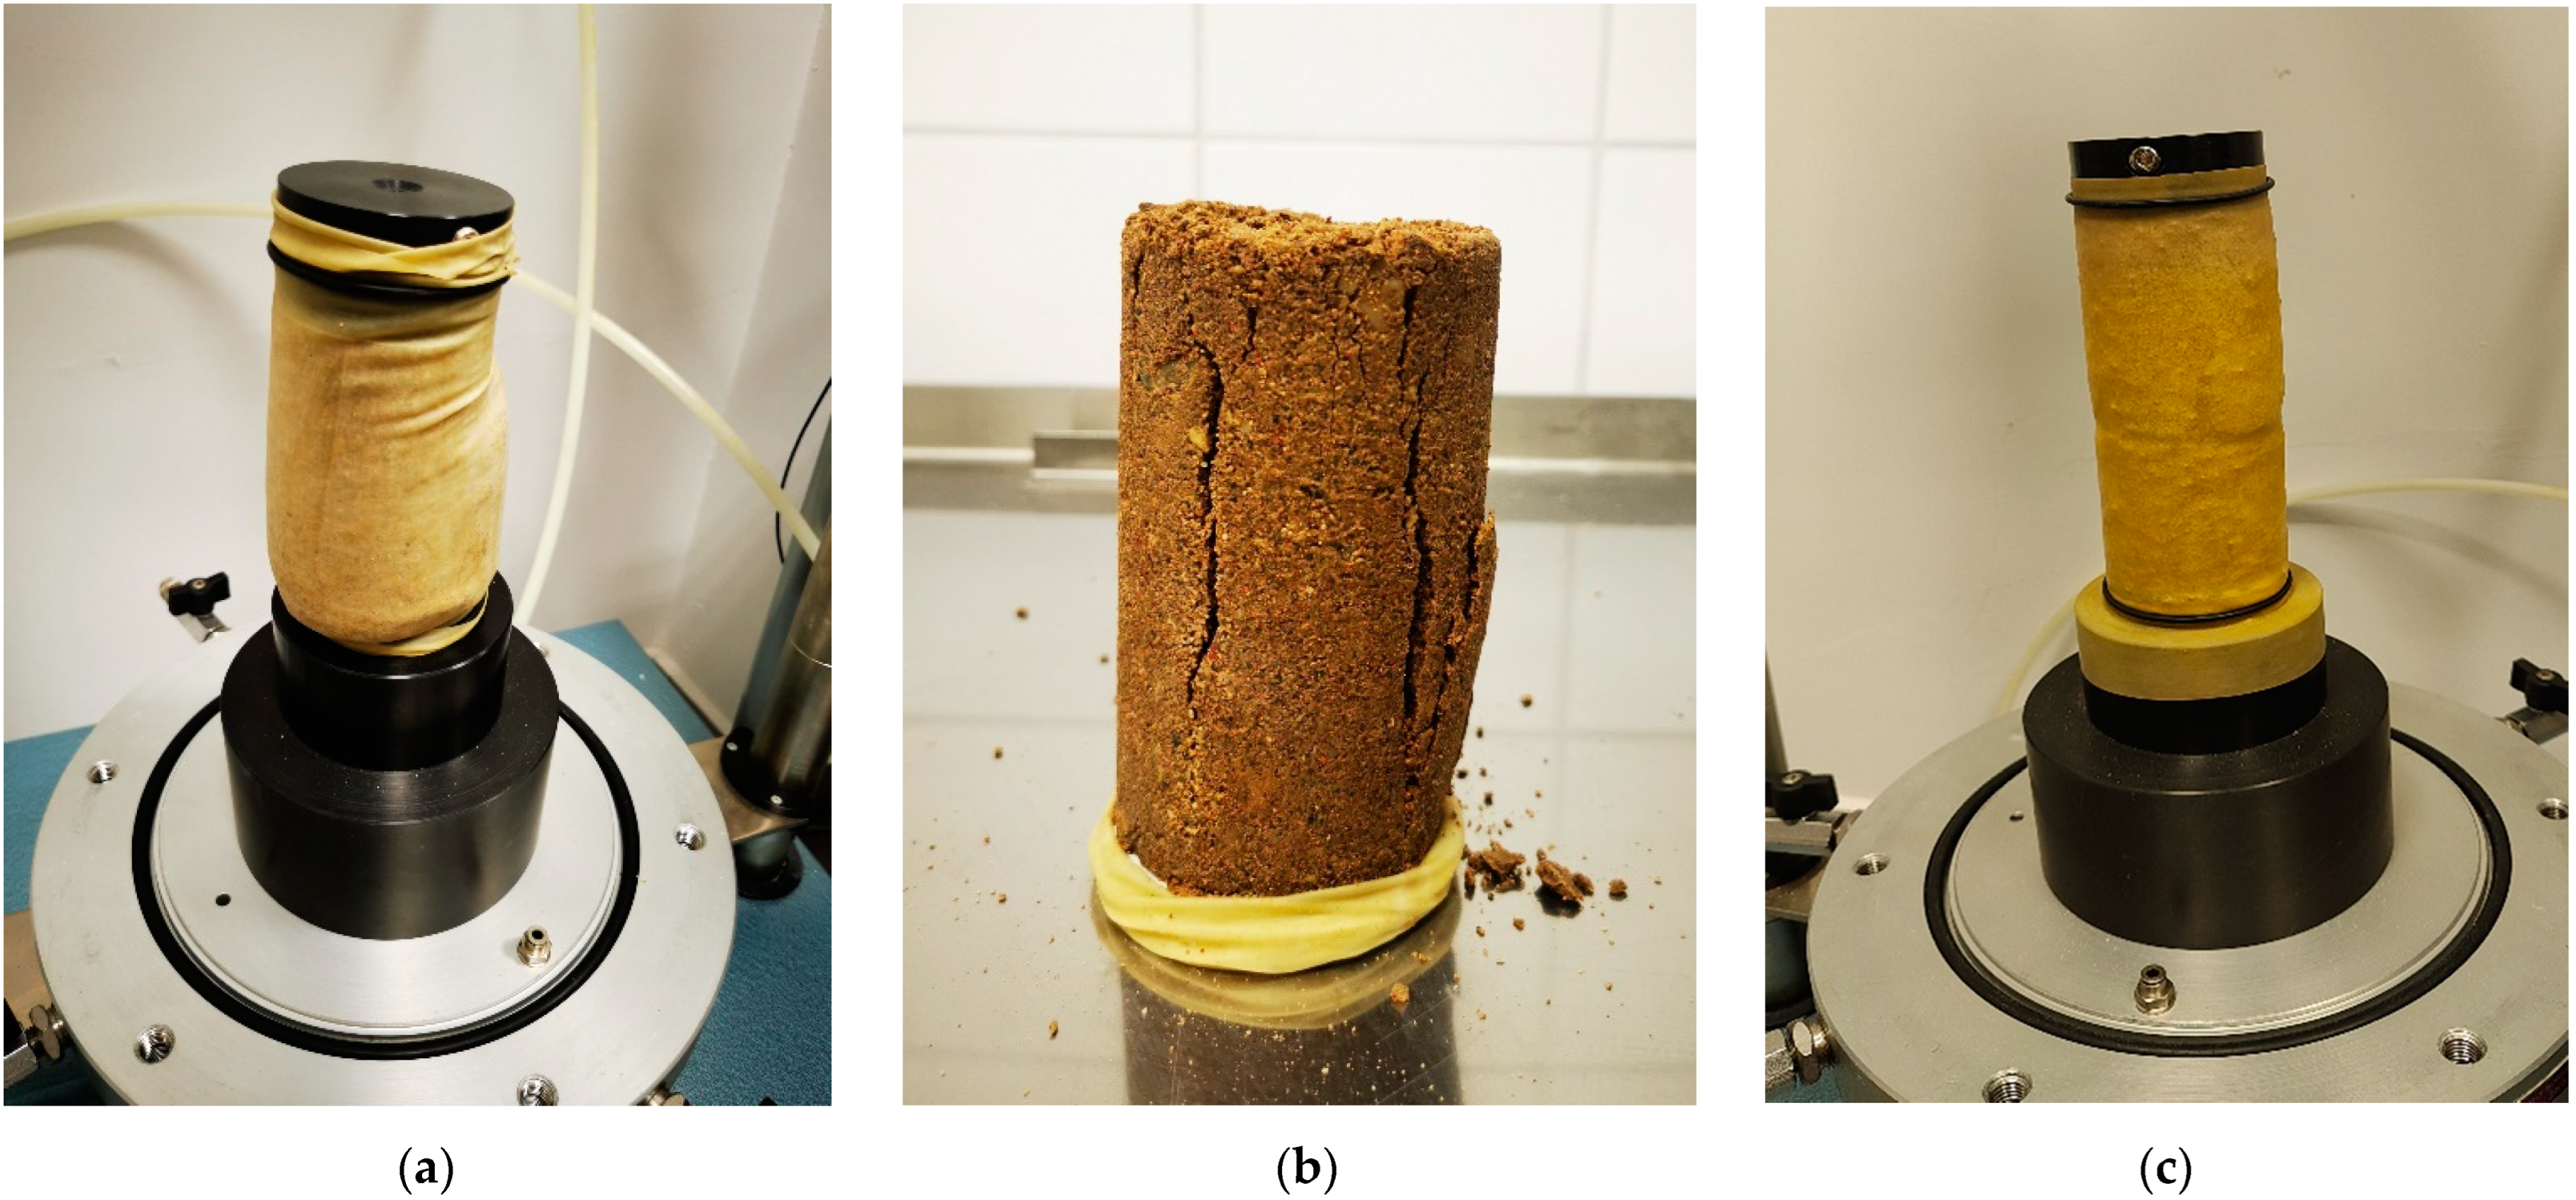
Figure 7 shows the different failure modes of the samples damaged during the resilient modulus test or after the cyclic test and quick shearing. The gravelly sand sample was sheared during the M r cyclic test, and it is characterized by the barreling mode with a single inclined failure plane (Figure 7a). After the M r test and quick shearing, the cement-bound soil failure mode was vertical through the failure plane (Figure 7b), as in the case of brittle material, whereas the plane of destruction in the soil sample improved by the cement and fiber addition was close to horizontal (Figure 7c). The horizontal failure plane indicates that the fiber-reinforced material entered its plastic zone. Both cement-stabilized samples were tested after seven days of curing.
The test results indicate a positive impact of the cement addition and the hardening time on the cyclic resistance of non-cohesive soil. In the case of cement-stabilized cohesive soils, an increase in the M r value has also been found after adding cement and extending the curing time [46,47], as in the case of lime-stabilized cohesive soils [48]. However, the resilient response of cohesive soils treated with lime is visible directly after sample preparation for uncured soils [49]. The fiber reinforcement of lime-treated cohesive soil has also been found to improve the M r value [50].
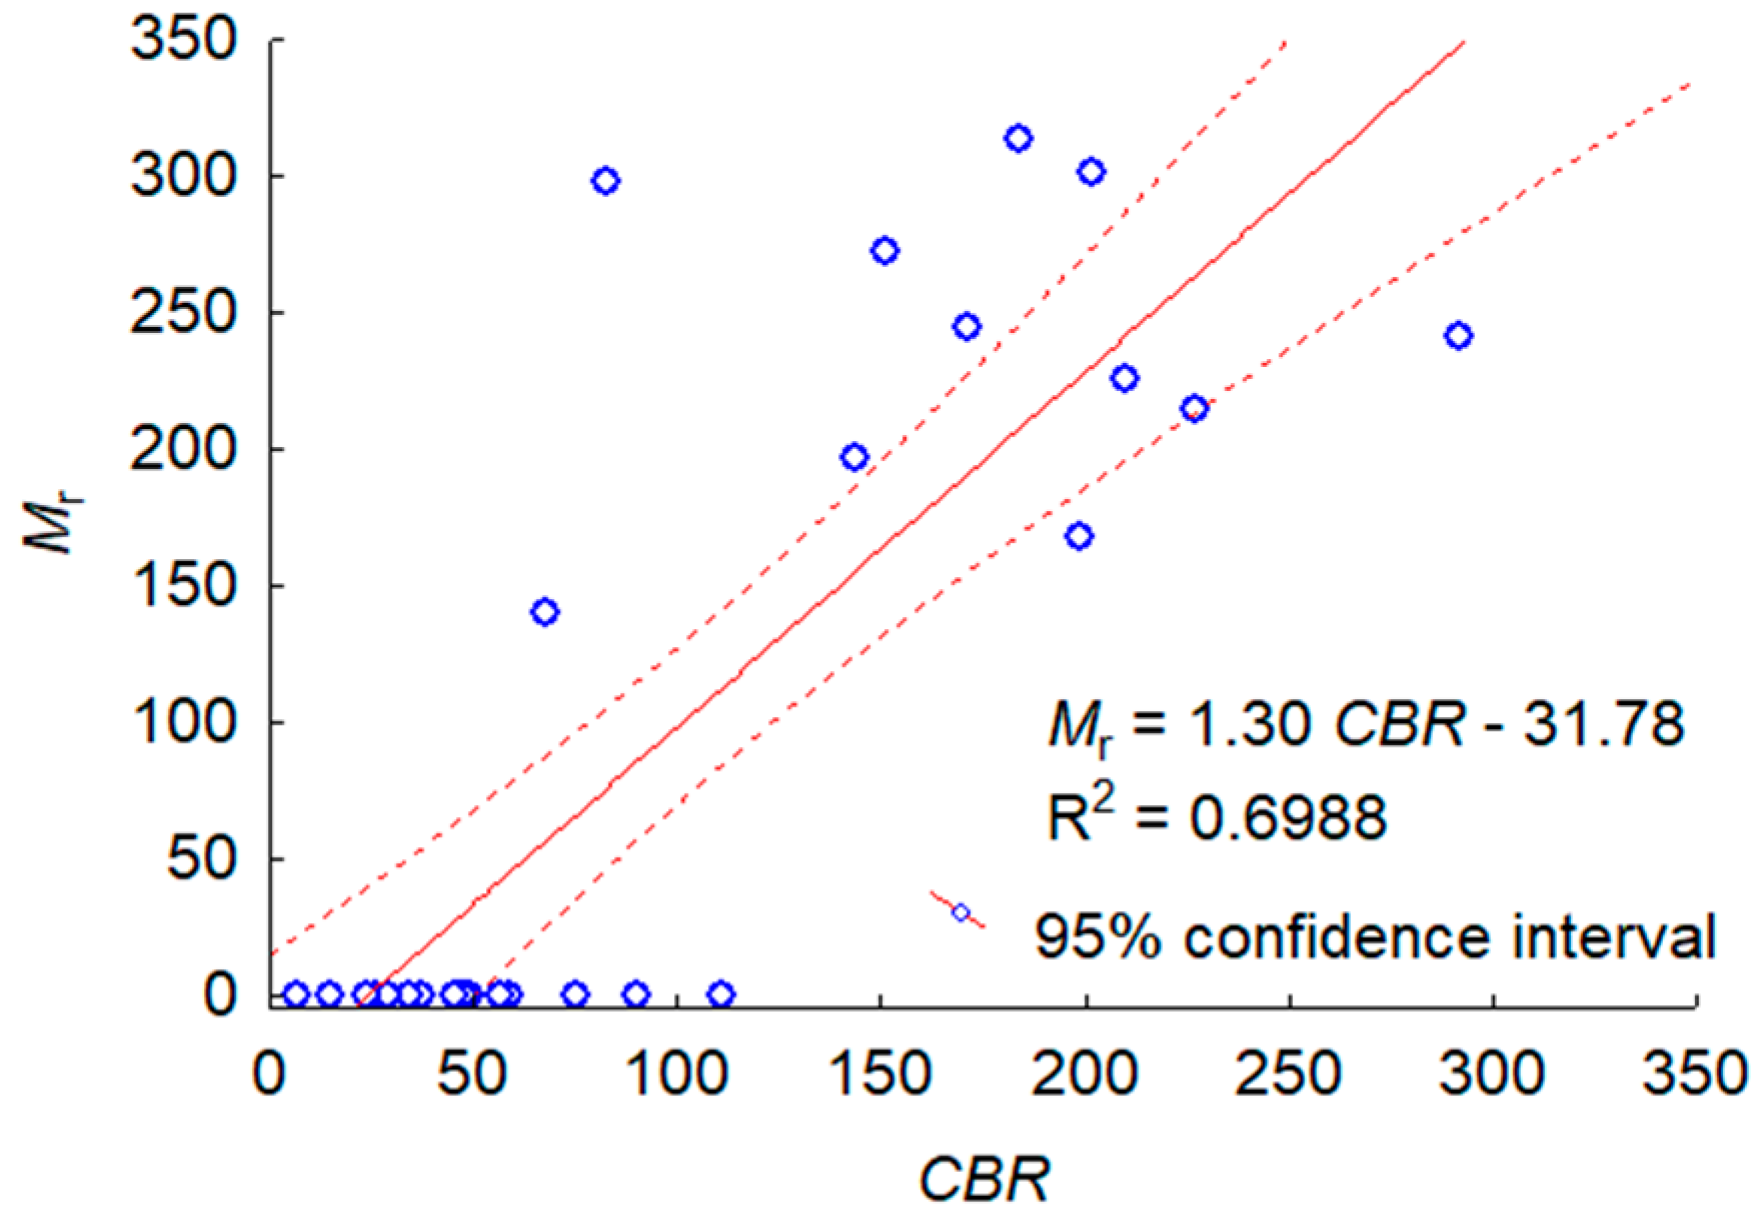
Figure 8 illustrates the statistical dependence of M r on CBR found for bound and unbound gravelly sand, as a dependence of the cyclic and static material stiffness, for the different prepared specimens. For all test results, the statistically valid relationship of M r = f ( C B R ) was found, where the coefficient of determination R2 = 0.6988, and the standard error of estimate SEE = 73.23 MPa. Equation M r = 1.30   C B R 31.78 explains 69.9% of the variance in the value of the M r statistic for the whole data set. As the M r value of the unbound samples was zero regardless of the compaction method and the addition of dispersed reinforcement, which had a significant impact on the CBR value, it was decided to investigate the dependence of M r on CBR with the exclusion of these points. Once these points were excluded, a statistically invalid relationship of M r = 0.31   C B R + 180.57 was found, where the coefficient of determination R2 = 0.1145, and the standard error of estimate SEE = 62.06 MPa.
The relationship of M r = f ( C B R ) found for all data sets, although assessed as being statistically significant, is not useful from an engineering point of view due to its large standard error of estimate, because M r = 1.30   C B R 31.78 ± 73.23   MPa . Overall, the unbound gravelly sand as a poorly graded material is non-resistant to cyclical interactions regardless of the compaction method. The fines content, (fC) interpreted according to ASTM D653 [51] as soil content with a grain size of less than 0.075 mm, was equal to zero for the tested sand. The lack of fines caused a complete lack of coherence between the grains and the damage by shearing at the beginning of the cyclic test. The resistance to cyclic interactions was not significantly improved, even after the addition of the polypropylene fibers as dispersive reinforcement. For gravelly sand with a lack of fines, the formula M r = f ( C B R ) should not be used.
The relationship of M r = f ( C B R ) found for the bound samples with the 1.5% cement addition is statistically invalid, i.e., cyclic and static material stiffnesses are independent, so M r = f ( C B R ) should also not be used.
It should be noted that Reference [52] found low M r values (but non-zero values) for compacted coarse granular material, but AASHTO T307 standard [7] procedure was not used. The test was limited to 300 cycles, which could certainly affect the test result. In the authors research, gravelly sand could not be damaged by up to about 600 load cycles (Figure 6a). The medium to well-graded crushed limestone aggregates were characterized by high values of M r , greater for material with better graining [20]. The crushed gravel exhibited resistance to cyclic loading assessed using a summary of resilient modulus values taking into account modeled values based on the regulations of the National Cooperative Highway Research Program [53].

4. Conclusions

Based on the test results of compacted gravelly sand in a natural state and that improved by the addition of polypropylene fibers and/or cement, the following conclusions were drawn:
  • The gravelly sand, characterized by a lack of fines and compacted at the optimum water content to the maximum dry density, was sheared during the resilient modulus test after about 600 cycles of loading regardless of whether the standard or modified compaction method was used. The fiber reinforcement of the gravelly sand slightly improved cyclic resistance, but the samples were sheared after about 700 loading cycles. A resilient modulus value could not be achieved for the unbound gravelly sand.
  • The 1.5% cement addition increased the resilient modulus of the gravelly sand, which was 140–324 MPa after 7 days of curing and 245–513 MPa after 28 days of curing. Therefore, the curing time also impacted the resilient modulus value. The addition of fibers to the gravelly sand stabilized with 1.5% cement increased M r but changed the material behavior at failure from brittle to plastic.
  • The gravelly sand revealed high CBR values: 25.9–37.0% and 56.4–90.2% for the standard and modified compaction methods, respectively. An addition of 0.1% fibers doubled the CBR values of the samples compacted using the standard method; however, increasing the addition to 0.2 and 0.3% reduced the CBR value to the value found for the samples without fibers. The addition of 0.1% fibers to the modified compacted samples resulted in an approx. 10% decrease in the CBR value, and the increase in the fibers to 0.2 and 0.3% resulted in further minor drops in the CBR value. The reduction in the sand stiffness may have been caused by its plasticization upon the addition of the fibers.
  • The addition of 1.5% cement improved the CBR value of the gravelly sand, with the values reaching 68.1–143.9% and 150.9–171.3% for the standard compaction and 82.7–198.7% and 183.6–281.0% for the modified compaction after 7 and 28 days of curing, respectively. The addition of 0.3% fibers to the cement-stabilized soil improved its CBR value directly after compaction and curing, which depended on the duration of the curing time and the compaction method used.
  • Even though the obtained relationship of M r = f ( C B R ) , found for all data sets, was evaluated as being statistically significant, it is not efficient from an engineering point of view. The unbound gravelly sand was non-resistant to cyclic loading regardless of the compaction method used. The above dependency of the bound samples is statistically invalid, i.e., cyclic and static material stiffnesses are quite independent. In the authors’ opinion, the CBR and resilient modulus values should not be compared due to the various ways of loading samples during tests—static and cyclic loading dependent on the stress state, especially in the case of non-cohesive materials.

Author Contributions

Conceptualization, K.Z.-A.; methodology, K.Z.-A., P.D. and M.W.; validation, P.D. and M.W.; formal analysis, K.Z.-A.; investigation, P.D. and M.W.; resources, K.Z.-A.; writing—original draft preparation, K.Z.-A. and P.D.; writing—review and editing, K.Z.-A. and M.W.; visualization, P.D.; supervision, K.Z.-A. and M.W.; funding acquisition, P.D. All authors have read and agreed to the published version of the manuscript.

Funding

The printing of the article was financed by the ZIREG project—Integrated Program of the Bialystok University of Technology for Regional Development, contract no. POWR.03.05.00-00-ZR22/18. This project was co-financed by the European Union from the European Social Fund under the Knowledge Education Development Operational Program 2014–2020.

Institutional Review Board Statement

Not applicable.

Informed Consent Statement

Not applicable.

Data Availability Statement

The data presented in this study are available on request from the corresponding authors.

Acknowledgments

The investigations were conducted at Bialystok University of Technology in Poland under the grant numbers: WZ/WB-IIL/5/2020 and WI/WB-IIL/6/2020. The authors gratefully acknowledge the assistance and cooperation of S.D. Sztabinski, who participated in the laboratory tests.

Conflicts of Interest

The authors declare no conflict of interest.

References

  1. Brown, S.F. Soil mechanics in pavement engineering. Gėotechnique 1996, 46, 383–426. [Google Scholar] [CrossRef] [Green Version]
  2. Hveem, F.N. Pavement deflections and fatigue failures. Highw. Res. Board Bull. 1955, 55, 43–87. [Google Scholar]
  3. Seed, H.B.; Chan, C.K.; Lee, C.E. Resilience characteristics of subgrade soils and their relation to fatigue failures in asphalt pavements. In Proceedings of the 1st Int. Conf. on the Structural Design of Asphalt Pavements, Ann Arbor, MI, USA, 20–24 August 1962. [Google Scholar]
  4. Seed, H.B.; Mitry, G.; Monismith, C.L.; Chan, C.K. Factors influencing the resilient deformations of untreated aggregate base in two-layer pavements subjected to repeated loading. Highw. Res. Rec. 1967, 190, 19–57. [Google Scholar]
  5. AASHTO T 307-99; Standard Method of Test for Determining the Resilient Modulus of Soils and Aggregate Materials. American Association of State and Highway Transportation Officials: Washington, DC, USA, 2021.
  6. EN 13286-7:2004; Unbound and Hydraulically Bound Mixtures-Part 7: Cyclic Load Triaxial Test for Unbound Mixture. European Committee for Standardization: Brussels, Belgium, 2003.
  7. Lekarp, F.; Isacsson, U.; Dawson, A. State of the art. I: Resilient response of unbound aggregates. J. Transp. Eng. 2000, 126, 66–75. [Google Scholar] [CrossRef] [Green Version]
  8. Hicks, R.G.; Monismith, C.L. Factors influencing the resilient response of granular materials. High. Res. Rec. 1971, 345, 15–31. [Google Scholar]
  9. Rada, C.; Witczak, W.M. Comprehensive evaluation of laboratory resilient moduli results for granular material. Transp. Res. Rec. 1981, 810, 23–33. [Google Scholar]
  10. Ng, C.W.W.; Zhou, C.; Yuan, Q.; Xu, J. Resilient modulus of unsaturated subgrade soil: Experimental and theoretical investigations. Can. Geotech. J. 2013, 50, 223–232. [Google Scholar] [CrossRef]
  11. Samb, F.; Fall, M.; Berthaud, Y.; Bâ, M. Resilient modulus of compacted lateritic soils from Senegal at OPM conditions. Geomaterials 2013, 3, 165–171. [Google Scholar] [CrossRef] [Green Version]
  12. Tang, L.; Yan, M.H.; Ling, X.Z.; Tian, S. Dynamic behaviours of railway’s base course materials subjected to long-term low-level cyclic loading: Experimental study and empirical model. Géotechnique 2017, 67, 537–545. [Google Scholar] [CrossRef]
  13. Tanimoto, K.; Nishi, M. On resilient characteristics of some soils under repeated loading. Soils Found. 1970, 10, 75–92. [Google Scholar] [CrossRef] [Green Version]
  14. Kim, D.; Kim, J.R. Resilient behavior of compacted subgrade soils under the repeated triaxial test. Constr. Build. Mat. 2007, 21, 1470–1479. [Google Scholar] [CrossRef]
  15. Sas, W.; Głuchowski, A.; Gabryś, K.; Soból, E.; Szymański, A. Long-term cyclic loading impact on the creep deformation mechanism in cohesive materials. Appl. Sci. 2017, 7, 370. [Google Scholar] [CrossRef] [Green Version]
  16. Jastrzębska, M.; Tokarz, K. Strength characteristics of clay–rubber waste mixtures in low-frequency cyclic triaxial tests. Minerals 2021, 11, 315. [Google Scholar] [CrossRef]
  17. Thakur, P.K.; Vinod, J.S.; Indraratna, B. Effect of confining pressure and frequency on the deformation of balast. Géotechnique 2013, 63, 786–790. [Google Scholar] [CrossRef]
  18. Zhang, J.; Peng, J.; Liu, W.; Lu, W. Predicting resilient modulus of fine-grained subgrade soils considering relative compaction and matric suction. Road Mater. Pavement Des. 2019, 22, 702–715. [Google Scholar] [CrossRef]
  19. Li, J.; Qubain, B.S. Resilient modulus variations with water content. In Resilient Modulus Testing for Pavement Components, ASTM STP 1437; Durham, G.N., Marr, W.A., Eds.; ASTM International: West Conshohocken, PA, USA, 2003; pp. 59–69. [Google Scholar]
  20. Arshad, M. Development of a correlation between the resilient modulus and cbr value for granular blends containing natural aggregates and RAP/RCA materials. Adv. Mater. Sci. Eng. 2019, 2019, 8238904. [Google Scholar] [CrossRef] [Green Version]
  21. Zabielska-Adamska, K.; Sulewska, M.J. Dynamic CBR test to assess the soil compaction. J. Test. Eval. 2015, 53, 1028–1036. [Google Scholar] [CrossRef]
  22. Zabielska-Adamska, K. Characteristics of compacted fly ash as a transitional soil. Materials 2020, 13, 1387. [Google Scholar] [CrossRef] [Green Version]
  23. Heukelom, W.; Klomp, A.J.G. Dynamic testing as a means of controlling pavement during and after construction. In Proceedings of the International Conference on the Structural Design of Asphalt Pavements, Ann Arbor, MI, USA, 20–24 August 1962; pp. 667–679. [Google Scholar]
  24. Dione, A.; Fall, M.; Berthaud, Y.; Benboudjema, F.; Michou, A. Implementation of resilient modulus-CBR relationship in mechanistic-empirical (M-E) pavement design. Sci. Appl. l’Ingénieur 2015, 1, 65–71. [Google Scholar]
  25. Farrell, E.R.; Orr, T.L. Discussion: An analysis of the California bearing ratio test in saturated clays D. W. Hight and M. G. H. Stevens. Géotechnique 1984, 34, 129–130. [Google Scholar] [CrossRef]
  26. Razouki, S.S.; Ibrahim, A.N. Improving the resilient modulus of a gypsum sand roadbed soil by increased compaction. Int. J. Pavement Eng. 2019, 20, 432–438. [Google Scholar] [CrossRef]
  27. Edil, T.; Acosta, H.A.; Benson, C.H. Stabilizing soft fine-grained soils with fly ash. J. Mater. Civ. Eng. 2006, 18, 283–294. [Google Scholar] [CrossRef]
  28. Zabielska-Adamska, K.; Wasil, M.; Dobrzycki, P. Resilient response of cement-treated coarse post-glacial soil to cyclic load. Materials 2021, 14, 6495. [Google Scholar] [CrossRef]
  29. Dobrzycki, P.; Zabielska-Adamska, K.; Wasil, M. Resilient modulus as a technical parameter for evaluating the cement-stabilized soil. In Proceedings of the 5th International Conference on New Developments in Soil Mechanics and Geotechnical Engineering, Nicosia, Cyprus, 30 June–2 July 2022. [Google Scholar]
  30. Michalowski, R.L.; Čermák, J. Triaxial compression of sand reinforced with fibers. J. Geotech. Geoenviron. Eng. 2003, 129, 125–136. [Google Scholar] [CrossRef]
  31. EN 933-1:2012; Tests for Geometrical Properties of Aggregates-Part 1: Determination of Particle Size Distribution-Sieving Method. European Committee for Standardization: Brussels, Belgium, 2012.
  32. EN ISO 14688-1:2018; Geotechnical Investigation and Testing. Identification and Classification of Soil. Identification and Description. ISO: Geneva, Switzerland, 2018.
  33. EN ISO 14688-2:2018-05; Geotechnical Investigation and Testing-Identification and Classification of Soil-Part 2: Principles for a Classification. ISO: Geneva, Switzerland, 2018.
  34. EN 13242:2007; Aggregates for Unbound and Hydraulically Bound Materials for Use in Civil Engineering Work and Road Construction. European Committee for Standardization: Brussels, Belgium, 2007.
  35. ASTM D1241-15; Standard Specification for Materials for Soil-Aggregate Subbase, Base, and Surface Courses. ASTM International: West Conshohocken, PA, USA, 2020.
  36. Patakiewicz, M.A.; Zabielska-Adamska, K. Crushing of non-cohesive soil grains under dynamic loading. Procedia Eng. 2017, 189, 80–85. [Google Scholar] [CrossRef]
  37. EN 13286-2:2010; Unbound and Hydraulically Bound Mixtures-Part 2: Test Methods for Laboratory Reference Density and Water Content-Proctor Compaction. European Committee for Standardization: Brussels, Belgium, 2010.
  38. ASTM D1883-21; Standard Test Method for CBR (California Bearing Ratio) of Laboratory-Compacted Soils. ASTM International: West Conshohocken, PA, USA, 2021.
  39. EN 13286-47:2007; Unbound and Hydraulically Bound Mixtures-Part 47: Test Method for the Determination of California Bearing Ratio, Immediate Bearing Index and Linear Swelling. European Committee for Standardization: Brussels, Belgium, 2007.
  40. Yetimoglu, T.; Salbas, O. A study on shear strength of sands reinforced with randomly distributed discrete fibers. Geotext. Geomembr. 2003, 21, 103–110. [Google Scholar] [CrossRef]
  41. Hassan, H.J.A.; Rasul, J.; Samin, M. Effects of plastic waste materials on geotechnical properties of clayey soil. Transp. Infrastruct. Geotechnol. 2021, 8, 390–413. [Google Scholar] [CrossRef]
  42. Manasseh, J.; Ejelikwu, J. Soil modification and stabilization potential of calcium carbide waste. Adv. Mater. Res. 2013, 824, 29–36. [Google Scholar] [CrossRef]
  43. Tang, C.; Shi, B.; Gao, W.; Chen, F.; Cai, Y. Strength and mechanical behavior of short polypropylene fiber reinforced and cement stabilized clayey soil. Geotext. Geomembr. 2007, 25, 194–202. [Google Scholar] [CrossRef]
  44. Wang, W.; Lv, B.; Zhang, C.; Li, N.; Pu, S. Mechanical characteristics of lime-treated subgrade soil improved by polypropylene fiber and class F fly ash. Polymers 2022, 14, 2921. [Google Scholar] [CrossRef]
  45. Chen, M.; Shen, S.-L.; Arulrajah, A.; Wu, H.-N.; Hou, D.-W.; Xu, Y.-S. Laboratory evaluation on the effectiveness of polypropylene fibers on the strength of fiber-reinforced and cement-stabilized Shanghai soft clay. Geotext. Geomembr. 2015, 43, 515–523. [Google Scholar] [CrossRef]
  46. Ismail, A.; Baghini, M.S.; Karim, M.R.B.; Shokri, F.; Al-Mansob, R.A.; Firoozi, A.A.; Firoozi, A.A. Laboratory investigation on the strength characteristics of cement-treated base. Appl. Mech. Mater. 2014, 507, 353–360. [Google Scholar] [CrossRef]
  47. Hanifa, K.; Abu-Farsakh, M.Y.; Gautreau, G.P. Design Values of Resilient Modulus for Stabilized and Non-Stabilized Base; Report No. FHWA/LA.14/521; Louisiana Department of Transportation and Development: Baton Rouge, LA, USA, 2015. [Google Scholar]
  48. Bhuvaneshwari, S.; Robinson, R.G.; Gandhi, S.R. Resilient modulus of lime treated expansive soil. Geotech. Geol. Eng. 2019, 37, 305–315. [Google Scholar] [CrossRef]
  49. Robnett, Q.L.; Thompson, M.R. Effect of lime treatment on the resilient behavior of fine-grained soils. Transp. Res. Rec. 1976, 560, 11–20. [Google Scholar]
  50. Al-Mahbashi, A.M.; Al-Shamrani, M.A.; Moghal, A.A.B.; Vydehi, K.V. Correlation-based studies on resilient modulus values for fiber-reinforced lime-blended clay. Int. J. Geosynth. Grd. Eng. 2021, 7, 59. [Google Scholar] [CrossRef]
  51. ASTM D2487-17; Standard Practice for Classification of Soils for Engineering Purposes (Unified Soil Classification System). ASTM International: West Conshohocken, PA, USA, 2017.
  52. Pierre, P.; Bilodeau, J.-P.; Légère, G.; Doré, G. Laboratory study on the relative performance oftreated granular materials used for unpaved roads. Can. J. Civ. Eng. 2008, 35, 624–634. [Google Scholar] [CrossRef]
  53. Camargoa, F.F.; Wenb, H.; Edil, T.; Son, Y.-H. Comparative assessment of crushed aggregates and bound/unbound recycled asphalt pavement as base materials. Int. J. Pavement Eng. 2013, 14, 223–230. [Google Scholar] [CrossRef]
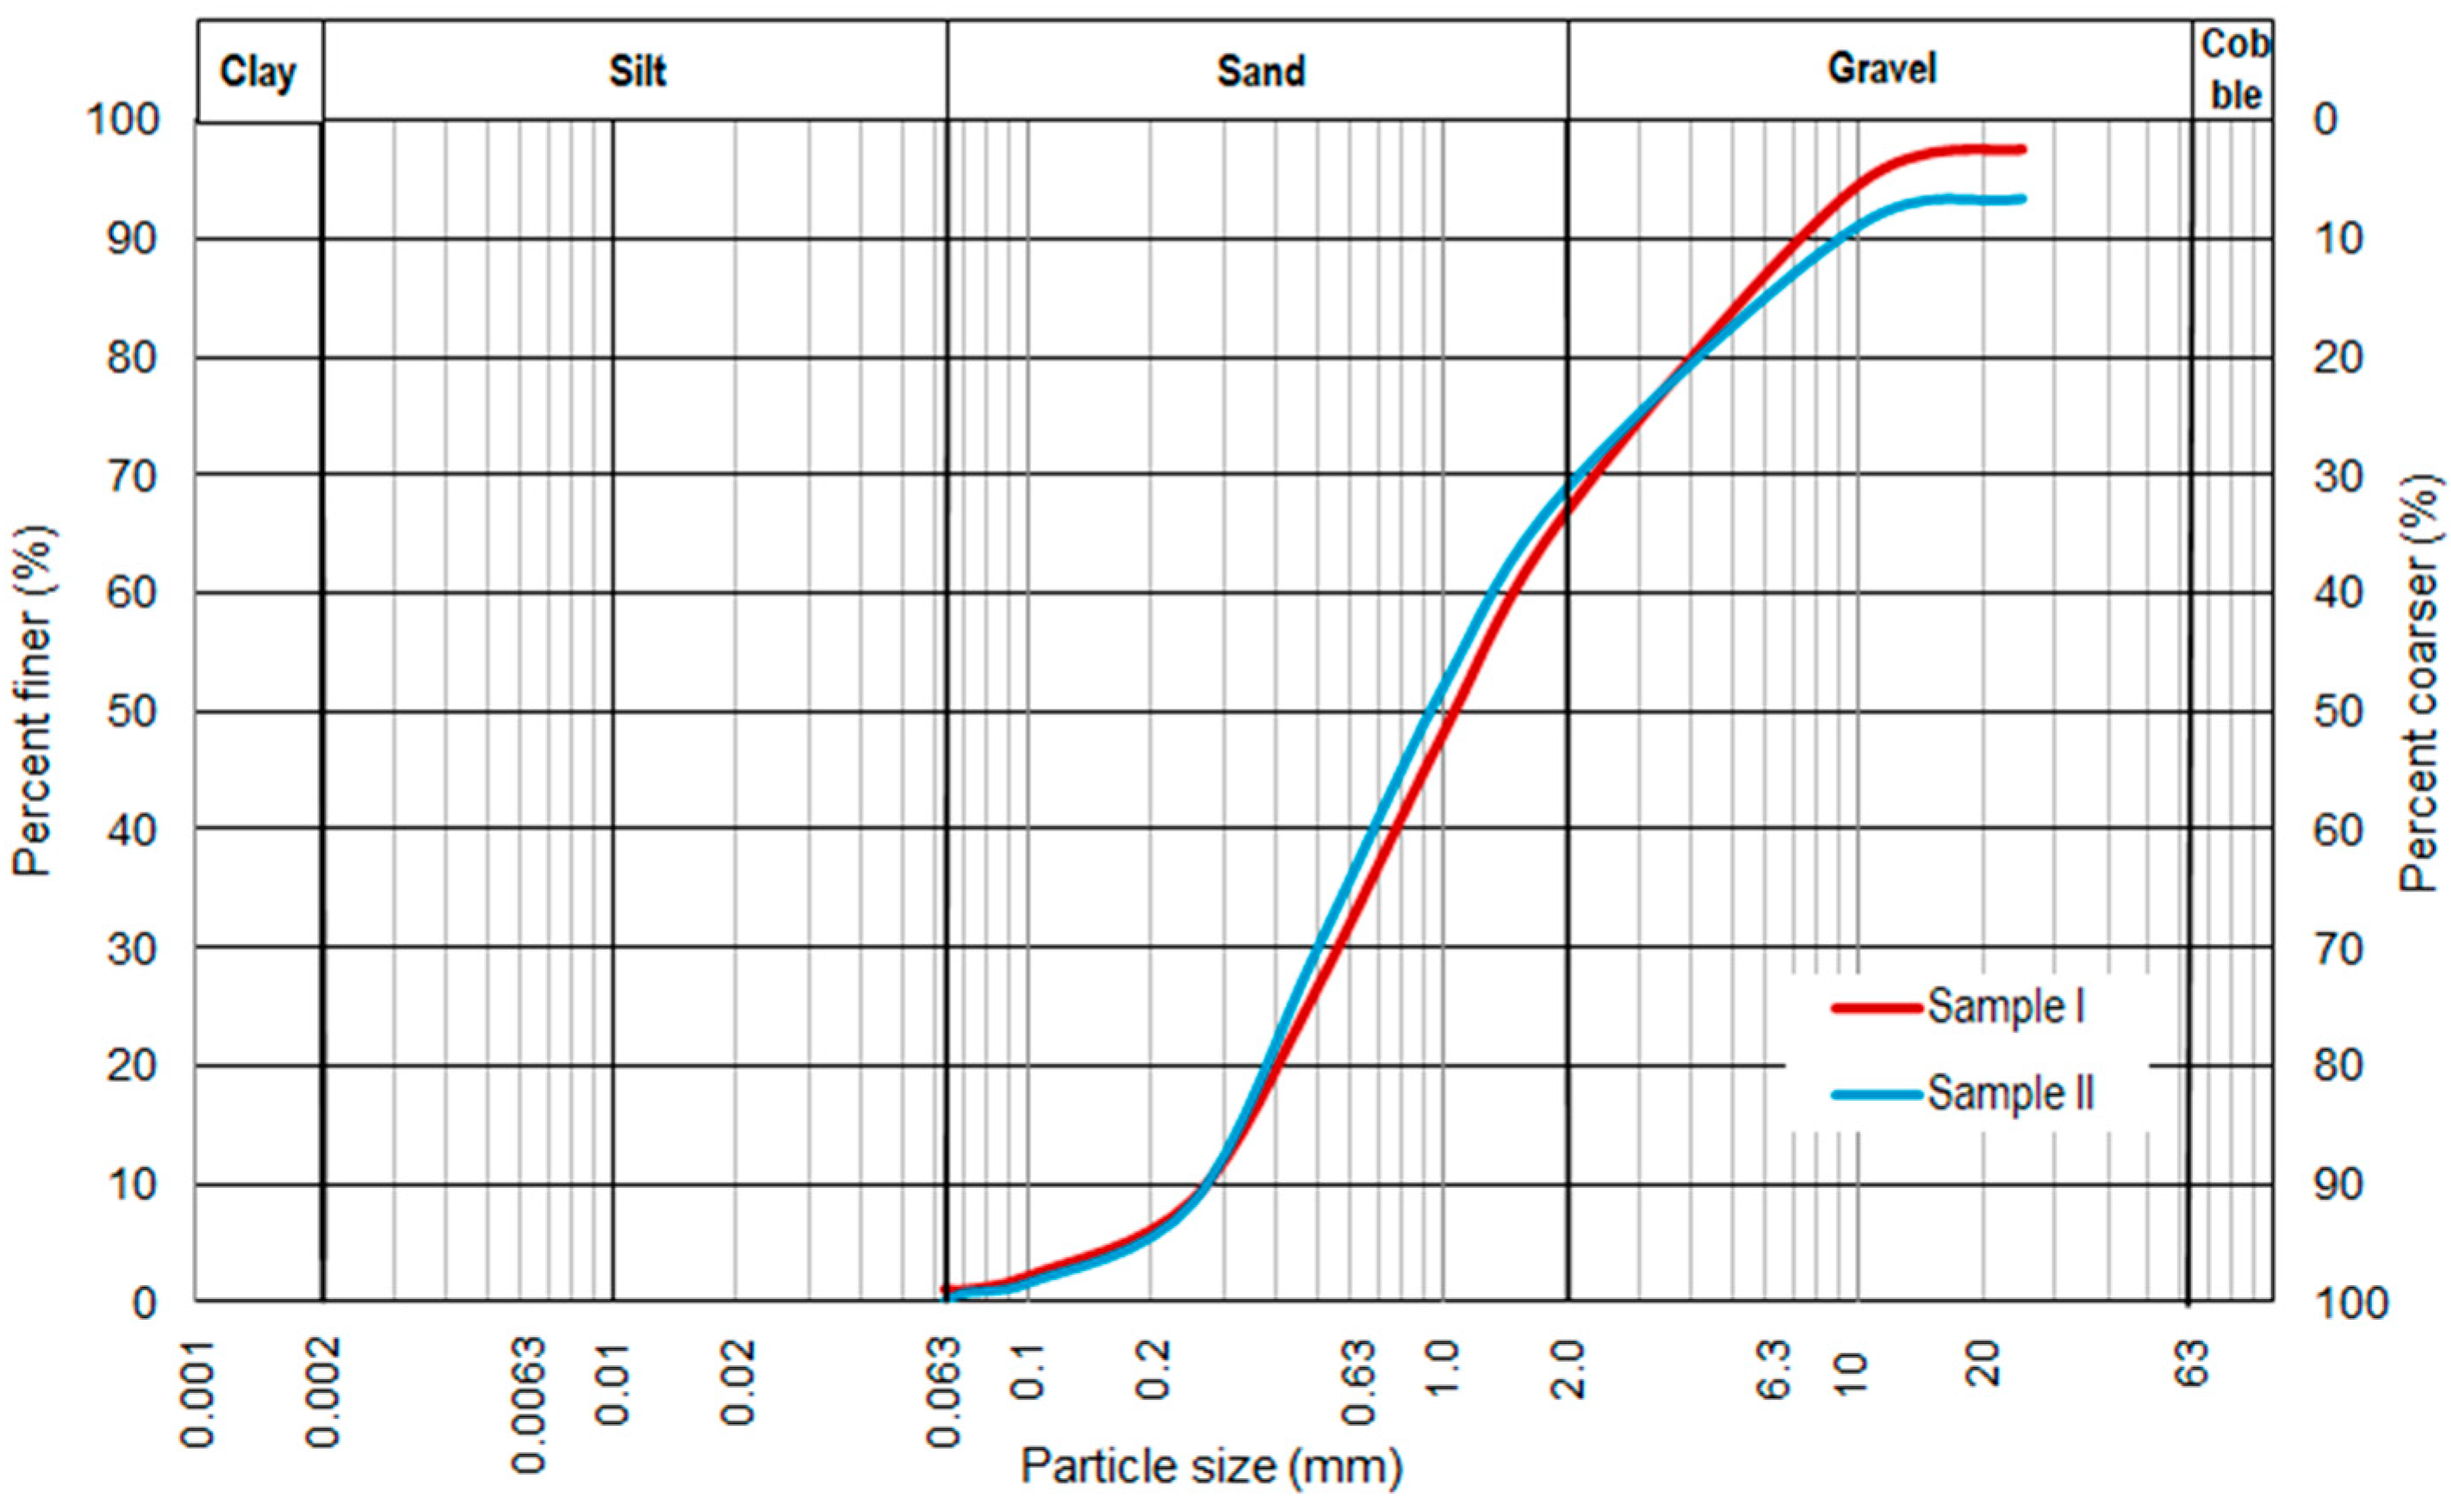
Figure 1. Grain-size distribution curves for research samples of non-cohesive soil.
Materials 16 00417 g001
Figure 2. Compaction curves obtained using the standard Proctor (SP) and modified Proctor (MP) methods for research samples I and II.
Materials 16 00417 g002
Figure 3. The 18 mm-long polypropylene fibers added at mass ratios of 0.1%, 0.2%, and 0.3% to the dry mass of the compacted soil.
Materials 16 00417 g003
Figure 4. Image of a loaded sample prior to the test: (a) in the CBR mold, (b) in the chamber of the cyclic triaxial apparatus.
Materials 16 00417 g004
Figure 5. Image of a sample (grSa + 1.5C + 0.3%F 18 mm) compacted via SP method: (a) sample directly after compaction, (b) magnification of the sample with a visible homogeneous distribution of reinforcement.
Materials 16 00417 g005
Figure 6. Variations in resilient modulus for the following samples: (a) grSa compacted via the SP method damaged in sequence “1”, (b) grSa + 0.2%F 18 mm compacted via the SP method damaged in sequence “2”, (c) grSa + 1.5%C + 0.2%F 18 mm compacted via the SP method and cured for 7 days tested in all test cycles (see Table 2).
Materials 16 00417 g006aMaterials 16 00417 g006b
Figure 7. Typical failure modes of samples in the M r tests: (a) grSa compacted via SP method damaged during the M r test (sequence 1); (b) grSa + 1.5C compacted via MP method, cured for 7 days, after cyclic test and quick shearing; (c) grSa + 1.5C + 0.3%F 18 mm compacted via SP method, cured for 7 days, after cyclic test and quick shearing.
Materials 16 00417 g007
Figure 8. M r values vs. CBR values obtained for all tests along with 95% confidence intervals.
Materials 16 00417 g008
Table 1. Geotechnical properties of tested materials.
Sample
Number
MaterialCompaction Methodρs
(g/cm3)
Standard ProctorModified Proctor
wopt
(%)
ρd max
(g/cm3)
e
(–)
wopt
(%)
ρd max
(g/cm3)
e
(–)
IgrSa9.002.0200.318.502.0850.272.65
grSa + 1.5%C8.902.1200.258.402.1300.252.66
IIgrSa9.701.9740.3410.002.0220.312.65
grSa + 0.1%F 18 mm9.802.0030.338.802.1040.272.65
grSa + 0.2%F 18 mm8.002.0540.307.502.1580.242.65
grSa + 0.3%F 18 mm7.702.0600.307.002.1600.242.65
grSa + 1.5%C9.502.0100.329.502.0700.292.66
grSa + 1.5%C + 0.2%F 18 mm7.902.0660.297.002.1830.232.66
grSa + 1.5%C + 0.3%F 18 mm8.002.0600.307.802.1240.262.66
C—cement addition, F—fiber addition.
Table 2. Examination sequences for base or subbase material [7].
Sequence NumberConfining Pressure
(kPa)
Max Applied
Axial Stress
(kPa)
Cyclic Stress
σ c y c l i c
(kPa)
Number
of Load
Applications
0103.4103.493.1500–1000
120.720.718.6100
220.741.437.3100
320.762.155.9100
434.534.531.0100
534.568.962.0100
634.5103.493.1100
768.968.962.0100
868.9137.9124.1100
968.9206.8186.1100
10103.468.962.0100
11103.4103.493.1100
12103.4206.8186.1100
13137.9103.493.1100
14137.9137.9124.1100
15137.9275.8248.2100
Table 3. California bearing ratio test results.
Sample NumberMaterialCuring Time
(Days)
CBR (%)
Standard ProctorModified Proctor
UnloadedLoaded
2.44 kPa
UnloadedLoaded
2.44 kPa
IgrSa029.537.071.990.2
grSa + 1.5%C07.114.8
7 68.1 82.7
28 171.3 183.6
IIgrSa019.425.952.756.4
grSa + 0.1%F 18 mm046.049.4
grSa + 0.2%F 18 mm034.247.8
grSa + 0.3%F 18 mm028.745.8
grSa + 1.5%C027.924.155.575.6
7 143.9 198.7
28 150.9 281.0
grSa + 1.5%C + 0.3%F 18 mm059.7111.3
7 202.1 210.2
28 227.3 290.7
Table 4. Resilient modulus test results.
Sample
Number
MaterialCuring Time (Days)Mr (MPa)
Standard ProctorModified
Proctor
IgrSa000
grSa + 1.5%C000
7324217
28349513
grSa + 1.5%C000
7140298
28245313
IIgrSa000
grSa + 0.1%F 18 mm000
grSa + 0.2%F 18 mm000
grSa + 0.3%F 18 mm000
grSa + 1.5%C000
7197168
28272353
grSa + 1.5%C + 0.2%F 18 mm000
7271215
28202230
grSa + 1.5%C + 0.3%F 18 mm000
7301226
28214241
Disclaimer/Publisher’s Note: The statements, opinions and data contained in all publications are solely those of the individual author(s) and contributor(s) and not of MDPI and/or the editor(s). MDPI and/or the editor(s) disclaim responsibility for any injury to people or property resulting from any ideas, methods, instructions or products referred to in the content.