Article

Effect of CO2 on the Desulfurization of Sintering Flue Gas with Hydrated Lime

1
State Key Laboratory of Advanced Special Steel & Shanghai Key Laboratory of Advanced Ferrometallurgy & School of Materials Science and Engineering, Shanghai University, Shanghai 200444, China
2
Ironmaking Plant, Shanghai Meishan Iron and Steel Co., Ltd., Nanjing 210039, China
*
Authors to whom correspondence should be addressed.
Materials 2023, 16(1), 303; https://doi.org/10.3390/ma16010303
Submission received: 2 November 2022 / Revised: 1 December 2022 / Accepted: 23 December 2022 / Published: 28 December 2022
(This article belongs to the Section Materials Chemistry)

Abstract

:
The effect of carbon dioxide (CO2) on the desulfurization of sintering flue gas with hydrate (Ca(OH)2) as an absorbent was investigated, and the formation of calcium carbonate (CaCO3) and its effect on the desulfurization was discussed. The competitive relationship between carbon dioxide (CO2) and sulfur dioxide (SO2) with the deacidification agent in sintering flue gas is discussed thermodynamically, showing that sulfates are more likely to be generated under high oxygen potential conditions and that SO2 reacts more preferentially than CO2 under a thermodynamic standard state. The amount of produced CaCO3 increases under the condition that the CO2 concentration is absolutely dominant to SO2 in the sintering flue gas atmosphere. The effect of temperature, humidity and CO2 concentration on the desulfurization of Ca(OH)2 are discussed experimentally. The increasing temperature is not conducive to desulfurization, and the humidity can promote desulfurization, while excessive humidity could inhibit desulfurization. The suitable relative humidity is 20%. In situ generated calcium carbonate has a certain desulfurization effect, but the desulfurization effect is not as good as Ca(OH)2. However, a large proportion of CaCO3 was produced in the desulfurization ash under the condition that CO2 concentration was absolutely dominant to SO2 in the sintering flue gas atmosphere.

1. Introduction

The sintering process is a major source of sulfur and nitrogen pollutant emissions of steel mills, and the proportion of SO2 and NOx account for about 60% and 50% of the total emissions from the iron and steel industry, respectively [1,2]. In recent years, the Chinese government strengthened environmental protections, and a series of stricter environmental laws and regulations have been published. With the proposed new concept of “Ultra-low emission”, the SO2 and NOx emission standards were changed to <35 mg/Nm3 and <50 mg/Nm3, respectively [3], which were ≤200 mg/Nm3 and ≤300 mg/Nm3 in the 2015 national standard [2].
To match the emission requirements, many methods were applied in iron and steel factories, and the main methods include wet desulfurization technology [4,5,6,7,8], dry desulfurization technology [9,10] and semi-dry desulfurization technology [9]. The semi-dry desulfurization technology has drawn a lot of attention for its advantages of multi-pollutant synergistic control, water saving and low investment in equipment [11]. The mainstream denitrification technologies are SCR (selected catalytic reduction) [12], SNCR (selected non-catalytic reduction) [13], activated carbon adsorption [14] and ozone oxidation–adsorption [11]. Compared with SCR, SNCR and activated carbon methods, the ozone oxidation–absorption method exhibits the advantages of high oxidation selectivity, high oxidation efficiency, and no secondary by-products [15].
Shanghai Meishan Iron and Steel Co. adopted the semi-dry desulfurization technology for simultaneous desulfurization and denitrification from flue gas using a flue gas circulating fluidized bed. Ozone (O3) was introduced to oxidize NO into dioxide (NO2), which is soluble nitrogen and highly active [16]. In the absorption tower, the main component of hydrated lime is Ca(OH)2, the desulfurization rate of sintering flue gas reaches 98% and the denitrification rate reaches 88%, and those meet the requirements of ultra-low emissions for sintering flue gas pollutants.
However, there is a significant increase in the desulfurization ash production under the “ultra-low emission” working conditions, from the original 1349.8/t to 2101.6/t, an increase of about 55.7%. Meanwhile, the composition of CaCO3 in desulfurization ash also increased from 31.17% to 51.50%, an increase of 65.2%, which not only increased the usage of hydrated lime but also imposed a burden on waste disposal and risked potential environmental pollution. Therefore, it is necessary to know the mechanism of CaCO3 increase under a high oxide atmosphere.
Hydrated lime is an adsorbent commonly used in semi-dry desulfurization; NO2 and SO2 react with hydrated lime, curing to form nitrates and sulfates [17,18,19,20,21,22,23,24]. The main components of the sintering flue gas are SO2 1026~1321 mg/Nm3, NOx 271.4~293.5 mg/Nm3, O2 15.5~16.5 vol%, CO2 6.1~7.0, H2O 10.1~10.9 vol% and dust 28.6~39.0 mg/Nm3. The components of CO2 contribute to the generation of a large amount of CaCO3. For a long time, CO2 has not received attention, and there are few studies on the change in CaCO3 in the desulfurization ash. CaCO3 as an adsorbent is mainly used in the high-temperature stage of 800~1200 °C, which decomposes to CaO to complete the desulfurization reaction [25,26]. For the sintering flue gas temperature conditions (80~120 °C), whether CaCO3 has the effect of desulfurization in the absorption tower has not been clarified.
In this paper, hydrate was selected as the absorbent because it is widely used in the semi-dry desulphurization process in steel works. CO2 contained in the sintering flue gas is a very important factor that needs to be studied. A study focusing on the effect of CO2 in desulfurization was conducted. The competitive reaction of the gas components SO2 and CO2 in sintering flue gas was analyzed thermodynamically. Under the simulated sintering flue gas condition, the effect of CO2 concentration, temperature and relative humidity on the desulfurization of calcium-based adsorbent were carried out. The mechanism of CaCO3 formation and its effect of desulfurization under low temperatures were investigated. The research results will help to understand the mechanism of the formation of desulfurization ash under ultra-low emission conditions.

2. Materials and Methods

2.1. Experimental Materials

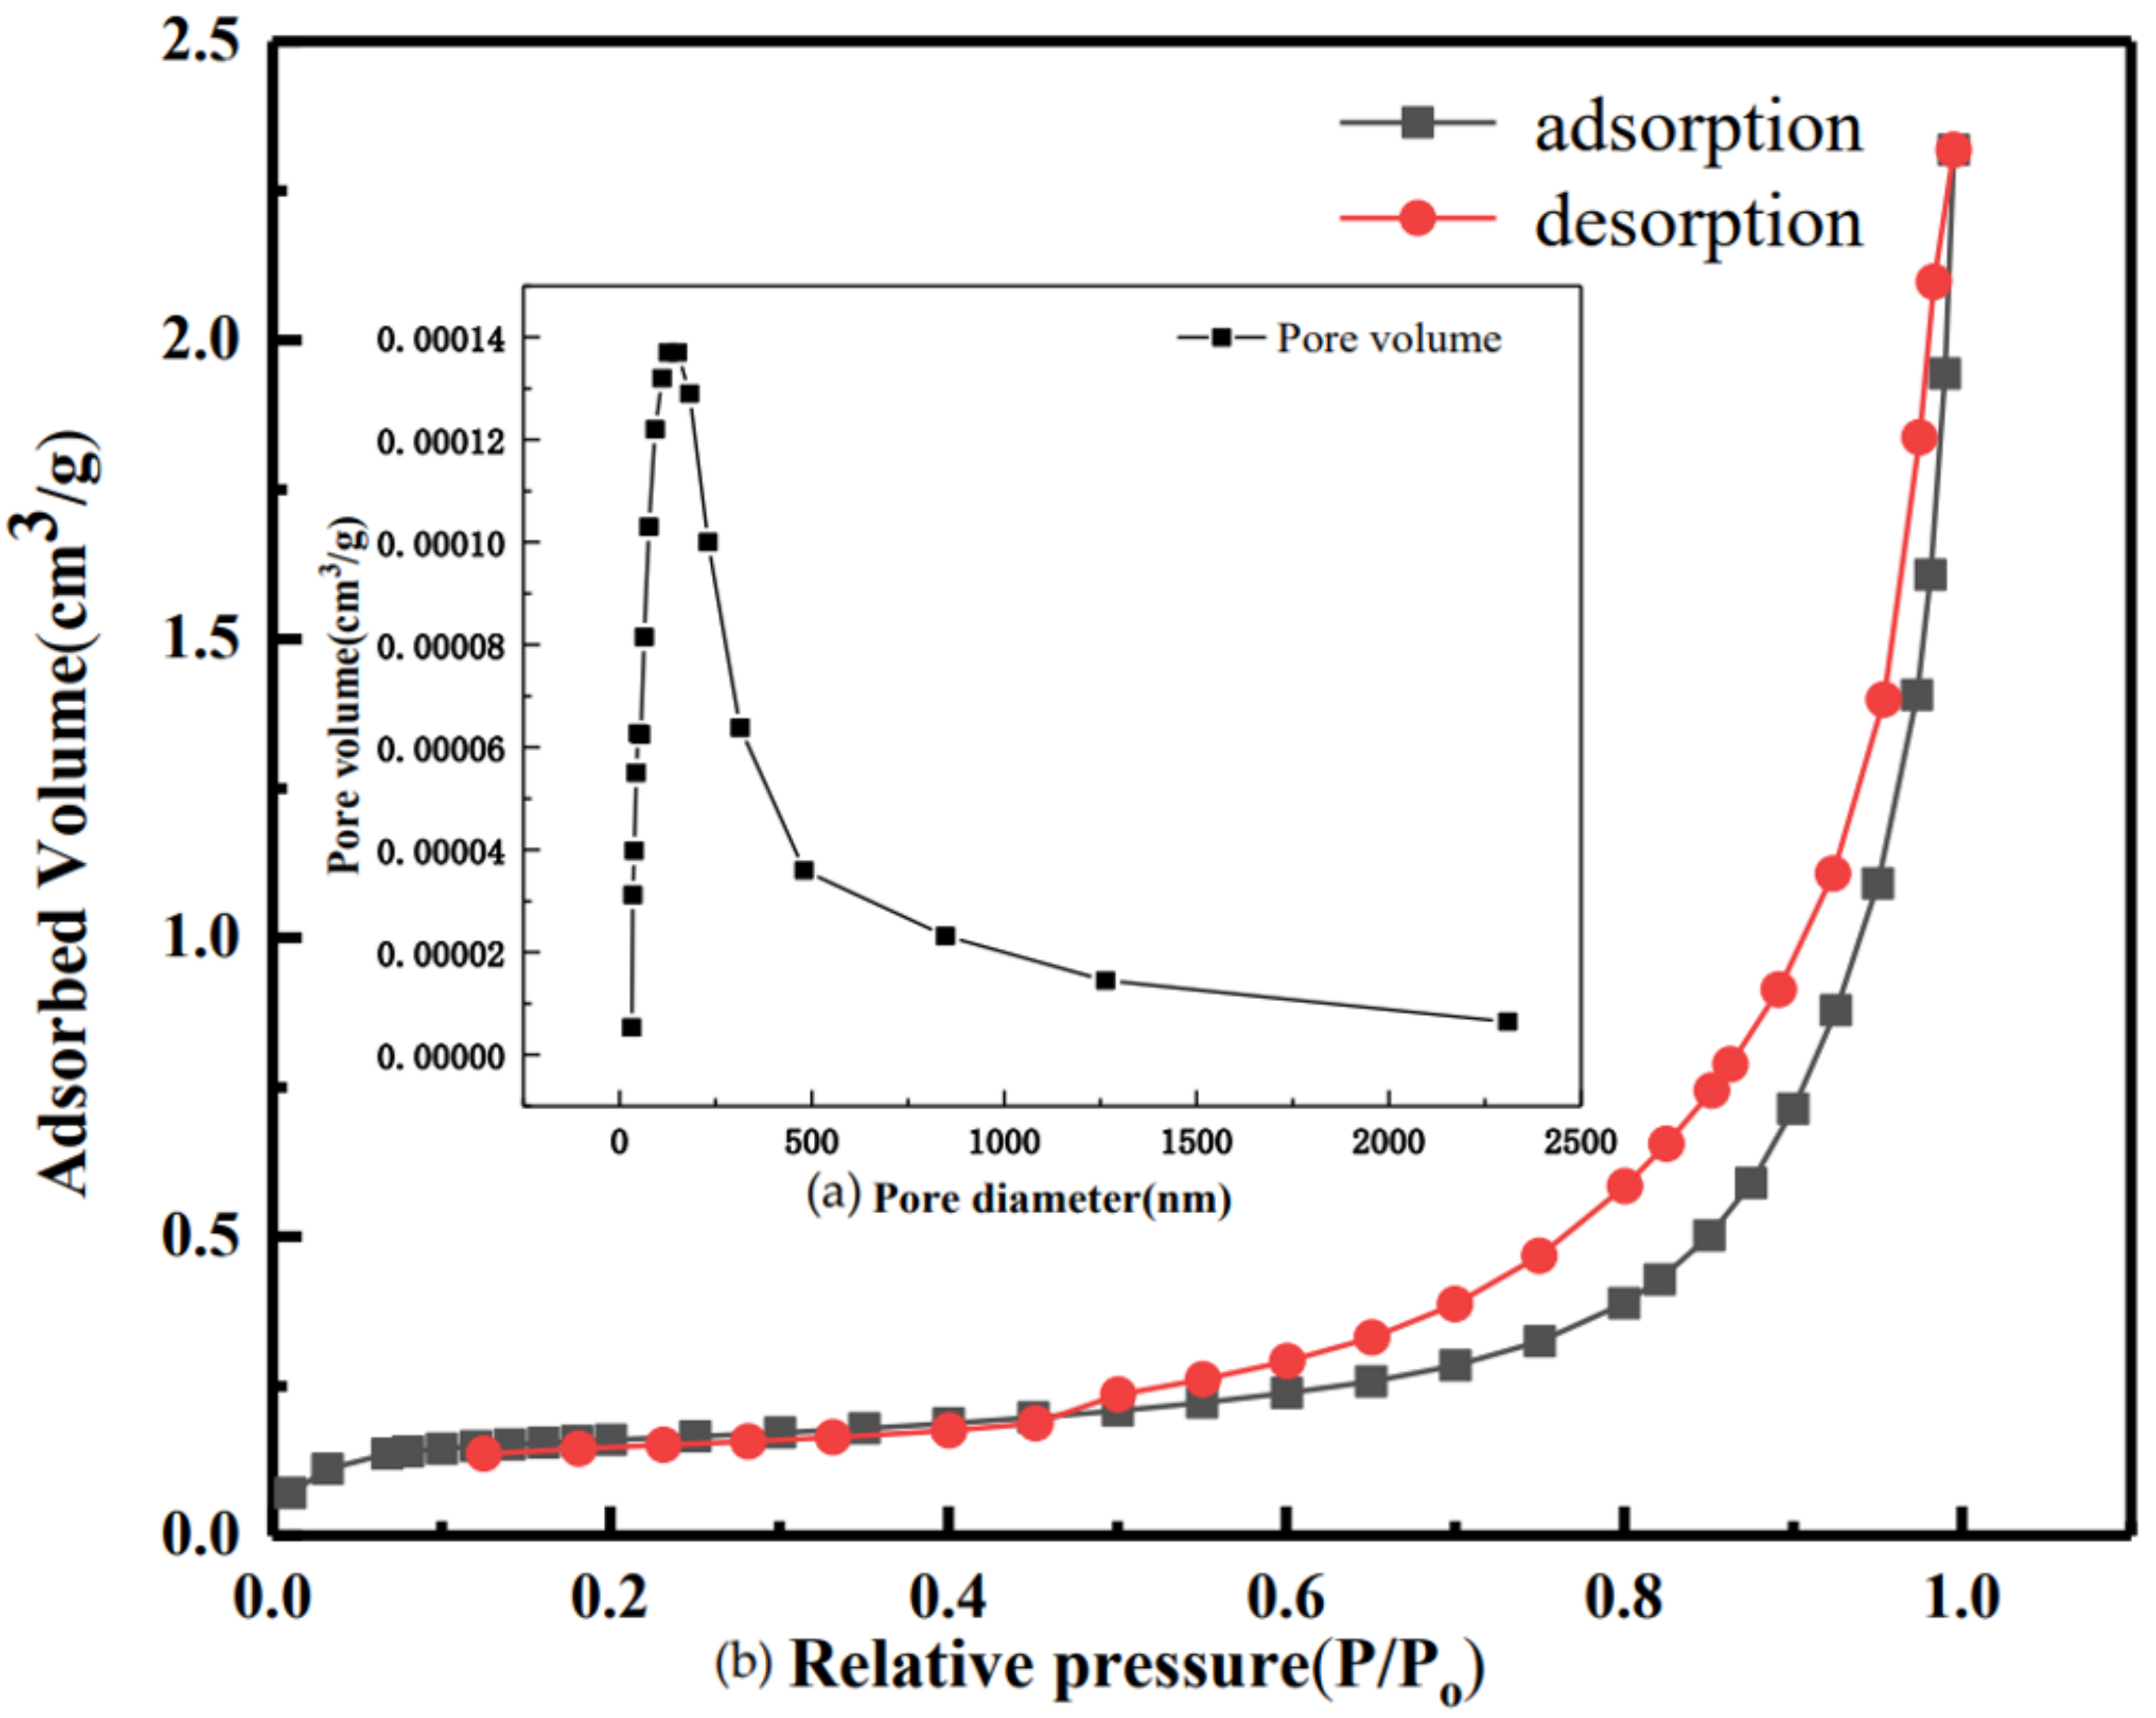
The raw material used in this paper is quicklime, provided by Meishan Iron and Steel Plant (Nanjing, China). The powdered raw material obtained after grinding and crushing was added to deionized water for digestion, and then the finished suspension was dried to constant weight, and finally the adsorbent was crushed and sieved. As shown in Figure 1a, the original quicklime was mainly composed of CaO, CaCO3 and Ca(OH)2, of which the main ingredient was CaO. The main component of the digested sample was Ca(OH)2 (Figure 1b). The results of laser particle size analysis (Figure 1c) showed that the particle size distribution of original quicklime was 0.5~100 µm, and the average particle size was 7.8 µm, which was consistent with the SEM analysis results (Figure 1d), and the particle sizes were not uniform. The flow chart of making the samples is shown in Figure 1e. A certain amount of samples was taken, and it was ground into powder for XRF element analysis test. The test results are shown in Table 1 It can be seen from the table that raw quicklime contains elements such as Ca, Mg, Fe, Al, Si and K (Table 1). As shown in Table 1, the total calcium content is 88.26 wt.%. The TG-DSC curve of the original quicklime sample is shown in Figure 2, which was obtained in an Ar atmosphere. It is clear that the mass loss process occurs in two different stages. The first stage is at 422.2 °C, which is attributed to the decomposition of Ca(OH)2, while the second stage, at 647.3 °C, shows the decomposition of CaCO3. According to the mass loss rates Δw1 and Δw2 of the two temperature segments on the thermogravimetric map, the mass fractions of Ca(OH)2 and CaCO3 can be roughly obtained; the calculation formula of Ca(OH)2 content is w = Δw1 × 74/18, and the formula of CaCO3 content is w = Δw2×100/44. Therefore, we found that the Ca(OH)2 content is 75.44 wt.% while the CaCO3 content is 12.43 wt.%. The specific surface area of raw quicklime was 3.3850 m2/g (Figure 3a), with a relatively uniform pore size distribution and an isothermal adsorption curve close to type IV with an obvious H3-type hysteresis loop.

2.2. Experimental Methods

2.2.1. Experimental Device

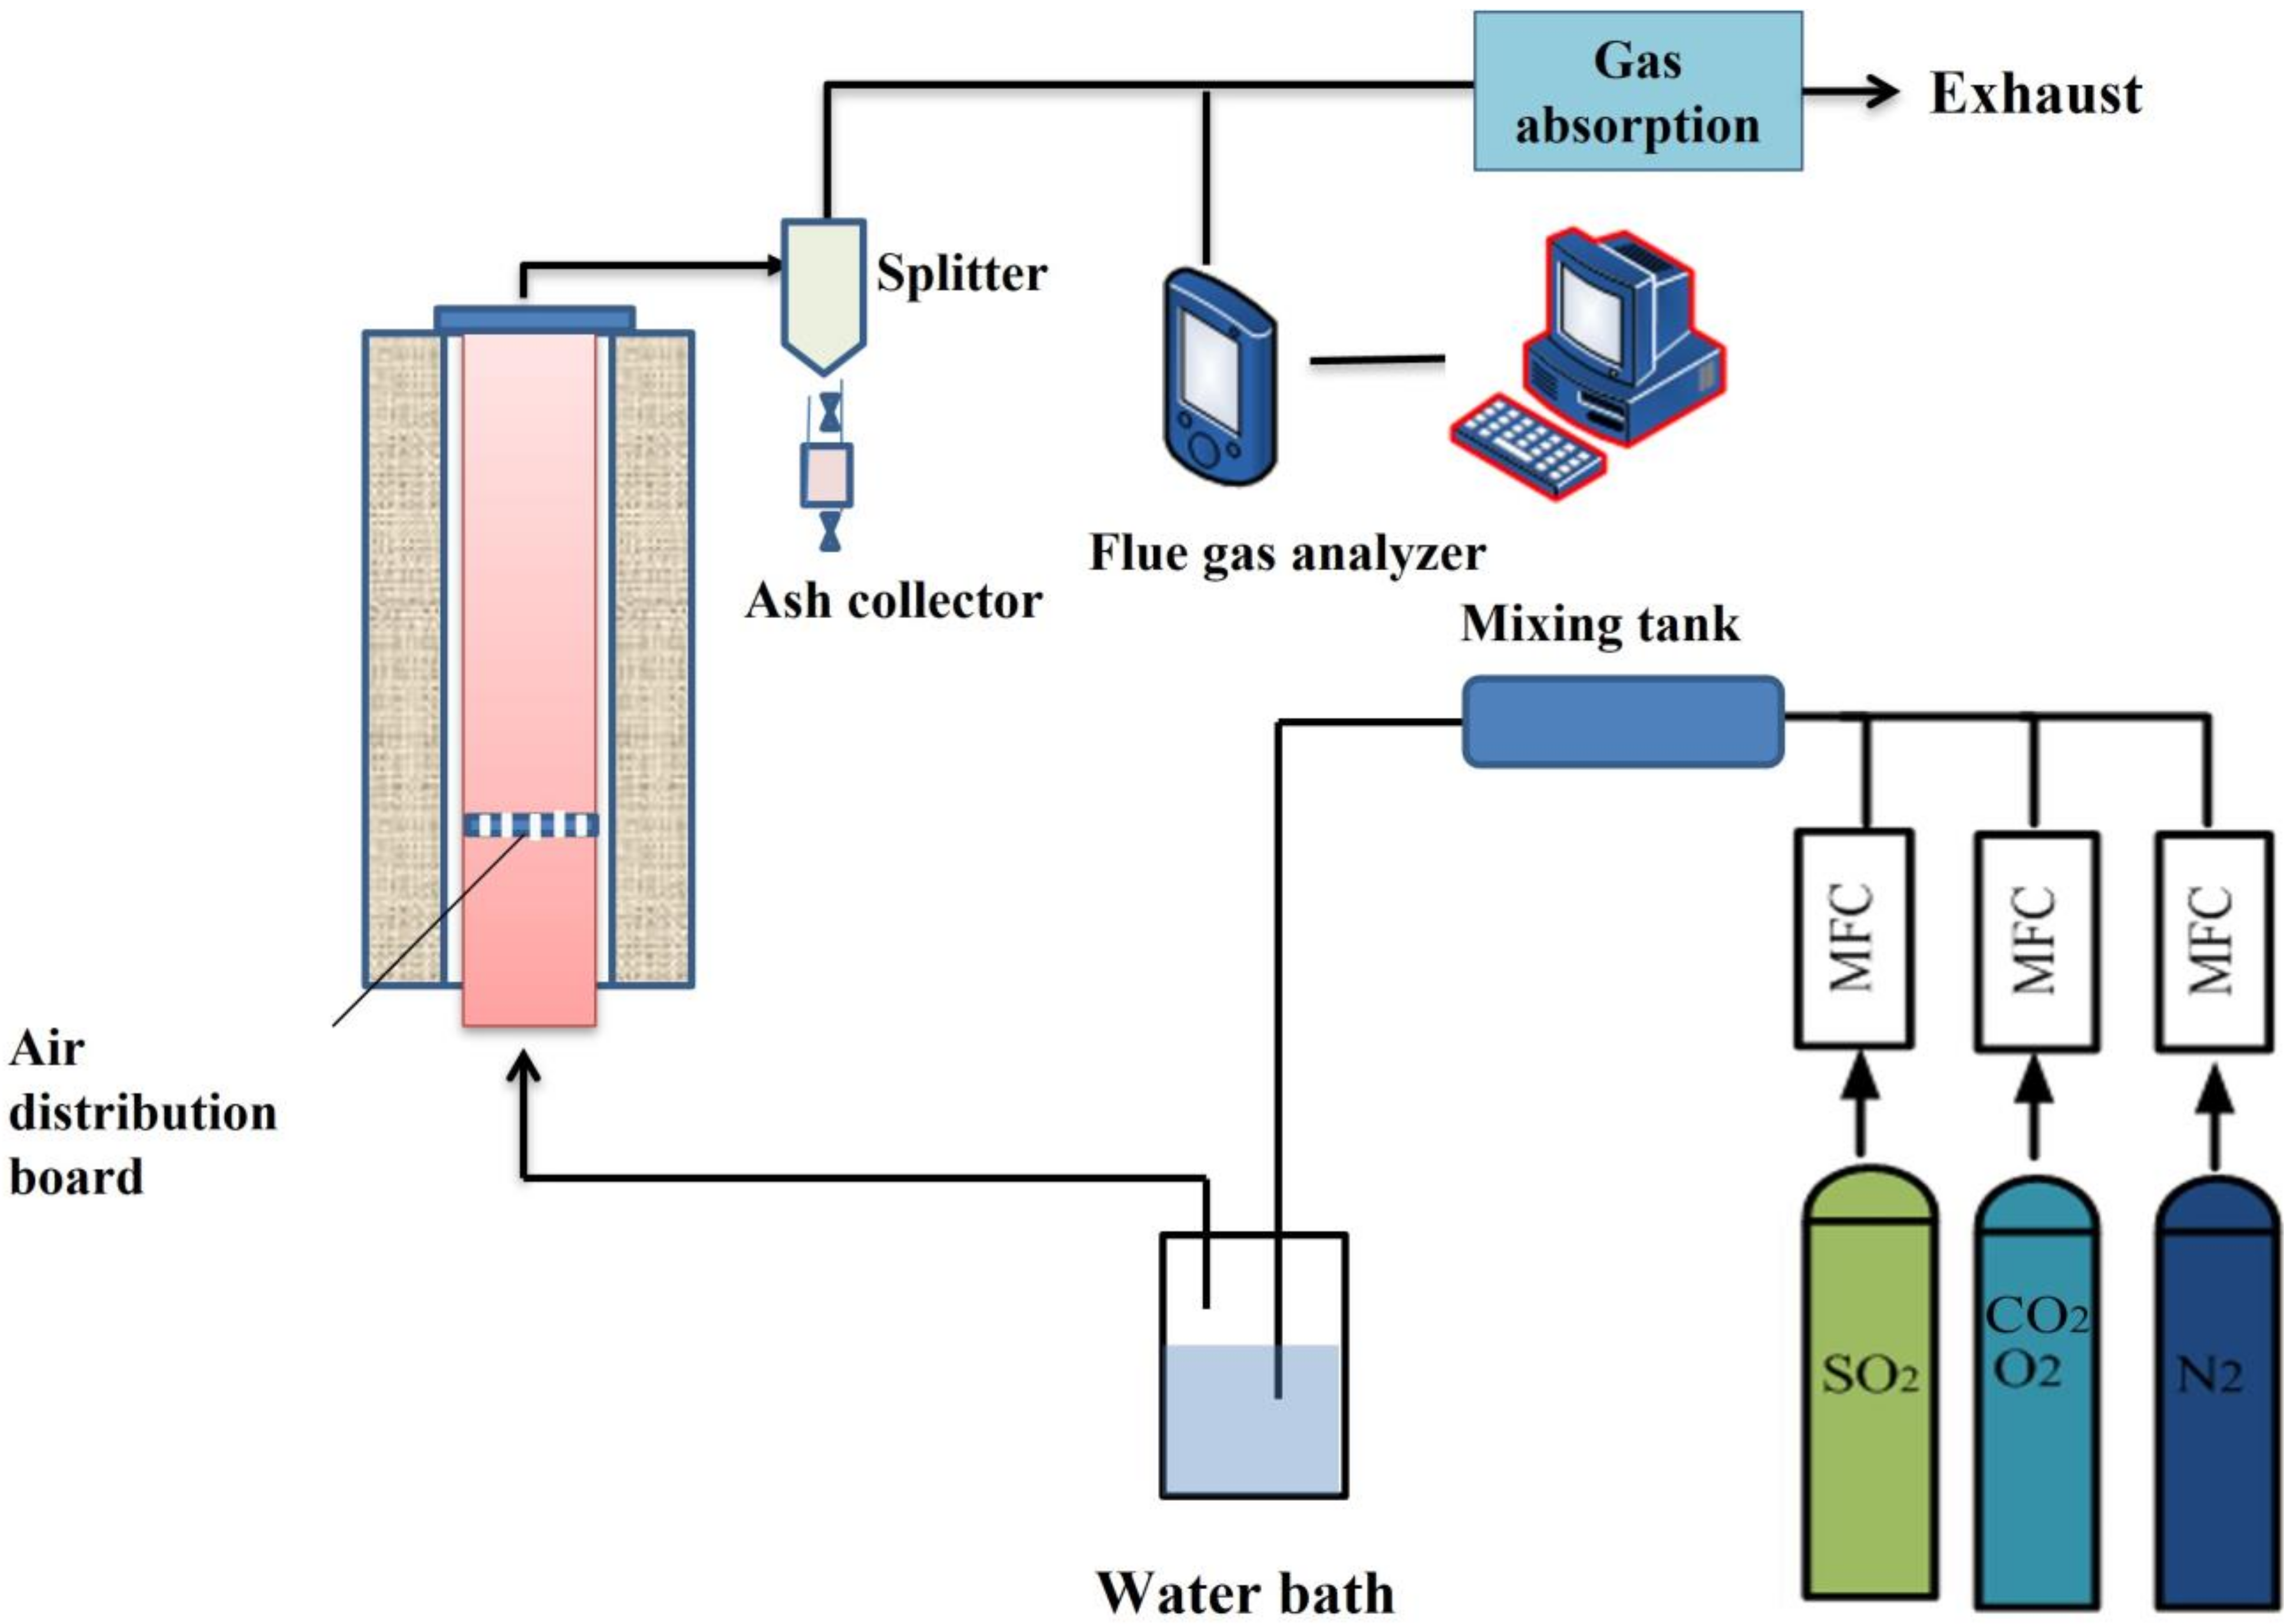
The schematic diagram of the experimental system is shown in Figure 4. The high-purity gases (N2, SO2 and CO2) from the high-pressure cylinder are mixed in the mixing tank. The specific purities of gases are listed in Table 2. The composition of the simulated blast furnace gas is controlled by mass flow controller (MFC). The simulated flue gas reacted with the calcium-based adsorbent in the tubular heating furnace. The gas composition was detected by a Testo 350 flue gas analyzer. The gas from the measuring system then passed through the tail gas absorption with the Na(OH)2 solution to remove the acidic components of the tail gas.

2.2.2. Experimental Methods

1.
Relative humidity calculation
Previous studies have shown that Ca(OH)2 cannot react directly with SO2 in an absolutely dry environment [27,28], so water is introduced into the desulfurization reaction by the water vapor carrying method.
The principle of this method is based on Dalton’s law of partial pressure, and the relative humidity is controlled by adjusting the temperature of the constant temperature water bath. The water bath is heated to a set temperature, maintained for a certain time, and the inert gas N2 was introduced into the water through the pipeline and bubbled in the water to saturate the water vapor, so as to obtain the humidity conditions required for the experiment. The specific calculation of relative humidity is shown in Equation (1).
H = 0.622 p δ p 0 p δ
H—Absolute humidity in grams per kilogram (g∙kg−1).
P—Saturation vapor pressure of water in Pa (Pa).
Δ—Relative humidity in percent (%).
P0—The total pressure of wet air in Pa (Pa).
2.
Desulfurization ash composition analysis
Since there is no corresponding standard for the analysis of desulfurization ash components, the component analysis methods are mainly established based on GB176-1996 “Methods of Analysis of Cement” and GB/T5484 “Methods of Chemical Analysis of Gypsum”. The calcium hydroxide content and calcium carbonate content are quantitatively analyzed by thermogravimetry, and the calcium sulfite content is determined by the iodometric method.

2.2.3. Evaluations

The evaluations of the desulfurization effect of adsorbent in the experiments are defined as follows.
1.
Desulfurization efficiency
The specific calculation of desulfurization efficiency is shown in Equation (2).
η S o 2 = C S O 2 , i n C S O 2 , o u t C S O 2 , i n × 100 %
η —The desulfurization efficiency (%).
C S O 2 , i n —The concentration of SO2 in the inlet reactor flue gas, mg/Nm3.
C S O 2 , o u t —The concentration of SO2 in the outlet reactor flue gas, mg/Nm3.
2.
Penetration time
When the SO2 concentration of tail gas is higher than 35 mg/Nm3, which is the limitation of the national standard, the adsorbent is penetrated and ineffective, and the elapsed time is defined as the adsorbent penetration time.
3.
Penetration sulfur capacity
The ratio of the absorbed sulfur mass by penetration to the original adsorbent mass is defined as the theoretical sulfur capacity. The specific calculation of theoretical sulfur capacity is shown in Equation (3).
Ps = Ms Mt × 100
PS—The penetration sulfur capacity, g/100 g adsorbent.
Ms—The absorbed sulfur mass by penetration, g.
Mt—The original adsorbent mass, g.

2.2.4. Characterization Methods

The particle size distribution (PSD) tests of raw materials were carried out by a laser particle size analyzer (Malvern PANalytical, Mastersizer 2000 MU, The Netherland). The phase composition was characterized by X-ray diffraction (XRD, Bruker-AXS D8 Advance, Billerica, MA, USA) using Cu Kα radiation (λ = 1.54056 Å) at a scan rate of 4° min−1 from 10 to 80° (2θ). The microscopic observations and analyses were performed by scanning electron microscope (SEM, FEI Nova Nano SEM 450, Hillsboro, OR, USA). Before being transferred into the test chamber, the specimens were sputtered with gold coating on the surface. Thermal analysis was conducted using thermogravimetric analysis combined with differential scanning calorimetry (TG-DSC, NETZSCH STA449 F3, Selb, Germany). The purge gas used for TG-DSC was N2, and the heating rate was set to 10 °C/min. The temperature rise range was set at 100~1100 °C.
Gas compositions were analyzed by a Testo 350 flue gas analyzer. The device is widely used in the analysis of plant flue gas for its small size, high sensitivity and portability. Meanwhile, it can measure a variety of complex gas components at the same time without interference. The analyzer adopted electrochemical principles, using the gas at the corresponding oxidation potential for potential electrolysis, and then calculated the concentration of the gas by the current consumed.

3. Results and Discussion

3.1. Thermodynamic Calculation

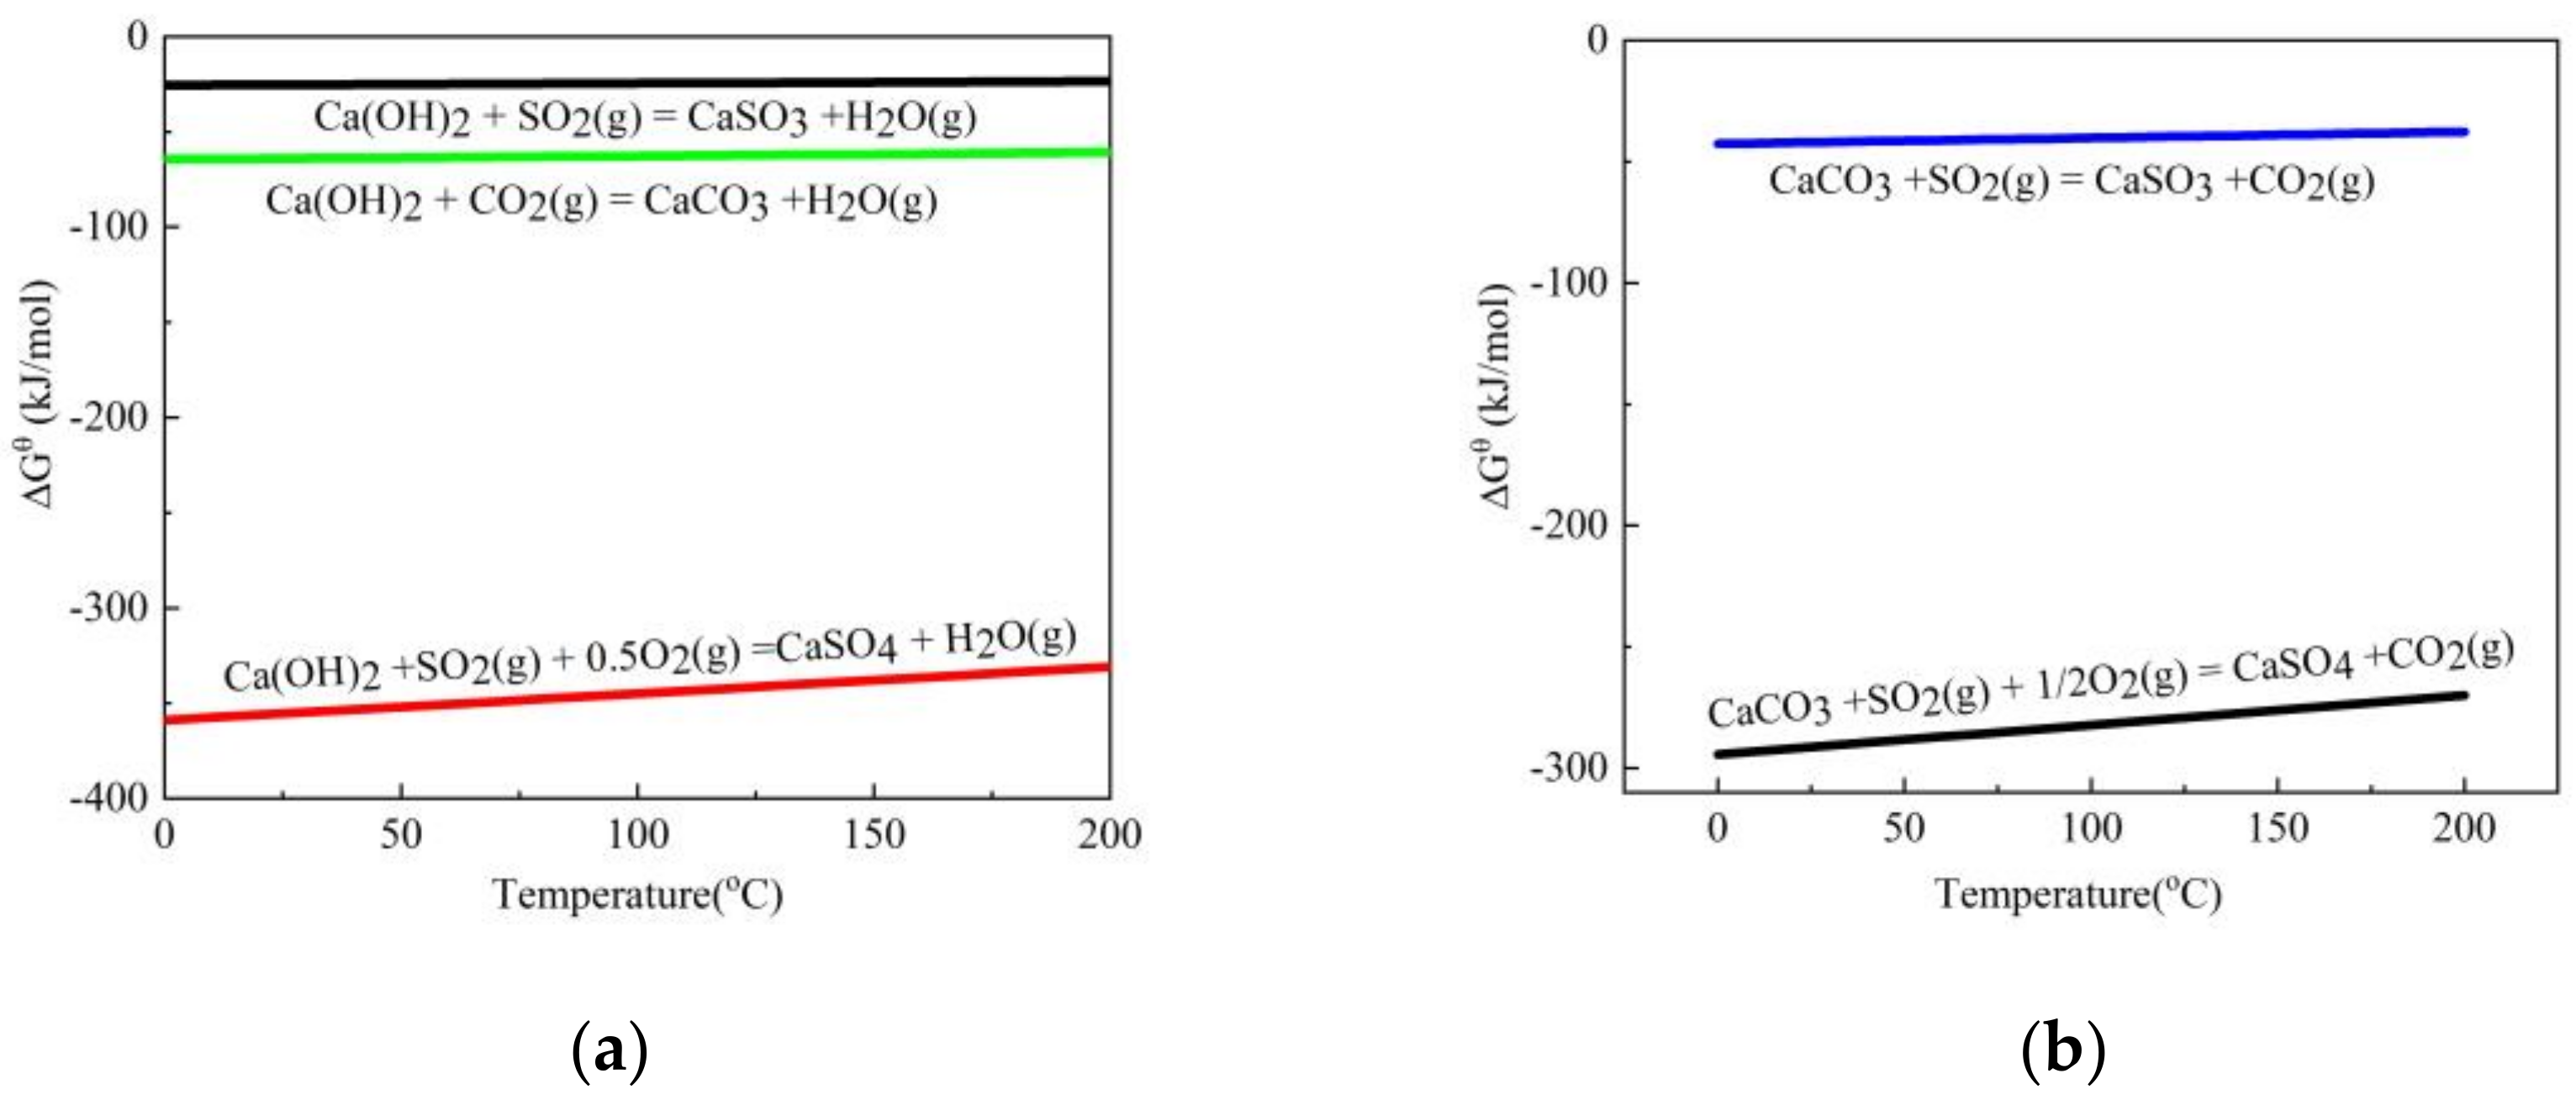
The main components of the sintering flue gas are N2, CO2 and CO, and the main composition of the adsorbent is Ca(OH)2. In the temperature range of the sintering flue gas (80~120 °C), N2 and CO do not react with hydrated lime and are treated as inert gases. The desulfurization reaction of the sintering flue gas is mainly the reaction of SO2 with Ca(OH)2, as shown in reactions (4) and (5). In the flue gas, there is about 6~7 vol% CO2, which can also react with Ca(OH)2 (reaction (6)), forming a competitive relationship with SO2. Figure 5 shows the ΔGθ-T relationship of these chemical reactions. In addition, the generated CaCO3 has a removal effect on SO2, which occurs in reactions (7) and (8). Thermodynamically, the desulfurization capacity of Ca(OH)2 is higher than that of CaCO3. In the presence of high oxygen potential, it is easier to produce CaSO4, a stable sulfate, which is more favorable for SO2 removal.
Ca(OH)2(s) + SO2(g) = CaSO3 + H2O
2Ca(OH)2 + 2SO2(g) + O2(g) = 2CaSO4 + 2H2O(g)
2Ca(OH)2 + 2CO2(g) = 2CaCO3 + 2H2O(g)
CaCO3 + SO2(g) = CaSO3 + CO2(g)
CaCO3 + SO2(g) + 1/2O2(g) = CaSO4 + CO2(g)

3.2. Effect of Temperature on Desulfurization Performance of Adsorbent

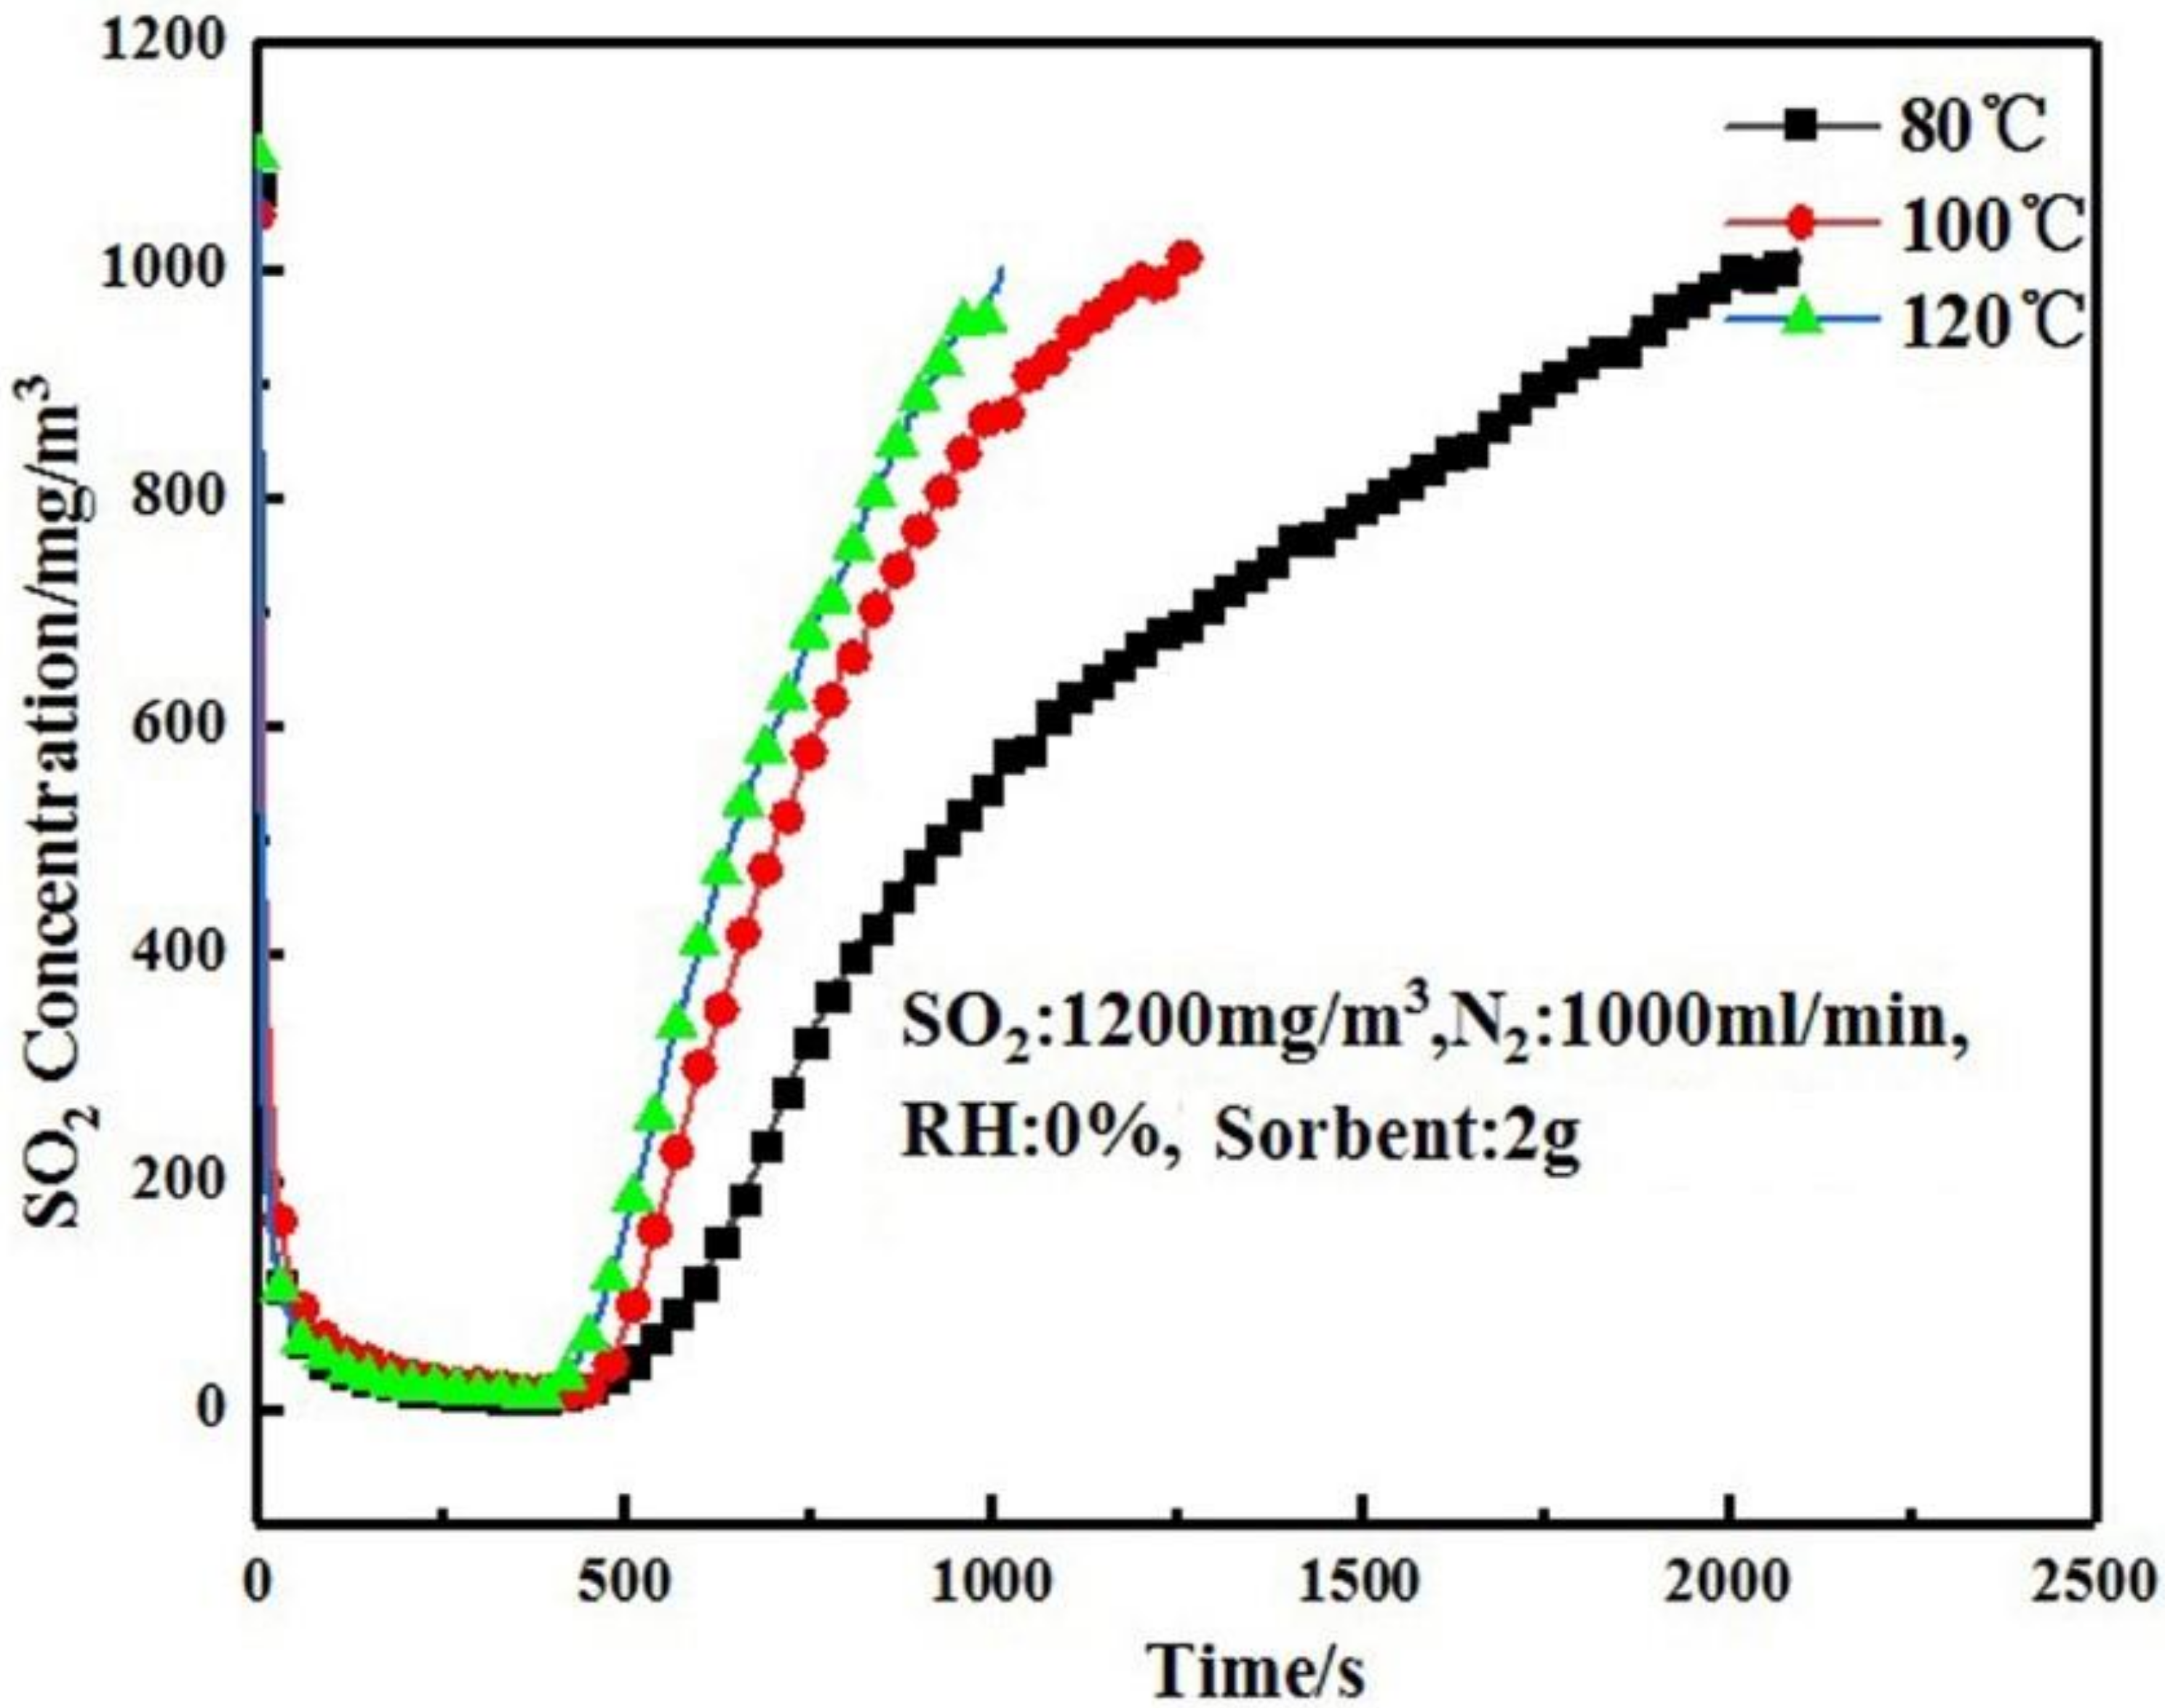
In the absorption tower, the temperatures of the sintering flue gas at the entrance and exit are about 120 and 80 °C, respectively. To simulate the actual temperature of the absorption tower, the desulfurization temperatures were set as 80 °C, 100 °C and 120 °C, respectively. The carrier gas N2 flow rate was set to 1000 mL/min, the SO2 flow rate was set to 500 mL/min, and the adsorbent loading was 2 g. Figure 6 shows the desulfurization curves of the adsorbent at different temperatures.
It can be seen from Figure 6 that the increase in desulfurization temperature was unfavorable for the desulfurization process, and the penetration time became shorter with the increase in temperature. The penetration time was 573 s under 80 °C and 471 s at 120 °C, with a difference of 102 s. As the temperature increased, the desulfurization capacity was decreased, and the utilization rate of the adsorbent decreased. This is due to the fact that the increase in temperature reduces the solubility of SO2 in water, which in turn reduces the concentration of SO2 on the surface of the adsorbent, making the sulfur capacity lower.

3.3. Effect of CO2 Concentration on Desulfurization Performance of Adsorbent

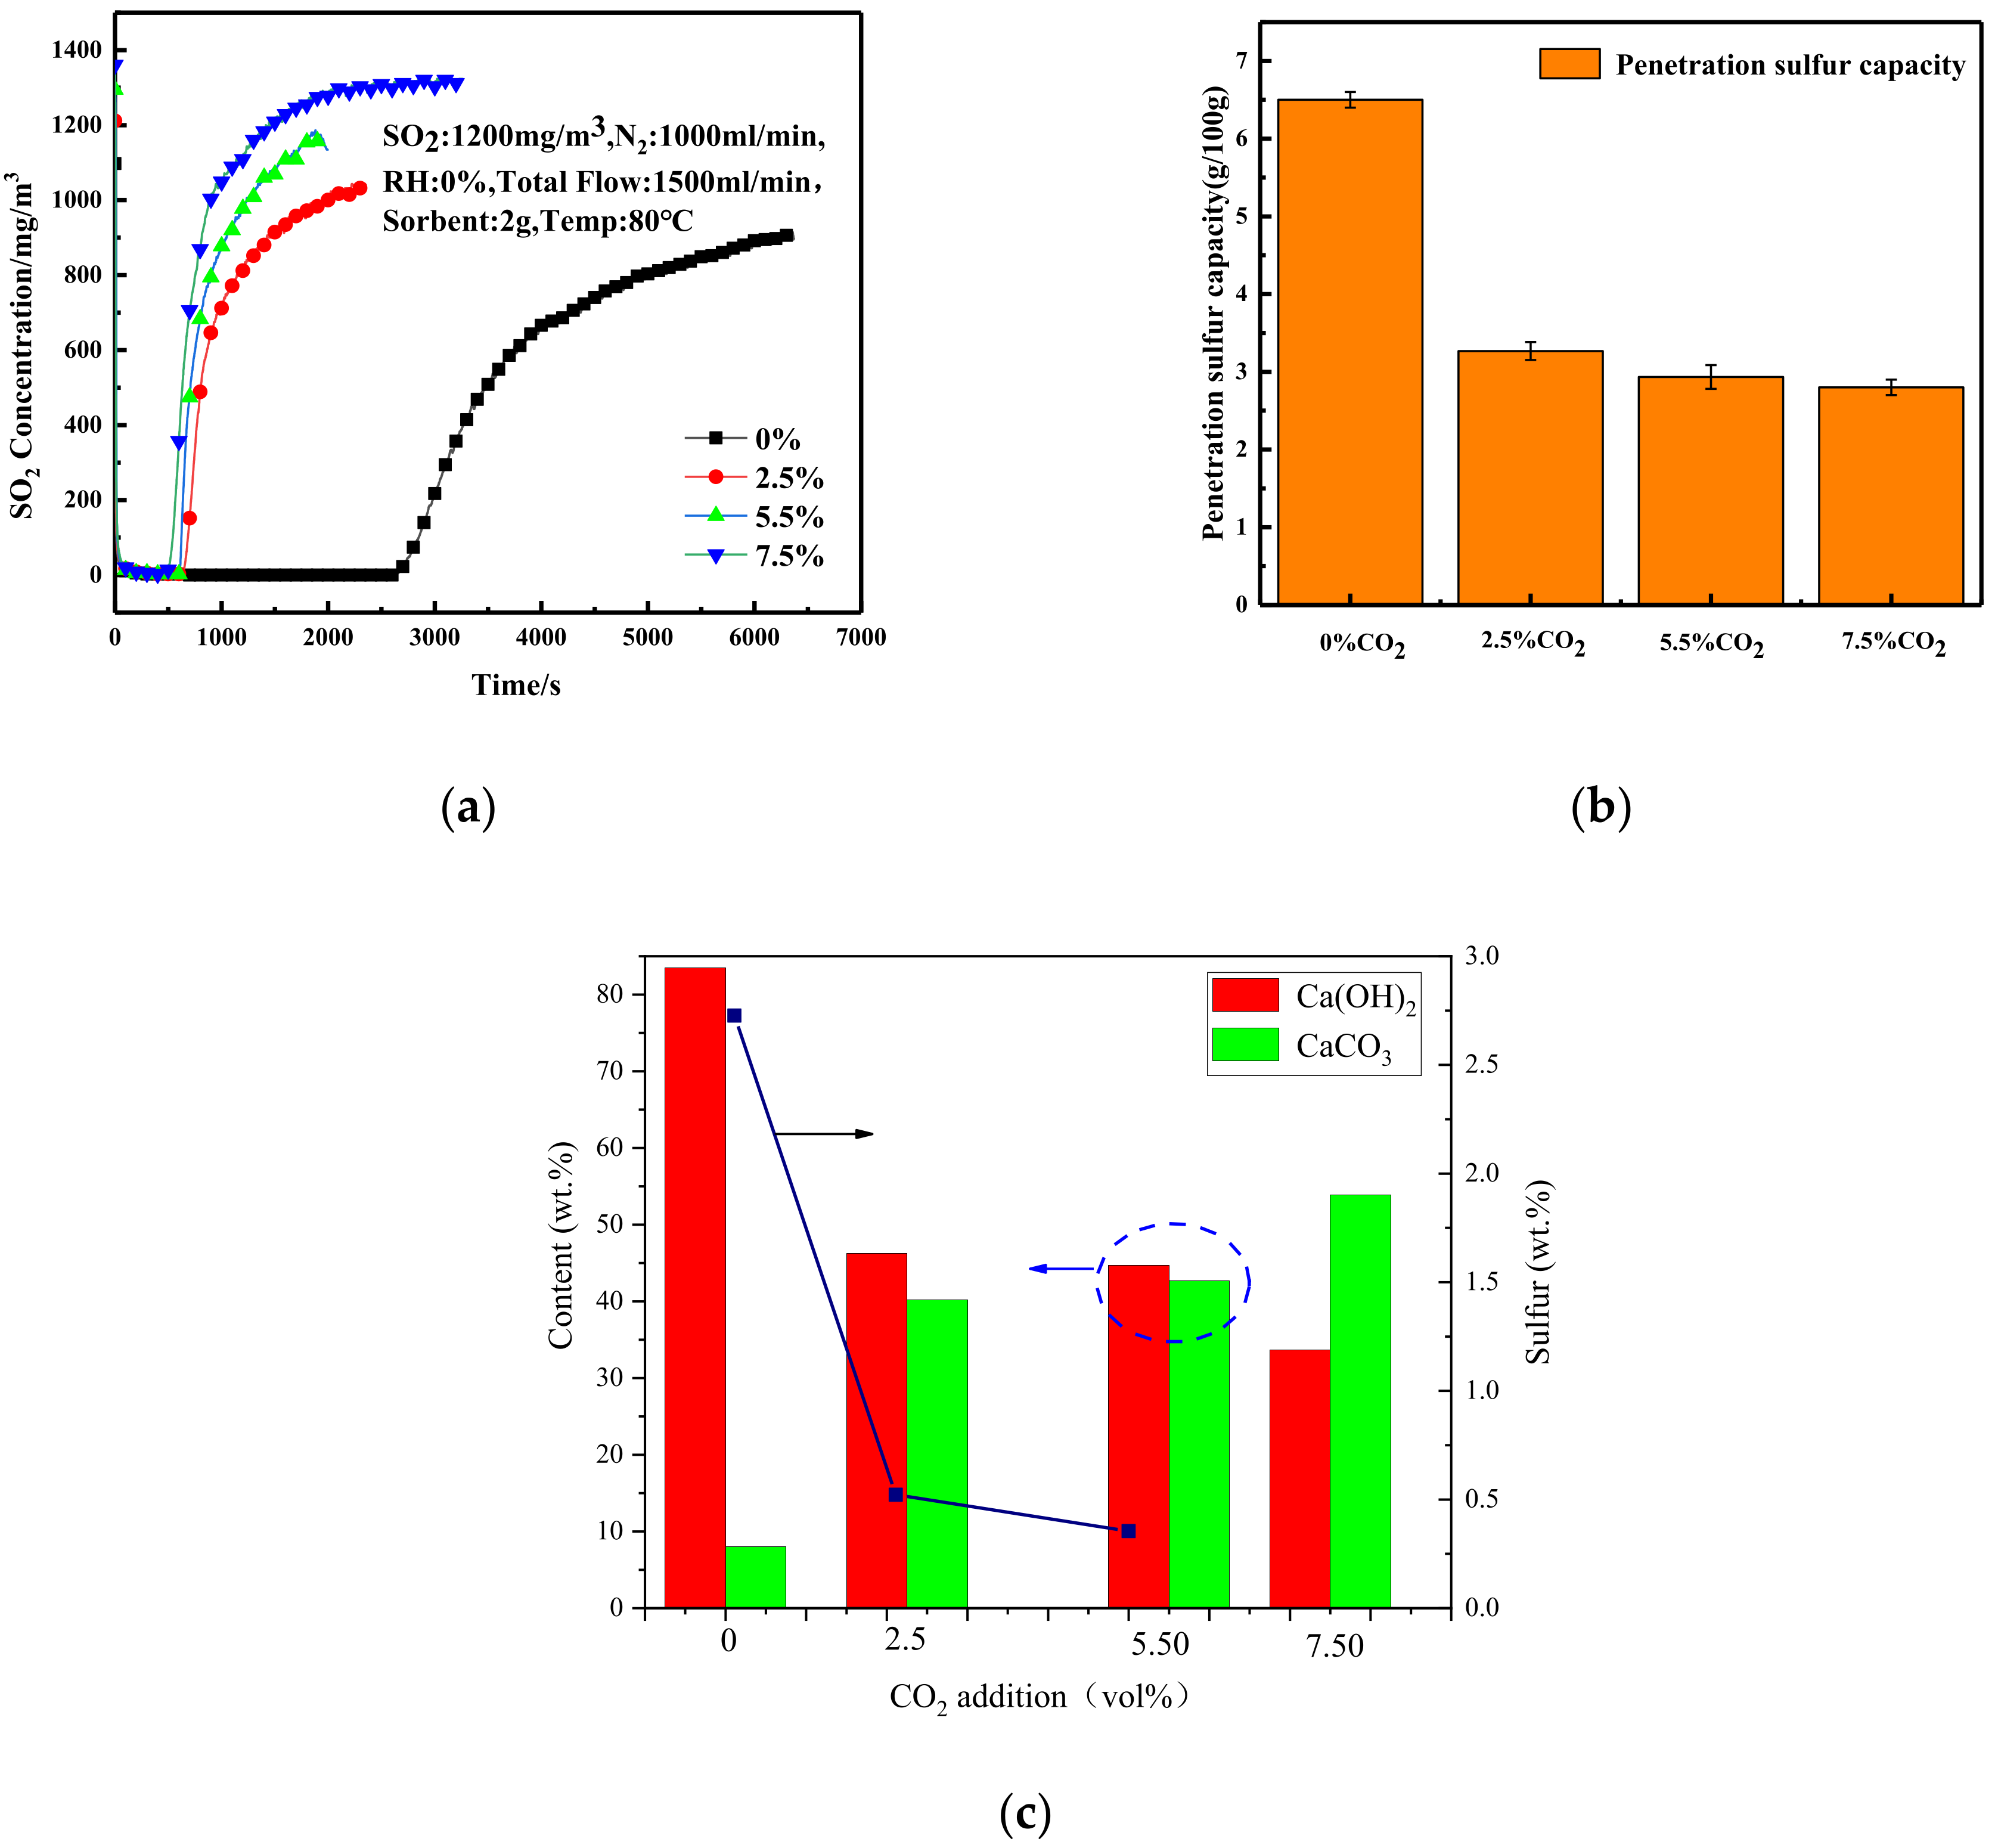
The effect of CO2 concentration on the desulfurization penetration time was studied by varying the CO2 content in the gas mixture to 0%, 2.5%, 5.5% and 7.5%, where the reaction temperature was set at 80 °C and the inlet SO2 concentration was kept at 1200 mg/Nm3. The experimental results are shown in Figure 7a. With the increase in CO2 content, the penetration time of the adsorbent decreased significantly. Under the condition without CO2, the penetration time of the adsorbent reached 2500 s. With the addition of 2.5% CO2, it plummeted to 600 s. Further increasing the CO2 concentration, the penetration time did not drop proportional to the CO2 content.
Figure 7b shows the penetration sulfur capacity of desulfurization agents with different CO2 concentrations, and it can be seen that as the CO2 concentration increases, the overall sulfur capacity shows a decreasing tendency. When the CO2 content is 0%, the penetration sulfur capacity reached the maximum value of 6.5 g/100 g adsorbent, which means that the desulfurization effect of the adsorbent is the best at this time. When the CO2 content was increased to 2.5%, it was obvious that the penetration sulfur capacity significantly decreased to only 3.3 g/100 g desulfurization agent, and the penetration time was also shortened, indicating that the CO2 in the gas hinders the desulfurization process of the desulfurization agent and affects the desulfurization performance of it. When the CO2 content was further increased to 7.5%, there was a small decrease in the penetrating sulfur capacity, but not as drastic as before, indicating that CO2 has a decreasing effect on the absorption effect of desulfurization agent, and with the increase in CO2 concentration, there is a plateau, and the decreasing effect is weakened.
With the increase in CO2 concentration, the penetration time of the adsorbent was slightly shortened, the relative content of Ca(OH)2 decreased, and the relative content of CaCO3 increased, as shown in Figure 7c. The S content in the desulfurization ash was decreased, indicating that the desulfurization capacity of the adsorbent decreased.
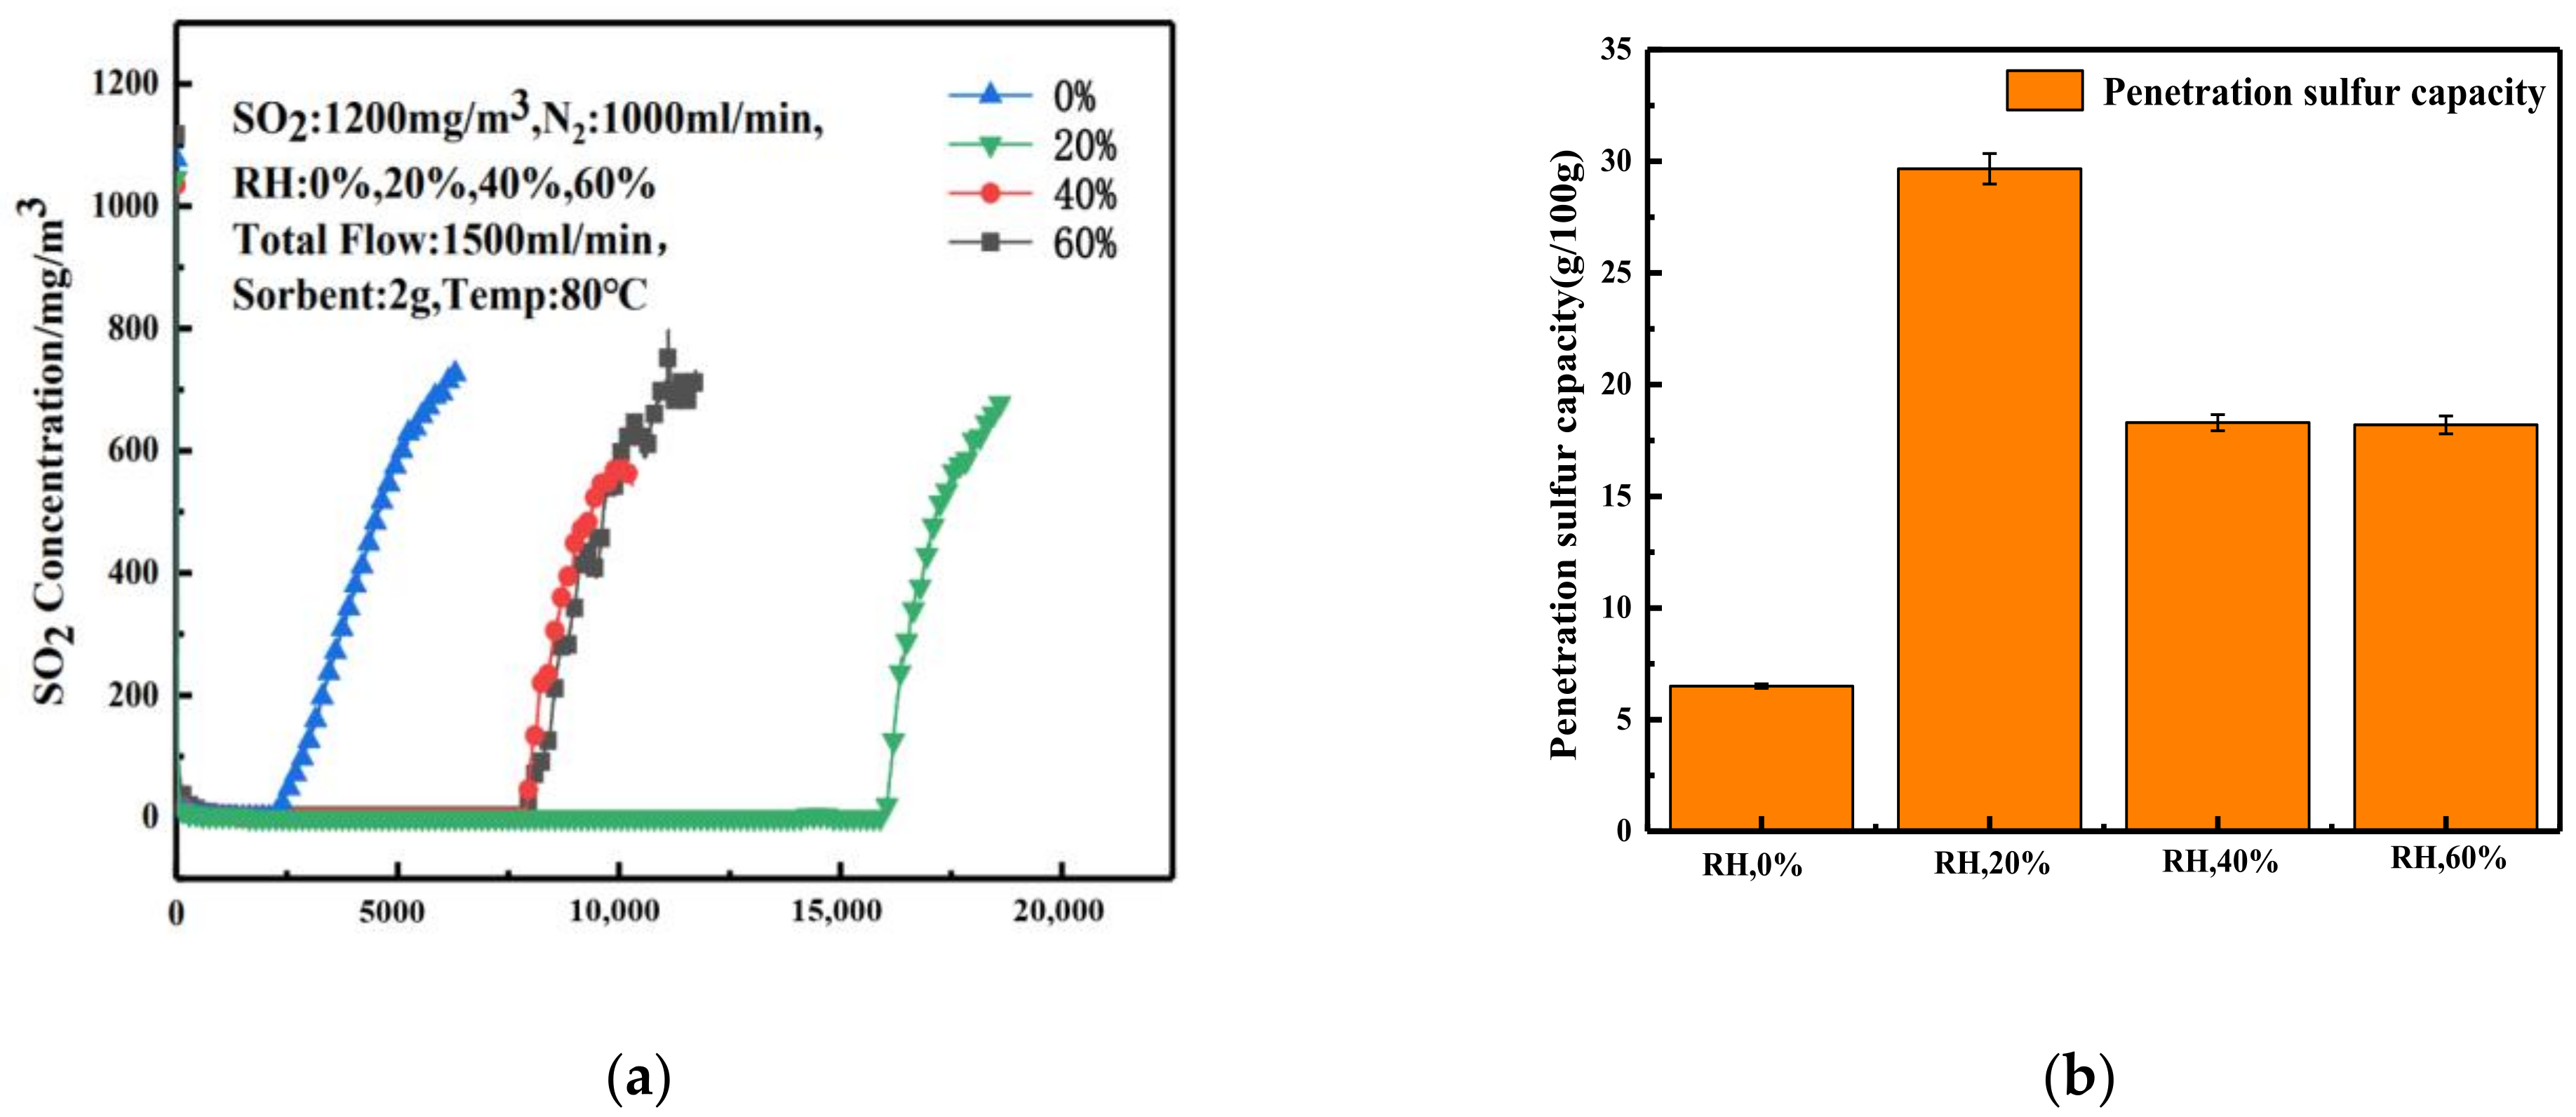
Figure 8a shows the effect of different relative humidities on the desulfurization process. When relative humidity was increased from 0 to 20%, the penetration time was increased significantly. When the relative humidity was further increased, the penetration time was decreased. Correspondingly, the sulfur capacity at 20% relative humidity was the highest (Figure 8b). It can be concluded that an appropriate humidity is helpful for increasing the desulfurization effect of sorbents, as the desulfurization effect will be weakened by excessive water. The 20% relative humidity is appropriate in this study: the sulfur capacity of the adsorbent reaches 29 g/100 g.

3.4. Effect of Relative Humidity on Desulfurization Performance of Adsorbent

3.4.1. Desulfurization Performance of Adsorbent

Under the condition of 20% relative humidity, the penetration time decreased with the increase in CO2 concentration (Figure 9a). The longest penetration time was 1260 s with 2.5% CO2 concentration, and the shortest penetration time was 580 s with 7.5% CO2 concentration. The overall sulfur penetration capacity tends to decrease as the CO2 concentration increases (Figure 9b). This is because the increase in CO2 concentration in the gas mixture consumes the adsorbent, resulting in a decrease in the adsorbent for desulfurization. This indicated that the CO2 concentration weakened the desulfurization effect of the desulfurizing agent at 20% relative humidity, and the sulfur penetration capacity gradually decreased as the CO2 concentration continued to increase.

3.4.2. Morphology and Pore Structure of Desulfurized Ash

As shown in Figure 10a, the surface of the original adsorbent was rough and porous, resulting in a relatively large specific surface area (as shown in Table 3) that was favorable for gas adsorption. After desulfurization in 2.5% CO2 atmosphere (Figure 10b), the pores of the adsorbent became shallow, and there were many crystals growing on the surface. When the CO2 concentration increased to 5.5% (Figure 10c), the surface of the adsorbent obviously became dense and rough. The pores were filled, and the surface was covered with products which had thin strips, flakes, columns, needles and other irregular crystal structures. When the CO2 concentration was up to 7.5% (Figure 10d), the product crystal grew obviously on the adsorbent surface. As a result, the active points of the adsorbent were occupied and the pores were filled by the product, resulting in a decrease in BET and pore volume and pore diameter.

3.4.3. Composition Analysis of Desulfurization Ash

The composition analysis of desulfurization ash is shown in Figure 11a. Without adding CO2, Ca(OH)2 accounted for about 76 wt.% of the desulfurization ash, indicating that the utilization rate of the adsorbent was not high. With the increase in CO2 content in the flue gas, the content of CaCO3 was increased, and the contents of Ca(OH)2 and CaSO4 and CaSO3 were decreased. This is consistent with the results of the TG analysis, as shown in Figure 11b. The weightlessness stages I (330~450 °C) and II (545~750 °C) represented the decomposed Ca(OH)2 and CaCO3. As we can see, with the increase in CO2 content, Ca(OH)2 was decreased and CaCO3 was increased. This is because the concentration of CO2 is much higher than that of SO2. Under the non-equilibrium condition, the formation trend of CaCO3 becomes larger.
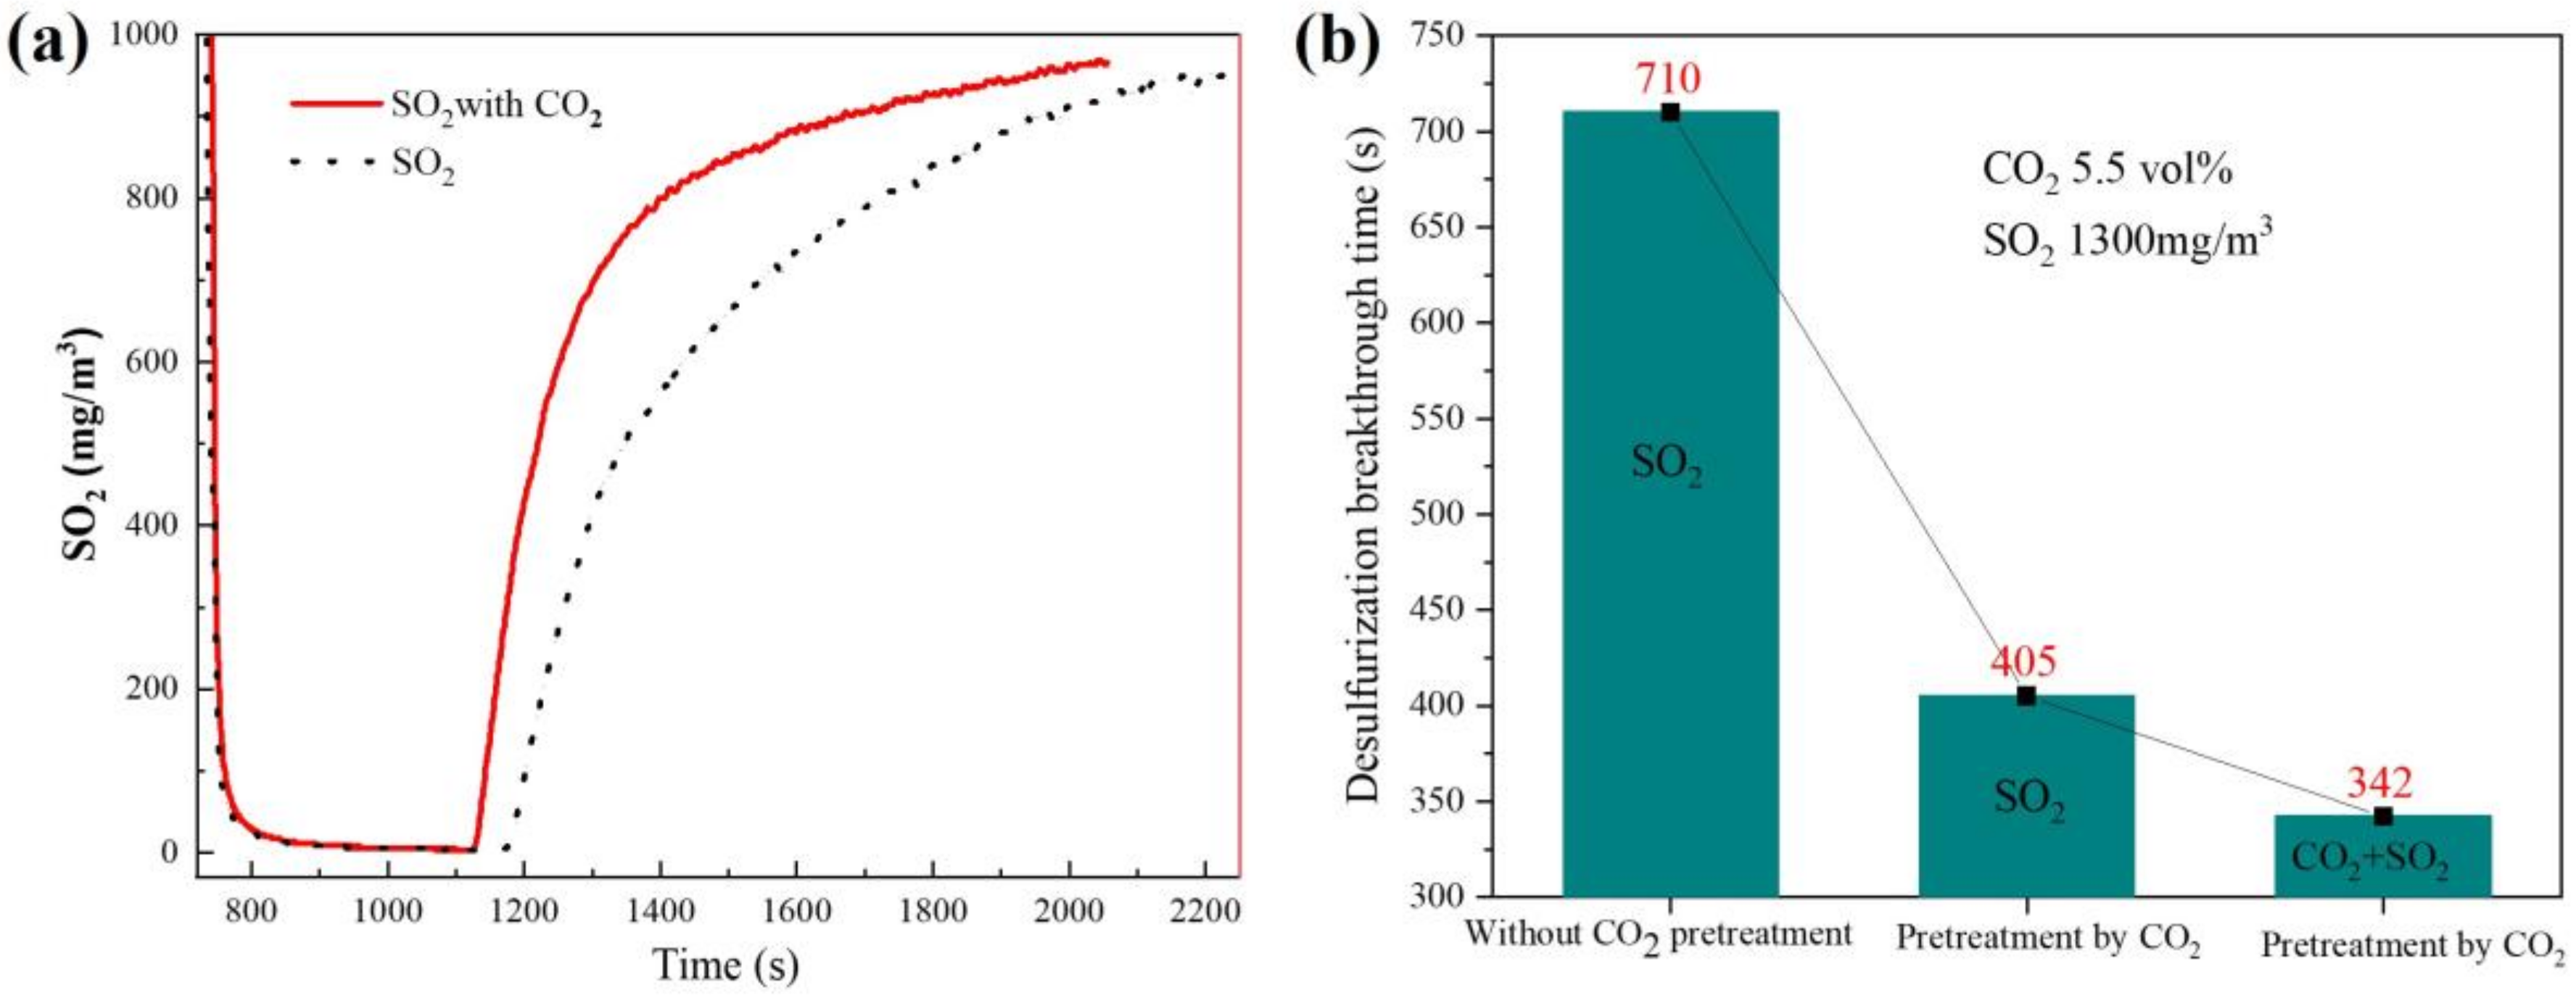
From the above analysis, it can be seen that a large amount of CaCO3 was generated with high CO2 concentration in flue gas. To investigate whether in situ generated CaCO3 has a desulfurization effect, a group of experiments was carried out. Firstly, the adsorbent was put in the flue gas containing 5.5% CO2 atmosphere. When the CO2 in the exhaust gas reached stability, it meant the reaction had reached equilibrium, and at this time the surface of the sample was covered with produced CaCO3. Secondly, SO2 was introduced into the flue gas. In order to study the effect of CO2 on desulfurization, two comparative experiments were designed: one for the CO2 + SO2 gas mixture to examine the effect of CO2 on SO2 removal, and the other for cutting off CO2 gas and only passing SO2. The experimental results are shown in Figure 12. The penetration time of in situ generated calcium carbonate as the desulfurization agent under the condition of cutting off CO2 is 405 s, which is higher than that of the CO2 + SO2 gas mixture of 342 s but lower than that of Ca(OH)2 as the adsorbent. It can be seen that the in situ generated CaCO3 has a certain desulfurization ability, but the desulfurization effect is lower than that of Ca(OH)2.
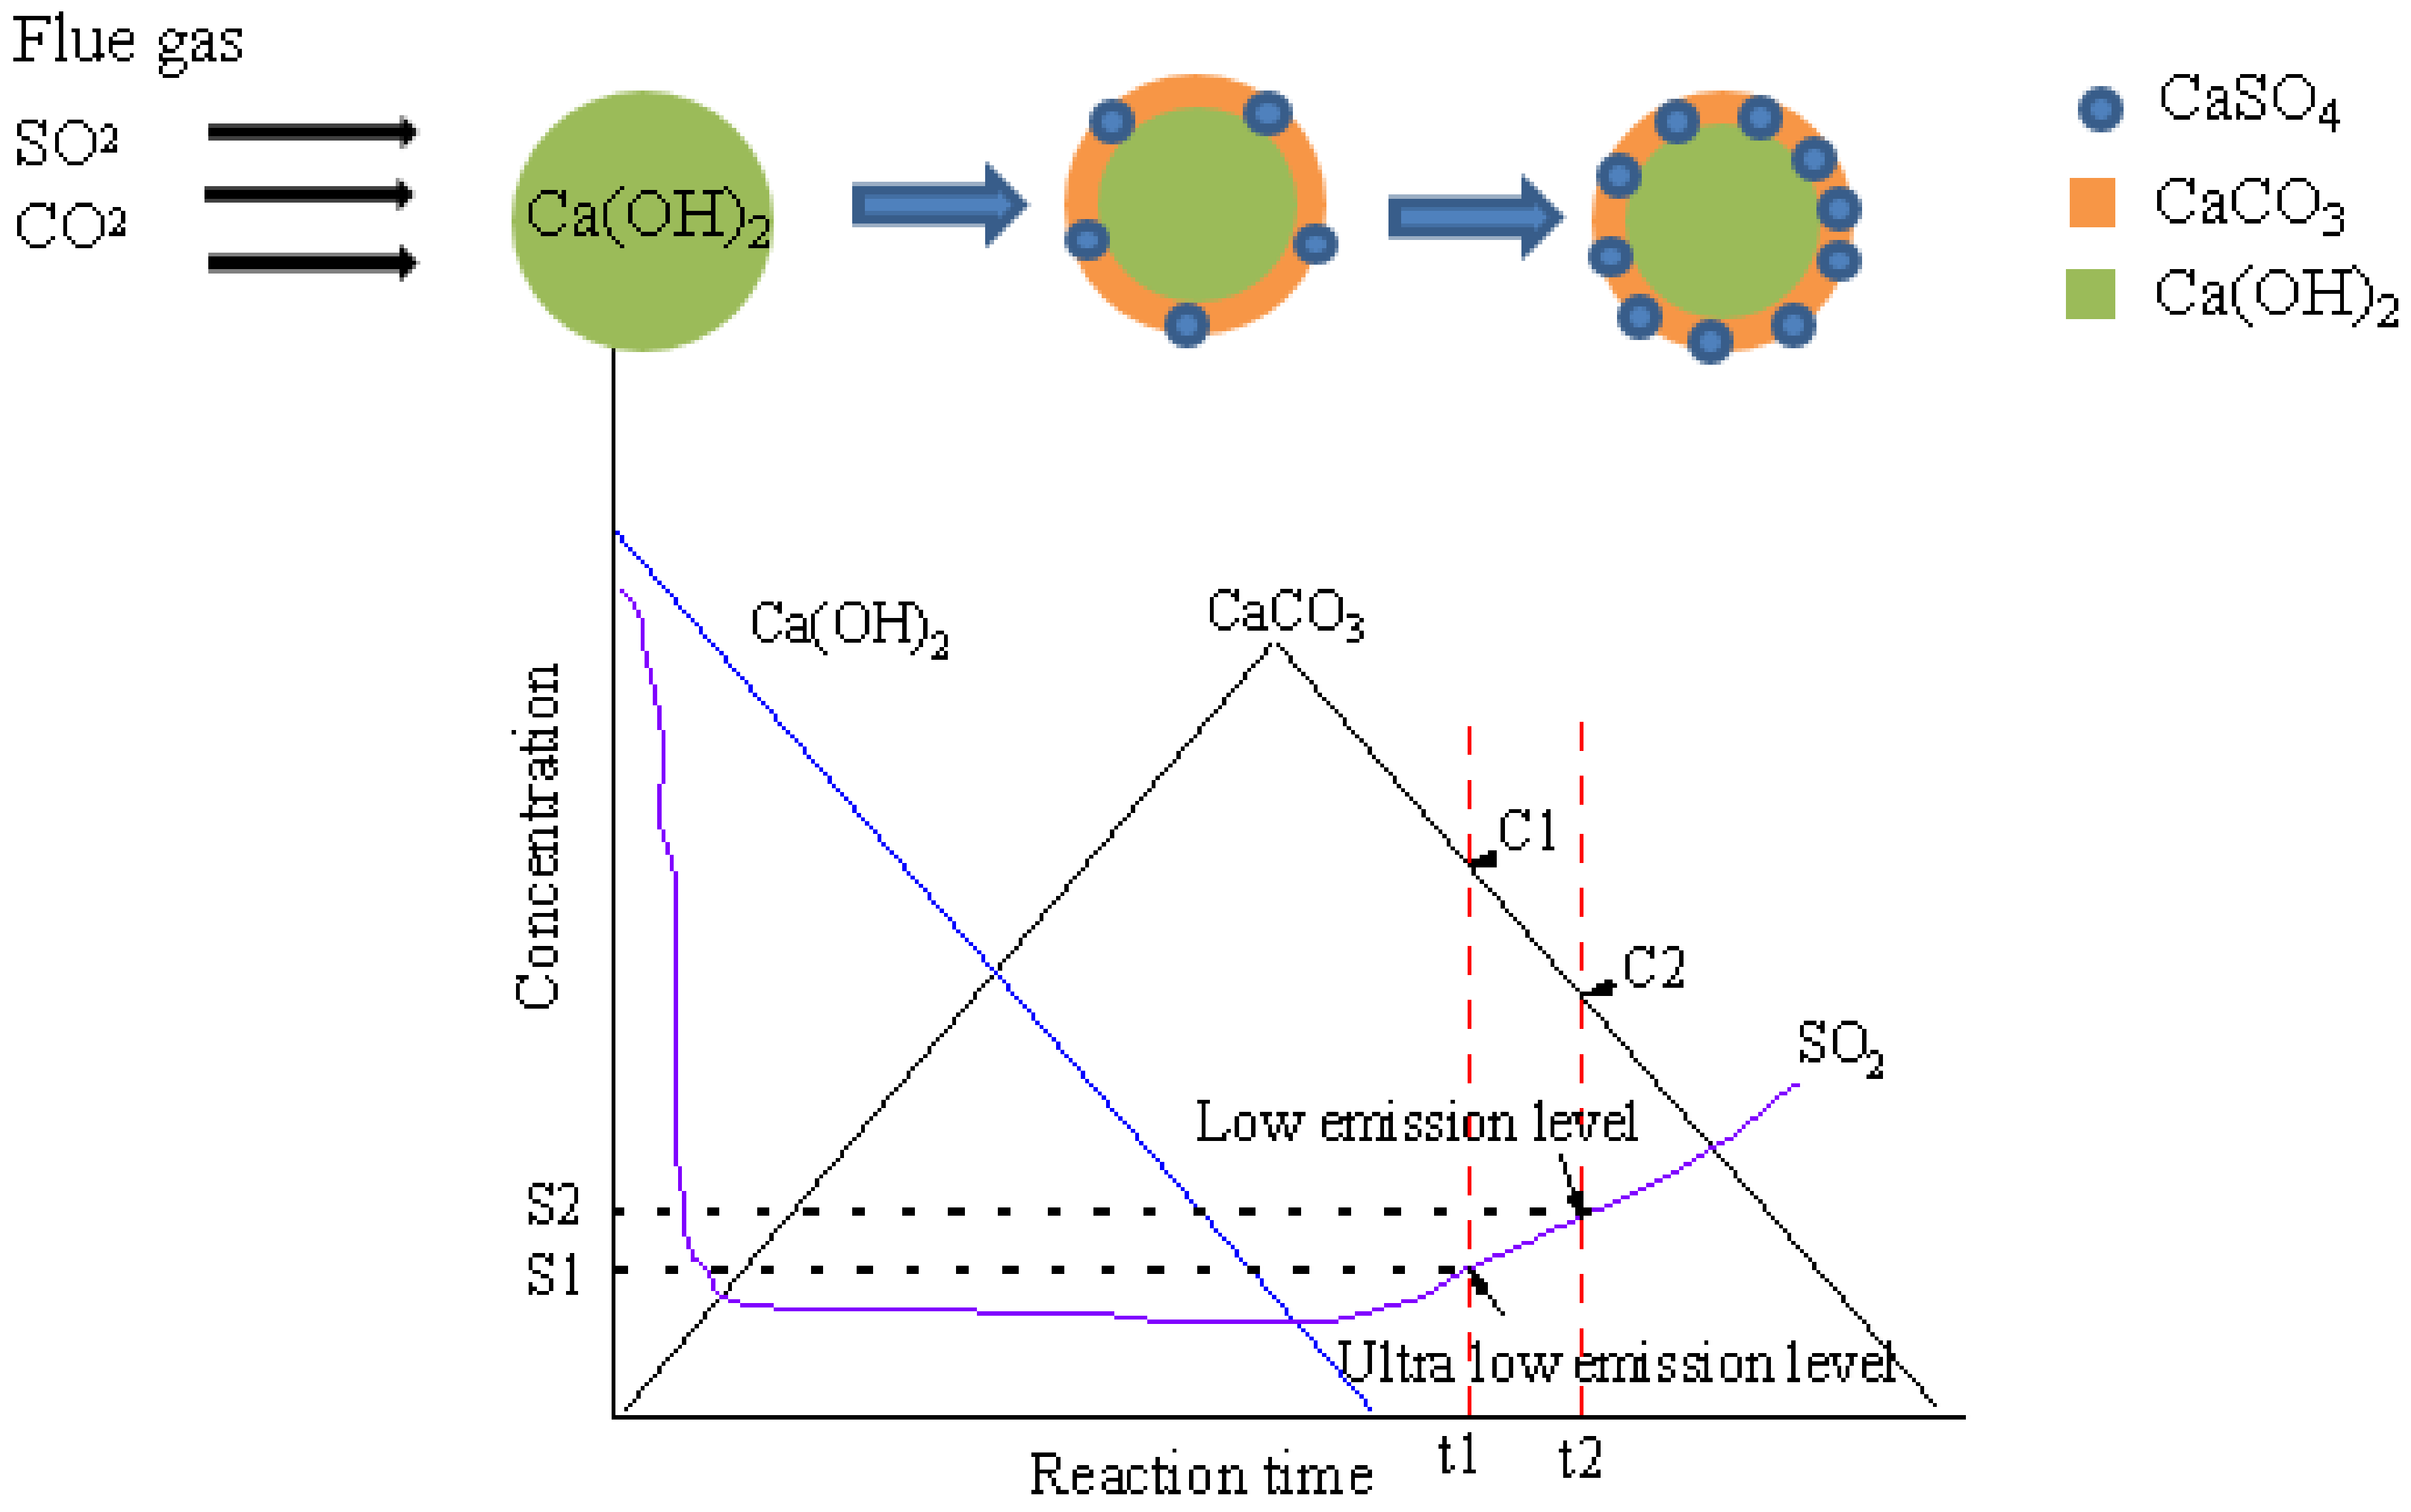
It can be presumed that in the sintering flue gas with high CO2 concentration and strong oxygen potential, CaCO3 and CaSO4 are more easily generated, and the reaction can be divided into three stages as shown in Figure 13. At the first stage, CO2 and SO2 react with Ca(OH)2 at the same time to generate CaCO3 and sulfate, and Ca(OH)2 is continuously consumed as shown Equations (9)–(11). CaCO3 is consumed by reacting with SO2 as in Equation (12), while the generation rate is higher than consumption rate, so the amount of CaCO3 is increasing.
At the second stage, Ca(OH)2 is consumed, the surface is wrapped by desulfurization production, and the desulfurization by Ca(OH)2 is weakened. On the contrary, CaCO3 concentration is increased, and CaCO3 is the main desulfurization component as in Equation (12). After the peak point, the amount of CaCO3 is decreased. At the third stage, the export SO2 concentration exceeds the set value, and the adsorbent fails.
CO2 + Ca(OH)2 = CaCO3 + H2O
SO2 + Ca(OH)2 = CaSO3 + H2O
CaSO3 + O2 = CaSO4
SO2 + CaCO3 = CaSO3 + CO2
After the implementation of the ultra-low emission standard in the steel industry, the limited emitting concentration of SO2 of sintering flue gas was decreased from the original 100 mg/Nm3 to 35 mg/Nm3. As shown in Figure 13, when the emission gas standards are reduced from S2 to S1, the penetration time of the absorbent is decreased from t2 to t1, so more fresh adsorbents are needed, and the corresponding CaCO3 content in the desulfurization ash C1 is also higher than that of C2, which is produced by the original emission standar

4. Conclusions

A series of experiments were carried out to study the effect of CO2 on the desulfurization of sintering flue gas with hydrated lime. The main conclusions can be summarized as follows: thermodynamic calculations showed that in the competitive relationship with Ca(OH)2, SO2 reacts more preferentially than CO2 under a thermodynamic standard state, and the desulfurization reaction is easier in the presence of oxygen. The penetration time of the adsorbent decreases with the increase in CO2 concentration, and the decrease is more obvious from the penetration of sulfur capacity, which indicates that CO2 is more likely to generate CaCO3 under the condition of moisture, thus impeding the desulfurization process. In situ generated calcium carbonate may have a desulfurization effect, but the desulfurization effect is not as good as Ca(OH)2.
However, a large proportion of CaCO3 was produced in the desulfurization ash under the condition that the CO2 concentration was absolutely dominant to SO2 in the sintering flue gas atmosphere.

Author Contributions

Conceptualization, J.H., Z.Q. and S.G.; methodology, Z.Q., X.Z. (Xinqing Zou), B.Z. and S.G.; formal analysis, J.H. and S.G.; investigation, Z.Q.; resources, J.H. and S.G.; writing—original draft preparation, Z.Q. and X.Z. (Xingli Zou); writing—review and editing, J.H., X.Z. (Xinqing Zou), S.G. and X.Z. (Xingli Zou); supervision, J.H.; project administration, S.G. and Y.Z.; funding acquisition, X.L. All authors have read and agreed to the published version of the manuscript.

Funding

This work was supported by the National Natural Science Foundation of China—the joint research fund of China Bao-Wu Iron and Steel Group Co., Ltd. (Grant Nos. U1860108 and U1860203), the National Natural Science Foundation of China (Nos. 52022054 and 51974181), the Shanghai Rising-Star Program (19QA1403600), and the Program for Professor of Special Appointment (Eastern Scholar) at Shanghai Institutions of Higher Learning (TP2019041) for financial support.

Data Availability Statement

The data presented in this study are available on request from the corresponding authors. The data are not publicly available due to privacy or ethical restrictions.

Conflicts of Interest

The authors declare no conflict of interest.

References

  1. Zhu, T.; Liu, Q.; Li, Y.; Yan, X.; Qi, F.; Ye, M. Emission Characteristics of Multiple Pollutants from Iron- Steel Sintering Flue Gas and Review of Control Technologies. Sci. Technol. Rev. 2014, 32, 51–56. [Google Scholar]
  2. Ke, X.W.; Cai, R.X.; Lyu, J.F.; Zhang, M.; Wu, Y.; Yang, H.R.; Zhang, H. Research Progress of the Effects of Ca-Based Sorbents on the NO_x Reaction in Circulating Fluidized Bed Boilers. Clean Coal Technol. 2019, 25, 1–11. [Google Scholar]
  3. Hao, R.; Zhang, Y.; Wang, Z.; Li, Y.; Yuan, B.; Mao, X.; Zhao, Y. An Advanced Wet Method for Simultaneous Removal of SO2 and NO from Coal-Fired Flue Gas by Utilizing a Complex Absorbent. Chem. Eng. J. 2017, 307, 562–571. [Google Scholar] [CrossRef]
  4. Du, J.; Cao, S. Research Status and Progress of Wet Flue Gas Desulfurization Technology. Appl. Chem. Ind. 2019, 48, 1495–1500. [Google Scholar]
  5. Ahlbeck, J.; Engman, T.; Fältén, S.; Vihma, M. A Method for Measuring the Reactivity of Absorbents for Wet Flue Gas Desulfurization. Chem. Eng. Sci. 1993, 48, 3479–3484. [Google Scholar] [CrossRef]
  6. Mohammed, M.Y.; Albayati, T.M.; Ali, A.M. Imidazolium-Based Ionic Liquids for Extraction of Sulfur Compounds from Real Heavy Crude Oil. Chem. Afr. 2022, 5, 1715–1722. [Google Scholar] [CrossRef]
  7. Mohammed, M.Y.; Ali, A.M.; Albayati, T.M. Choline Chloride-Based Deep Eutectic Solvents for Ultrasonic-Assisted Oxidative Desulfurization of Actual Heavy Crude Oil. Chem. Eng. Res. Des. 2022, 182, 659–666. [Google Scholar] [CrossRef]
  8. Khadim, A.T.; Albayati, T.M.; Cata Saady, N.M. Removal of Sulfur Compounds from Real Diesel Fuel Employing the Encapsulated Mesoporous Material Adsorbent Co/MCM-41 in a Fixed-Bed Column. Micropor. Mesopor. Mat. 2022, 341, 112020. [Google Scholar] [CrossRef]
  9. Li, X.; Han, J.; Liu, Y.; Dou, Z.; Zhang, T. Summary of Research Progress on Industrial Flue Gas Desulfurization Technology. Sep. Purif. Technol. 2022, 281, 119849. [Google Scholar] [CrossRef]
  10. Sun, L.; Li, K.; Tang, L.; Liu, N.; Ning, P.; Sun, X.; Zhang, X. Research Progress of Common Metal Oxides for Flue Gas Desulfurization. Chem. Ind. Eng. Prog. 2017, 36, 181–188. [Google Scholar] [CrossRef]
  11. Liu, F.; Cai, M.; Liu, X.; Zhu, T.; Zou, Y. O3 Oxidation Combined with Semi-Dry Method for Simultaneous Desulfurization and Denitrification of Sintering/Pelletizing Flue Gas. J. Environ. Sci. 2021, 104, 253–263. [Google Scholar] [CrossRef]
  12. Wu, Z.; Zeng, Y.; Song, F.; Zhang, S.; Zhong, Q. Active Sites Assembly Effect on CeO2-WO3-TiO2 Catalysts for Selective Catalytic Reduction of NO with NH3. Mol. Catal. 2019, 479, 110549. [Google Scholar] [CrossRef]
  13. Han, K.; Lu, C. Kinetic Model and Simulation of Promoted Selective Non-Catalytic Reduction by Sodium Carbonate. Chin. J. Chem. Eng. 2007, 15, 512–519. [Google Scholar] [CrossRef]
  14. Guo, Y.; Li, Y.; Zhu, T.; Ye, M. Effects of Concentration and Adsorption Product on the Adsorption of SO2 and NO on Activated Carbon. Energy Fuels 2013, 27, 360–366. [Google Scholar] [CrossRef]
  15. Li, B.; Wu, H.; Liu, X.; Zhu, T.; Liu, F.; Zhao, X. Simultaneous Removal of SO2 and NO Using a Novel Method with Red Mud as Absorbent Combined with O3 Oxidation. J. Hazard. Mater. 2020, 392, 122270. [Google Scholar] [CrossRef]
  16. Ma, Q.; Wang, Z.; Lin, F.; Kuang, M.; Whiddon, R.; He, Y.; Liu, J. Characteristics of O3 Oxidation for Simultaneous Desulfurization and Denitration with Limestone–Gypsum Wet Scrubbing: Application in a Carbon Black Drying Kiln Furnace. Energy Fuels 2016, 30, 2302–2308. [Google Scholar] [CrossRef]
  17. Liu, C.; Shih, S. A Surface Coverage Model for the Reaction of Ca(OH)2 with SO2 at Low Temperatures. J. Chin. Inst. Chem. Eng. 2002, 33, 407–413. [Google Scholar]
  18. Lin, R.; Shih, S.; Liu, C. Characteristics and Reactivities of Ca(OH)2/Silica Fume Sorbents for Low-Temperature Flue Gas Desulfurization. Chem. Eng. Sci. 2003, 58, 3659–3668. [Google Scholar] [CrossRef]
  19. Liu, D.; Kuriyama, A. Influence between Desulfurization and Defluorination Reactions Using Ca(OH)2 in the Simulated Coal-Briquettes. J. Jpn. Inst. Energy 2019, 98, 44–51. [Google Scholar] [CrossRef] [Green Version]
  20. Lin, R.; Shih, S.; Liu, C. Structural Properties and Reactivities of Ca(OH)2/Fly Ash Sorbents for Flue Gas Desulfurization. Ind. Eng. Chem. Res. 2003, 42, 1350–1356. [Google Scholar] [CrossRef]
  21. Renedo, M.; Gonzalez, F.; Pesquera, C.; Fernandez, J. Study of Sorbents Prepared from Clays and CaO or Ca(OH)2 for SO2 Removal at Low Temperature. Ind. Eng. Chem. Res. 2006, 45, 3752–3757. [Google Scholar] [CrossRef]
  22. Wang, W.; Hu, M.; Dong, Y.; Ma, C. Study on the Effect of CO2 on the Consumption of Desulfurizing Agent Ca(OH)2 in Flue Gas Desulfurization. Ind. Eng. Chem. Res. 2010, 49, 1444–1449. [Google Scholar] [CrossRef]
  23. Zhao, R.; Liu, H.; Ye, S.; Xie, Y.; Chen, Y. Ca-Based Sorbents Modified with Humic Acid for Flue Gas Desulfurization. Ind. Eng. Chem. Res. 2006, 45, 7120–7125. [Google Scholar] [CrossRef]
  24. Ghosh-Dastidar, A.; Mahuli, S.; Agnihotri, R.; Fan, L.-S. Ultrafast Calcination and Sintering of Ca(OH)2 Powder: Experimental and Modeling. Chem. Eng. Sci. 1995, 50, 2029–2040. [Google Scholar] [CrossRef]
  25. Wang, Z.; Chen, L.; Yue, S.; Wang, C. Microstructure Evolution of Procedural Products during Limestone Simultaneous Calcination/Sulfation. CIESC J. 2018, 69, 2149–2157. [Google Scholar]
  26. Anthony, E.J.; Granatstein, D.L. Sulfation Phenomena in Fluidized Bed Combustion Systems. Prog. Energy Combust. Sci. 2001, 27, 215–236. [Google Scholar] [CrossRef]
  27. Gutiérrez Ortiz, F.J.; Ollero, P. A Realistic Approach to Modeling an In-Duct Desulfurization Process Based on an Experimental Pilot Plant Study. Chem. Eng. J. 2008, 141, 141–150. [Google Scholar] [CrossRef]
  28. Lyu, J.; Huang, L.; Teng, D.; Fu, H.; Li, T.; Chen, H. Effect of Relative Humidity on Dry Flue Gas Desulfurization by Calcium-Based Desulfurizer. Chin. J. Environ. Eng. 2020, 14, 1563–1569. [Google Scholar]
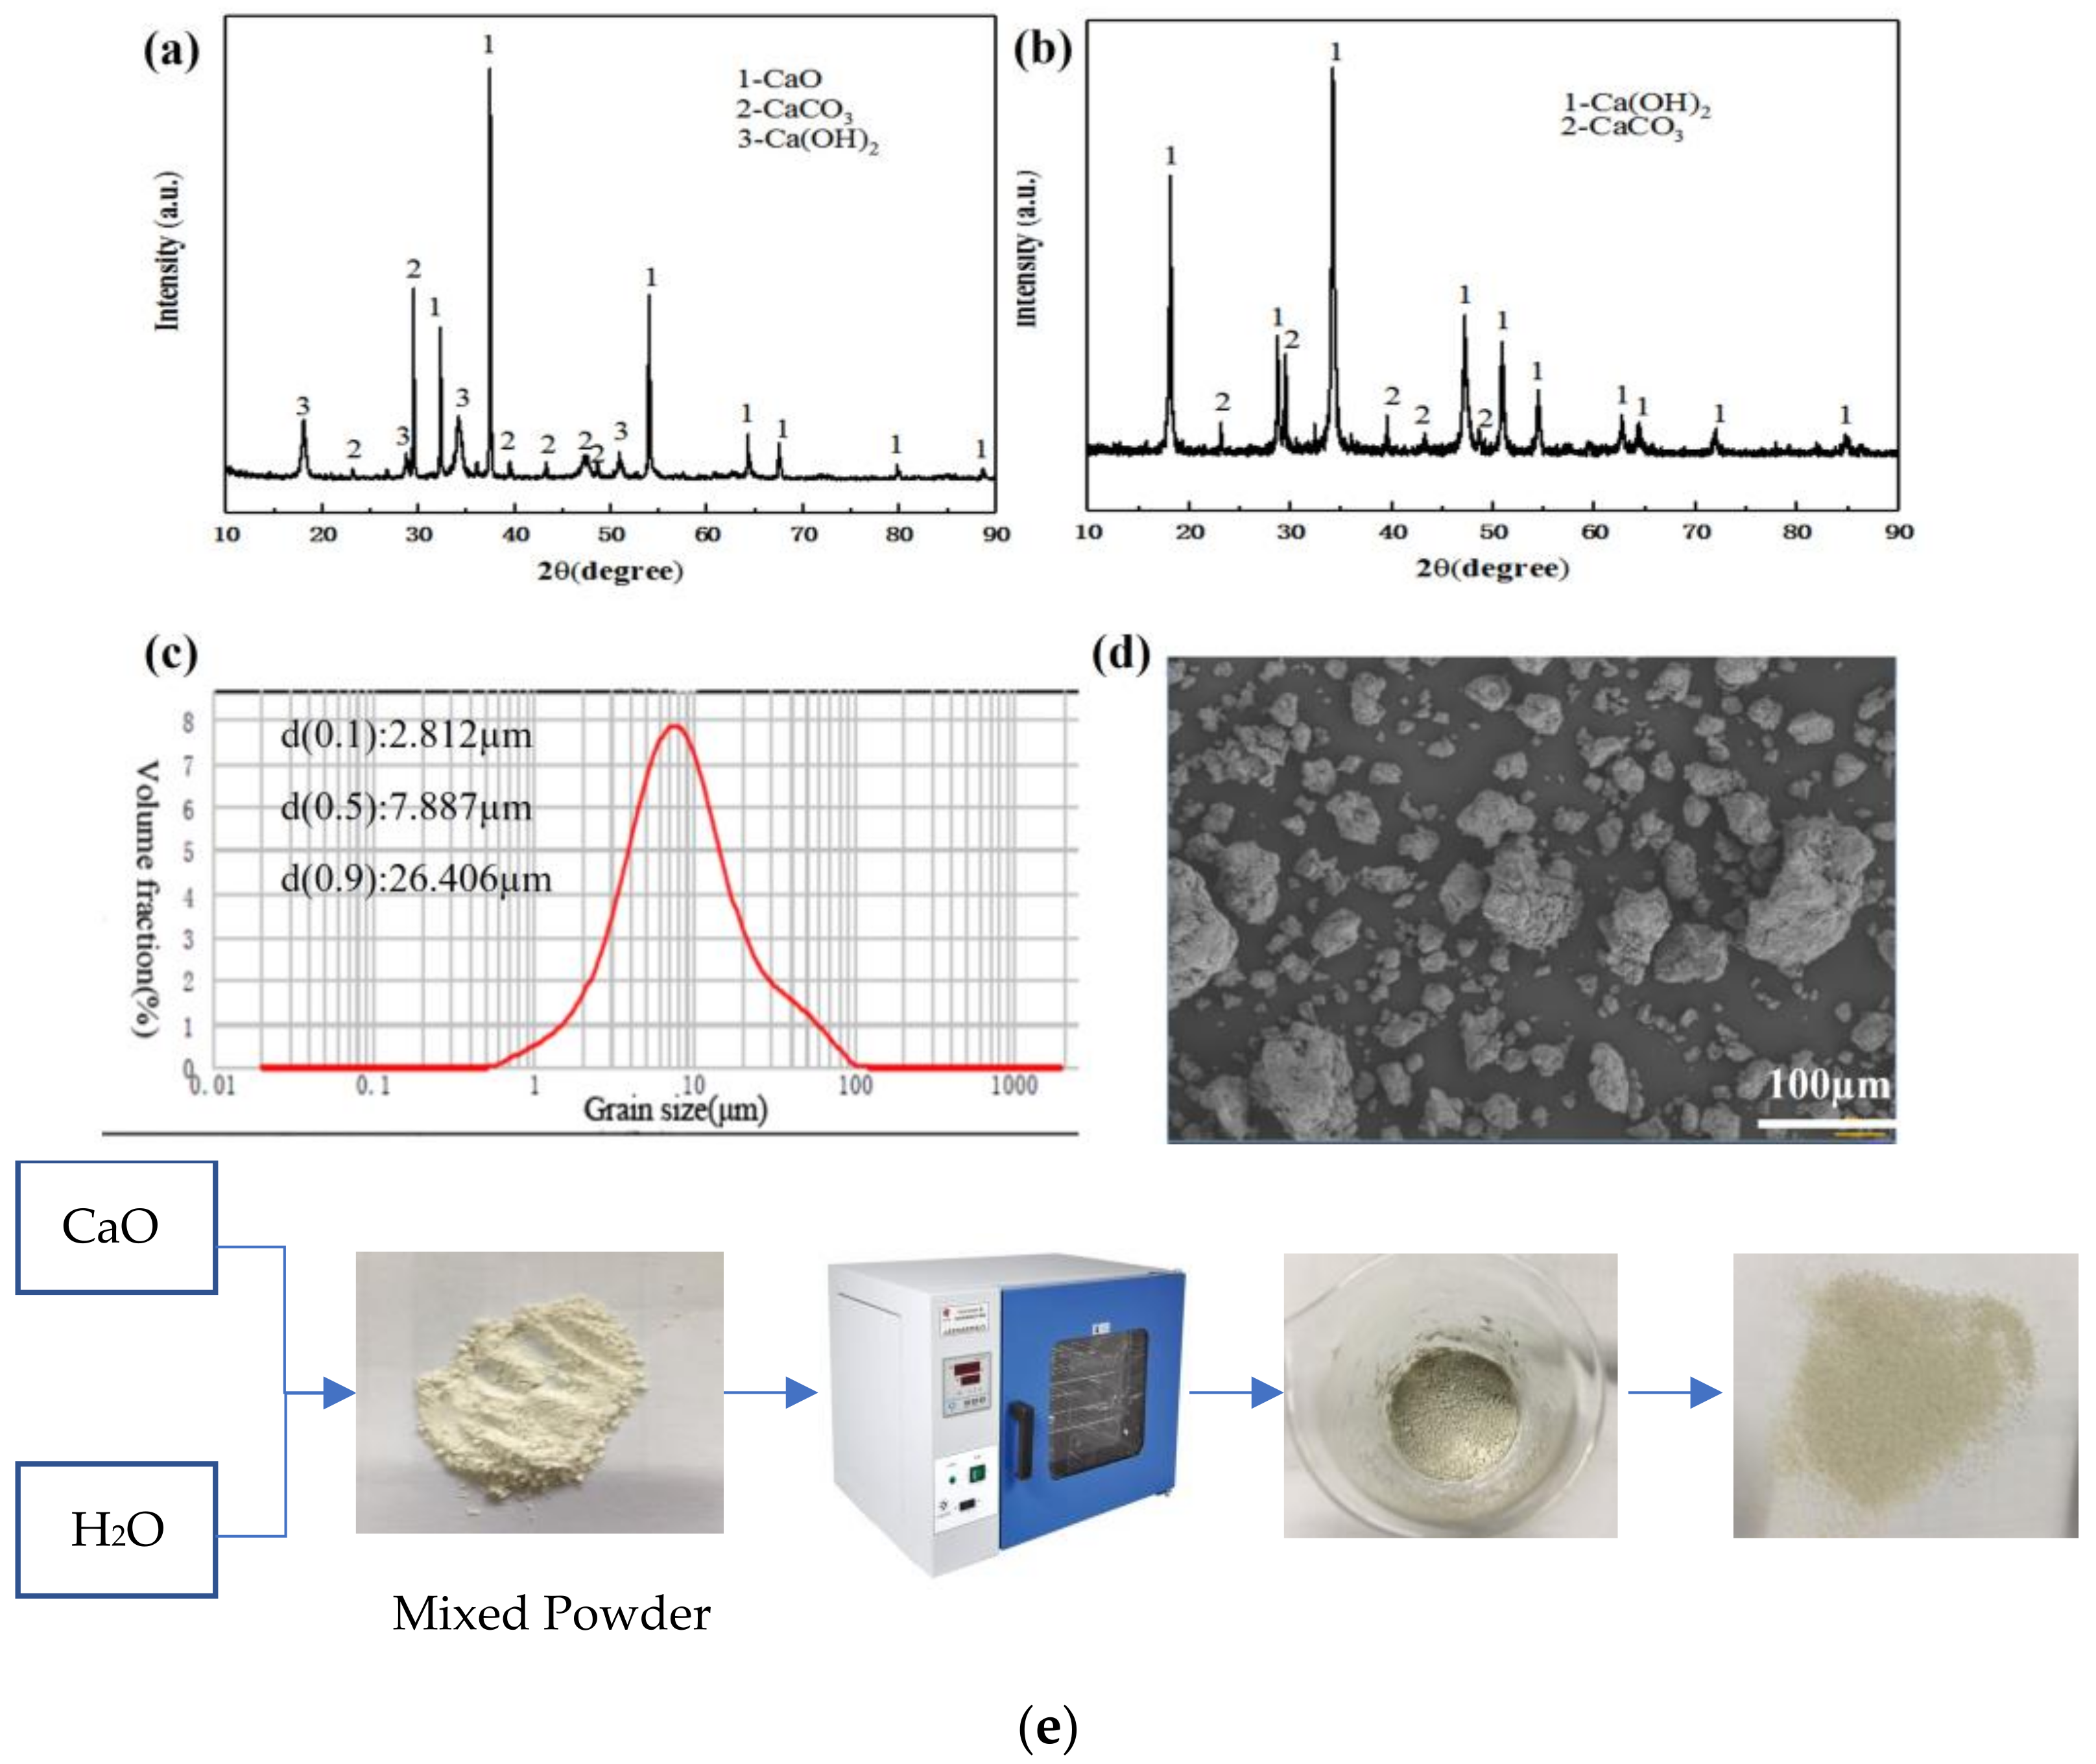
Figure 1. (a) XRD of raw quicklime; (b) XRD of digested sample; (c) particle size distribution of quicklime; (d) SEM; (e) the flow chart of the sample production processes.
Materials 16 00303 g001
Figure 2. TG-DSC curves of raw quicklime.
Materials 16 00303 g002
Figure 3. Isothermal adsorption and desorption curves (a) and pore size distribution curve (b) of quicklime.
Materials 16 00303 g003
Figure 4. Schematic diagram of experimental system.
Materials 16 00303 g004
Figure 5. The ΔGθ-T diagram of chemical reactions of (a) Ca(OH)2 and mixed gas; (b) CaCO3 and mixed gas.
Materials 16 00303 g005
Figure 6. Effect of temperature on desulfurization performance of adsorbent (RH = 0%, SO2 = 1200 mg/Nm3).
Materials 16 00303 g006
Figure 7. Effect of CO2 concentrations on (a) desulfurization performance; (b) sulfur penetration capacity; (c) relative content of Ca(OH)2 and CaCO3 in desulfurization as4. Effect of relative humidity on desulfurization performance of adsorbent
Materials 16 00303 g007
Figure 8. Effect of relative humidity on (a) the desulfurization performance and (b) penetration sulfur capacity of desulfurization agent.
Materials 16 00303 g008
Figure 9. (a) Effect of different CO2 contents on desulfurization time; (b) sulfur penetration capacity of adsorbents at 20% relative humidity.
Materials 16 00303 g009
Figure 10. Surface morphology of adsorbent: (a) original desulfurization; (b) 2.5%; (c) 5.5%; (d) 7.5%.
Materials 16 00303 g010
Figure 11. (a) Composition analysis; (b) TG curves of desulfurized ash under different CO2 atmosphere6. The mechanism of CaCO3 on the desulfurization process
Materials 16 00303 g011
Figure 12. Effect of CaCO3 on (a) desulfurization and (b) desulfurization penetration time under different conditions.
Materials 16 00303 g012
Figure 13. Schematic diagram of desulfurization process of sintering flue gas.
Materials 16 00303 g013
Table 1. XRF element analysis of dried quicklime samples (wt.%).
ElementsCaMgFeAlSiK
Wt.%88.260.830.620.470.350.23
Table 2. Gas composition and flow rate
Gas TypeMixed GasSO2N2
Concentration10%CO2 + 5%O2 + surplus N24200 ppm99.99%
Table 3. BET and pore structure parameters of desulfurization products with different CO2 concentrations.
SamplesBET Specific Surface Area/m2∙g−1Average Pore Size/nmPore Volume/cm3∙g−1
Original adsorbent11.74166.140.049
0% CO210.87126.180.036
2.5% CO27.56163.120.033
5.5% CO28.91137.210.033
7.5% CO27.63136.300.028
Disclaimer/Publisher’s Note: The statements, opinions and data contained in all publications are solely those of the individual author(s) and contributor(s) and not of MDPI and/or the editor(s). MDPI and/or the editor(s) disclaim responsibility for any injury to people or property resulting from any ideas, methods, instructions or products referred to in the content.