
Evaluation of Flexible Central Buckles on Short Suspenders’ Corrosion Fatigue Degradation on a Suspension Bridge under Traffic Load

Abstract
:1. Introduction
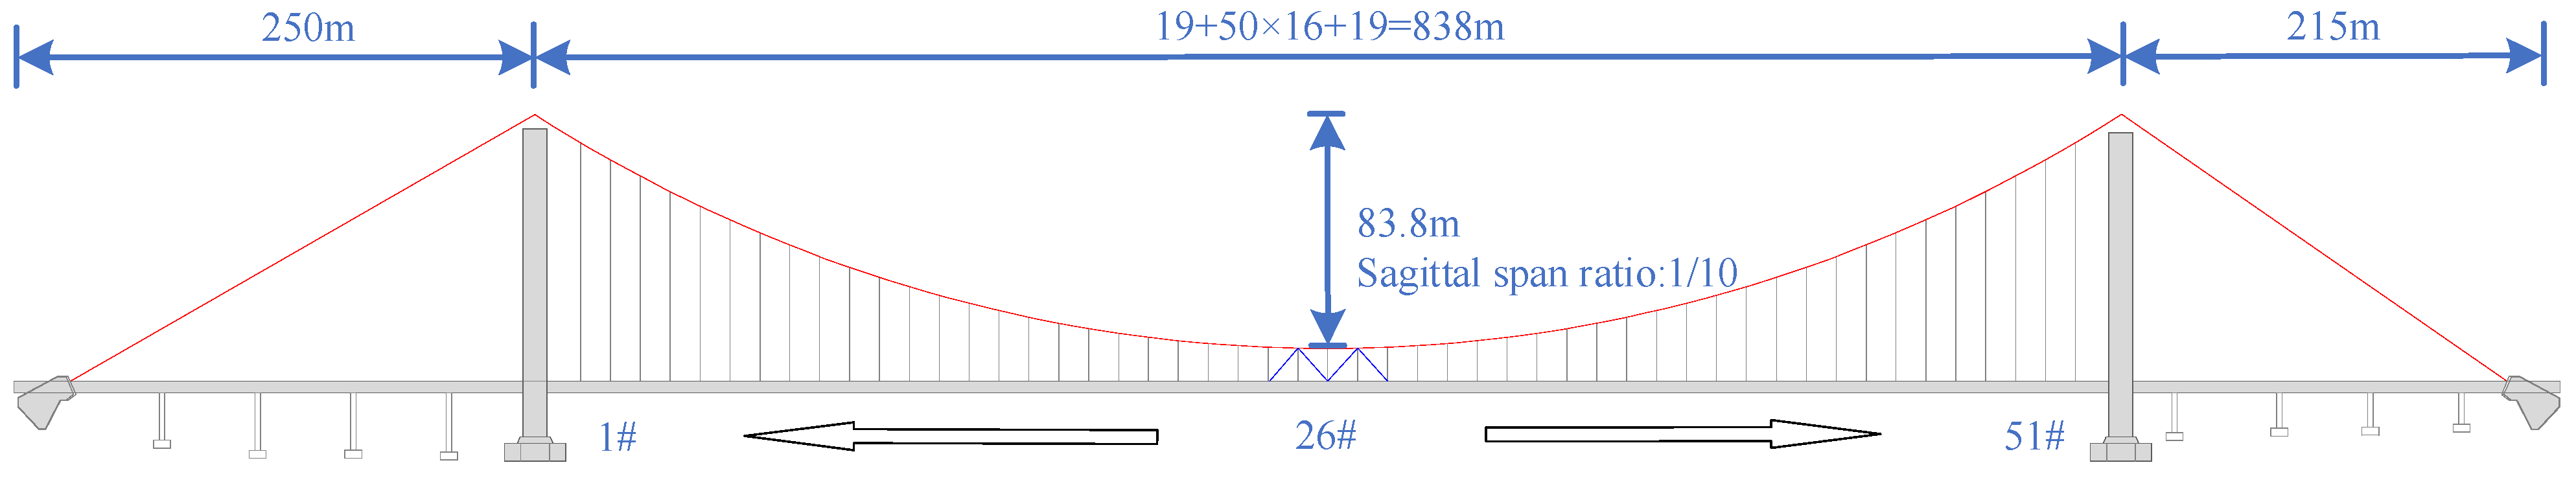
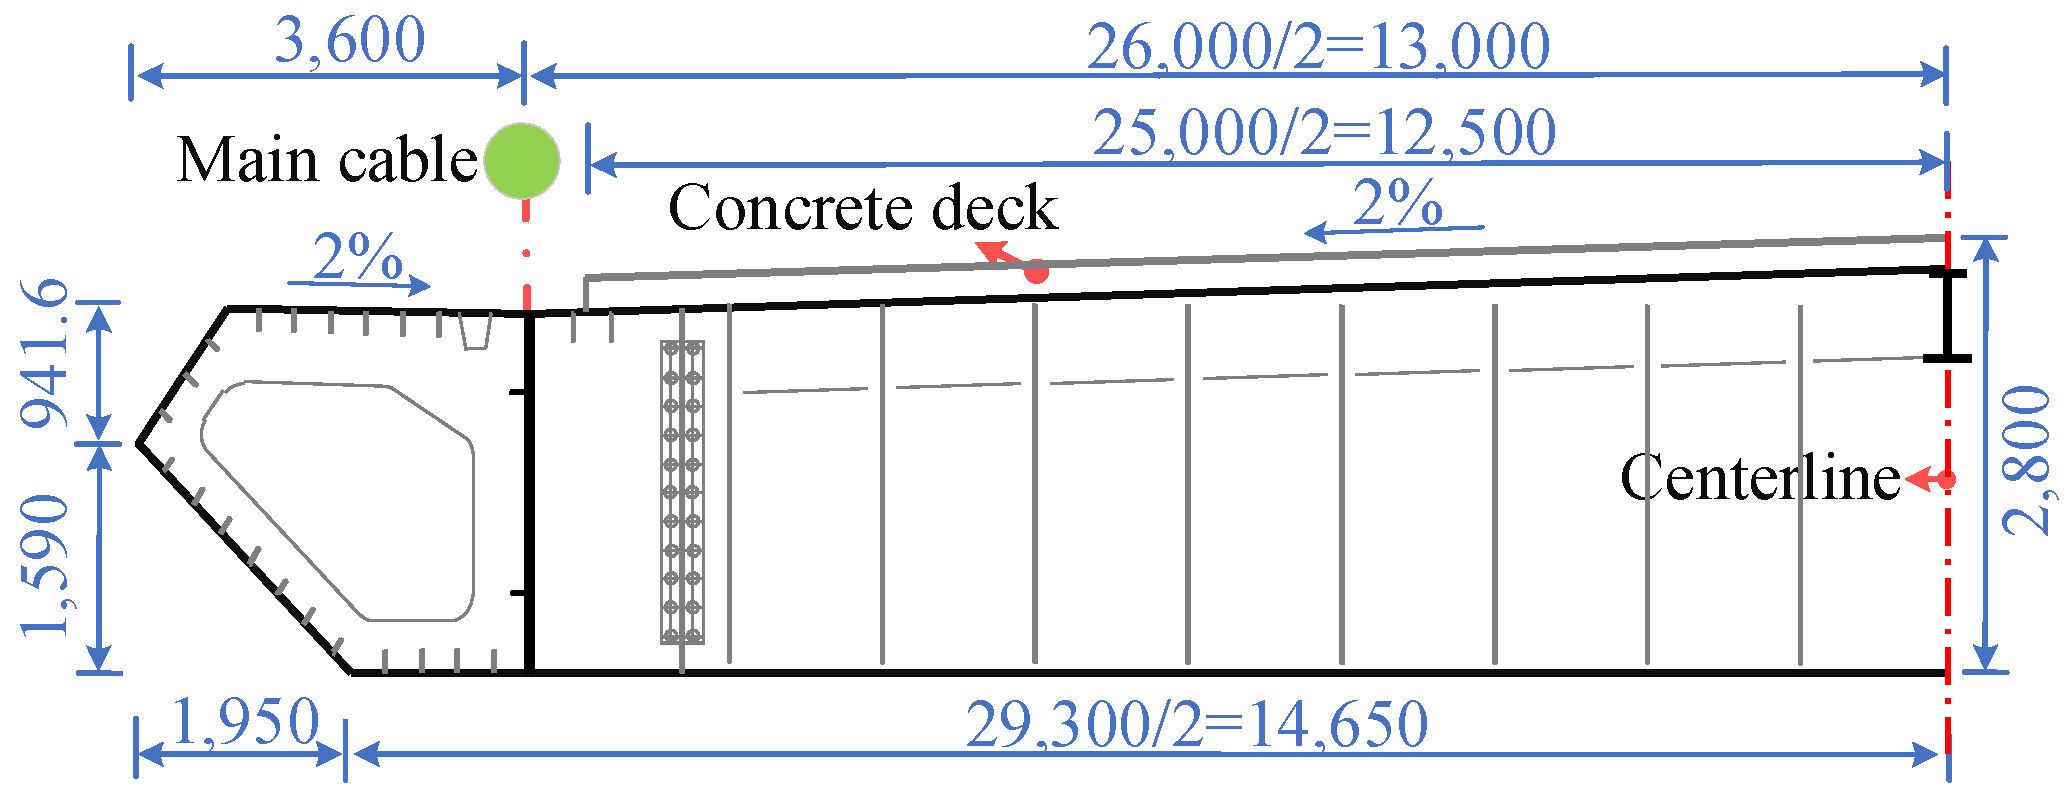
2. Prototype Bridge
2.1. Bridge Information
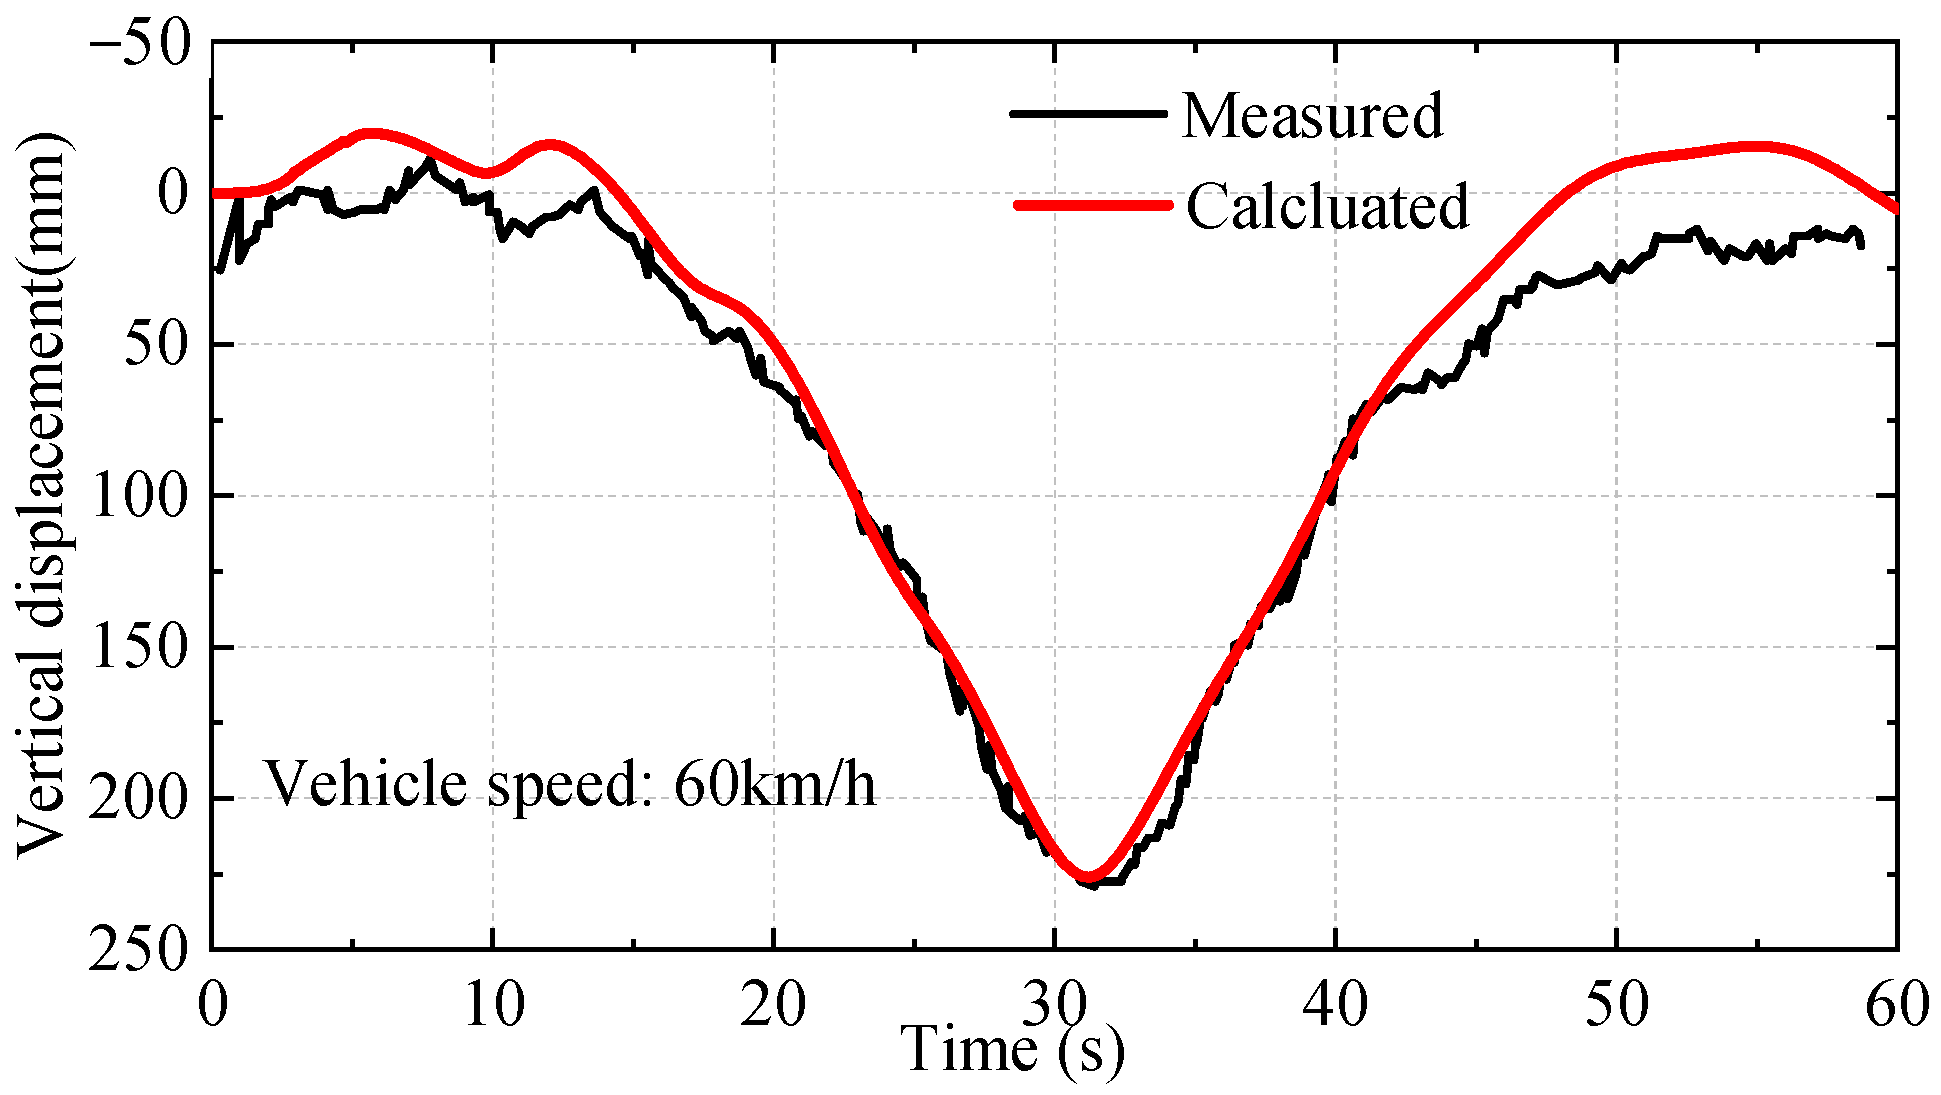
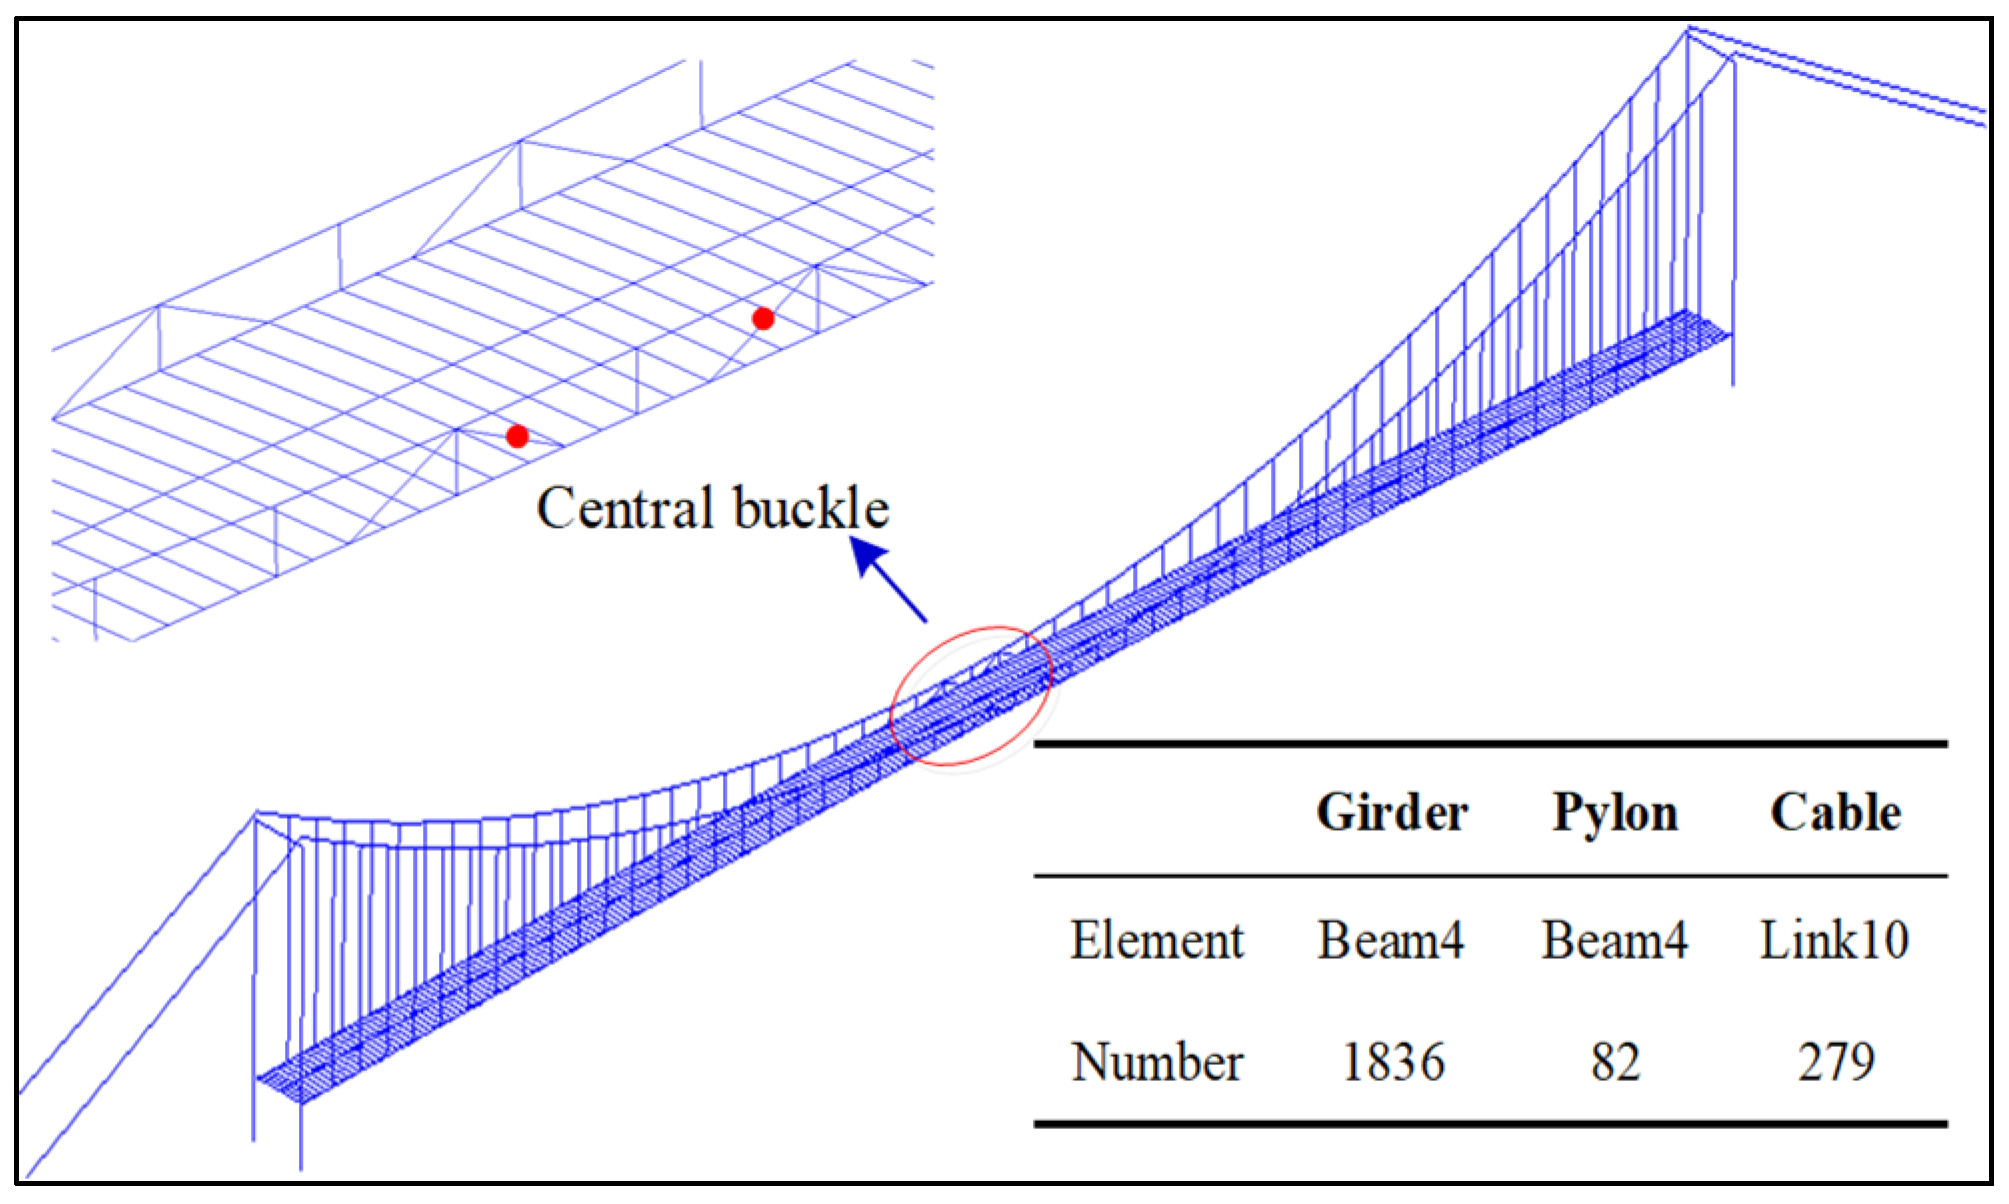
2.2. Finite Element (FE) Model
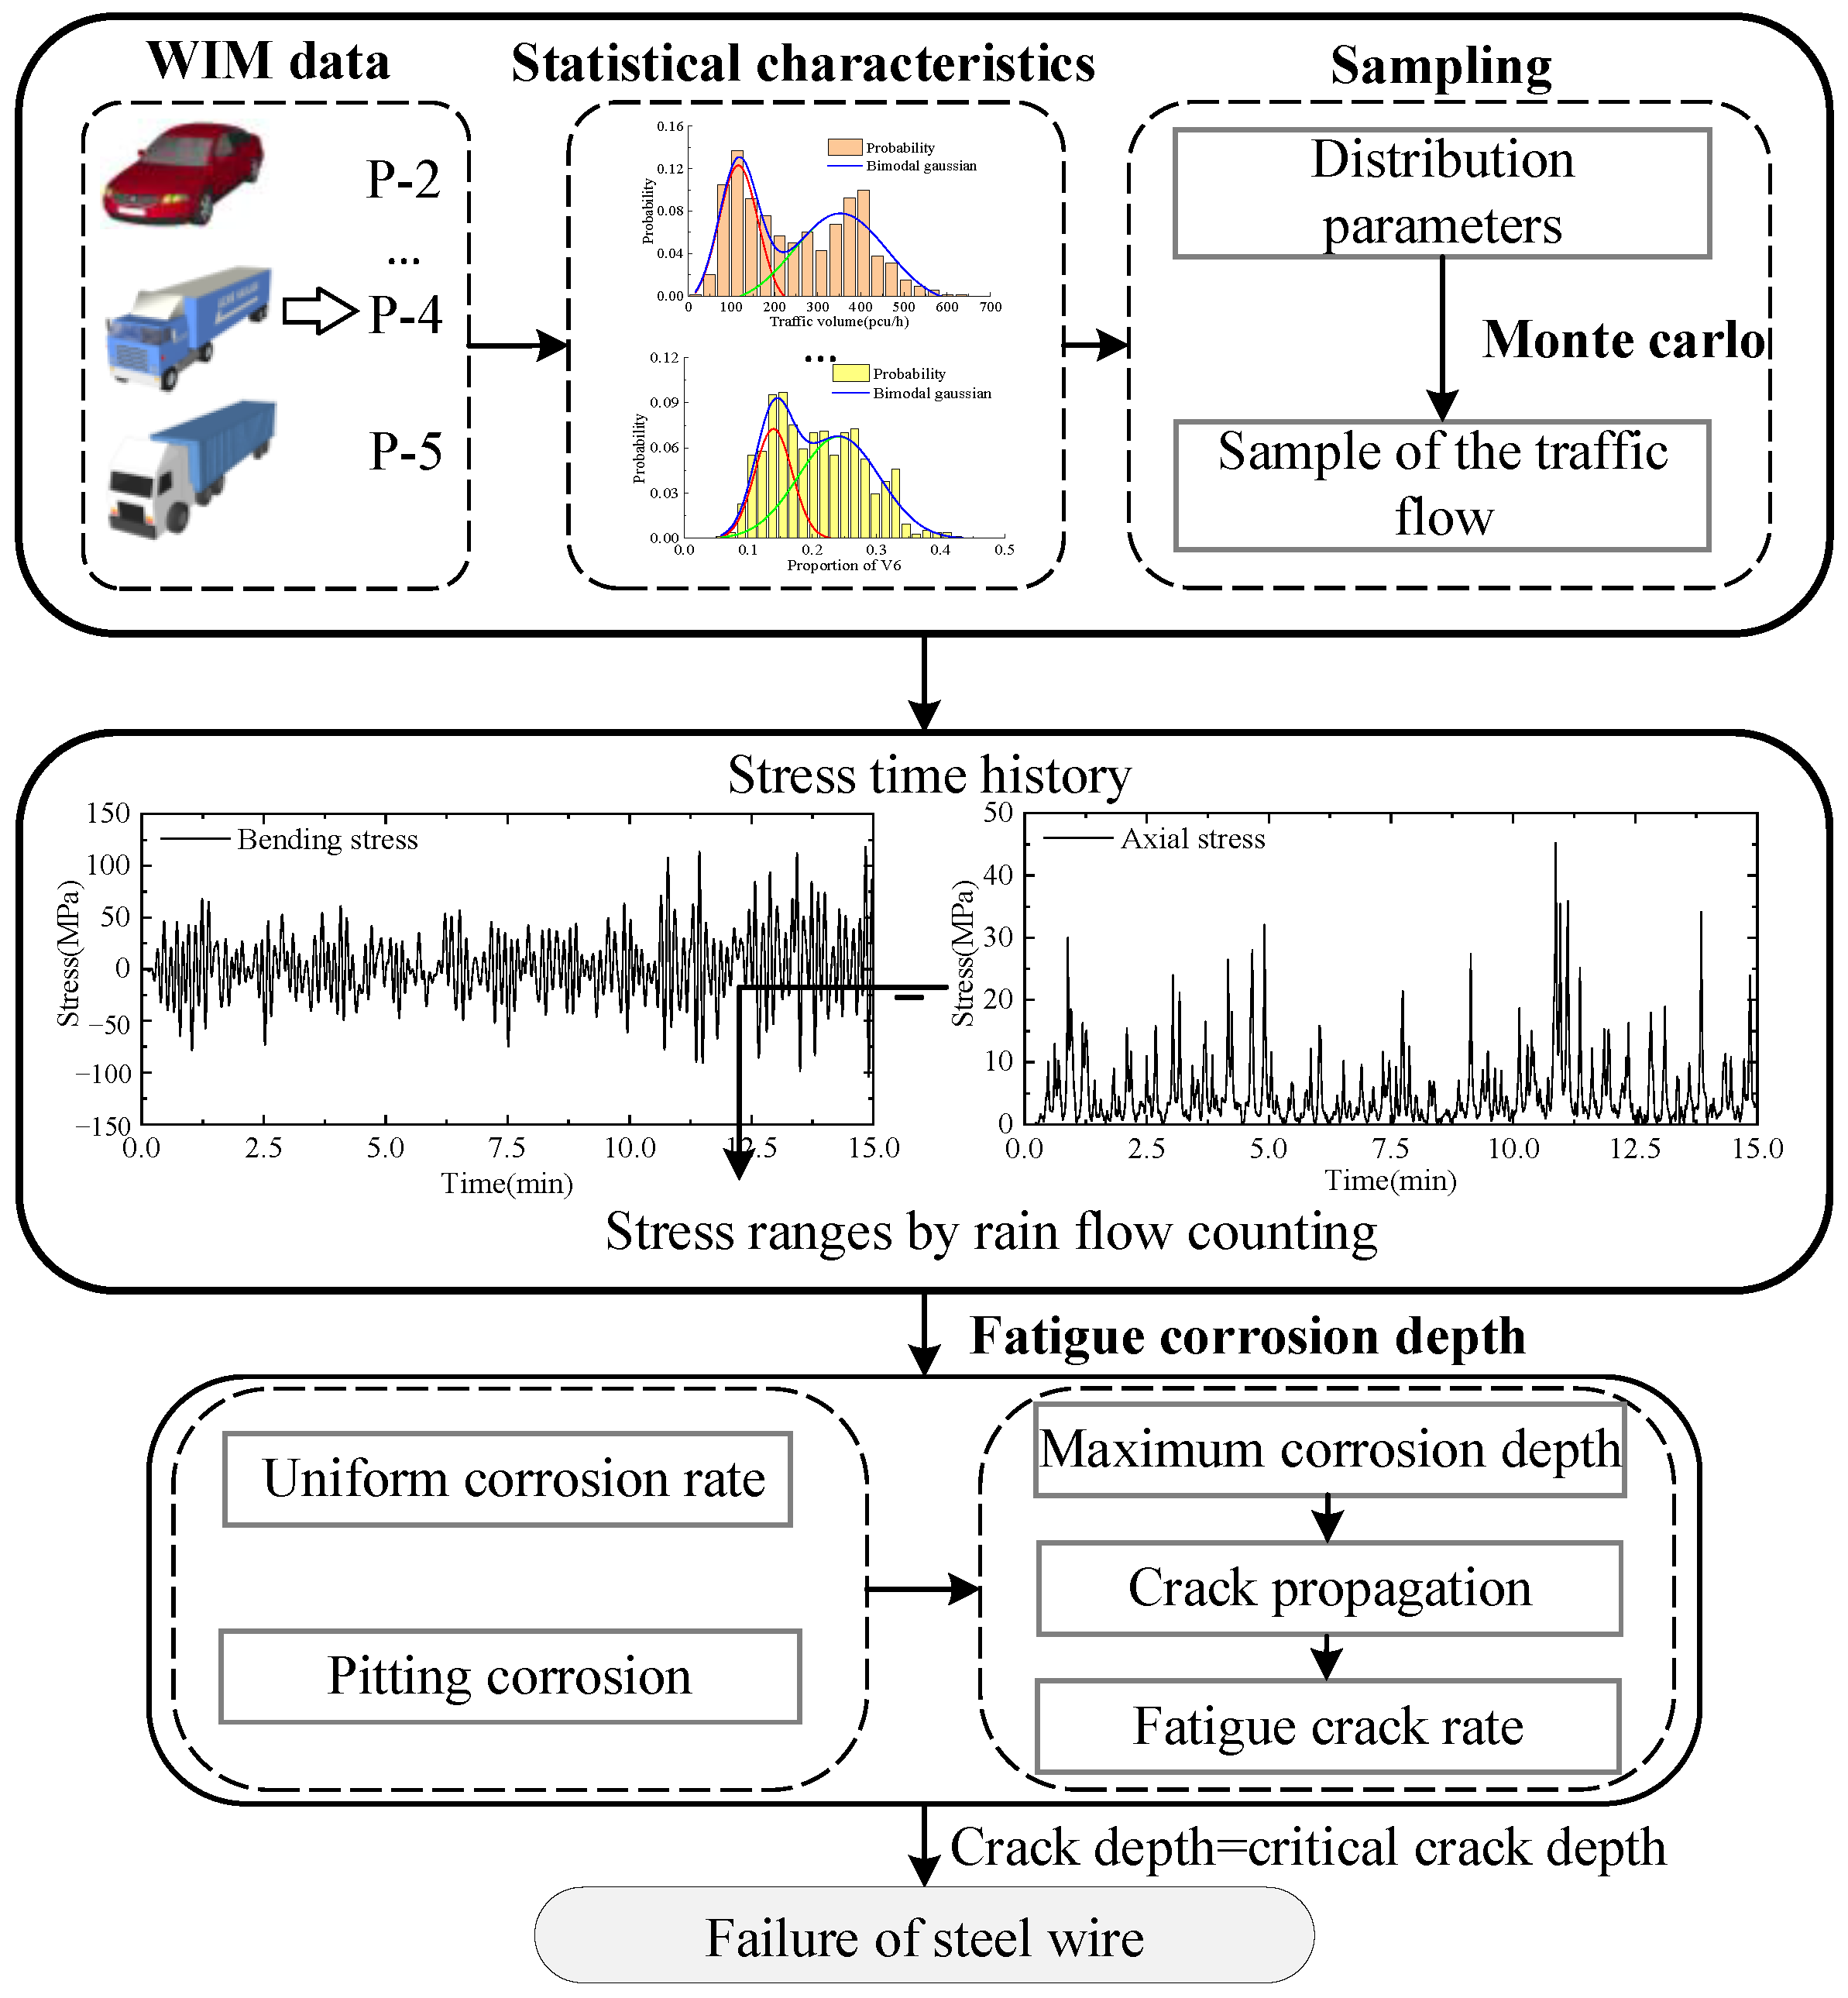
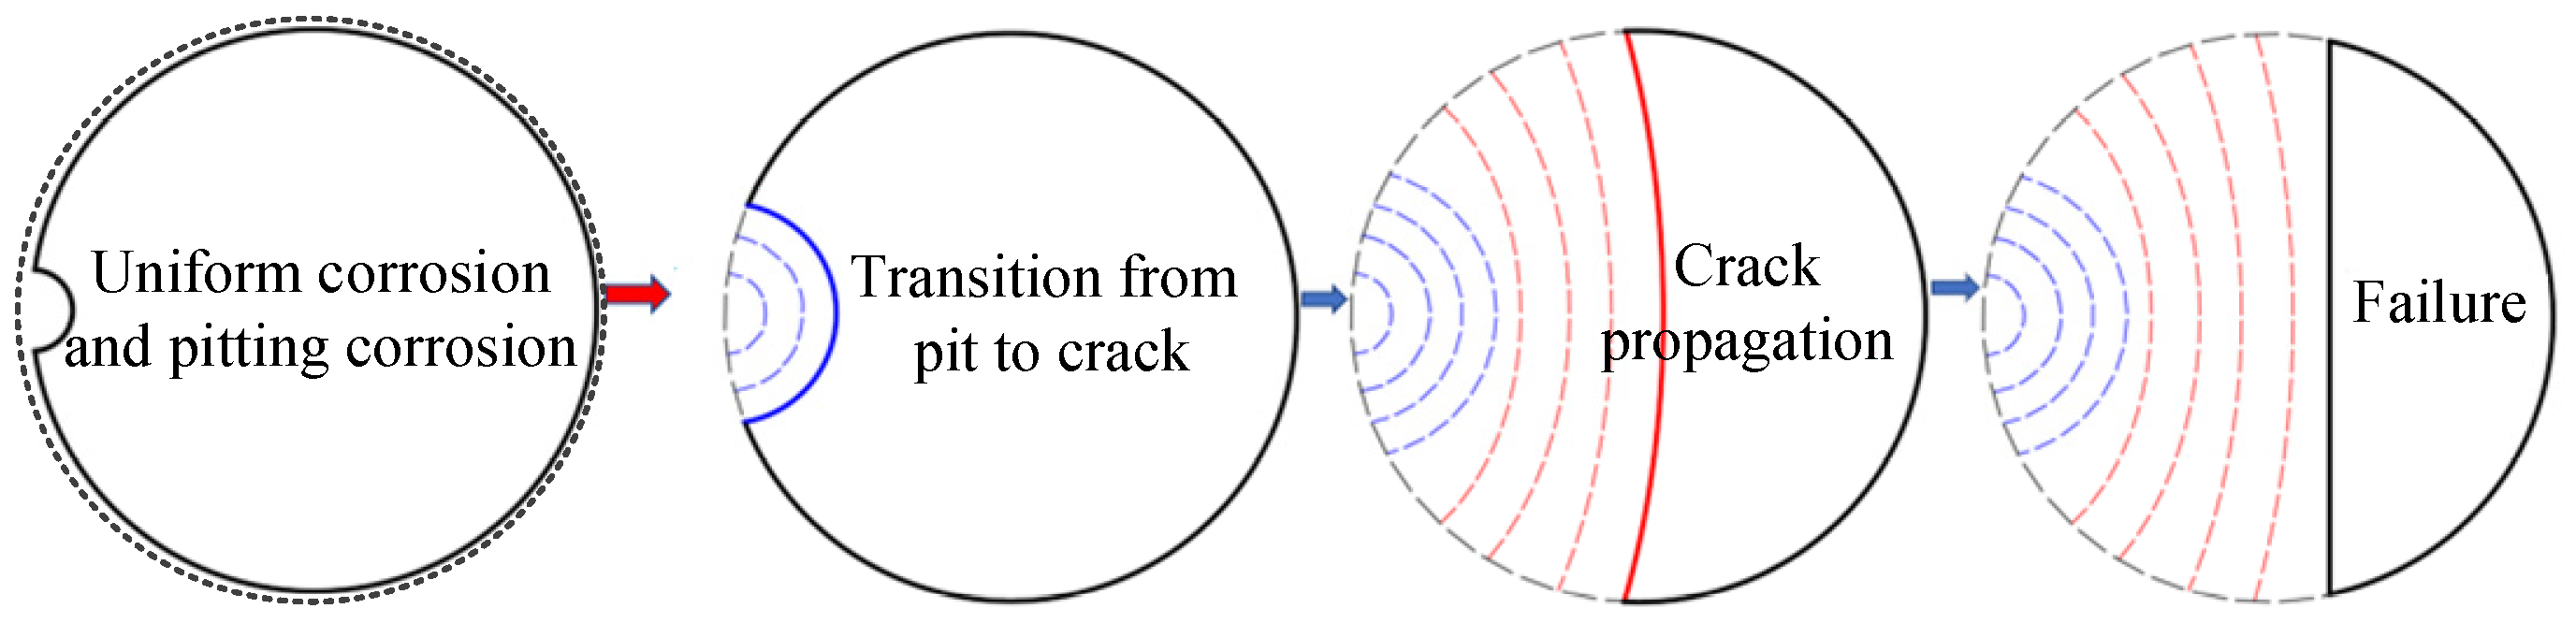
3. Corrosion Fatigue of Suspender Steel Wire
3.1. Corrosion Fatigue Mechanism
3.2. Uniform Corrosion and Pitting Corrosion
3.3. Corrosion Fatigue Crack
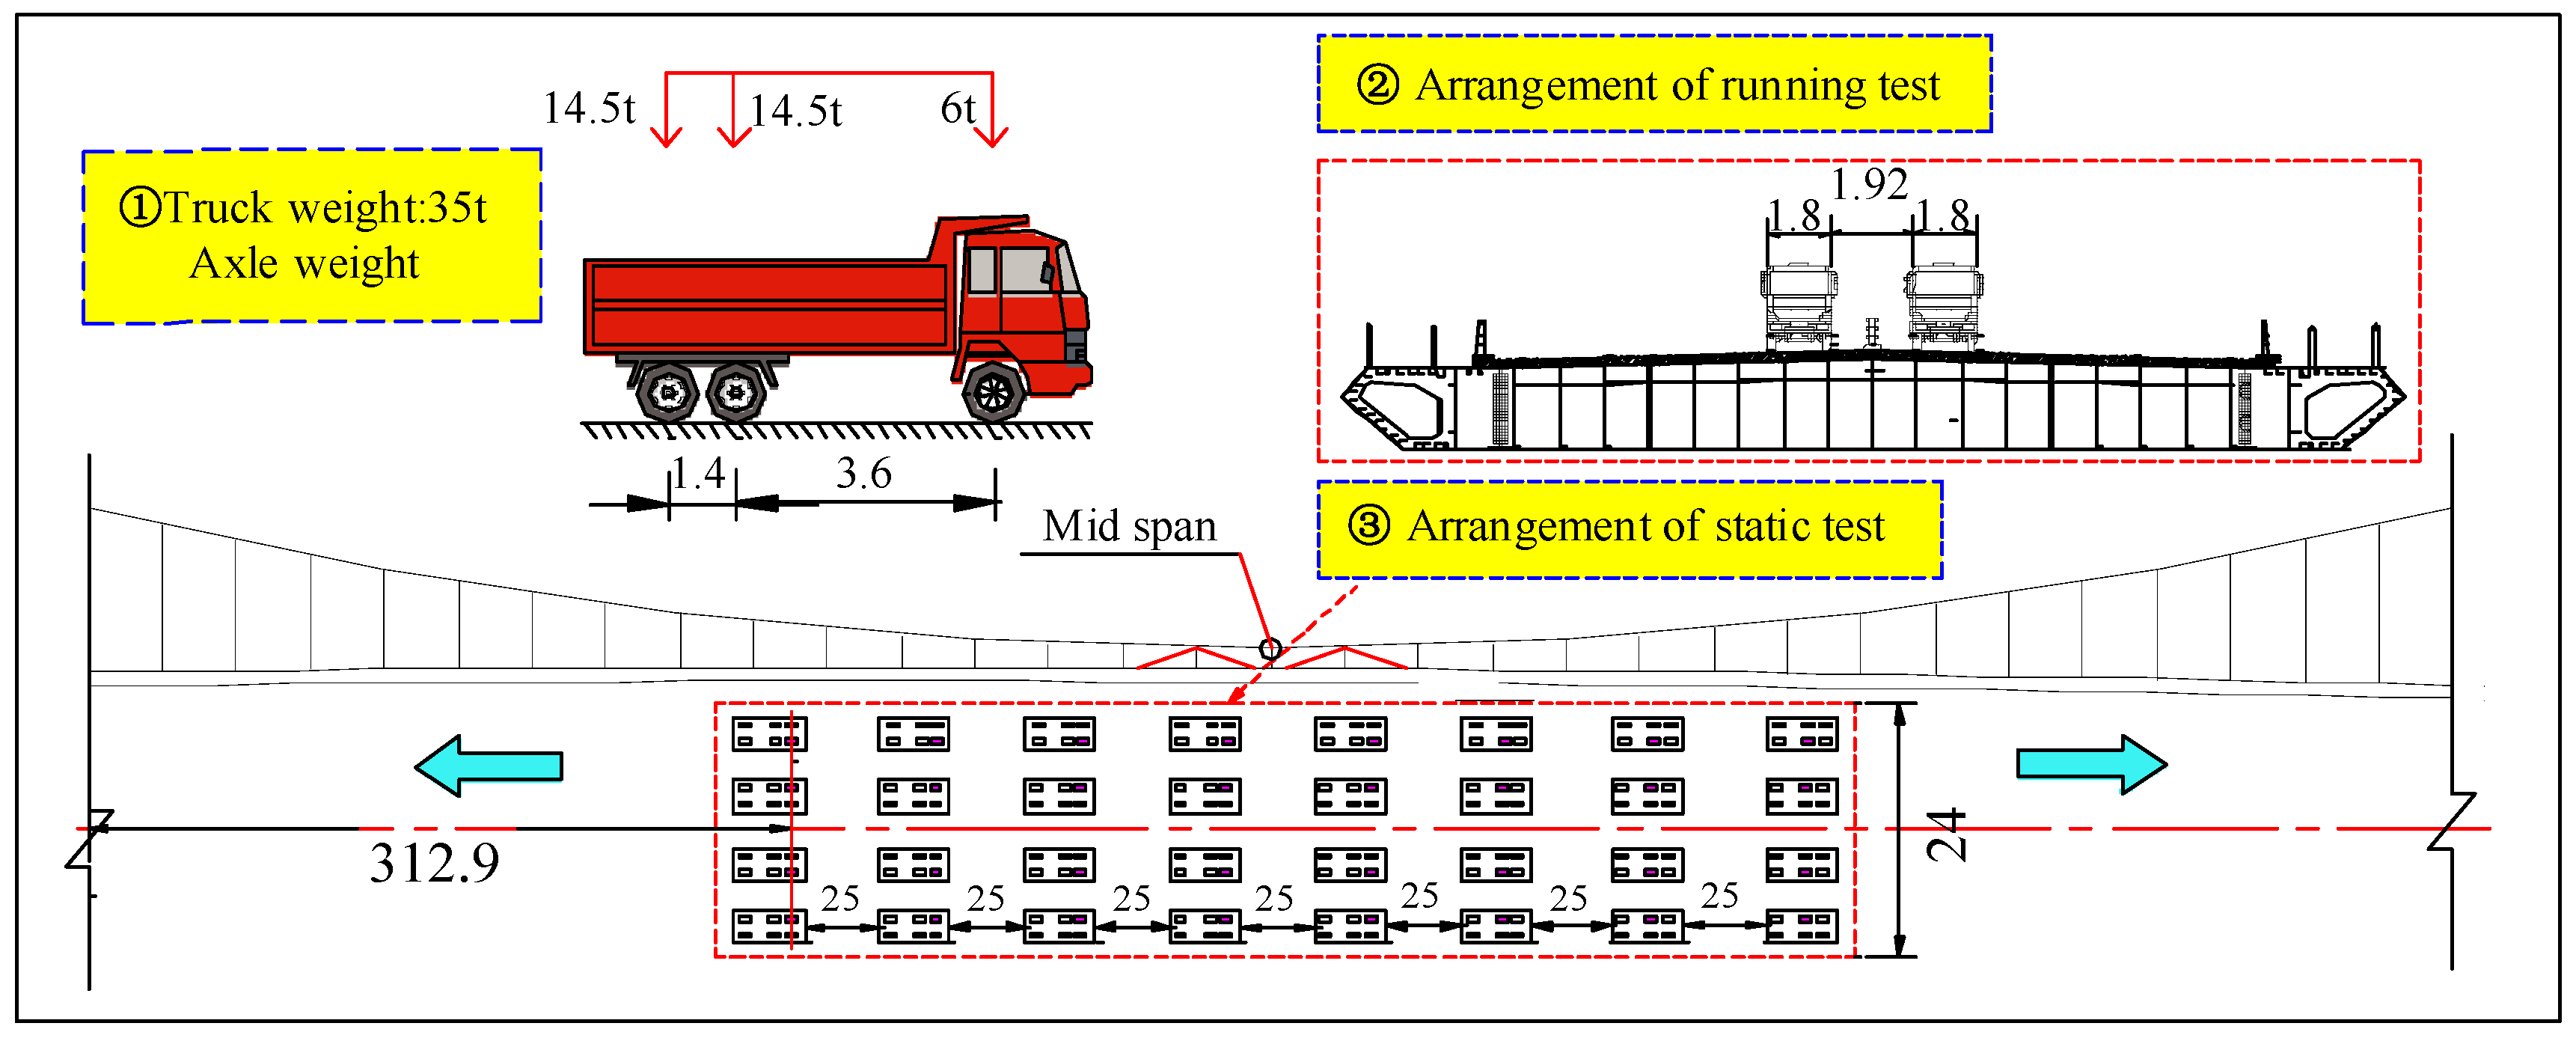
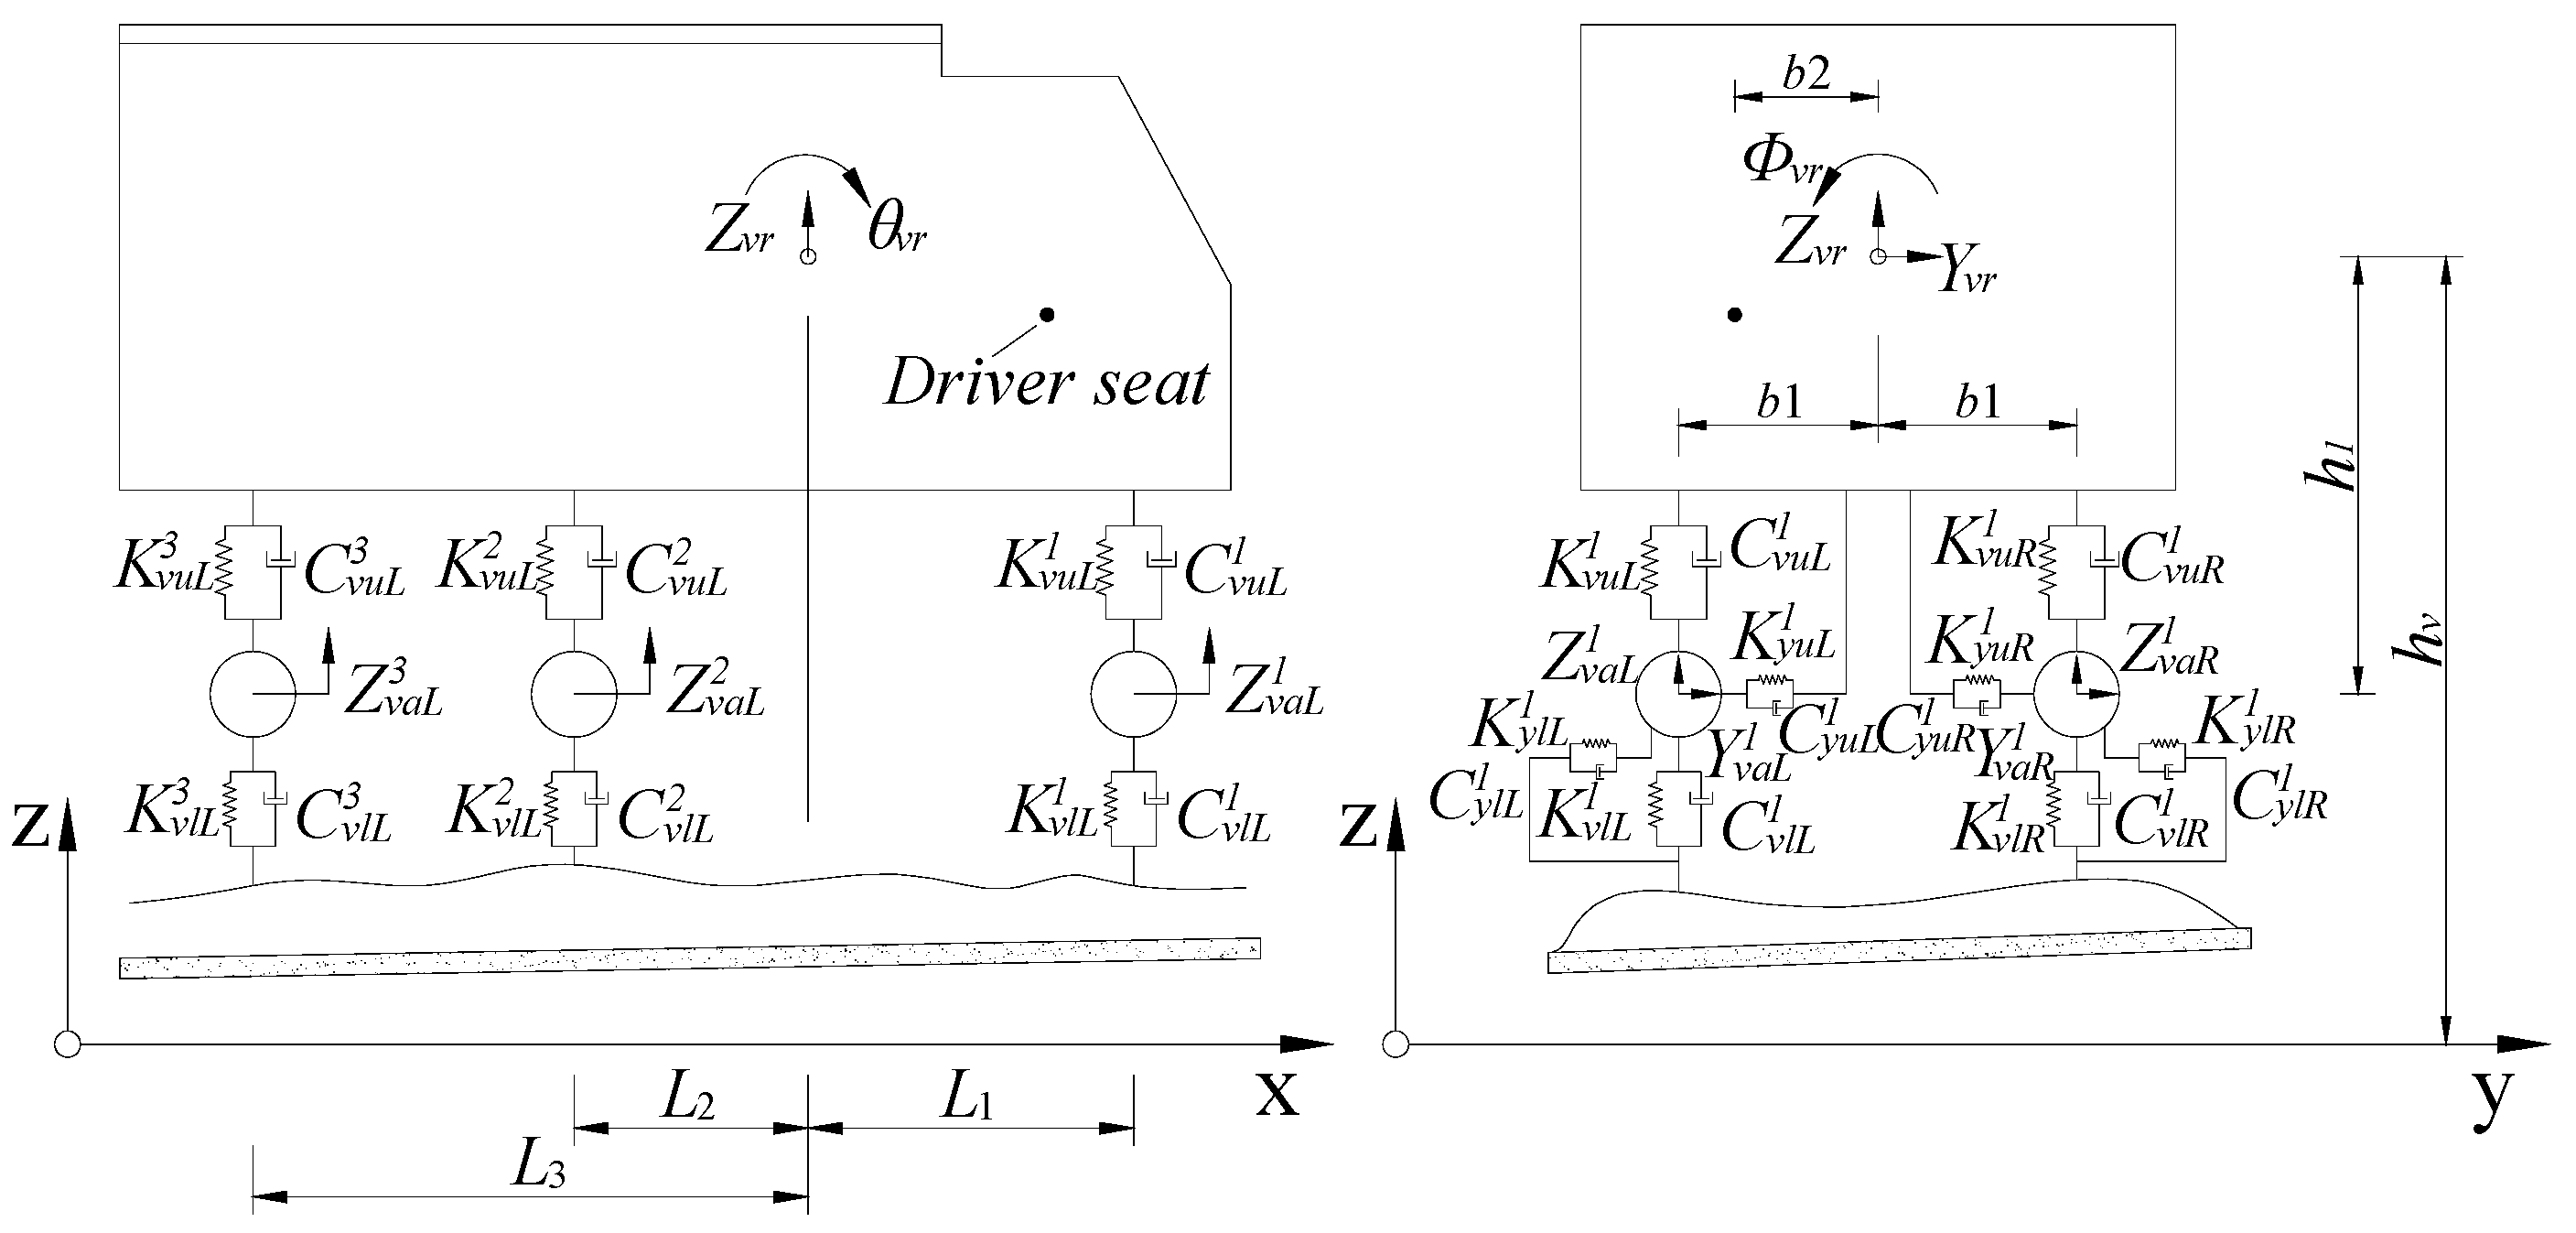
4. Traffic-Induced Stress Responses of Suspenders
4.1. Vehicle Bridge System
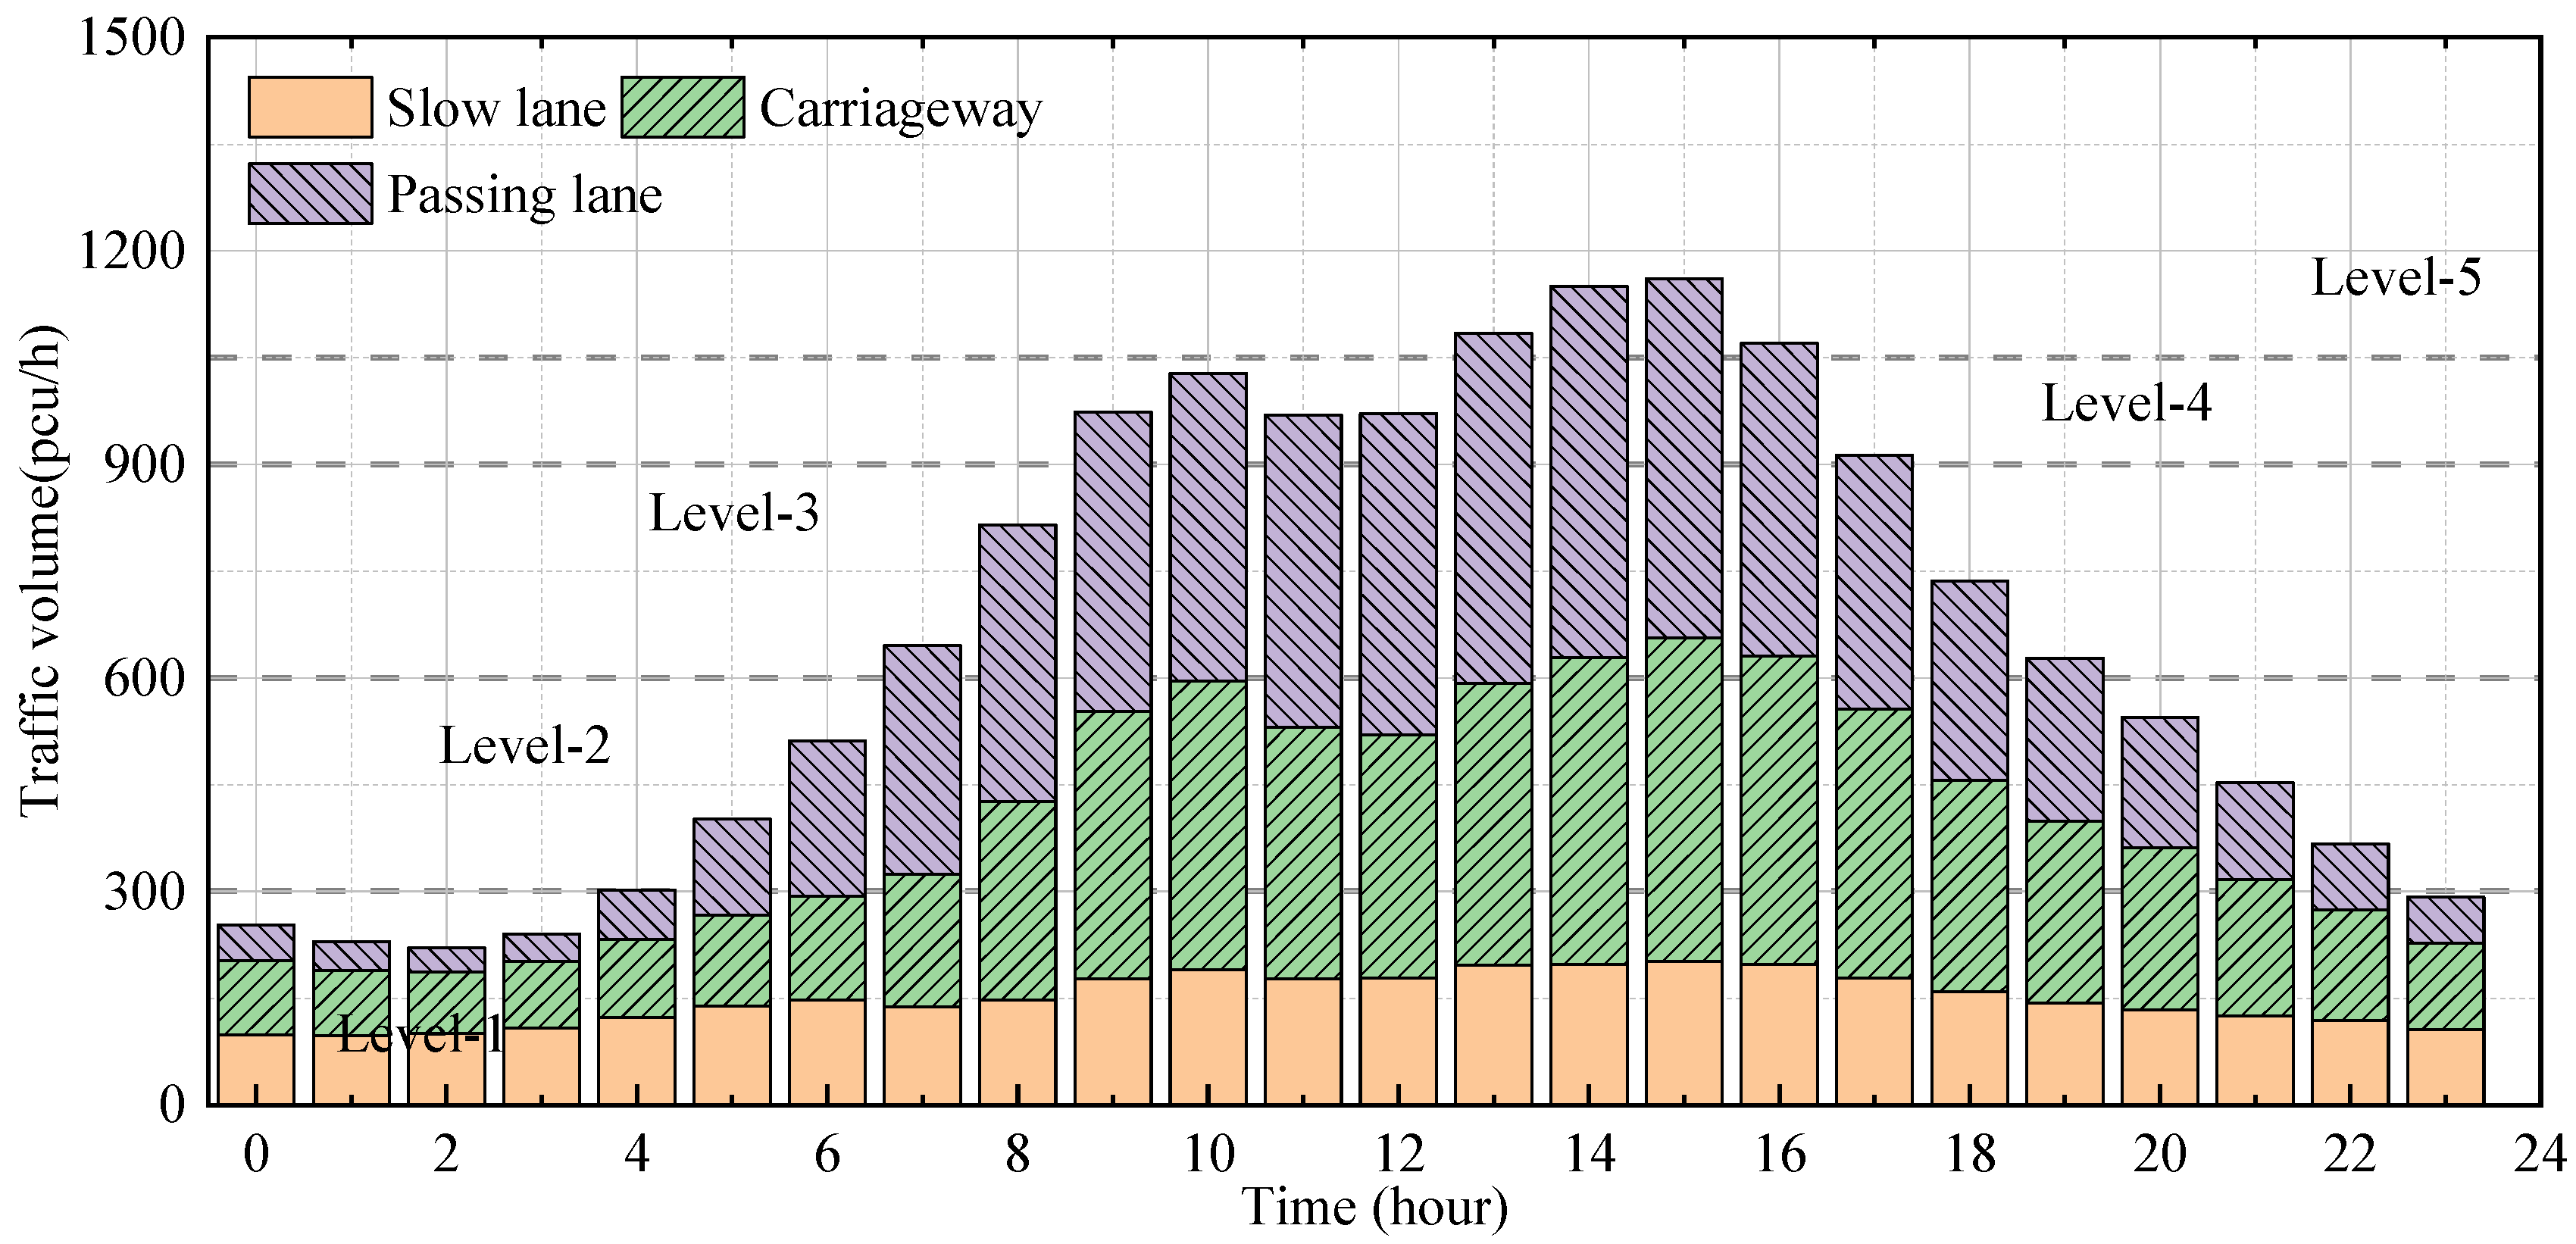
4.2. Traffic Load Simulation
5. Numerical Analysis
5.1. Analysis Conditions
5.2. Evaluation Process
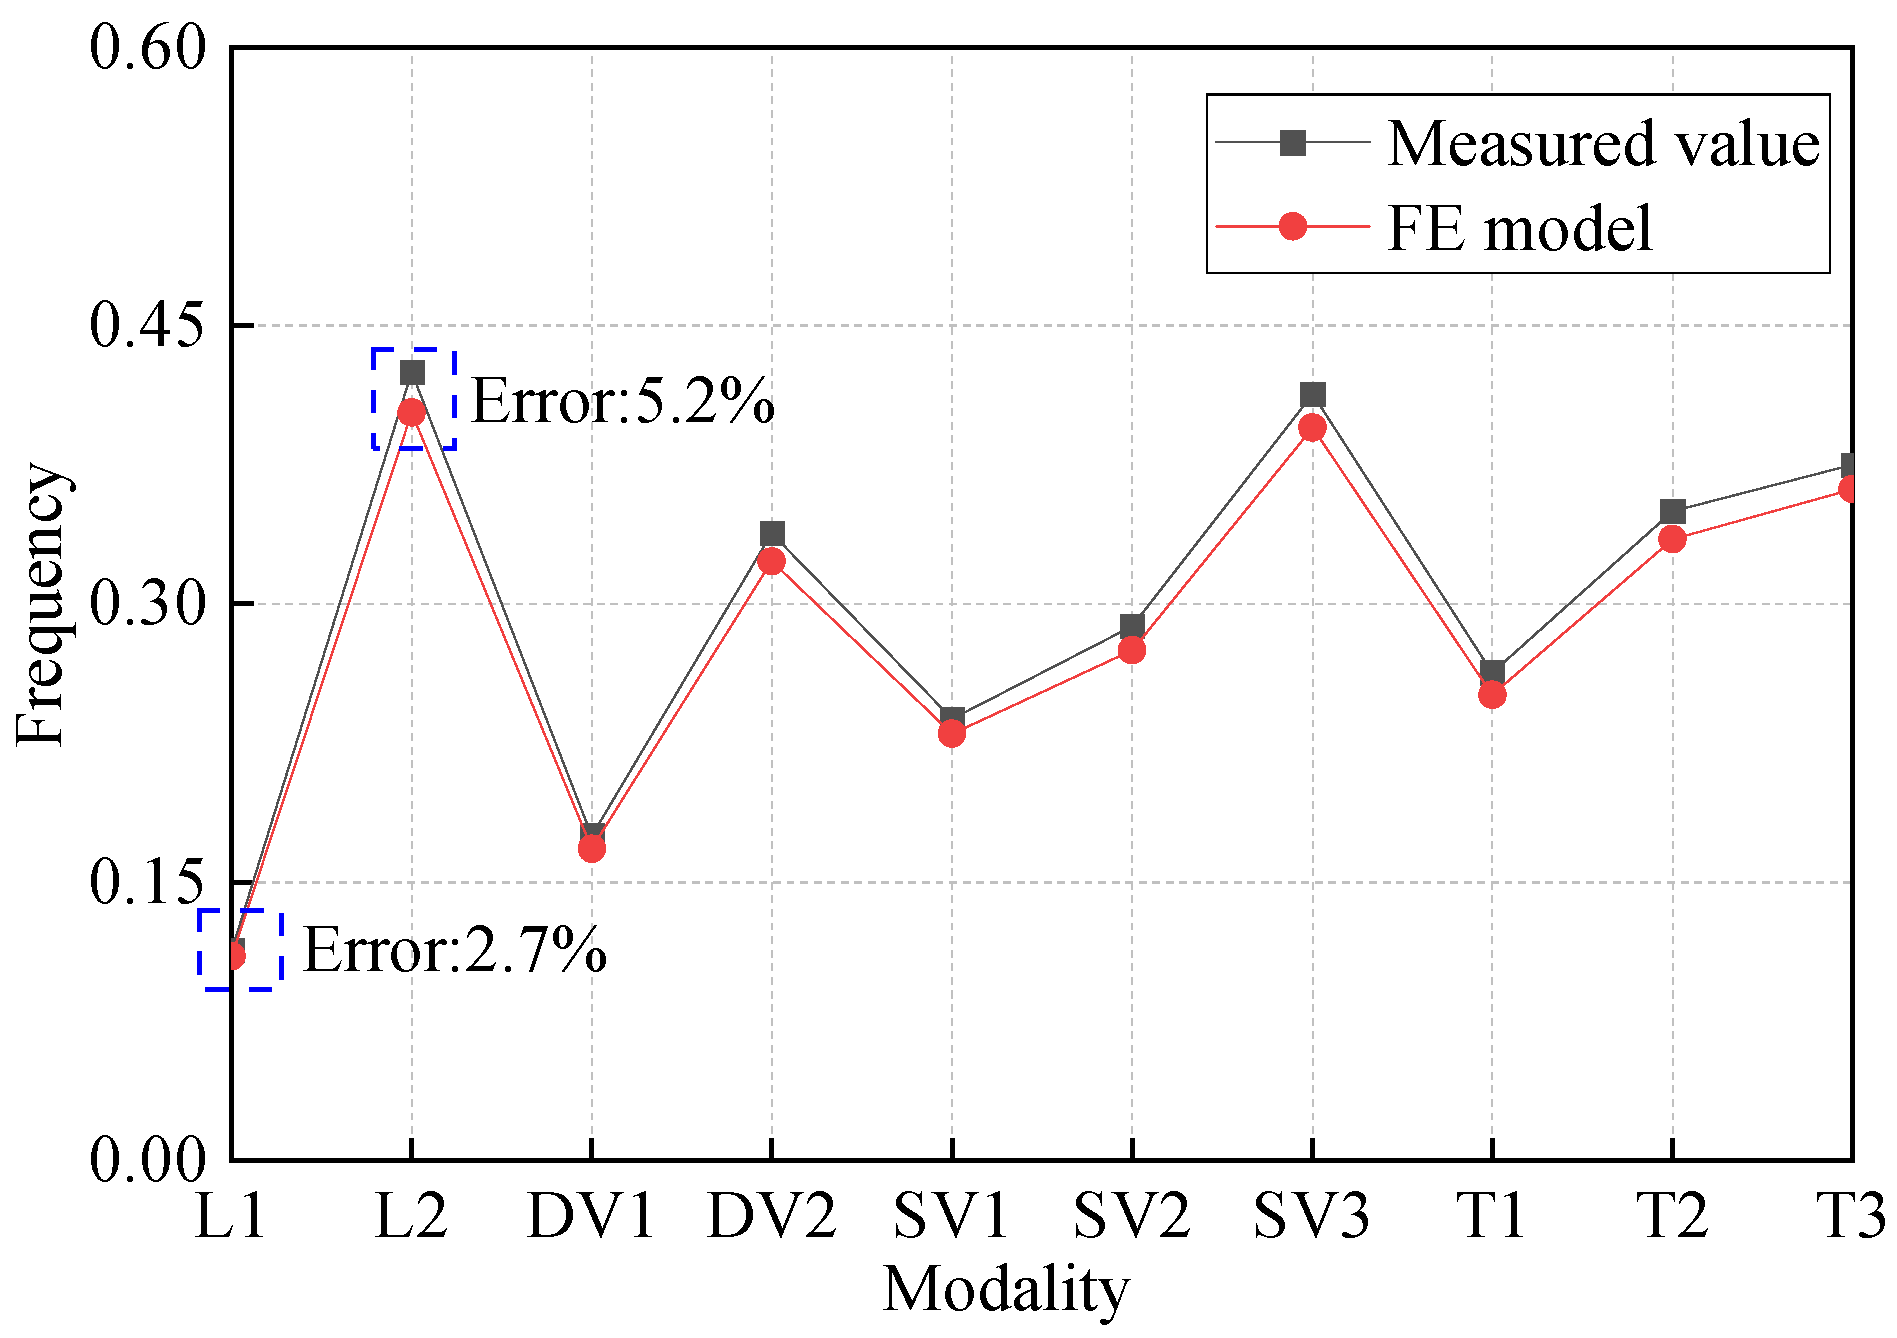
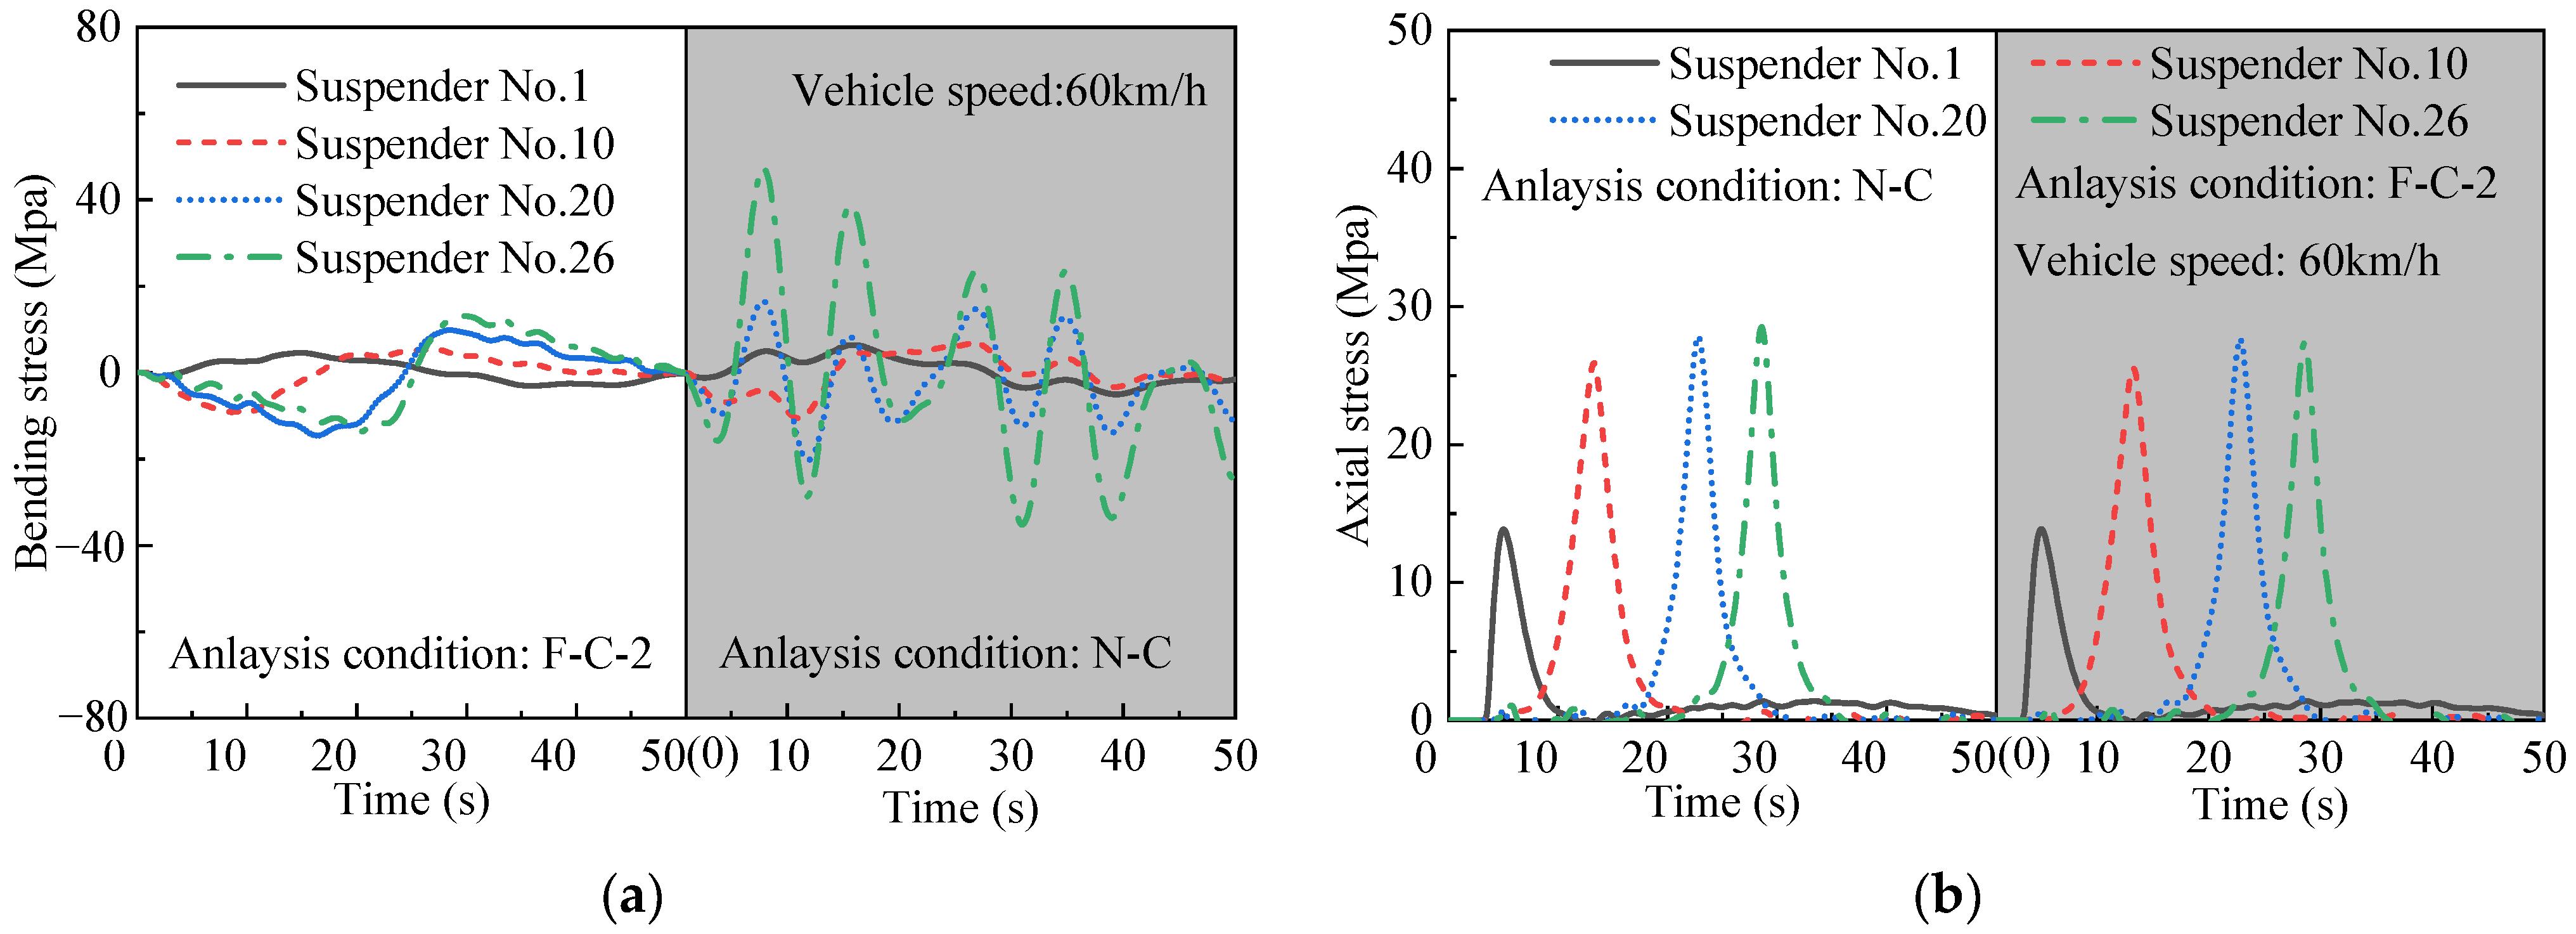
5.3. Result Discussion
6. Conclusions
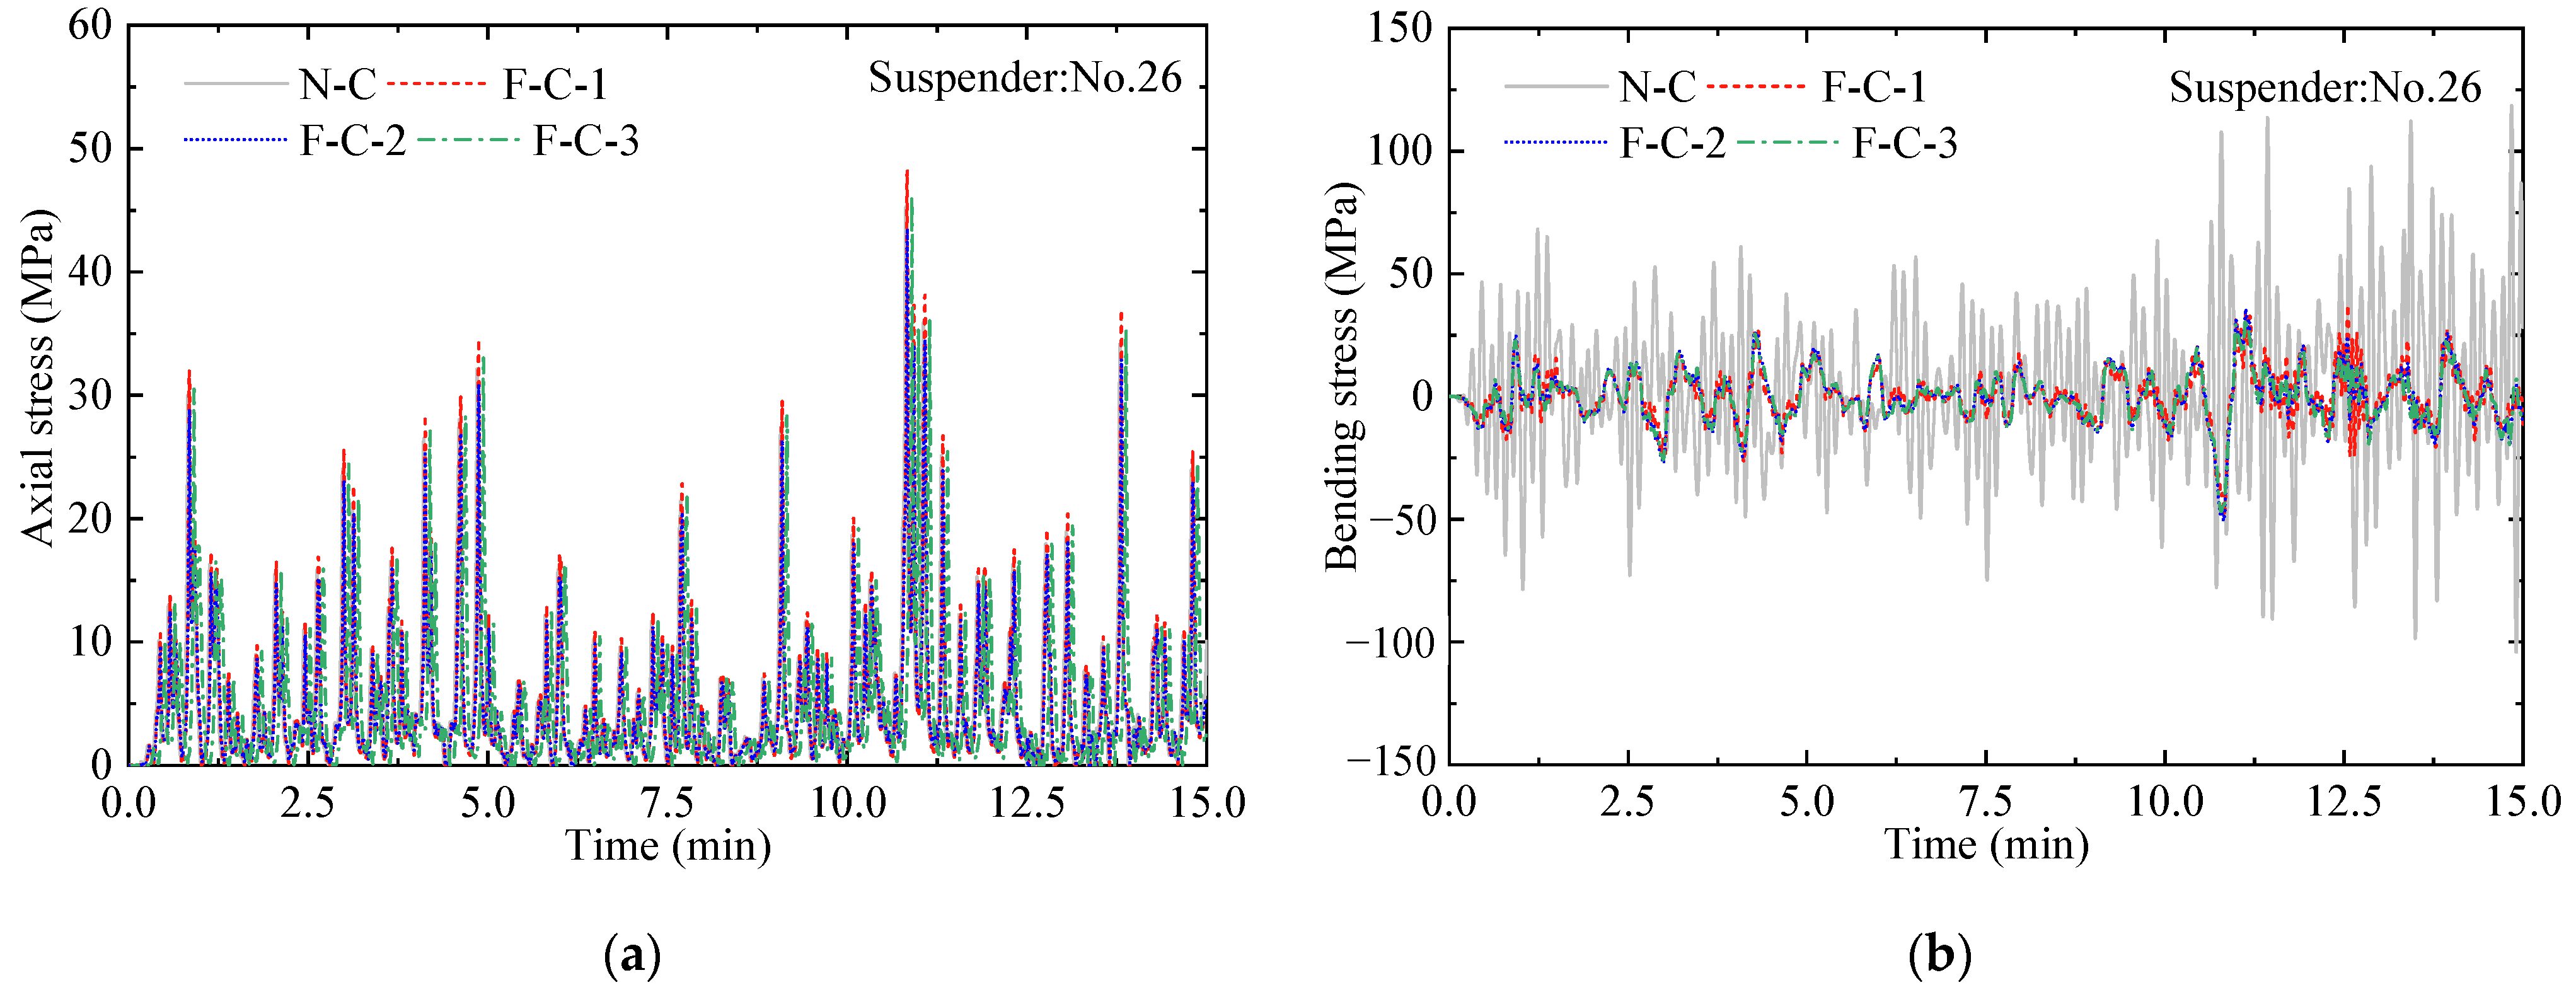
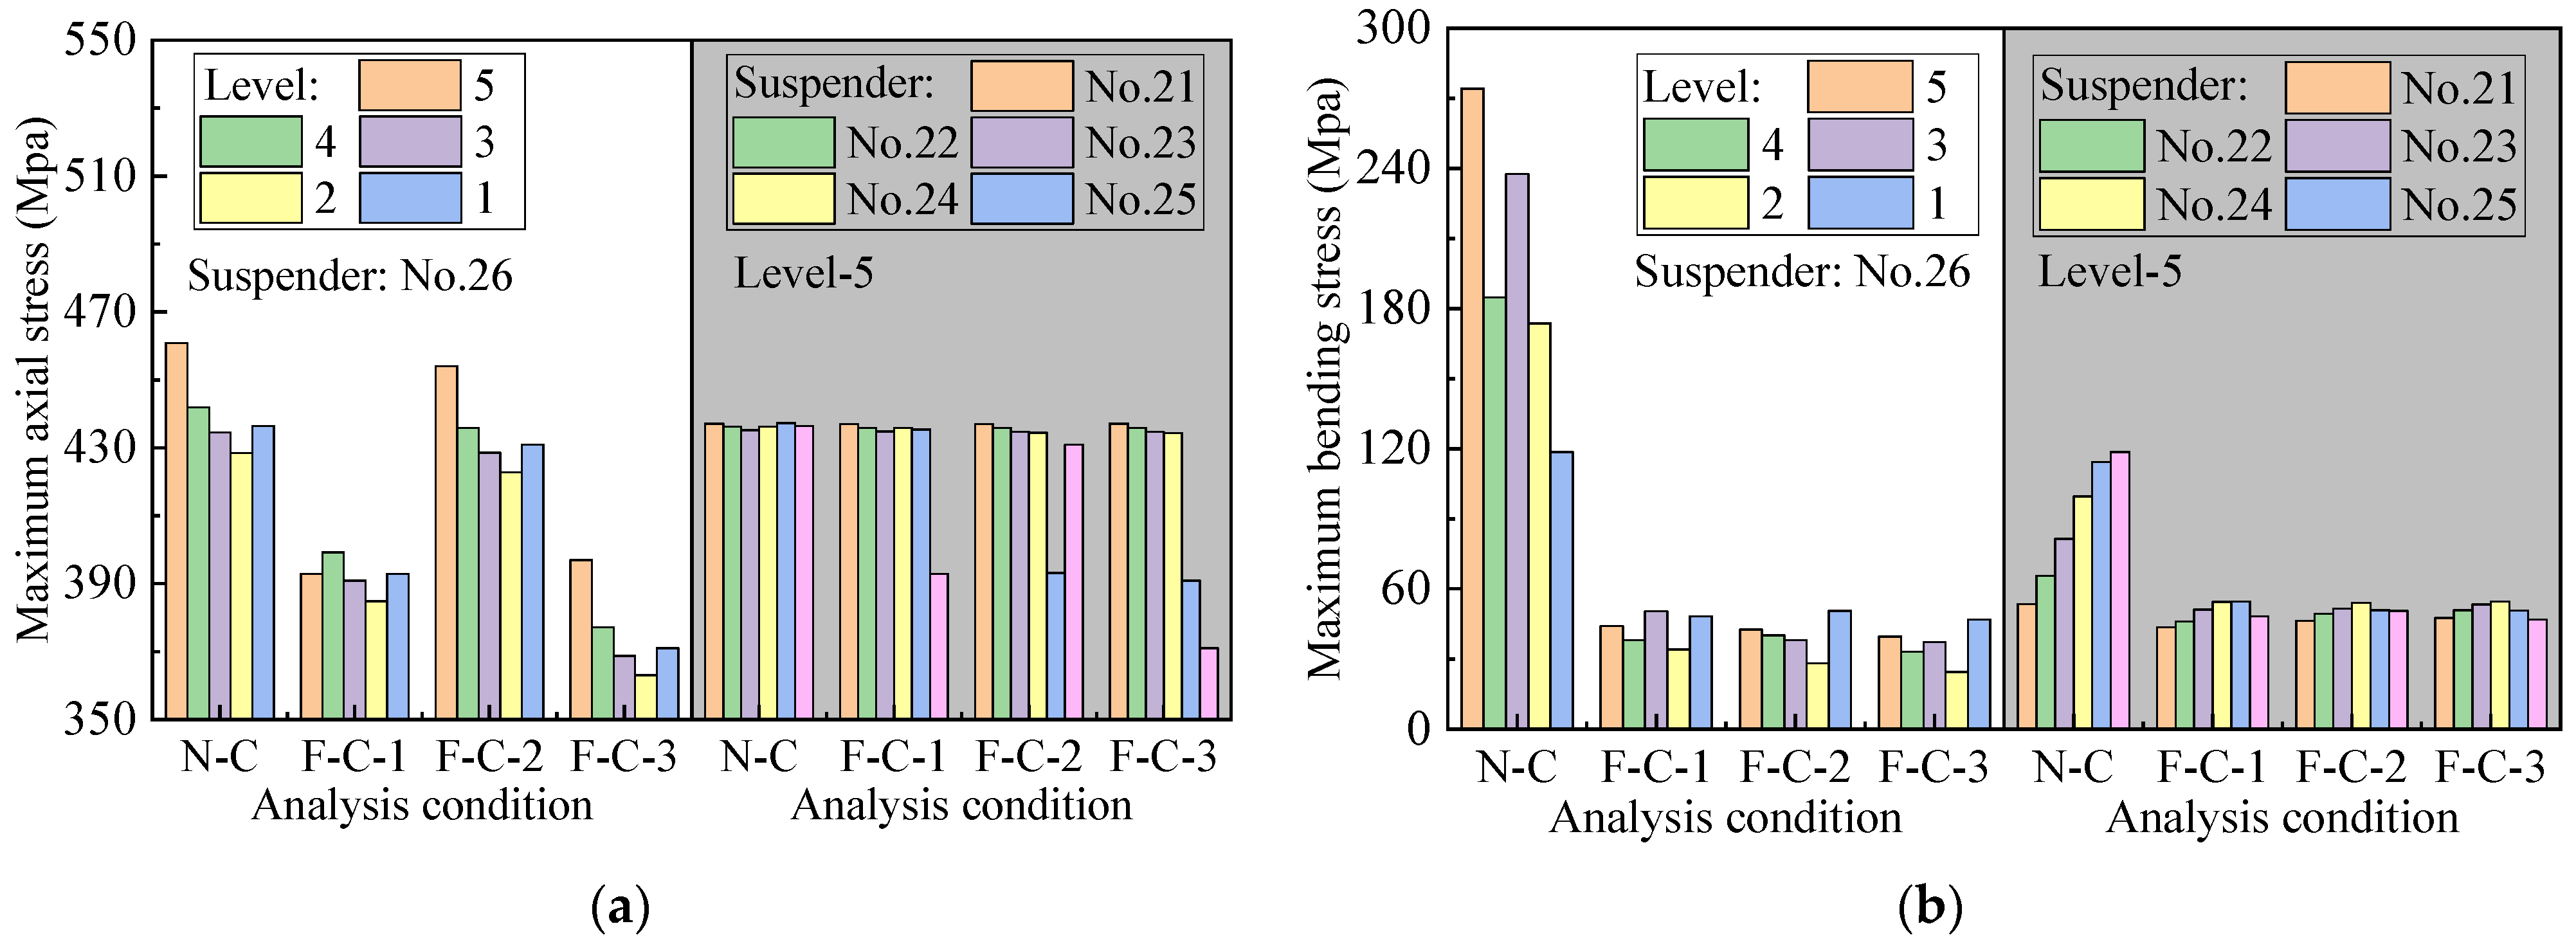
- The intensity of traffic flow greatly influences the stress response of suspenders. The bending stress of short suspenders is considerably greater than that of long suspenders. The setting of flexible central buckles can effectively reduce the peak value of bending stress, but when the number of central buckles exceeds two, the increase in number does not remarkably weaken the bending stress. In addition, the buckles can share the axial stress of the suspender between inclined cables, and the weakening effect is affected by the setting position.
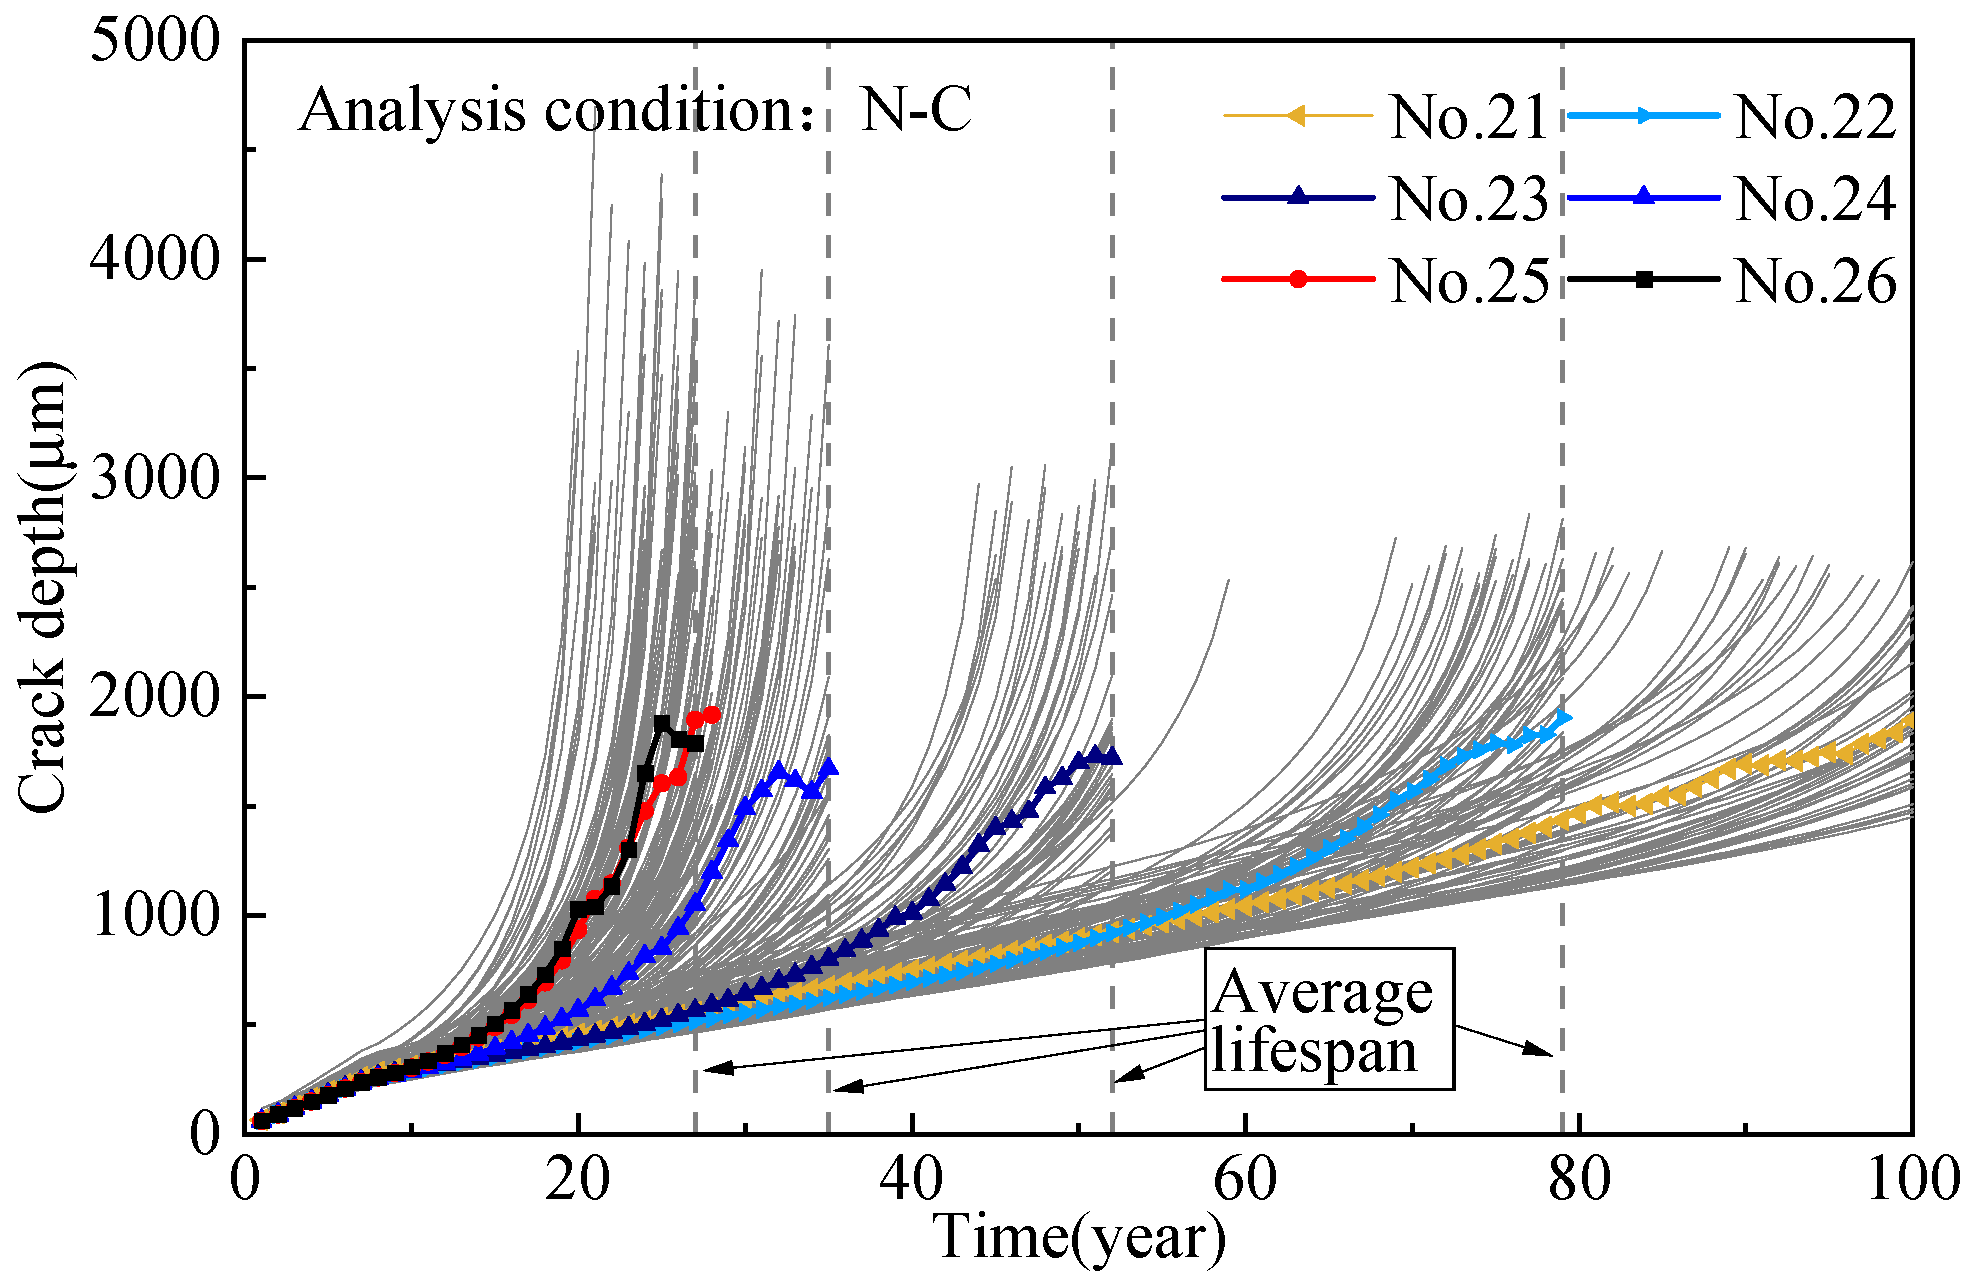
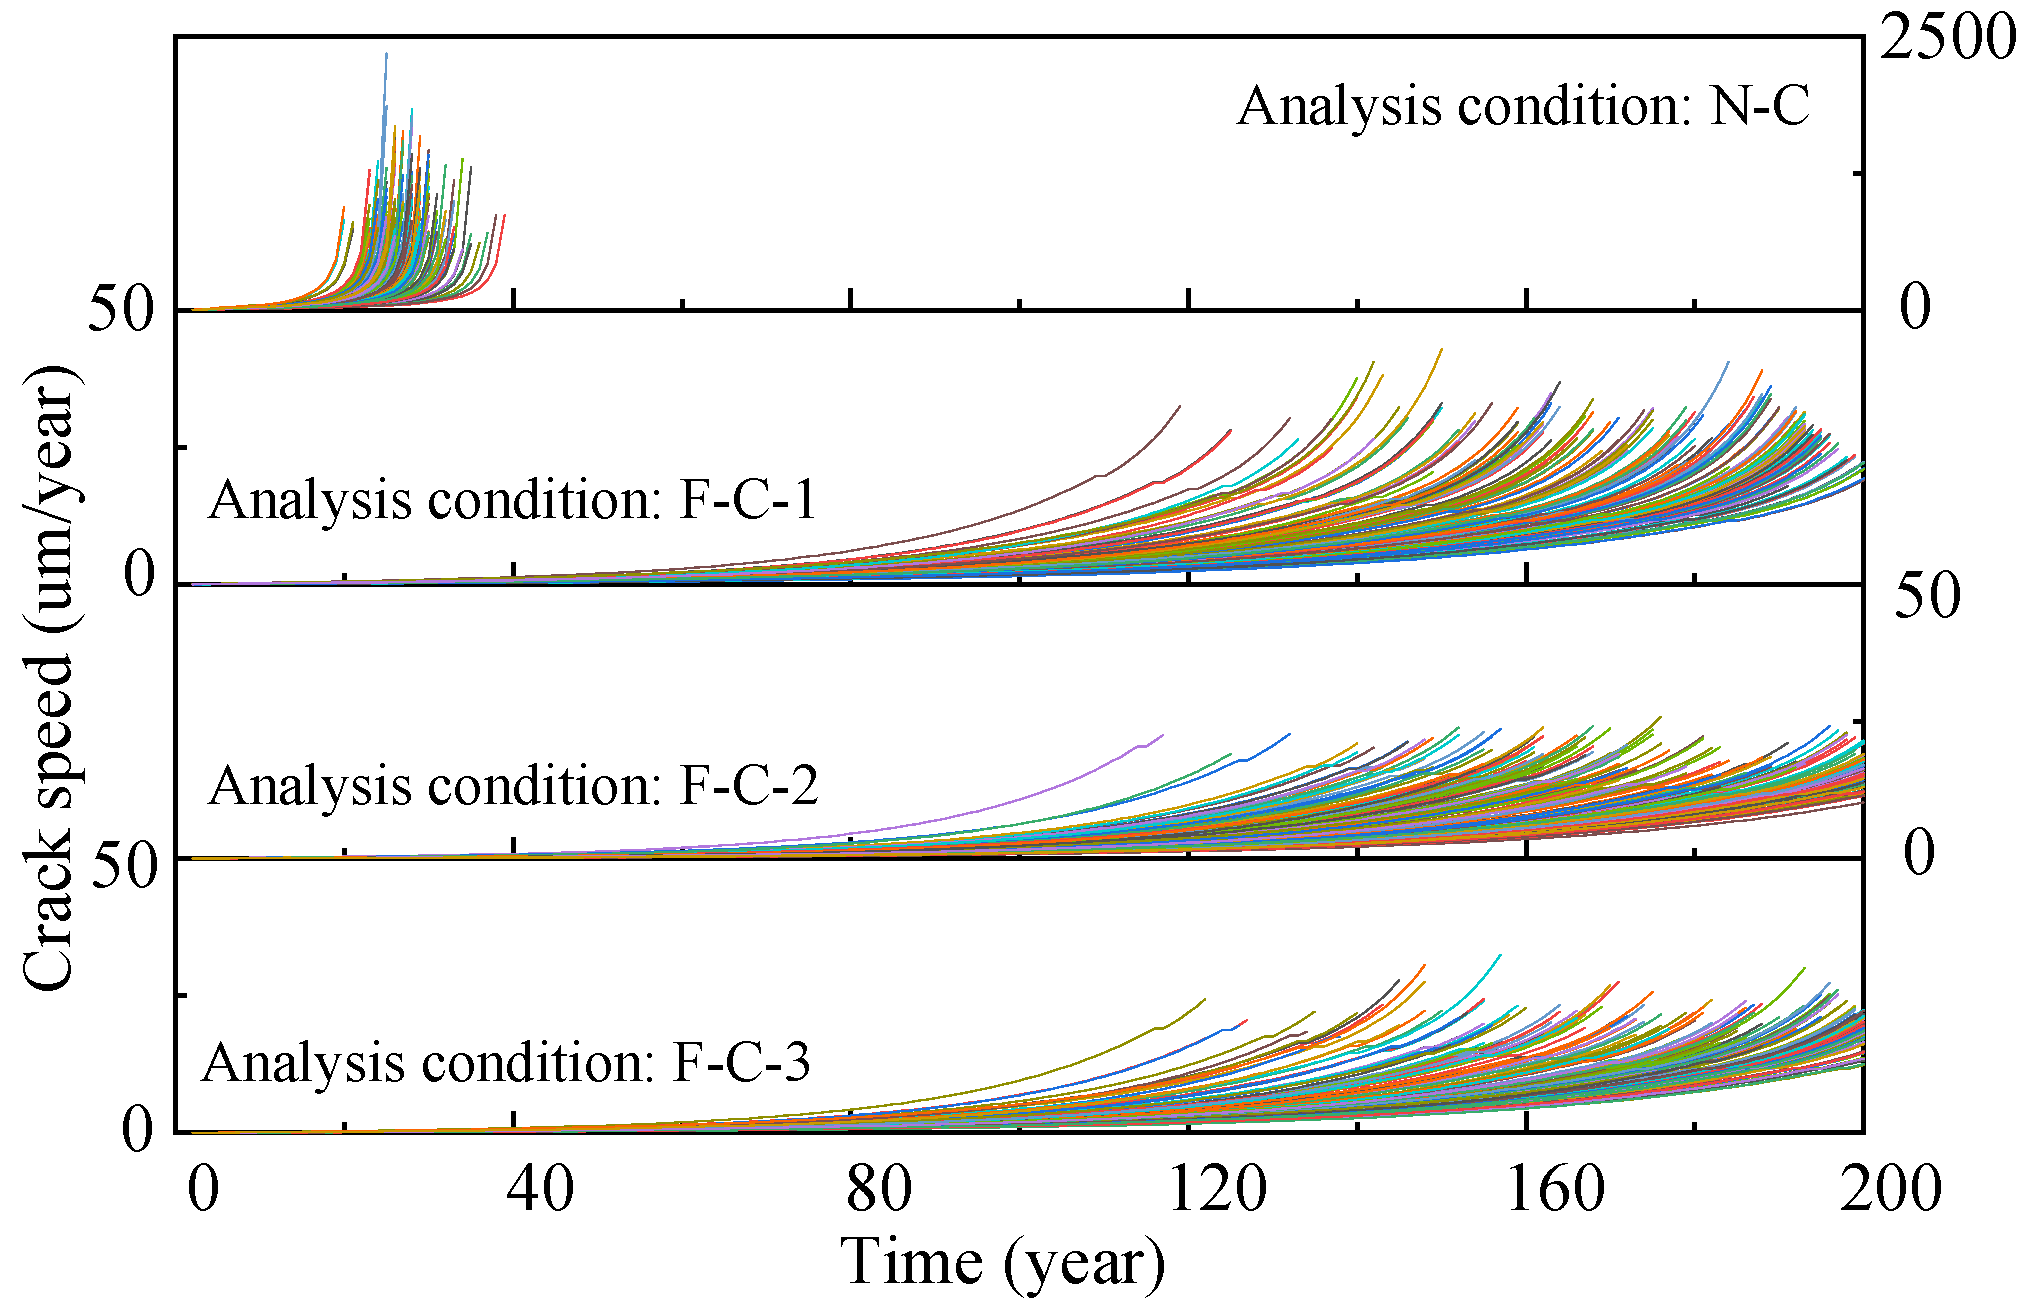
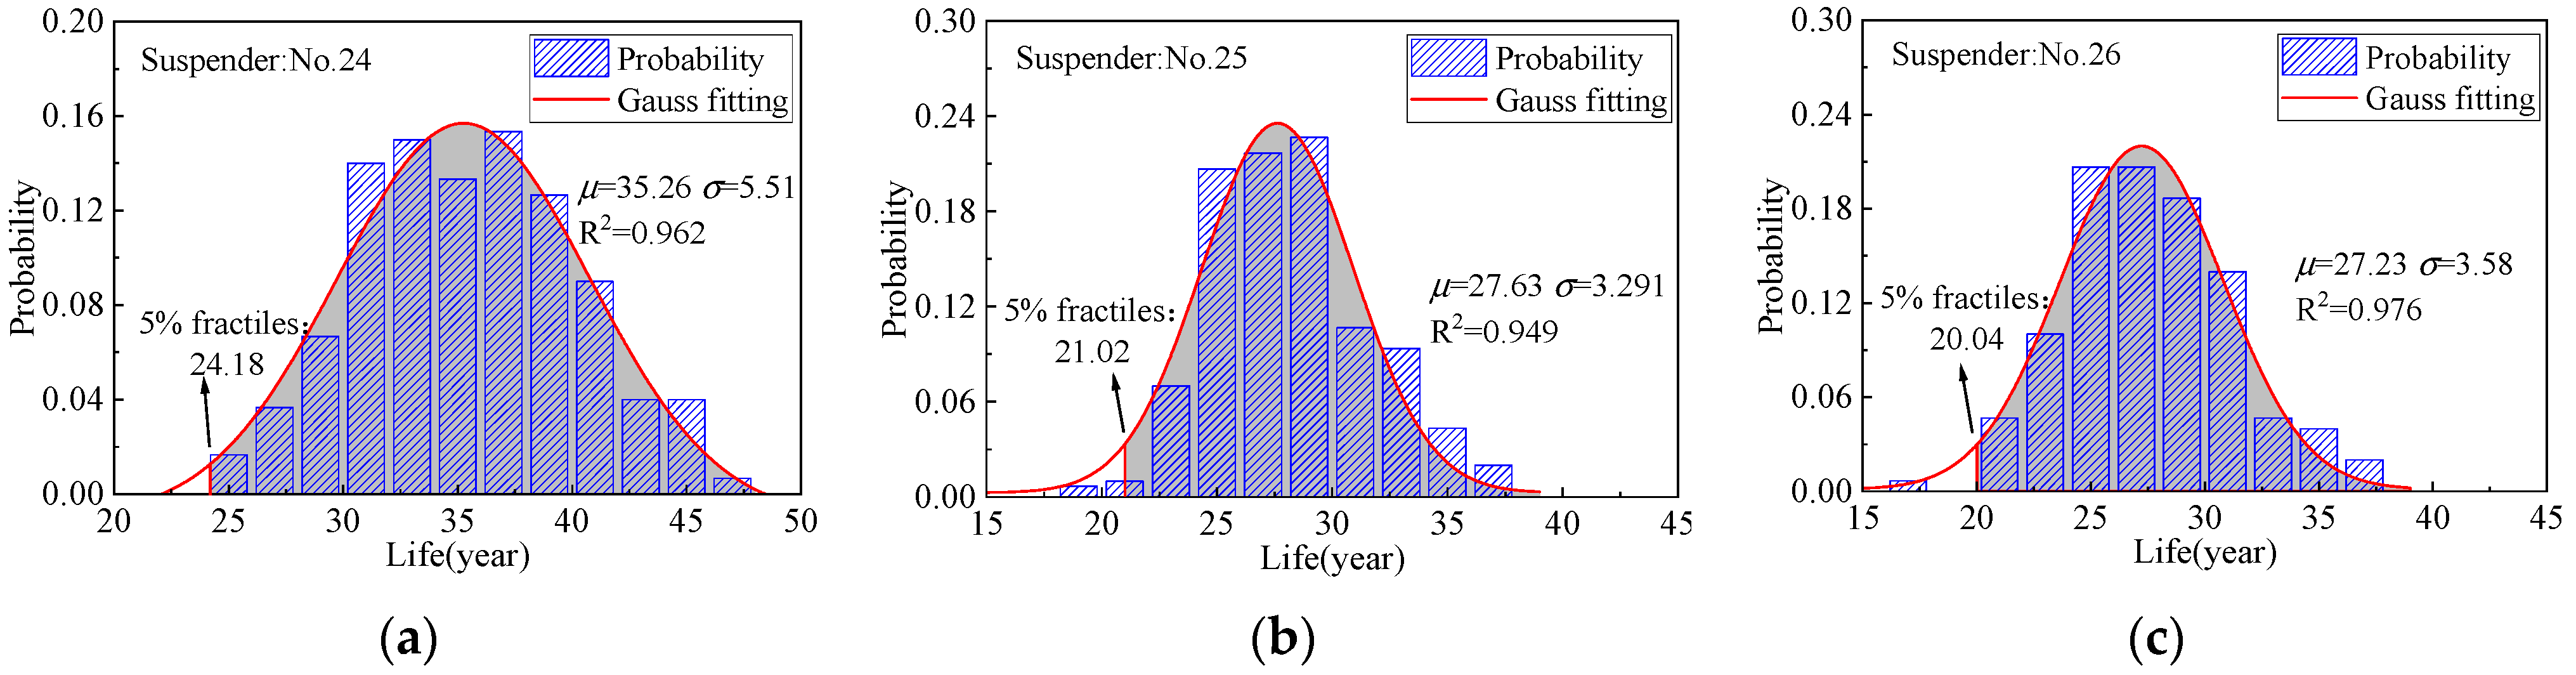
- According to numerical analysis results, the fatigue life of short suspender wires under traffic load is remarkably lower than that of the other suspenders due to large bending stress (about 27–35 years). The setting of buckles can effectively reduce the equivalent bending stress amplitude, but the equivalent axial stress amplitude does not remarkably decrease. The improved stress state of the short suspenders considerably extends the fatigue life of the steel wires under traffic flow (about 174–179 years); by contrast, the increase in the number of buckles has a minimal effect on steel wire life and extreme stress values.
Author Contributions
Funding
Data Availability Statement
Conflicts of Interest
References
- Guo, T.; Liu, J.; Zhang, Y.F.; Pan, S. Displacement monitoring and analysis of expansion joints of long-span steel bridges with viscous dampers. J. Bridge Eng. 2015, 20, 4014099. [Google Scholar] [CrossRef]
- Yuan, A.M.; Yang, T.; Xia, Y.F.; Qian, L.; Dong, L.; Jin, X. Replacement Technology of Long Suspenders of Runyang Suspension Bridge. China J. Highw. Transp. 2021, 34, 289–297. [Google Scholar]
- Liu, X.; Zhang, W.; Sun, P.; Liu, M. Time-Dependent Seismic Fragility of Typical Concrete Girder Bridges under Chloride-Induced Corrosion. Materials 2022, 15, 5020. [Google Scholar] [CrossRef]
- Liu, M. Effect of uniform corrosion on mechanical behavior of E690 high-strength steel lattice corrugated panel in marine environment: A finite element analysis. Mater. Res. Express 2021, 8, 066510. [Google Scholar] [CrossRef]
- Roffey, P. The Fracture Mechanisms of Main Cable Wires from the Forth Road Suspension. Eng. Fail. Anal. 2013, 31, 430–441. [Google Scholar] [CrossRef]
- Qiao, Y.; Liao, C.Q.; Sun, C.Z. Evaluation of corrosion fatigue life for corroded wire for cable-supported bridge. J. Civ. Environ. Eng. 2017, 39, 115–121. (In Chinese) [Google Scholar]
- Valor, A.; Caleyo, F.; Alfonso, L. Stochastic Modeling of Pitting Corrosion: A New Model for Initiation and Growth of Multiple Corrosion Pits. Corros. Sci. 2007, 49, 559–579. [Google Scholar] [CrossRef]
- Nakamura, S.I.; Suzumura, K. Hydrogen Embrittlement and Corrosion Fatigue of Corroded Bridge Wires. J. Constr. Steel Res. 2009, 65, 269–277. [Google Scholar] [CrossRef]
- Suzumura, K.; Nakamura, S.I. Environmental Factors Affecting Corrosion of Galvanized Steel Wires. J. Mater. Civ. Eng. 2004, 16, 1–7. [Google Scholar] [CrossRef]
- Misaelides, P.; Hatzidimitriou, A.; Noli, F.; Pogrebnjak, A.D.; Tyurinc, Y.N.; Kosionidisd, S. Preparation, characterization, and corrosion behavior of protective coatings on stainless steel samples deposited by plasma detonation techniques. Surf. Coat. Technol. 2004, 180, 290–296. [Google Scholar] [CrossRef]
- Liu, X.D.; Han, W.S.; Yuan, Y.G.; Chen, X.; Xie, Q. Corrosion fatigue assessment and reliability analysis of short suspender of suspension bridge depending on refined traffic and wind load condition. Eng. Struct. 2021, 234, 111950. [Google Scholar] [CrossRef]
- Liu, Z.; Guo, T.; Pan, S.; Liu, J. Forensic investigation on cracking in hanger-to-girder connections of long-span suspension bridges. IABSE Symp. Rep. 2017, 27, 344–352. [Google Scholar] [CrossRef]
- Viola, J.M.; Syed, S.; Clenance, J. The New Tacoma Narrows Suspension Bridge: Construction Support and Engineering. In Proceedings of the 2005 Structures Congress and the 2005 Forensic Engineering Symposium, New York, NY, USA, 20–24 April 2005. [Google Scholar]
- Hu, T.F.; Hua, X.G.; Zhang, W.W.; Xian, Q.S. Influence of central buckles on the modal characteristics of long-span suspension bridge. J. Highw. Transp. Res. Dev. 2016, 10, 72–77. [Google Scholar] [CrossRef]
- Li, G.L.; Su, Q.K.; Gao, W.B.; Han, W.S. The influence of the central buckle on the dynamic characteristics of the suspension bridge and the on-board excitation response of the short suspension cable. China J. Highw. Transp. 2021, 34, 174–186. [Google Scholar]
- Wang, H.; Li, A.Q.; Guo, T. Accurate stress analysis on rigid central buckle of long-span suspension bridges based on submodel method. Sci. China Ser. E 2009, 52, 1019–1026. [Google Scholar] [CrossRef]
- Wang, H.; Li, A. Influence of central buckle on wind-induced buffeting response of long-span suspension bridges. China Civ. Eng. J. 2009, 42, 78–84. [Google Scholar]
- Liu, Z.X.; Guo, T.; Huang, L.Y.; Pan, Z. Fatigue Life Evaluation on Short Suspenders of Long-Span Suspension Bridge with Central Clamps. J. Bridge Eng. 2017, 22, 04017074. [Google Scholar] [CrossRef]
- Wang, L.H.; Sun, Z.H.; Cui, J.F.; Hu, S.C. Effects of Central Buckle on End Displacement of Suspension Bridges under Vehicle Excitation. J. Hunan Univ. 2019, 46, 18–24. [Google Scholar]
- Han, W.S.; Liu, X.D.; Gao, G.Z.; Xie, Q. Site-Specific Extra-Heavy Truck Load Characteristics and Bridge Safety Assessment. J. Aerosp. Eng. 2018, 31, 04018098. [Google Scholar] [CrossRef]
- Gao, C.; Liu, Y.J.; Zhang, J.G.; Yao, Z.G. Traffic Flow Simulation of Multi-Lane Highway Bridge Based on Monte Carlo Method. J. Chongqing Jiaotong Univ. 2011, 30, 1375–1378+1434. [Google Scholar]
- Caprani, C.C.; Obrien, E.J.; Mclachlan, G.J. Characteristic Traffic Load Effects from A Mixture Of Loading Events On Short To Medium Span Bridges. Struct. Saf. 2008, 30, 394–404. [Google Scholar] [CrossRef]
- Bernard, E.; O’’Brien, E. Monte Carlo Simulation of Extreme Traffic Loading on Short and Medium Span Bridges. Struct. Infrastruct. Eng. 2013, 9, 1267–1282. [Google Scholar]
- Xu, X.; Qiang, S.Z. Influence of Central Buckle on Dynamic Behavior and Seismic Response of Long-span Suspension Bridge. J. China Railw. Soc. 2010, 32, 84–91. [Google Scholar]
- Yuan, Y.G.; Liu, X.D.; Pu, G.N.; Wang, T.; Guo, Q. Corrosion Features and Time-Dependent Corrosion Model of Galfan Coating of High Strength Steel Wires. Constr. Build. Mater. 2021, 313, 125534. [Google Scholar] [CrossRef]
- JT/T 1104-2016; Hot-Dip Zinc-Aluminium Coated Steel Wires for Bridge. Ministry of Transport of the People’s Republic of China: Beijing, China, 2016.
- Aoki, T.; Kittaka, T. Results of 10-year atmospheric corrosion testing of hot dip Zn-5mass% Al alloy coated sheet steel. In Society IaS; Galvatech: Chicago, IL, USA, 1995. [Google Scholar]
- Katayama, H.; Kuroda, S. Long-term atmospheric corrosion properties of thermally sprayed Zn, Al and Zn–Al coatings exposed in a coastal area. Corros. Sci. 2013, 76, 35–41. [Google Scholar] [CrossRef]
- Liu, M. Finite element analysis of pitting corrosion on mechanical behavior of E690 steel panel. Anti-Corros. Methods Mater. 2022, 28, 7527–7536. [Google Scholar] [CrossRef]
- Toribio, J.; Matos, J.C.; González, B. Micro- and macro-approach to the fatigue crack growth in progressively drawn pearlitic steels at different R-ratios. Int. J. Fatigue 2009, 31, 2014–2021. [Google Scholar] [CrossRef]
- Mayrbaurl, R.M.; Camo, S. Cracking and fracture of suspension bridge wire. J. Bridge Eng. 2001, 6, 645–650. [Google Scholar] [CrossRef]
- Han, W.S.; Ma, L.; Wang, B. Refinement Analysis and Dynamic Visualization of Traffic-Bridge Coupling Vibration System. China J. Highw. Transp. 2013, 26, 78–87. [Google Scholar]
- Wang, T.L.; Shahawy, M.; Huang, D.Z. Dynamic Response of Highway Trucks Due To Road Surface Roughness. Comput. Struct. 1993, 49, 1055–1067. [Google Scholar] [CrossRef]
- Zhao, Y.; Huang, P.M.; Long, G.X.; Sun, Y. Influence of Fluid Viscous Damper on the Dynamic Response of Suspension Bridge under Random Traffic Load. Adv. Civ. Eng. 2020, 2020, 1857378. [Google Scholar] [CrossRef]
- ISO-8608; Mechanical Vibration-Road Surface Profiles-Reporting of Measured Data. International Organization for Standardization: Geneva, Switzerland, 1995.
- Wyatt, T.A. Secondary Stress in Parallel Wire Suspension Cables. J. Struct. Div. 1960, 86, 37–59. [Google Scholar] [CrossRef]
- Kondoh, M.; Okuda, M.; Kawaguchi, K.; Yamazaki, T. Design Method of A Hanger System For Long-Span Suspension Bridge. J. Bridge Eng. 2001, 6, 176–182. [Google Scholar] [CrossRef]


| L/8 | 3L/8 | L/2 | 5L/8 | 7L/8 | |
|---|---|---|---|---|---|
| Measured Value (mm) | 175 | 606 | 1093 | 615 | 180 |
| FE model (mm) | 181 | 624 | 1120 | 630 | 185 |
| Error (%) | 0.03 | 0.03 | −2.02 | 0.02 | 0.03 |
| Nominal Diameter (mm) | Tensile Strength (MPa) | Yield Strength (MPa) | Modulus of Elasticity (GPa) | Coating Quality (g/cm2) | Coating Depth (μm) | |
|---|---|---|---|---|---|---|
| Galfan steel wire | 5.25 | 1926 | 1775 | 2.08 | 337 | 31.05 |
| Condition | Description | Schematic |
|---|---|---|
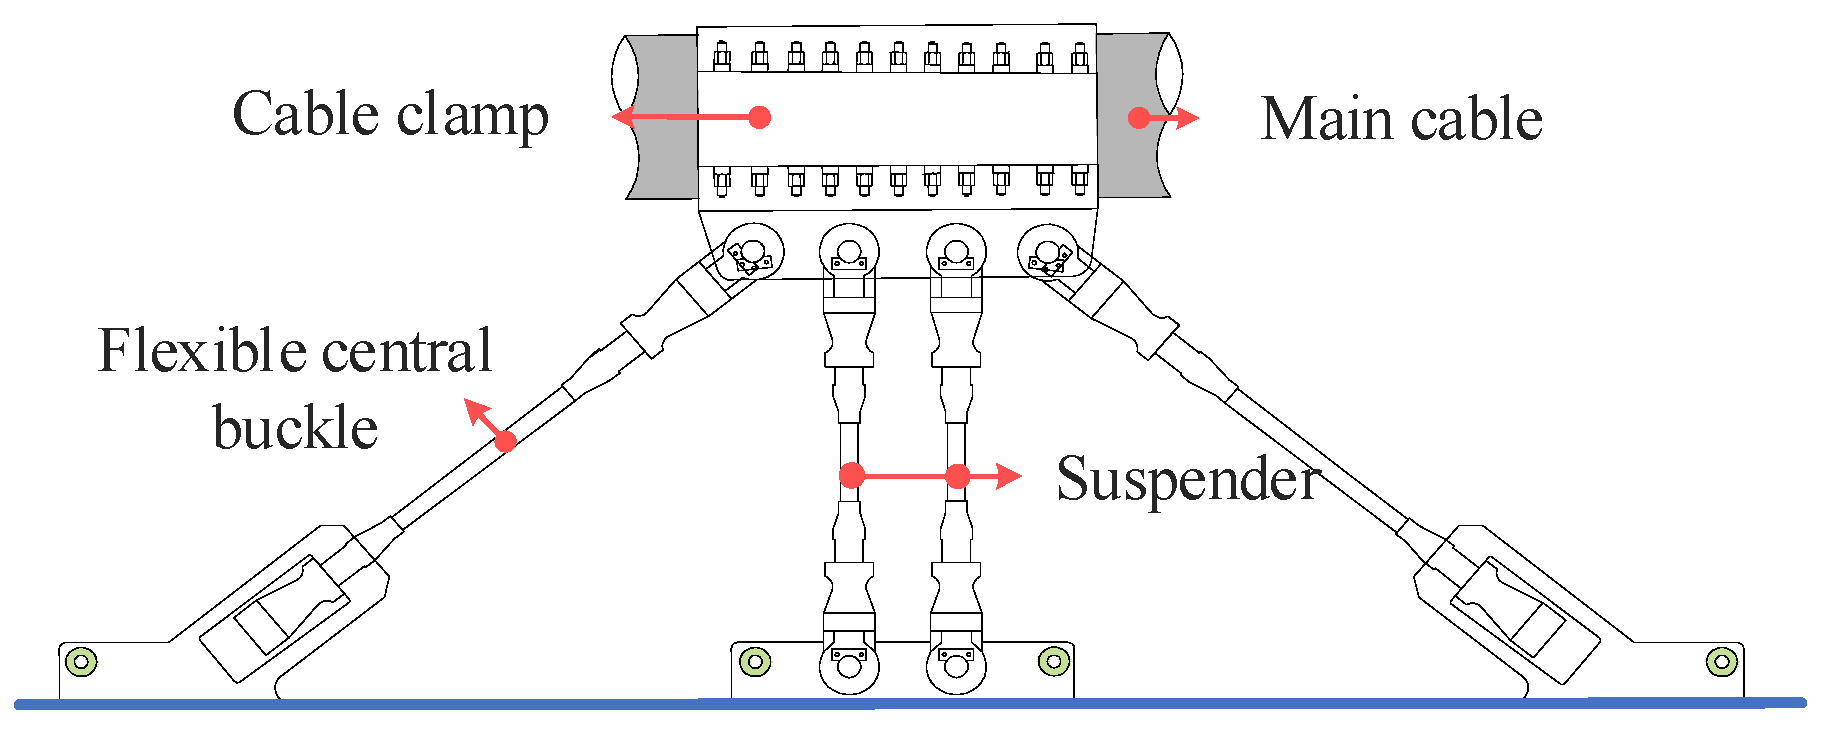
| N-C | No central buckle |  |
| F-C-1 | Single flexible central buckle | 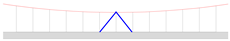 |
| F-C-2 | Double flexible central buckles | 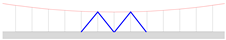 |
| F-C-3 | Three flexible central buckles | 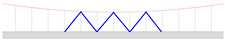 |
| Suspender Number (Length) | Analysis Condition | Maximum Bending Stress (MPa) | Equivalent Bending Stress (MPa) | Equivalent Axial Stress (MPa) | Fatigue Life (Year) | ||
|---|---|---|---|---|---|---|---|
| μ | σ | Confidence Intervals (95% CI) | |||||
| 24 (2.75 m) | N-C | 208.31 | 37.30 | 10.23 | 35.2 | 5.51 | (34.3,36.1) |
| F-C-1 | 70.52 | 14.19 | 9.60 | 179.3 | 19.31 | (176.2,182.4) | |
| F-C-2 | 54.14 | 11.38 | 9.51 | 178.5 | 19.54 | (175.4,181.6) | |
| F-C-3 | 54.67 | 12.46 | 9.45 | 181.3 | 19.59 | (178.2,184.4) | |
| 25 (2.45 m) | N-C | 238.91 | 44.32 | 9.63 | 27.6 | 3.29 | (27.1,28.1) |
| F-C-1 | 77.16 | 15.68 | 10.12 | 177.8 | 19.32 | (174.7,180.9) | |
| F-C-2 | 50.81 | 11.62 | 10.33 | 177.9 | 20.39 | (174.6,181.2) | |
| F-C-3 | 50.79 | 11.81 | 9.38 | 181.1 | 20.10 | (177.9,184.3) | |
| 26 (2.41 m) | N-C | 274.10 | 46.66 | 10.03 | 27.2 | 3.58 | (26.6,27.8) |
| F-C-1 | 72.17 | 14.38 | 10.17 | 174.2 | 19.49 | (171.1,177.3) | |
| F-C-2 | 50.68 | 11.93 | 8.98 | 178.1 | 21.35 | (174.7,181.5) | |
| F-C-3 | 46.85 | 12.07 | 9.30 | 179.4 | 20.60 | (176.1,182.7) | |
Disclaimer/Publisher’s Note: The statements, opinions and data contained in all publications are solely those of the individual author(s) and contributor(s) and not of MDPI and/or the editor(s). MDPI and/or the editor(s) disclaim responsibility for any injury to people or property resulting from any ideas, methods, instructions or products referred to in the content. |
© 2022 by the authors. Licensee MDPI, Basel, Switzerland. This article is an open access article distributed under the terms and conditions of the Creative Commons Attribution (CC BY) license (https://creativecommons.org/licenses/by/4.0/).
Share and Cite
Zhao, Y.; Guo, X.; Su, B.; Sun, Y.; Li, X. Evaluation of Flexible Central Buckles on Short Suspenders’ Corrosion Fatigue Degradation on a Suspension Bridge under Traffic Load. Materials 2023, 16, 290. https://doi.org/10.3390/ma16010290
Zhao Y, Guo X, Su B, Sun Y, Li X. Evaluation of Flexible Central Buckles on Short Suspenders’ Corrosion Fatigue Degradation on a Suspension Bridge under Traffic Load. Materials. 2023; 16(1):290. https://doi.org/10.3390/ma16010290
Chicago/Turabian StyleZhao, Yue, Xuelian Guo, Botong Su, Yamin Sun, and Xiaolong Li. 2023. "Evaluation of Flexible Central Buckles on Short Suspenders’ Corrosion Fatigue Degradation on a Suspension Bridge under Traffic Load" Materials 16, no. 1: 290. https://doi.org/10.3390/ma16010290
APA StyleZhao, Y., Guo, X., Su, B., Sun, Y., & Li, X. (2023). Evaluation of Flexible Central Buckles on Short Suspenders’ Corrosion Fatigue Degradation on a Suspension Bridge under Traffic Load. Materials, 16(1), 290. https://doi.org/10.3390/ma16010290