Article

Assessment of the Undrained Shear Strength and Settlement of Organic Soils under Embankment Loading Using Artificial Neural Networks

by
Zbigniew Lechowicz
1,* and
Maria Jolanta Sulewska
2
1
Department of Geotechnical Engineering, Institute of Civil Engineering, Warsaw University of Life Sciences—SGGW, Nowoursynowska 159 St., 02-776 Warsaw, Poland
2
Faculty of Civil and Environmental Engineering, Bialystok University of Technology, Wiejska 45E St., 15-351 Bialystok, Poland
*
Author to whom correspondence should be addressed.
Materials 2023, 16(1), 125; https://doi.org/10.3390/ma16010125
Submission received: 7 October 2022 / Revised: 19 December 2022 / Accepted: 20 December 2022 / Published: 23 December 2022
(This article belongs to the Section Construction and Building Materials)

Abstract

:
In engineering practice, due to the high compressibility and very low shear strength of organic soils, it is difficult to construct an embankment on organic subsoil. High variability and significant change in geotechnical parameters cause difficulties in predicting the behavior of organic soils under embankment loading. The aim of the paper was to develop empirical relationships used in the preliminary design for evaluating the settlement and undrained shear strength of organic subsoil loaded by embankment based on data obtained from four test sites. Statistical multiple regression models were developed for evaluating the settlement in time and undrained shear strength in time individually for peat and gyttja. Neural networks to predict the settlement and undrained shear strength in time for peat and gyttja simultaneously as double-layer subsoils as well as a separate neural network for peat and a separate neural network for gyttja as single-layer subsoils were also developed. The vertical stress, thickness, water content, initial undrained shear strength of peat and gyttja, and time were used as the independent variables. Artificial neural networks are characterized by greater prediction accuracy than statistical multiple regression models. Multiple regression models predict dependent variables with maximum relative errors of about 35% to about 60%, and neural networks predict output variables with maximum relative errors of about 25% to about 30%.

1. Introduction

A general problem in many countries, including Poland, is that many geotechnical structures such as dam embankments, levees, and dikes, and road embankments have to be often built on organic subsoil [1,2,3]. In engineering practice, due to the high compressibility and very low initial undrained shear strength of organic soils, it is difficult to construct an embankment even of a relatively low height. For the design of embankments on organic subsoil, important problems which have to be solved are the assessment of embankment stability and subsoil deformations. Stability analysis has to be carried out for different loading conditions but an evaluation of the stability during construction is of major importance. The stability analysis of embankment during construction is usually based on undrained shear strength τfu of organic soils. For a stage-constructed embankment, time and money can be saved if the undrained shear strength increase in the organic soils and their settlement beneath the embankment can be accurately predicted [4].
The behavior of soft clays and organic soils has been studied and analyzed by many researchers in terms of primary and secondary compression [5], isotaches concept [6,7], rate process [8], resistance concept [9], and creep deformations [10,11,12,13]. The high complexity of the behavior of Holocene organic soils under loading results primarily from their large compressibility with creep effects, low undrained shear strength, significant changes in permeability with porosity changes, non-linear material characteristics, and significant spatial variability of properties [1,14,15]. In the preliminary design of embankments on organic subsoil, the prediction of settlement and the change in undrained shear strength can be carried out based on empirical relationships often obtained from the statistical analysis [16,17,18,19,20,21,22,23,24,25]. The final settlement of organic soils can be estimated using empirical relationships based on the thickness of organic soils, water content or void ratio of organic soils, and stress increase [1,2]. The final increase in undrained shear strength of organic soils can be evaluated using empirical relationships as a function of effective stress increase [14,18]. There is a lack of empirical relationships to predict both the settlement and undrained shear strength of organic soils in time. For the final design, various theories [26,27,28] and numerical models [29,30,31,32,33,34,35,36] taking into account to varying degrees the above-mentioned factors to predict the deformations and the change in undrained shear strength are used. These methods require the determination of the soil characteristics and parameters carried out based on field and laboratory tests [37,38,39].
Statistical procedures (linear and non-linear, single and multiple regression models) [40] and more and more often—artificial neural networks (ANNs) are most often used as tools for the analysis of the results of empirical studies of geotechnical parameters [41,42,43]. Neural networks are analytical techniques modeled on the simplified learning process of the neurological functions of the brain of living beings. They are able to predict new observations (variables) from other observations (same or different variables) after learning from the existing data [44,45]. Among the many types and topologies of neural networks, the multi-feed-forward layered neural networks of the Multi-Layer Perceptron (MLP) type are most often used in regression problems [46,47]. They have neurons organized into layers. The input layer introduces to the network i input variables (Xi). The output layer neurons calculate the output variables j of the entire network (Yj). The neurons of the hidden layers and the output layer are connected to all the neurons of the previous layer. Neural networks perform calculations based on the principle of parallel operation of a system of individual neurons, each of which acts as a specific signal converter. Each neuron calculates its activation level by taking the weighted sum of the neuron outputs of the previous layer, then transforming this sum with the activation function to obtain its output variable. The network unknowns, i.e., the number of network parameters (NNP) are weights and threshold values (biases) of individual neurons. The process of learning the network is aimed at such a correction of the set of weights and biases to obtain the smallest value of the error function, i.e., the smallest difference between the actual value of the output variable and the approximated value. Artificial neural networks are non-linear tools taught by iterative algorithms. Artificial neural networks can be used to predict both the settlement and undrained shear strength of organic soils in time under embankment loading.
Shahin et al. [48] presented the state-of-the-art examination of artificial neural networks in geotechnical engineering. The use of artificial neural networks to predict the settlement of shallow foundations on granular soils has been shown by Shahin et al. [49] and to predict the settlement of a stone column under a highway embankment by Chik et al. [50].
The aim of the paper was to develop empirical relationships used in the preliminary design for evaluating the settlement and undrained shear strength in the time of organic subsoil loaded by embankment based on data obtained from four test sites. Statistical multiple regression models and neural network models were developed for evaluating the settlement in time and undrained shear strength in time for peat and gyttja. Applying the design and build system the artificial neural networks supplemented by new data can be also used during embankment construction. This paper presents the results of field and laboratory tests of organic soils at the Białośliwie, Antoniny, Wonieść, and Koszyce test sites. Organic subsoils consist peat layer (amorphous and moderately decomposed) and calcareous soil called “gyttja” (calcareous and calcareous-organic) loaded by test embankments. The tested amorphous and moderately decomposed peats were with very high porosity being the ratio of pore volume to total volume n = 0.80–0.88 and organic content Iom between 65% and 90%. The calcareous gyttja and calcareous-organic gyttja were with high porosity n = 0.70–0.75, calcium carbonate content CaCO3 between 65% and 90%, and organic content Iom between 6% and 30%. Due to very high water content, the calcium carbonate and organic content matters are very soft with non-linear material characteristics, creep effect under loading, and significant spatial variability of properties. Data from four test sites concerning the settlement and undrained shear strength measurements were collected to elaborate a method for evaluating the settlement and undrained shear strength of organic soils in time based on statistical analysis. However, the statistical regression models may sometimes show relatively high values of maximum relative error. Therefore, a method for evaluating the settlement and undrained shear strength of organic subsoil loaded by embankment in time using artificial neural networks based on data obtained from four test sites is presented in this study. The presented neural network, with an architecture of 9–5–4, predicts the settlement in time and undrained shear strength in time simultaneously for peat and gyttja as double-layer subsoil based on four independent variables: vertical stress in peat and gyttja, the thickness of peat and gyttja layers, the water content of peat and gyttja, initial undrained shear strength of peat and gyttja, and a common independent variable: time. A separate neural network for peat with an architecture of 5–5–2 and a separate neural network for gyttja 5–5–2 as single-layer subsoils were also developed.

2. Materials and Methods

2.1. Characteristics of the Test Sites

2.1.1. Białośliwie Site

The Białośliwie test site is located in north-western Poland in the Noteć River valley where the Department of Geotechnical Engineering of the Warsaw University of Life Sciences performed extensive field and laboratory investigations during the construction of pound dikes in the 1980-ties [51]. Four test embankments (with and without vertical prefabricated drains) on peat-gyttja subsoil and on peat subsoil were constructed in one stage. The embankment without vertical drains No. 2 with a height of 2 m caused vertical stress of 35 kPa on the peat layer and 32 kPa on the gyttja layer and embankment No. 4 with a height of 2.2 m causing vertical stress of 40 kPa on peat subsoil (Figure 1) is considered in the paper.

2.1.2. Antoniny Site

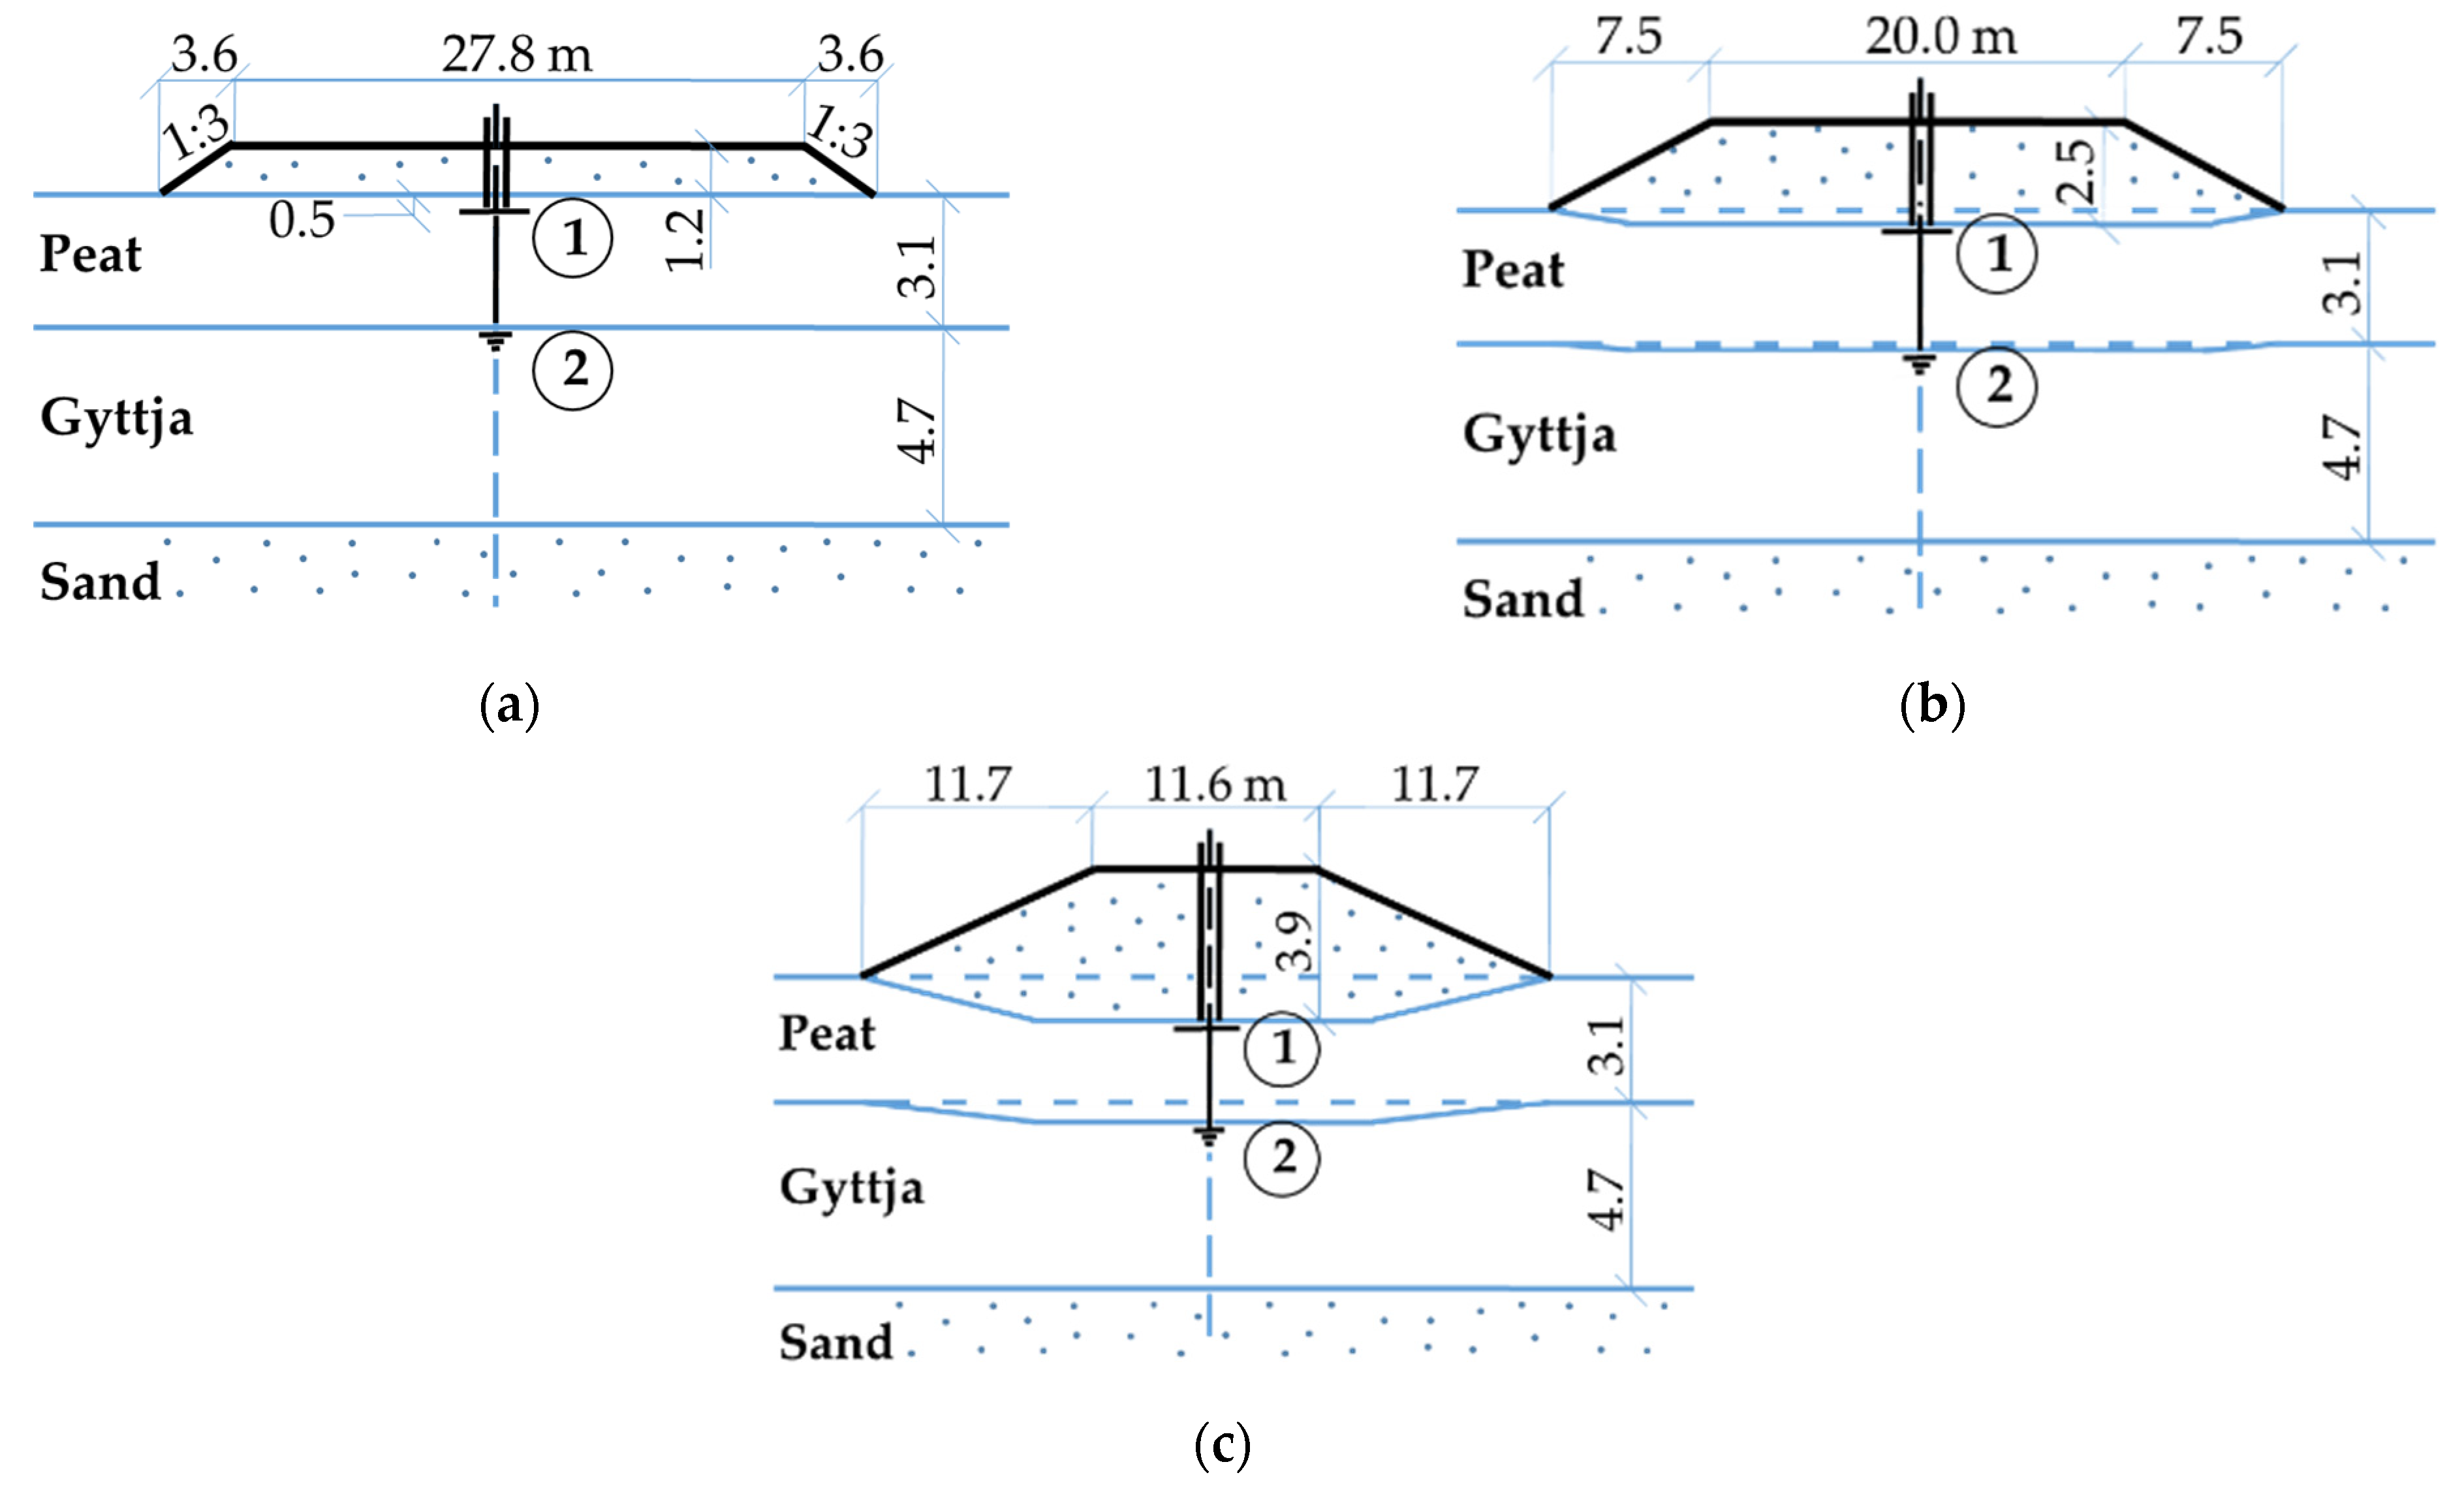
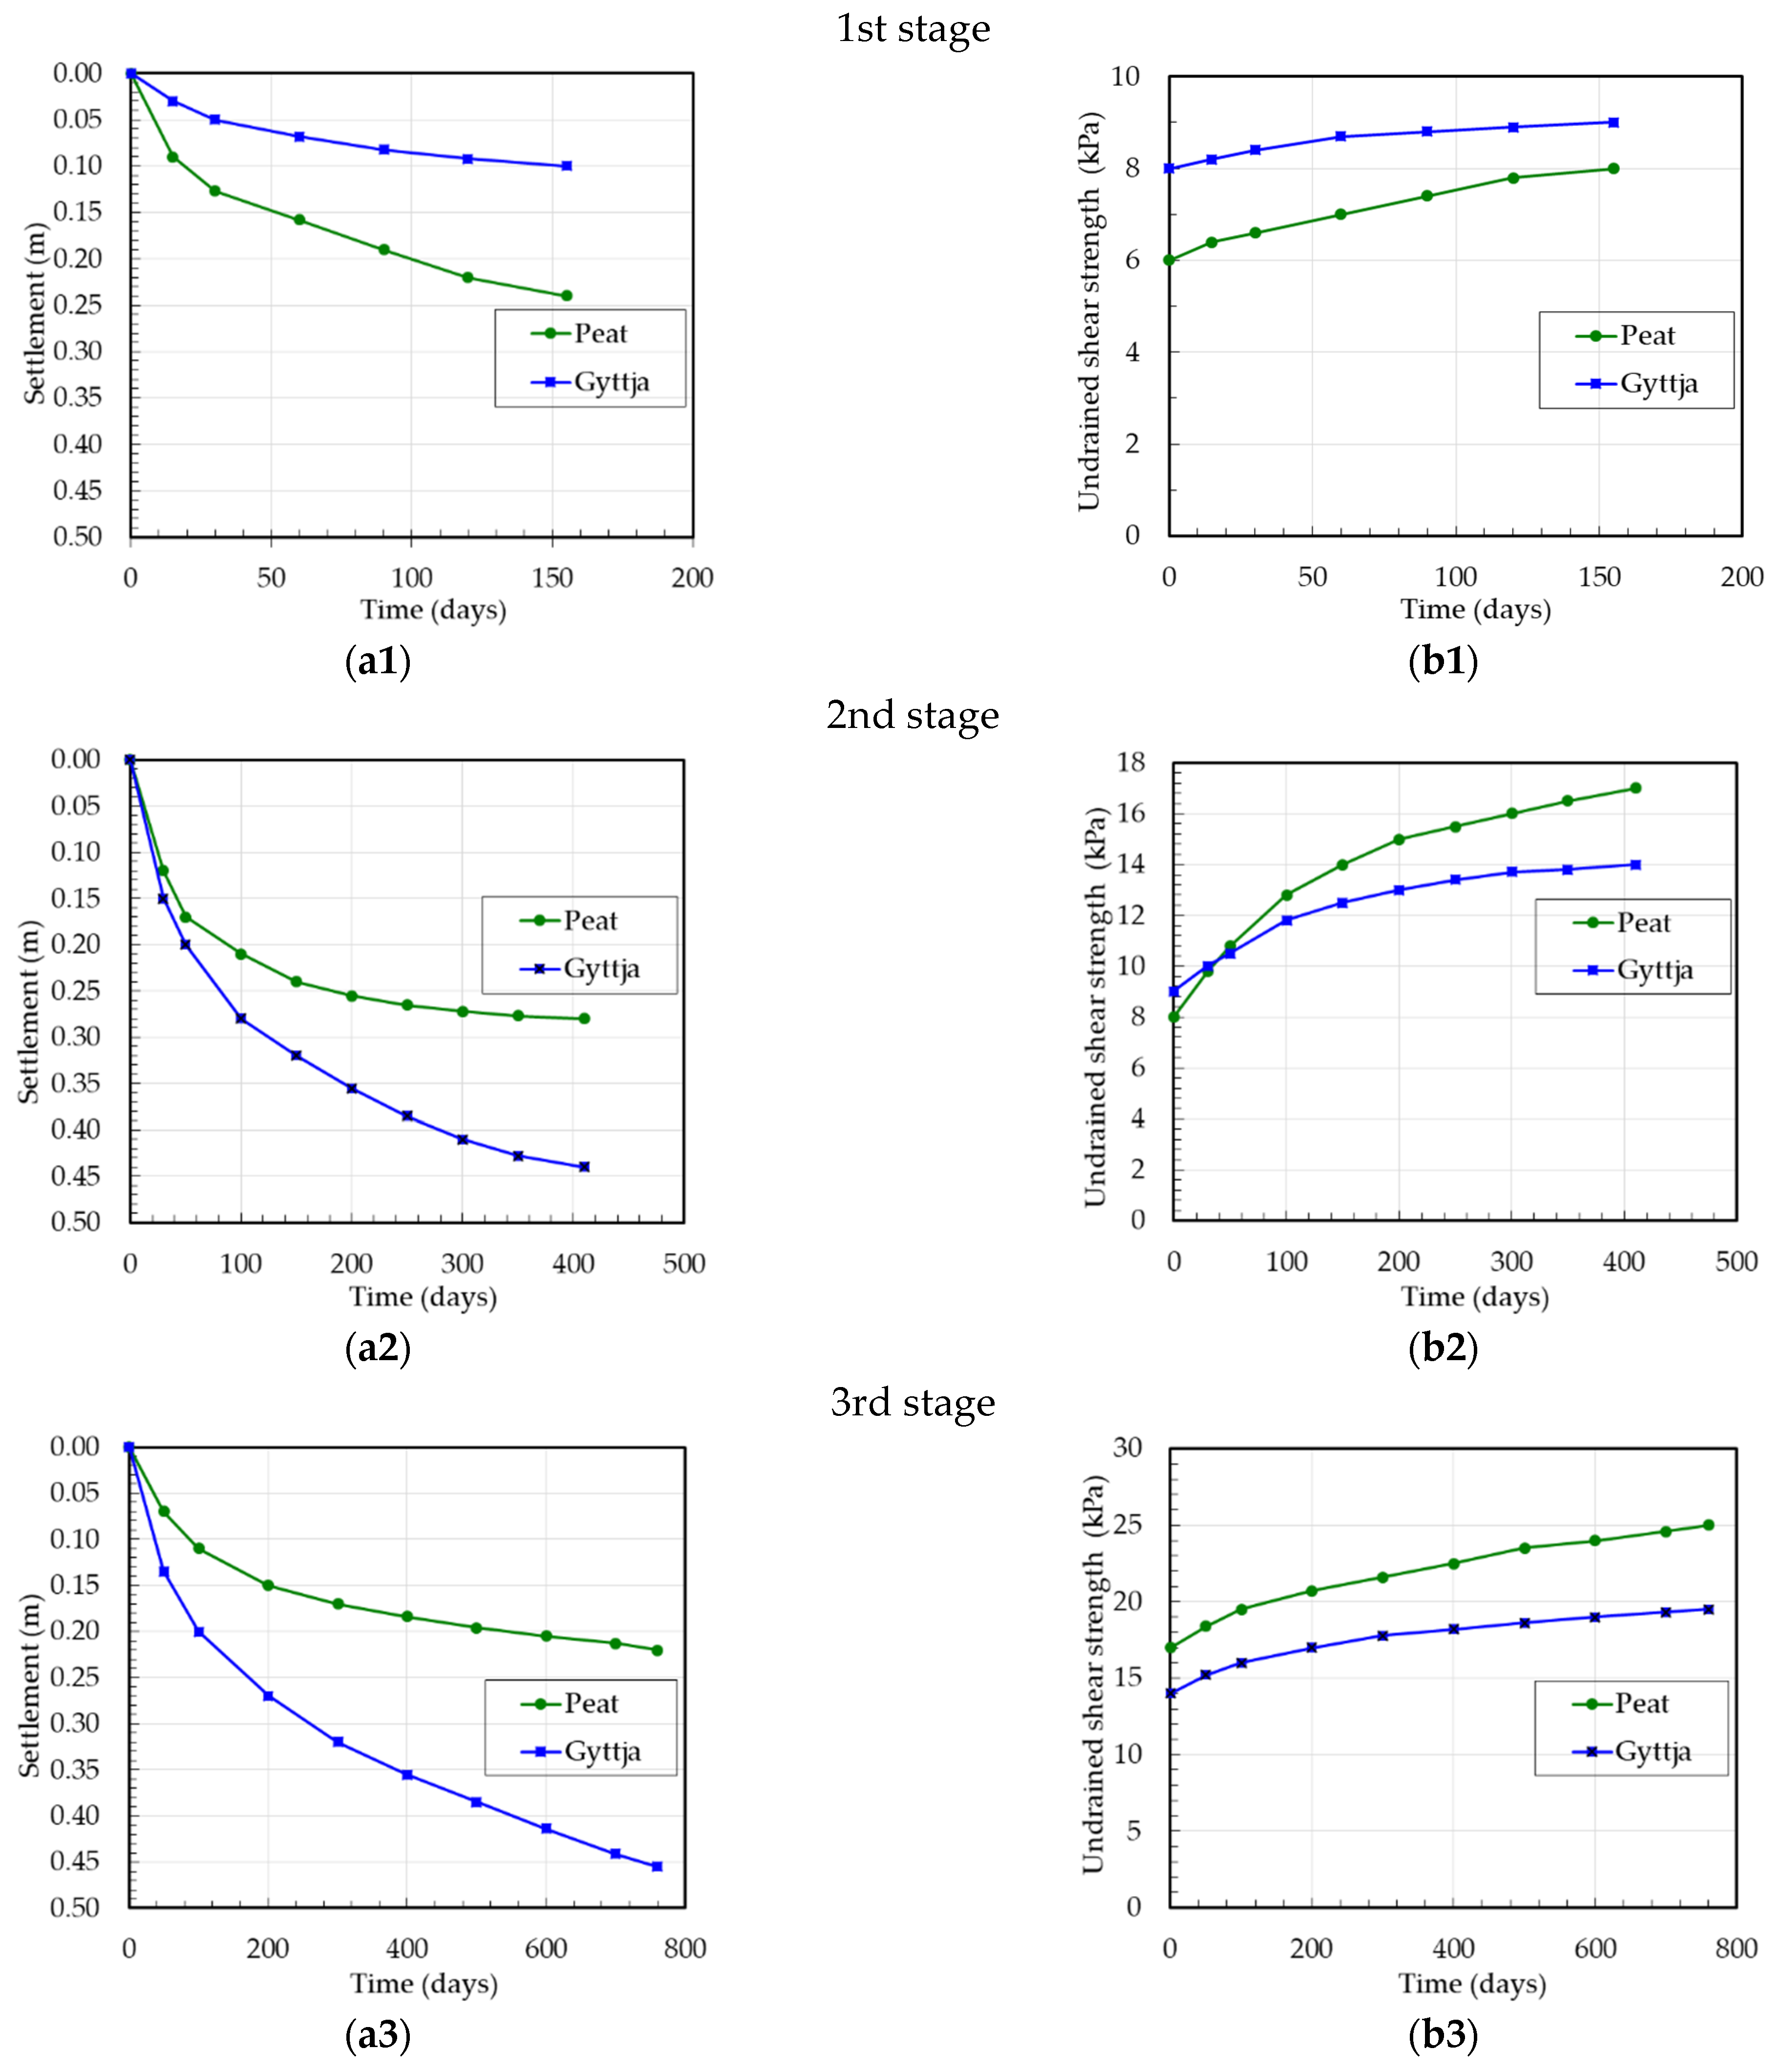
The Antoniny test site is located in north-western Poland in the Noteć River valley where the Department of Geotechnical Engineering of the WULS in cooperation with the Swedish Geotechnical Institute performed extensive field and laboratory investigations during the construction of river levees [52,53,54,55]. Two test embankments (with and without vertical prefabricated drains) were constructed in three stages between 1983–1987. The embankment without vertical drains constructed in three stages (Figure 2) was then brought to failure by successively increasing the height of the fill [53]. In the first stage, the embankment height was 1.2 m, in the second stage, 2.5 m, and in the third stage, 3.9 m. The increase in the embankment height in the following stages caused the increment of vertical stress 21 kPa, 20 kPa, and 19 kPa on the peat layer and 20 kPa, 19 kPa, and 18 kPa on the gyttja layer, respectively.

2.1.3. Wonieść Site

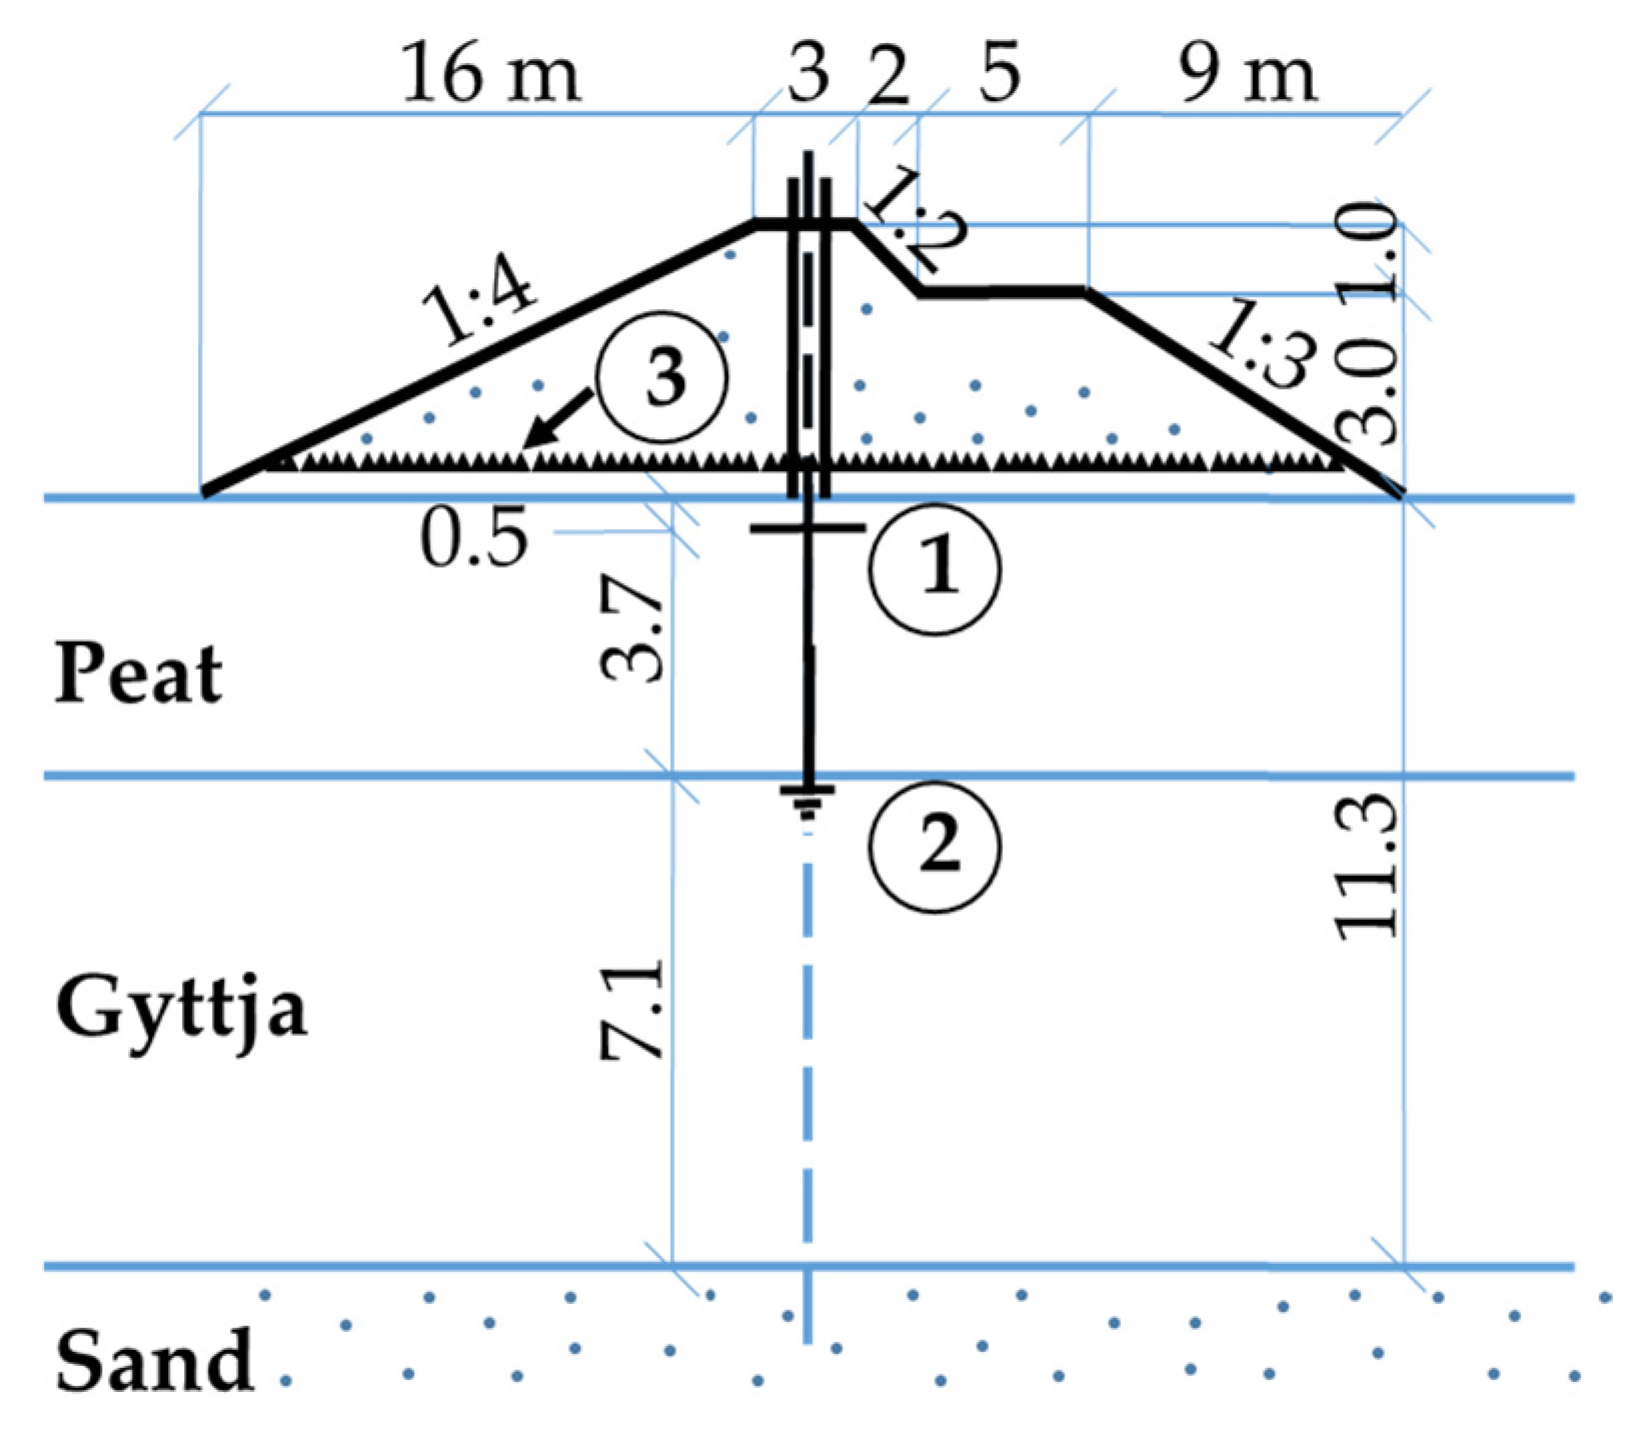
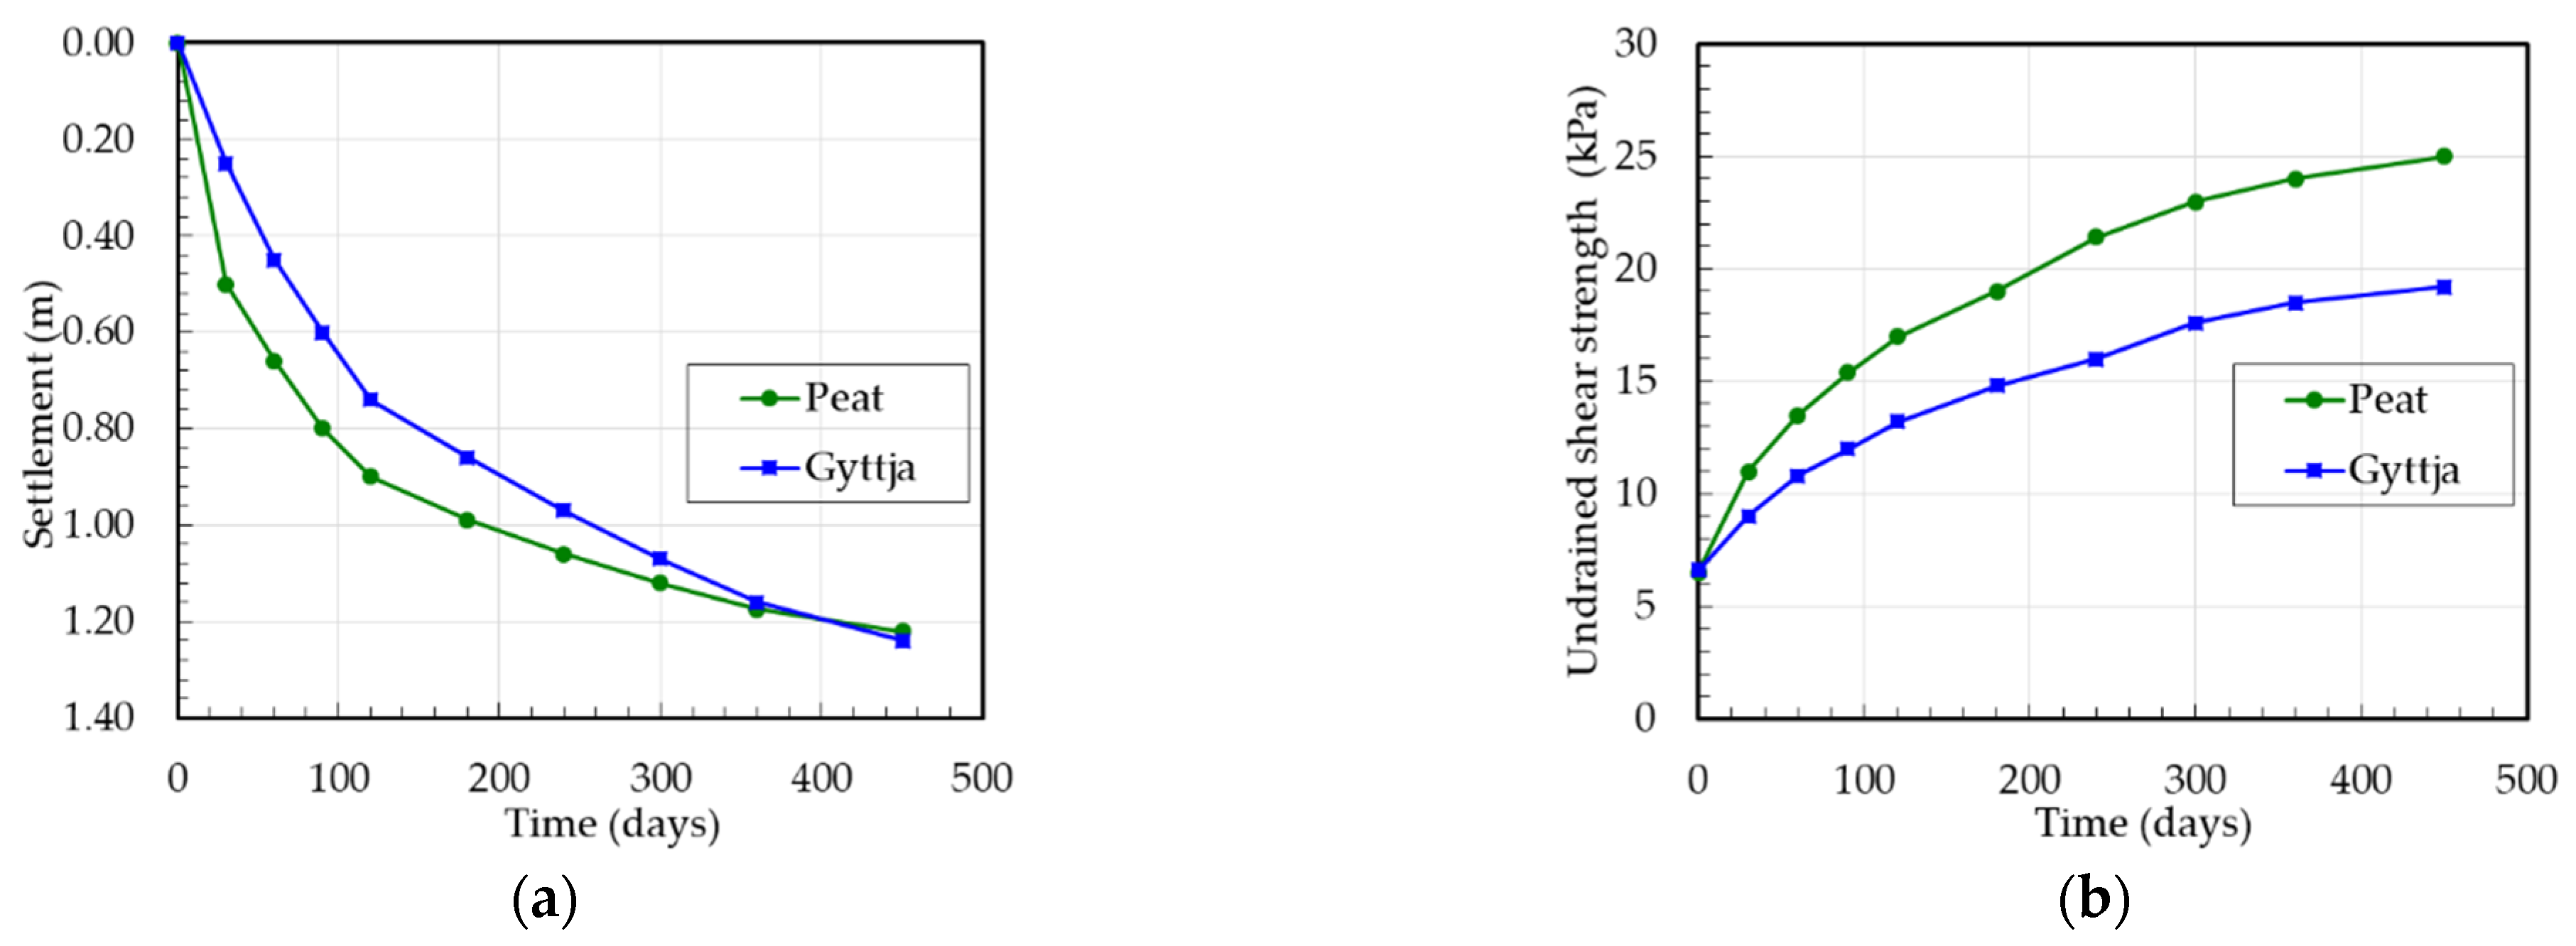
The Wonieść test site is located in western Poland in the Samica River valley where the Department of Geotechnical Engineering of the WULS performed extensive field and laboratory investigations during the construction of embankment dams in the 1980-ties [56]. The main dam embankment was constructed on peat-gyttja subsoil in one stage on a reinforcement steel mattress (Figure 3). The embankment height was 4 m causing vertical stress of 70 kPa on the peat layer and 60 kPa on the gyttja layer.

2.1.4. Koszyce Site

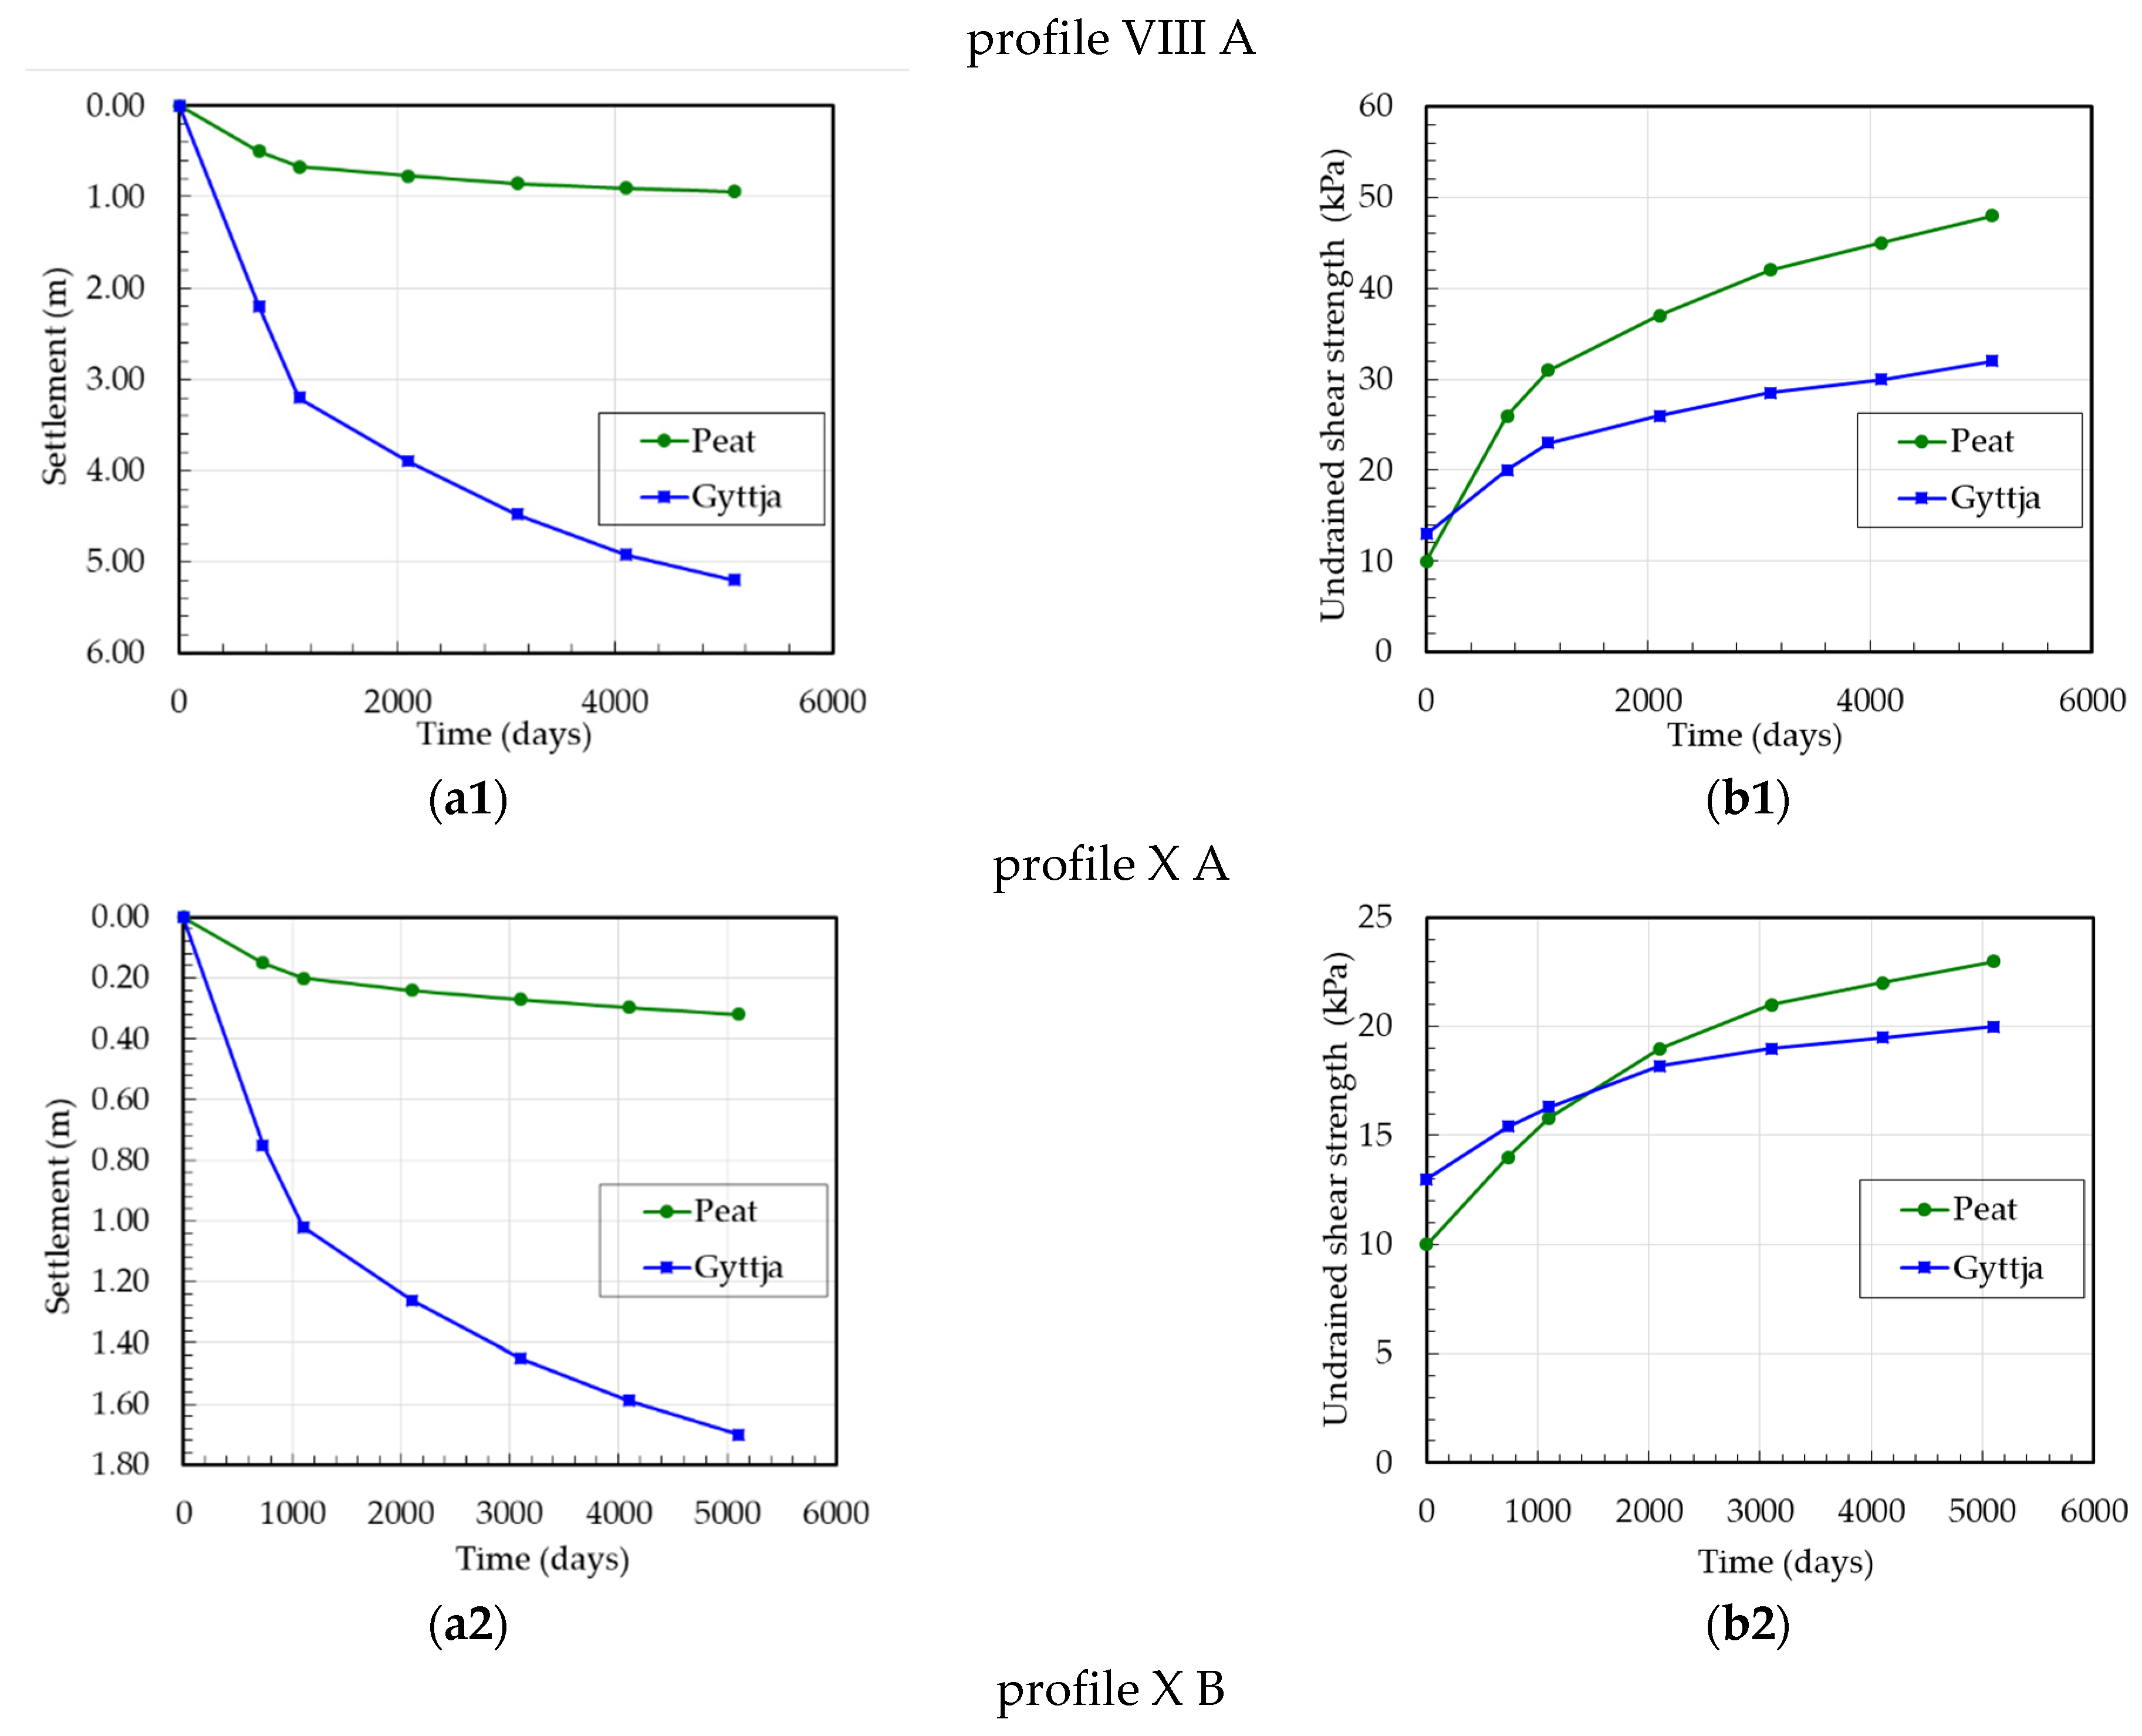
The Koszyce test site is located in north-western Poland in the Ruda River valley where a laboratory and field testing program was performed below and outside of the main dam embankment of the Koszyce reservoir (Figure 4) [57]. Due to the presence of deep soft organic subsoil, the dam embankment was constructed on a reinforcement steel mattress. Very low undrained shear strength of the organic soils with significant variability in thickness combined with relatively quick embankment loading caused a break of the mattress and embankment failure during the construction with very large deformations of organic subsoil in the central part of the Koszyce dam [57]. The cross-sections of the embankment dam outside of the failure zone for a period of three years of construction and eleven years of maintenance are considered in the paper. The embankment heights at the three selected profiles were 6 m causing vertical stress of 100 kPa on the peat layer and 95 kPa on the gyttja layer, 2 m causing vertical stress of 35 kPa on the peat layer, and 32 kPa on the gyttja layer and 4 m causing vertical stress 65 kPa on peat layer and 60 kPa on the gyttja layer.

2.2. Characteristics of the Tested Organic Soils

2.2.1. Białośliwie Site

At the Białośliwie site, the virgin subsoil consists of a sedge peat layer and a calcareous-organic soil layer called “gyttja” underlain by a fine sand layer. Based on origin as well as organic content Iom and calcium carbonate content CaCO3, peat and gyttja were classified [1]. Under embankment No. 2, the organic subsoil with a thickness of 4.0 m, consists of a 2.0 m thick peat layer and a 2.0 m gyttja layer. Under embankment No. 4, the organic subsoil consists of a 4.0 m thick peat layer. The peat layer is moderately decomposed, with water content wn between 410% and 430%, and organic content Iom between 85% and 90%. The calcareous-organic gyttja layer is characterised by water content wn between 120% and 130%, organic content Iom between 20% and 25%, and calcium carbonate content CaCO3 between 65% and 70%. The organic matter content Iom was determined by combustion at a temperature of +550 °C [58]. The calcium carbonate content CaCO3 was determined by the gasometer method [58].

2.2.2. Antoniny Site

At the Antoniny site, the virgin subsoil consists of an amorphous peat layer and a calcareous-organic gyttja, and calcareous gyttja underlain by a fine sand layer. The organic subsoil, 7.8 m thick, consisting 3.1 m thick peat layer and a 4.7 m gyttja layer. Organic soils are overconsolidated with an over-consolidation ratio (OCR), decreasing from 5 to 2 with depth. The amorphous peat layer is with water content wn between 310% and 340%, and organic content Iom between 65% and 75%. The calcareous-organic and calcareous gyttja layers are characterised by water content wn between 110% and 140%, organic content Iom between 8% and 20%, and calcium carbonate content CaCO3 between 70% and 90%.

2.2.3. Wonieść Site

At Wonieść site the virgin subsoil consists of a sedge-reed peat layer and a calcareous-organic gyttja underlain by a fine sand layer. The organic subsoil, 11.3 m thick, consists of a 4.2 m thick peat layer and a 7.1 m gyttja layer. The moderately decomposed peat layer is with water content wn between 500% and 550%, and organic content Iom between 65% and 80%. The calcareous-organic and calcareous gyttja layers are characterised by water content wn between 150% and 160%, organic content Iom between 15% and 30%, and calcium carbonate content CaCO3 between 65% and 80%.

2.2.4. Koszyce Site

At the Koszyce site, the central part of the dam embankment is founded on organic subsoil with a variable thickness. The soft subsoil consists of organic sediments with a thickness from 4 m to 27 m. The uppermost 2.5 m consists of peat. Below there is a layer of gyttja with a thickness from 2 m to 25 m. Below occurs a sand layer. The amorphous peat layer is characterised by water content wn between 500% and 550%, and organic content Iom between 80% and 85%. The calcareous-organic and calcareous gyttja layers are characterised by water content wn between 110% and 140%, organic content Iom between 6% and 20%, and calcium carbonate content CaCO3 between 65% and 80%.

2.3. Settlement and Undrained Shear Strength Measurements

The field investigations performed at the test sites included, among others, settlement measurements and evaluation of undrained shear strength from Field Vane Tests (FVT). In order to evaluate the undrained shear strength τfu of organic soils from FVT, the measured shear strength τfv was corrected by using the correction factor μ according to the formula:
τ f u = μ · τ f v ,
The correction factor μ was evaluated according to the method elaborated by the Swedish Geotechnical Institute (SGI) [59]. Other methods used to evaluate the correction factor μ were presented in the literature [1,52,53].

2.3.1. Białośliwie Site

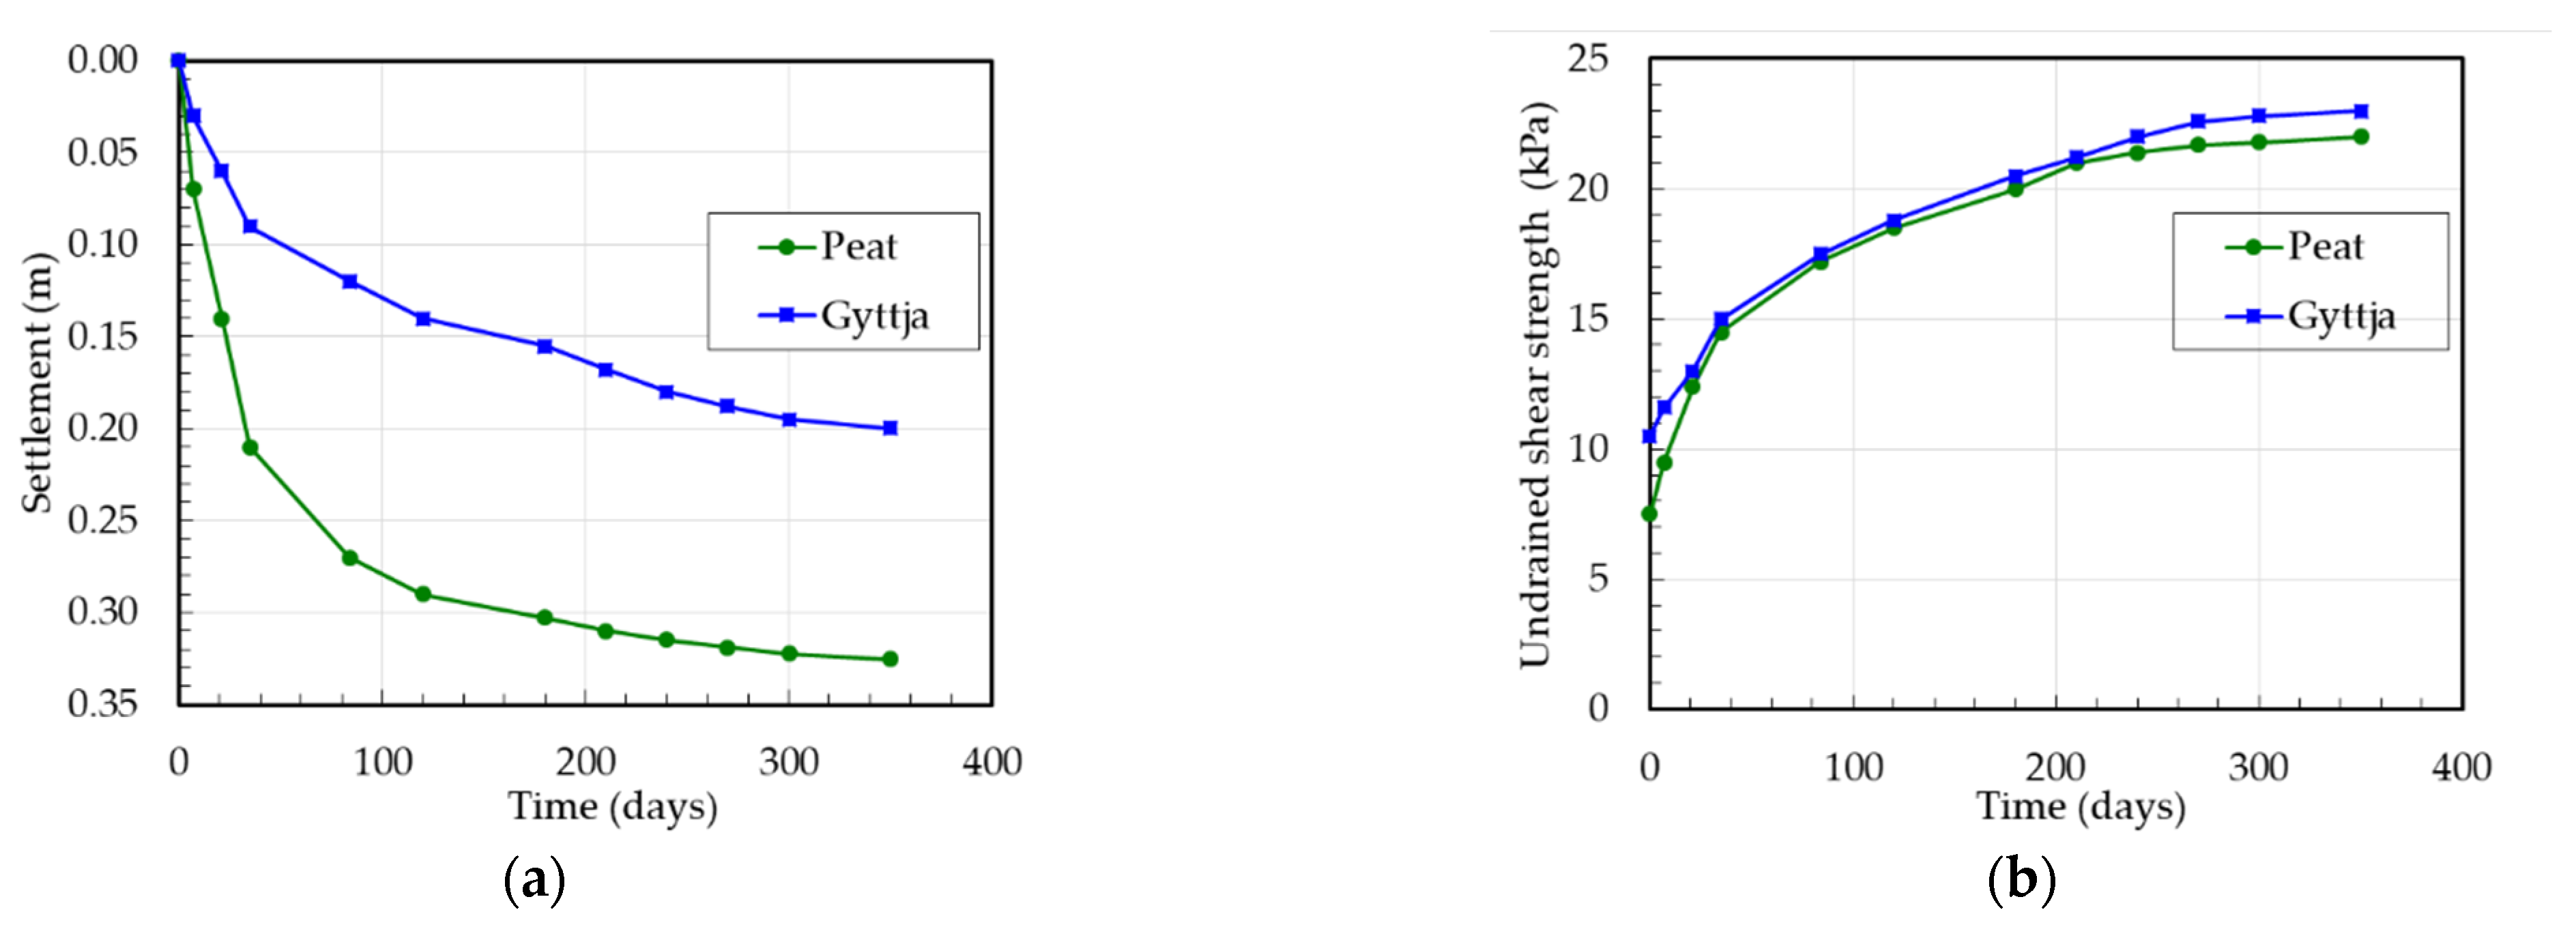
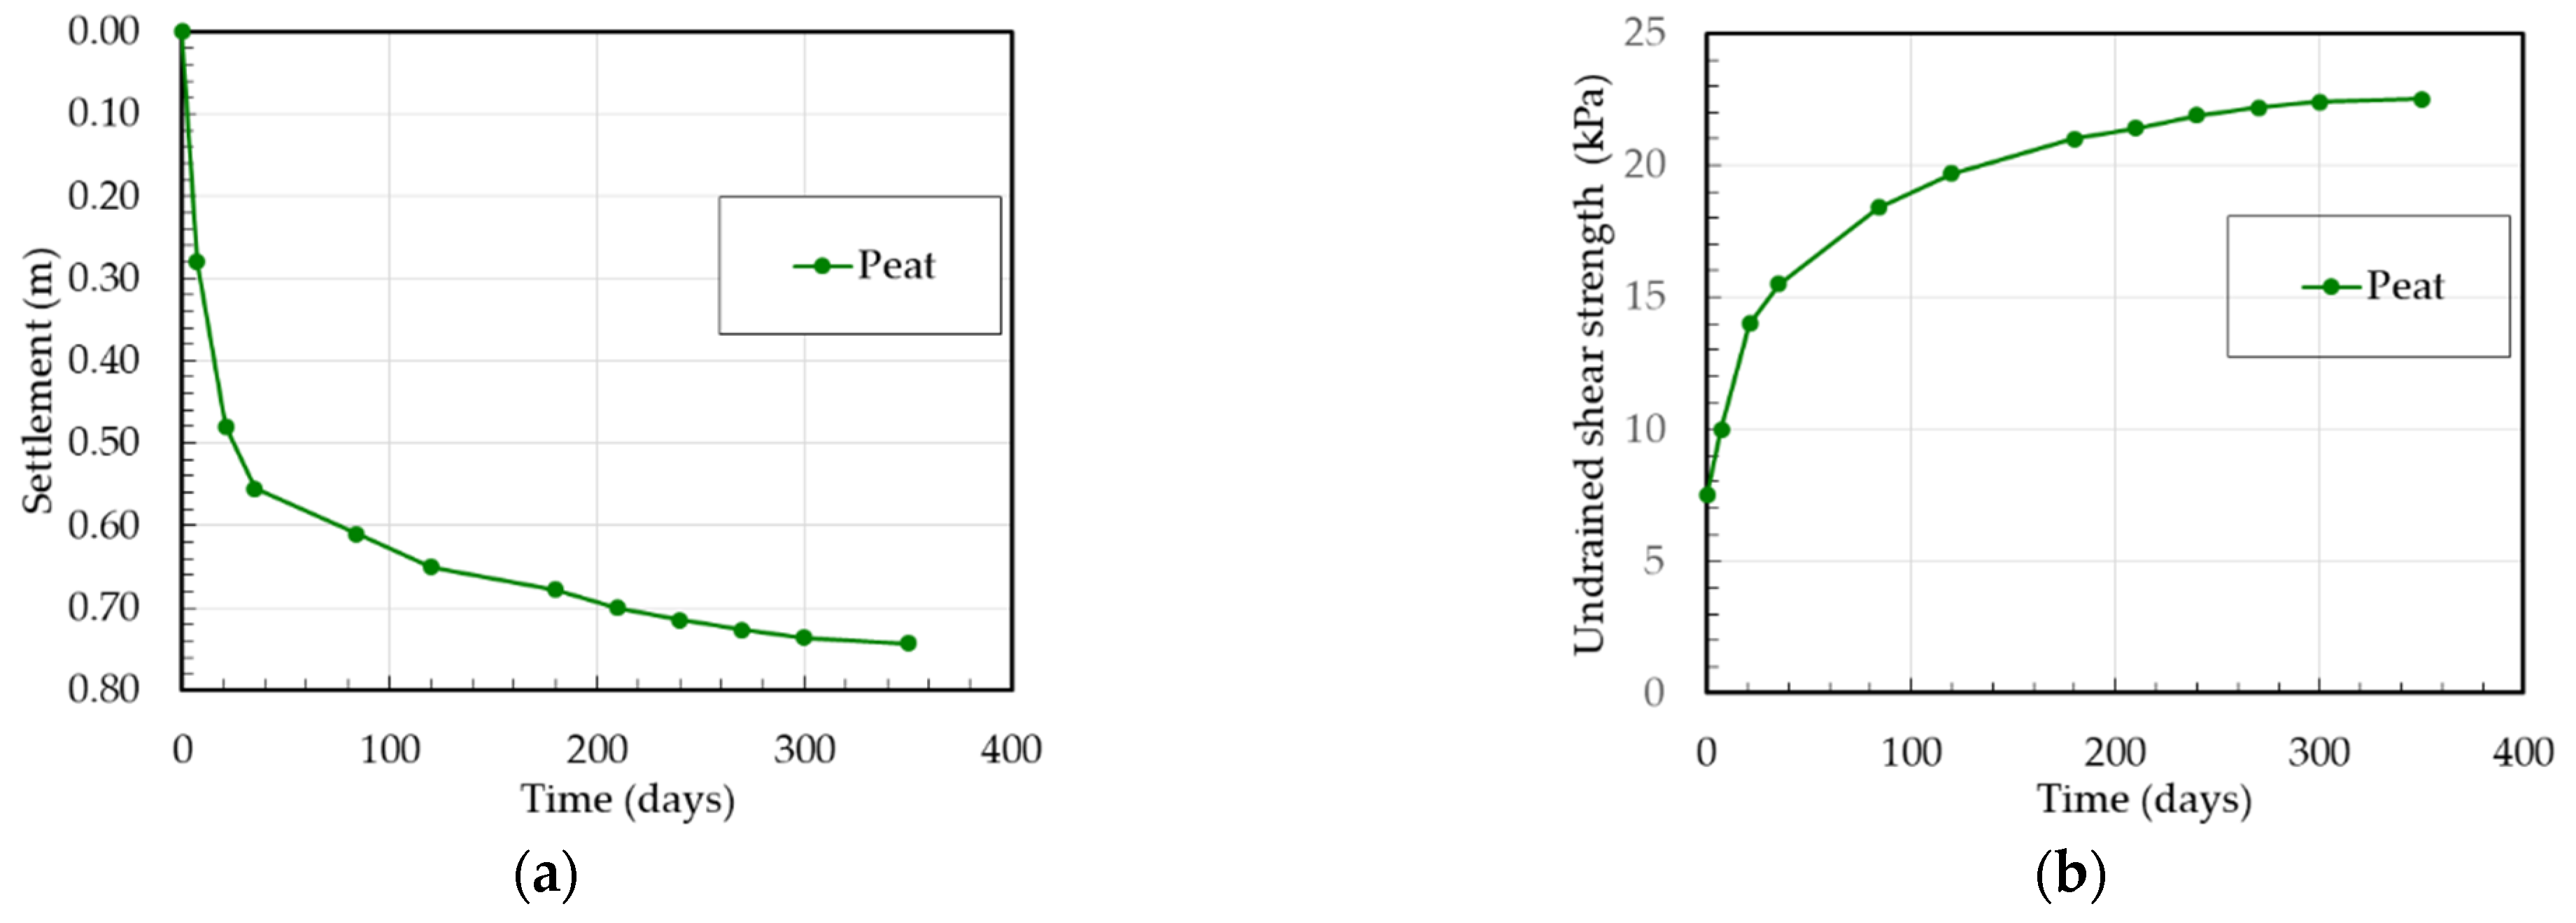
The settlement measurements of peat and gyttja at the Białośliwie site were carried out on the basis of levelling the surface settlement gauge (installed 0.5 m below ground level, at the peat surface) and deep settlement gauge (installed at the gyttja surface) for the test embankment No. 2 and the surface settlement gauge (installed 0.5 m below at the peat surface) for the test embankment No. 4. Therefore, for settlement analysis the initial thickness of peat and of gyttja layers were 1.5 m and 2.0 m for test embankment No. 2 and of peat layer was 3.5 m for test embankment No. 4, respectively. In order to evaluate the undrained shear strength τfu of organic soils from FVT, the measured shear strength τfv was corrected by using the correction factor μ according to the SGI method for peat μ = 0.5 and for gyttja μ = 0.7. The settlements and undrained shear strength versus the time of peat and gyttja at the Białośliwie site for the test embankment No. 2 and No. 4 are presented in Figure 5 and Figure 6.

2.3.2. Antoniny Site

The settlement measurements of peat and gyttja at the Antoniny site for three stages were carried out on the base of levelling the surface settlement gauge (installed 0.5 m below ground level, at the peat surface) and deep settlement gauge (installed at the gyttja surface). Taking into account individually each stage, for settlement analysis, the initial thickness of peat and of gyttja layers for the first stage were 2.60 m and 4.70 m, for the second stage 2.36 m and 4.60 m and for the third stage 2.08 m and 4.16 m, respectively. The correction factor μ according to the SGI method was used for peat μ = 0.5 and for gyttja μ = 0.7–0.8. The settlements and undrained shear strength versus the time of peat and gyttja at the Antoniny site for three stages are presented in Figure 7.

2.3.3. Wonieść Site

The settlement measurements of peat and gyttja at the Wonieść site were carried out on the base of levelling the surface settlement gauge (installed 0.5 m below the peat surface) and deep settlement gauge (installed at the gyttja surface). Therefore, for settlement analysis the initial thickness of peat and of gyttja layers were 3.7 m and 7.1 m, respectively. The correction factor μ according to the SGI method was used for peat μ = 0.5 and for gyttja μ = 0.6. The settlements and undrained shear strength versus the time of peat and gyttja at the Wonieść site are presented in Figure 8.

2.3.4. Koszyce Site

In order to evaluate the change in the geometry of the organic subsoil at the Koszyce site during the period of three years of construction and eleven years of maintenance, the field investigation including borings, soundings, and settlement measurements has been analysed. Therefore, for settlement analysis, three different heights of the dam embankment were selected with the initial thickness of peat layer 2.0 m and of gyttja layers 14.0 m and 12.0 m, respectively. The correction factor μ according to the SGI method was used for peat μ = 0.5 and for gyttja μ = 0.6–0.7. The settlements and undrained shear strength versus the time of peat and gyttja at the Koszyce site for three profiles are presented in Figure 9.
Figure 5, Figure 6, Figure 7, Figure 8 and Figure 9 show the measurement results of the settlement and undrained shear strength of organic soils (peat and gyttja) during the consolidation process caused by the embankment loading. The presented measurement results were used as dependent variables to develop regression and neural models. In engineering practice, there is a need to develop empirical relationships using easy-to-determine parameters for the preliminary design of embankments on organic subsoil to the prediction of settlement and undrained shear strength in time. Based on the analysis of many parameters, the vertical stress, thickness, water content, initial undrained shear strength of peat and gyttja, and time were initially selected as independent variables.

3. Results

The database for the analysis consisting 82 cases described by a total of 13 variables: nine independent variables X1–X9 and four dependent variables Y1–Y4. Notations of independent and dependent variables and the statistical specifications of the database used in the regression models are presented in Table 1.
A detailed summary of the test results of the analyzed variables is presented in Table 2.
It can be seen that the tests were carried out in a wide range of time t, vertical stress σ, and for a large range of thickness of the gyttja layer.

4. Analysis of Test Results

Statistical and neural calculations were performed using the STATISTICA version 12 computer program [60]. Statistical analyzes were performed assuming the significance level α = 0.05.

4.1. Statistical Analysis of Results

In the beginning, the importance and significance of individual independent variables and their correlation with dependent variables were estimated. On the basis of the coefficient matrix of a simple linear correlation r, it was found that for peat and for gyttja, there are statistically significant correlations between the dependent variables Yj and the independent variables Xi. Matrices of simple linear correlation coefficients r for peat and gyttja are presented in Table 3 and Table 4. Statistically significant correlation coefficients r are marked in bold. The remaining simple correlations between the variables are statistically insignificant.
For peat, the coefficients r of linear simple correlation of individual regression equations are: for Y1 = f (Xi) where i = 1, 3, 5, 7, 8, r = (−0.288)–0.617 (with the most influential variable being X1 when r = 0.617) and for Y3 = f (Xi) where i = 1, 5, 7, 8, except X3 when r = −0.165, r = 0.331–0.683 (with the most influential variable being X7 when r = 0.683).
For gyttja, the coefficients r of linear simple correlation of individual regression equations are Y2 = f (Xi) where i = 2, 4, 6, 7, 9, r = 0.369–0.821 (with the most influential variable being X7 when r = 0.821), and Y4 = f (Xi) where i = 2, 4, 6, 7, 9, r = 0.639–0.815 (with X9 being the most influential variable when r = 0.815).
Linear multiple regression models for peat were developed: Y1 = f (X1, X3, X5, X7, X8) and Y3 = f (X1, X5, X7, X8). Linear multiple regression models for gyttja were developed: Y2 = f (X2, X4, X6, X7, X9) and Y4 = f (X2, X4, X6, X7, X9).
Standard estimation errors SEE were calculated based on the obtained regression equations, using the Formula (2):
S E E = 1 n ( y ( p ) d ( p ) ) 2 n 2
The standard estimation errors SEE informs about the average value of empirical deviations of the value of the dependent variable from the value of the dependent variable calculated from the model, i.e., informs about the degree of fit of the model to the empirical data [57]. The smaller the SEE, the better the model fits.
Relative prediction errors RE were calculated based on the obtained regression equations, using the Formula (3):
R E = | y ( p ) d ( p ) y ( p ) | · 100 % ,
where y(p) is the value obtained from the tests, d(p) is the value obtained by the model, p = 1, …, n, where n is the number of patterns for a given variable in the analyzed data set.
The obtained regression equations and their coefficients of determination R2, the standard estimation errors ±SEE, and the maximum relative prediction errors ±REmax are presented in Table 5. The models included only statistically significant variables, and statistically insignificant variables were omitted.
It can be seen, the maximum relative prediction error REmax using the multiple regression equations of peat and gyttja settlement is about 60%, and the relative error of predicting undrained shear strength is 40% and 35%, respectively.

4.2. Analysis of Results Using Artificial Neural Networks

To solve the regression problems, one-way networks Multi-Layer Perceptron (MLP) type with the N-H-M architecture were used, where N is the number of input variables, H is the number of neurons in one hidden layer and M is the number of output variables.
Three neural networks were developed:
  • 9–5–4 network for simultaneous prediction of four dependent variables Y1-Y4 for a subsoil consisting of two layers—peat and gyttja,
  • 5–5–2 network for simultaneous prediction of two dependent variables Y1 and Y3 when the subsoil is single-layer—only from peat,
  • 5–5–2 network for simultaneous prediction of two dependent variables Y2 and Y4 when the subsoil is single-layered—only from gyttja.
Neural networks with four outputs were used, calculated simultaneously for peat and for gyttja (Y1 and Y3 as well as Y2 and Y4). The entire data set with the total cases number of n = 82 was randomly divided into subsets: the training subset L = 66 cases, the validation subset V = 8 cases, and the testing subset T = 8 cases. The training subset L used to train the network, the validation subset V used to determine the number of network learning epochs—“early stopping”, i.e., the number of epochs at which the error in the validation set is the smallest [46]. The testing subset T was not used for training and validation and was used for the final one-time assessment of the predictive quality neural network. Multiple neural networks were analyzed with the same case selection for subsets L, V, and T.
A neural network with the 9–5–4 architecture was selected, i.e., a network with nine inputs (X1-X9), four neurons in the hidden layer, and four outputs (Y1–Y4). An exponential function was chosen from among several activation functions (linear, logistic, tanh, exponential) in hidden neurons, and a linear function in output neurons. The neural network was trained by the Variable Metric Method with the Broyden-Fletcher-Goldfarb-Shanno (BFGS) algorithm [46,60] for 94 epochs (i.e., learning cycles for all cases of the L subset). The number of network parameters (i.e., the number of neuron connection weights and biases) was NNP = N · H + H · M + H + M = 9 · 4 + 4 · 4 + 4 + 4 = 60 < L = 66.
Separate neural networks were also developed: for peat, the 5–5–2 BFGS for 120 epochs network with five inputs (X1, X3, X5, X7, X8), five hidden neurons, and two outputs (Y1, Y3) and for gyttja, the network 5–5–2 BFGS for 91 epochs with five inputs (X2, X4, X6, X7, X9), five hidden neurons, and two outputs (Y2, Y4). For both networks, the activation functions of hidden neurons were exponential, and for output neurons, tangensoidal tanh. All cases were randomly divided into subsets with the following numbers: L = 58, V = 12, and T = 12. The number of unknown networks parameters was NNP = 5 · 5 + 5 · 2 + 5 + 2 = 42 < L = 58.
The obtained artificial neural networks, R2 determination coefficients, and REmax errors in the prediction of individual dependent variables are presented in Table 6.
The RE errors were calculated according to the Formula (3). The value of the error function of the entire neural network was calculated as a Sum of Squares (SOS) [60] according to the Formula (8):
S O S =   1 n p = 1 n j = 1 M ( y j ( p ) d j ( p ) ) 2 ,
where p is the number of patterns in the analyzed subset, j is the number of output neurons.
Table 6. ANNs with the best prediction accuracy and its error measures.
Output-ParameterArchitecture of ANNR2±REmax in Set (L + V + T)
(%)
Formula Number
LVT
Y1 sp9–5–4
(BFGS 94)
0.9140.9100.94325(9)
Y2 sg0.9600.9840.97625
Y3 τp0.9600.9820.98625
Y4 τg0.9540.9820.97025
Y1 sp5–5–2
(BFGS 120)
0.9460.8560.93130(10)
Y3 τp0.9520.9440.91025
Y2 sg5–5–2(BFGS 91)0.9840.9540.94930(11)
Y4 τg0.9800.9780.98225
In addition, a global sensitivity analysis for neural networks [60] was carried out, which showed that for the 5–5–2 neural network for peat, the most influential are the variables (arranged in descending order): X7, X8, X3, X5, and X1, and for the 5–5–2 neural network for gyttja the variables: X6, X7, X9, X4, and X2.
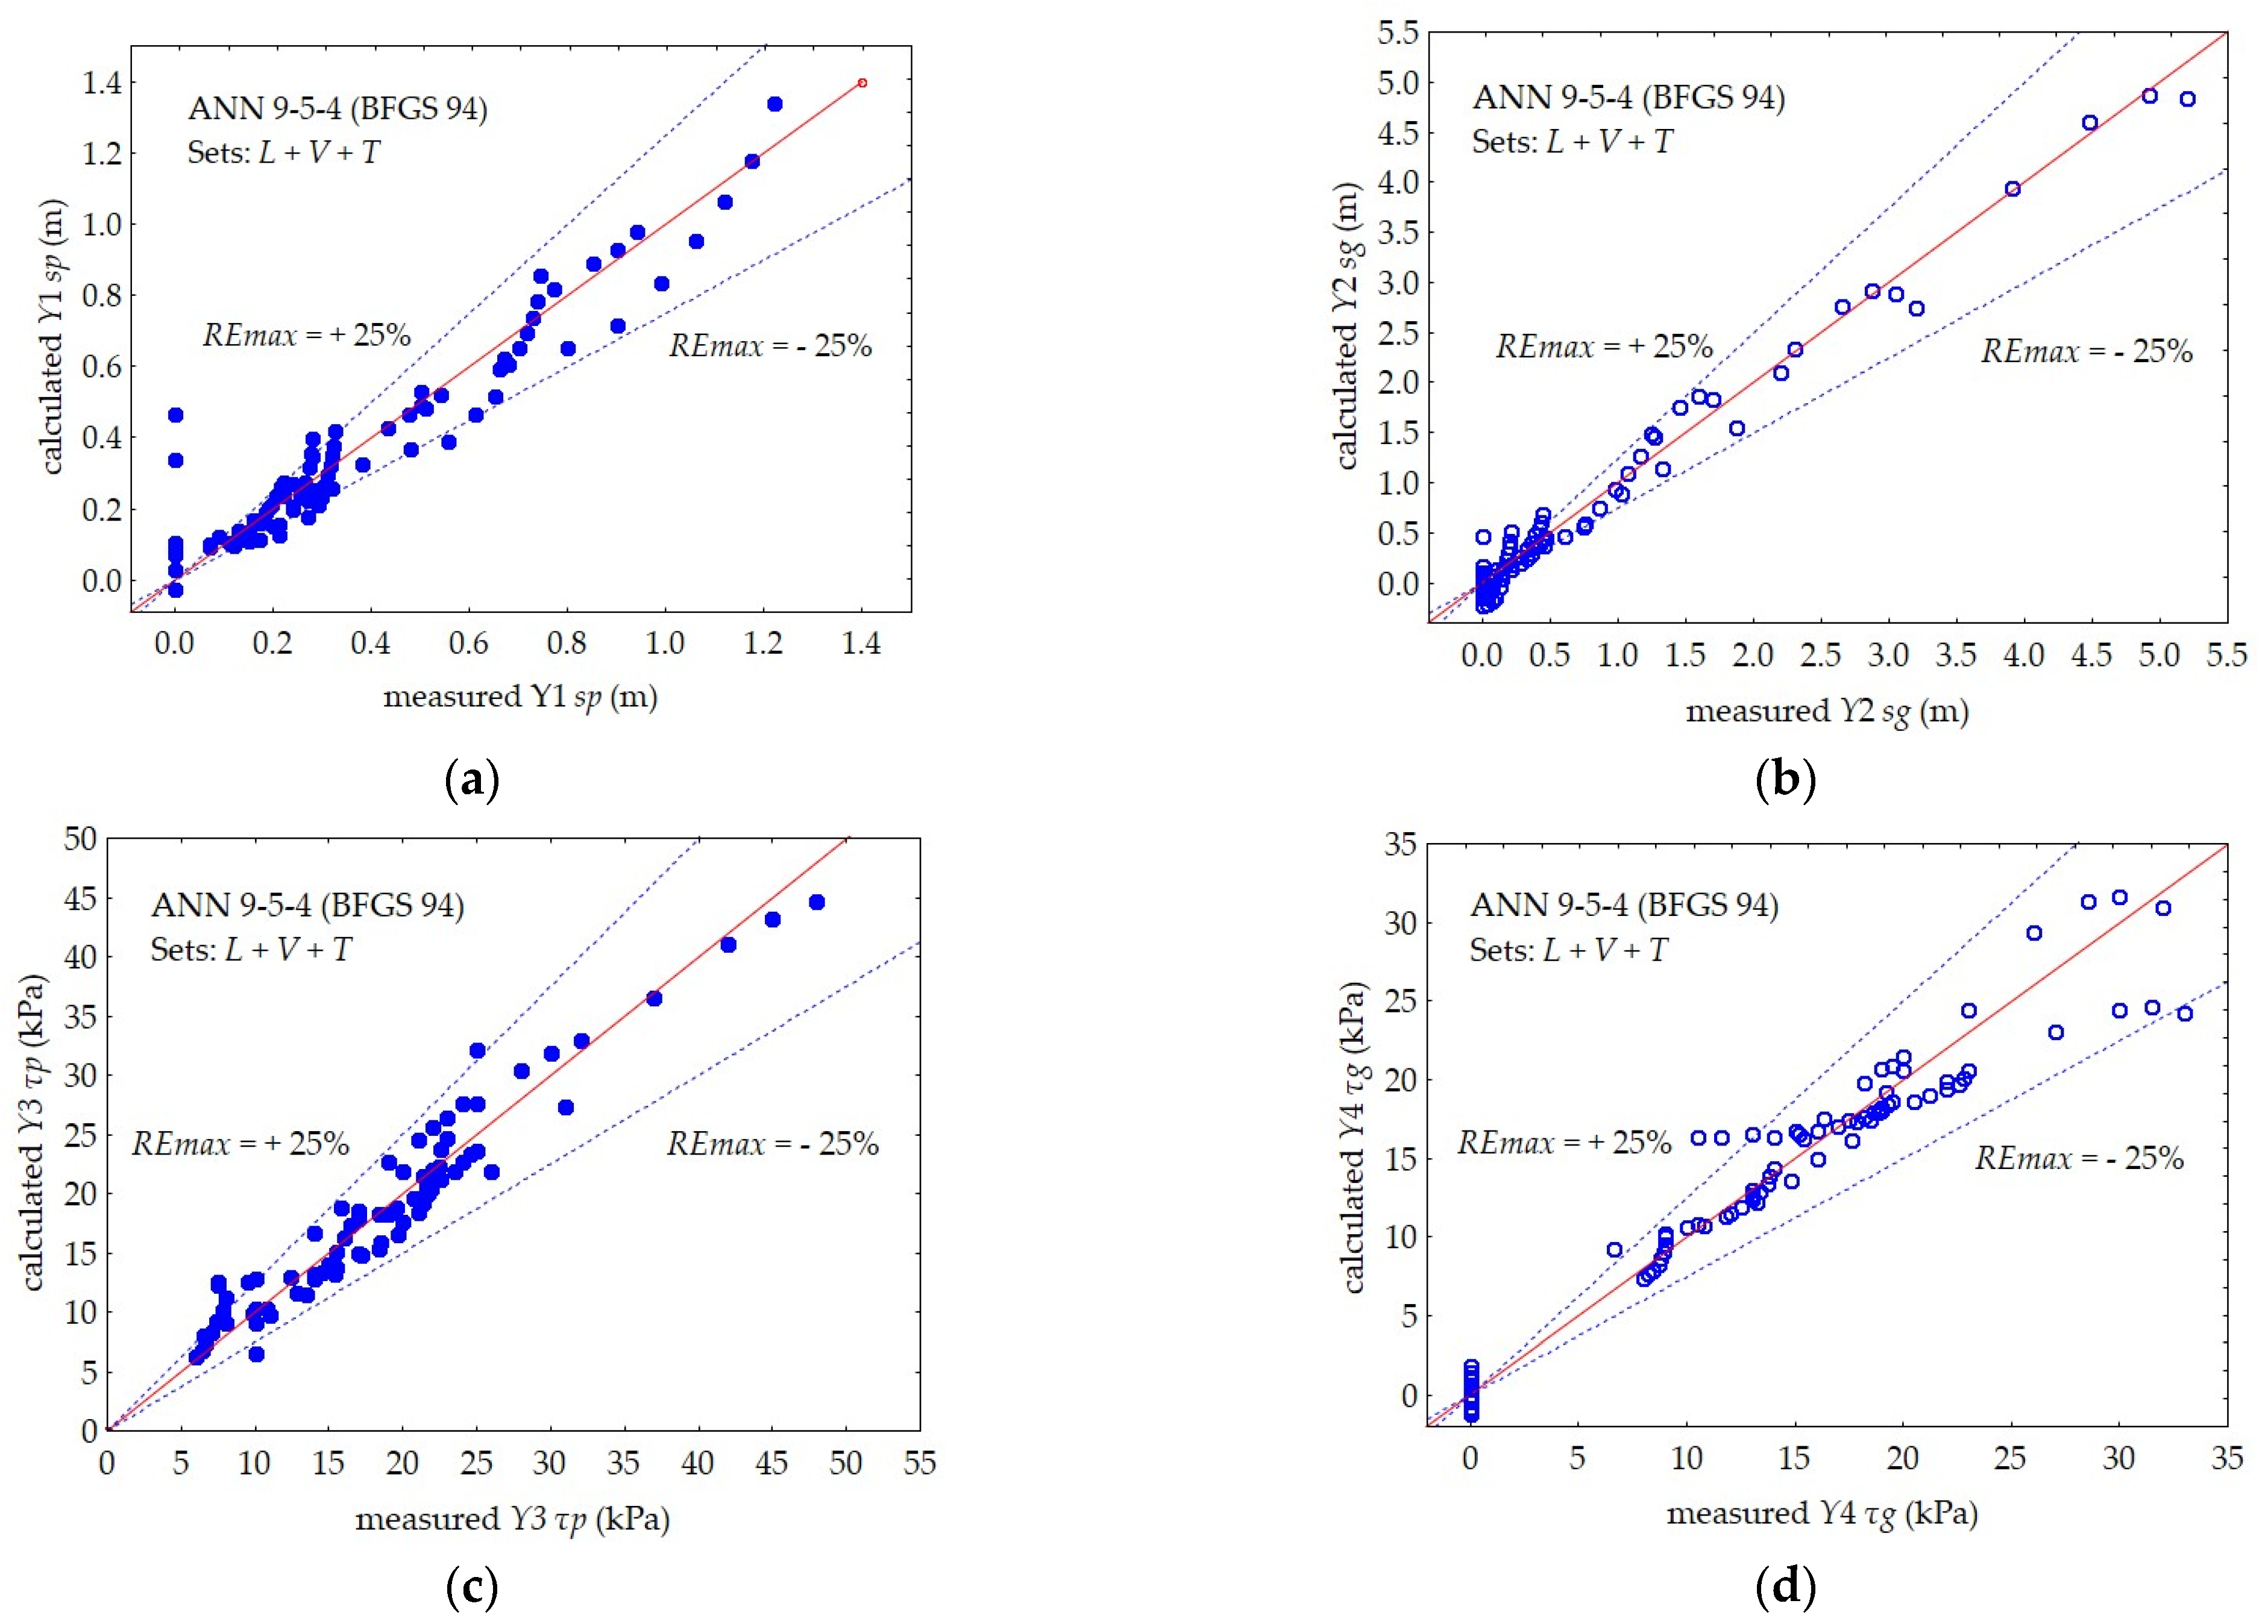
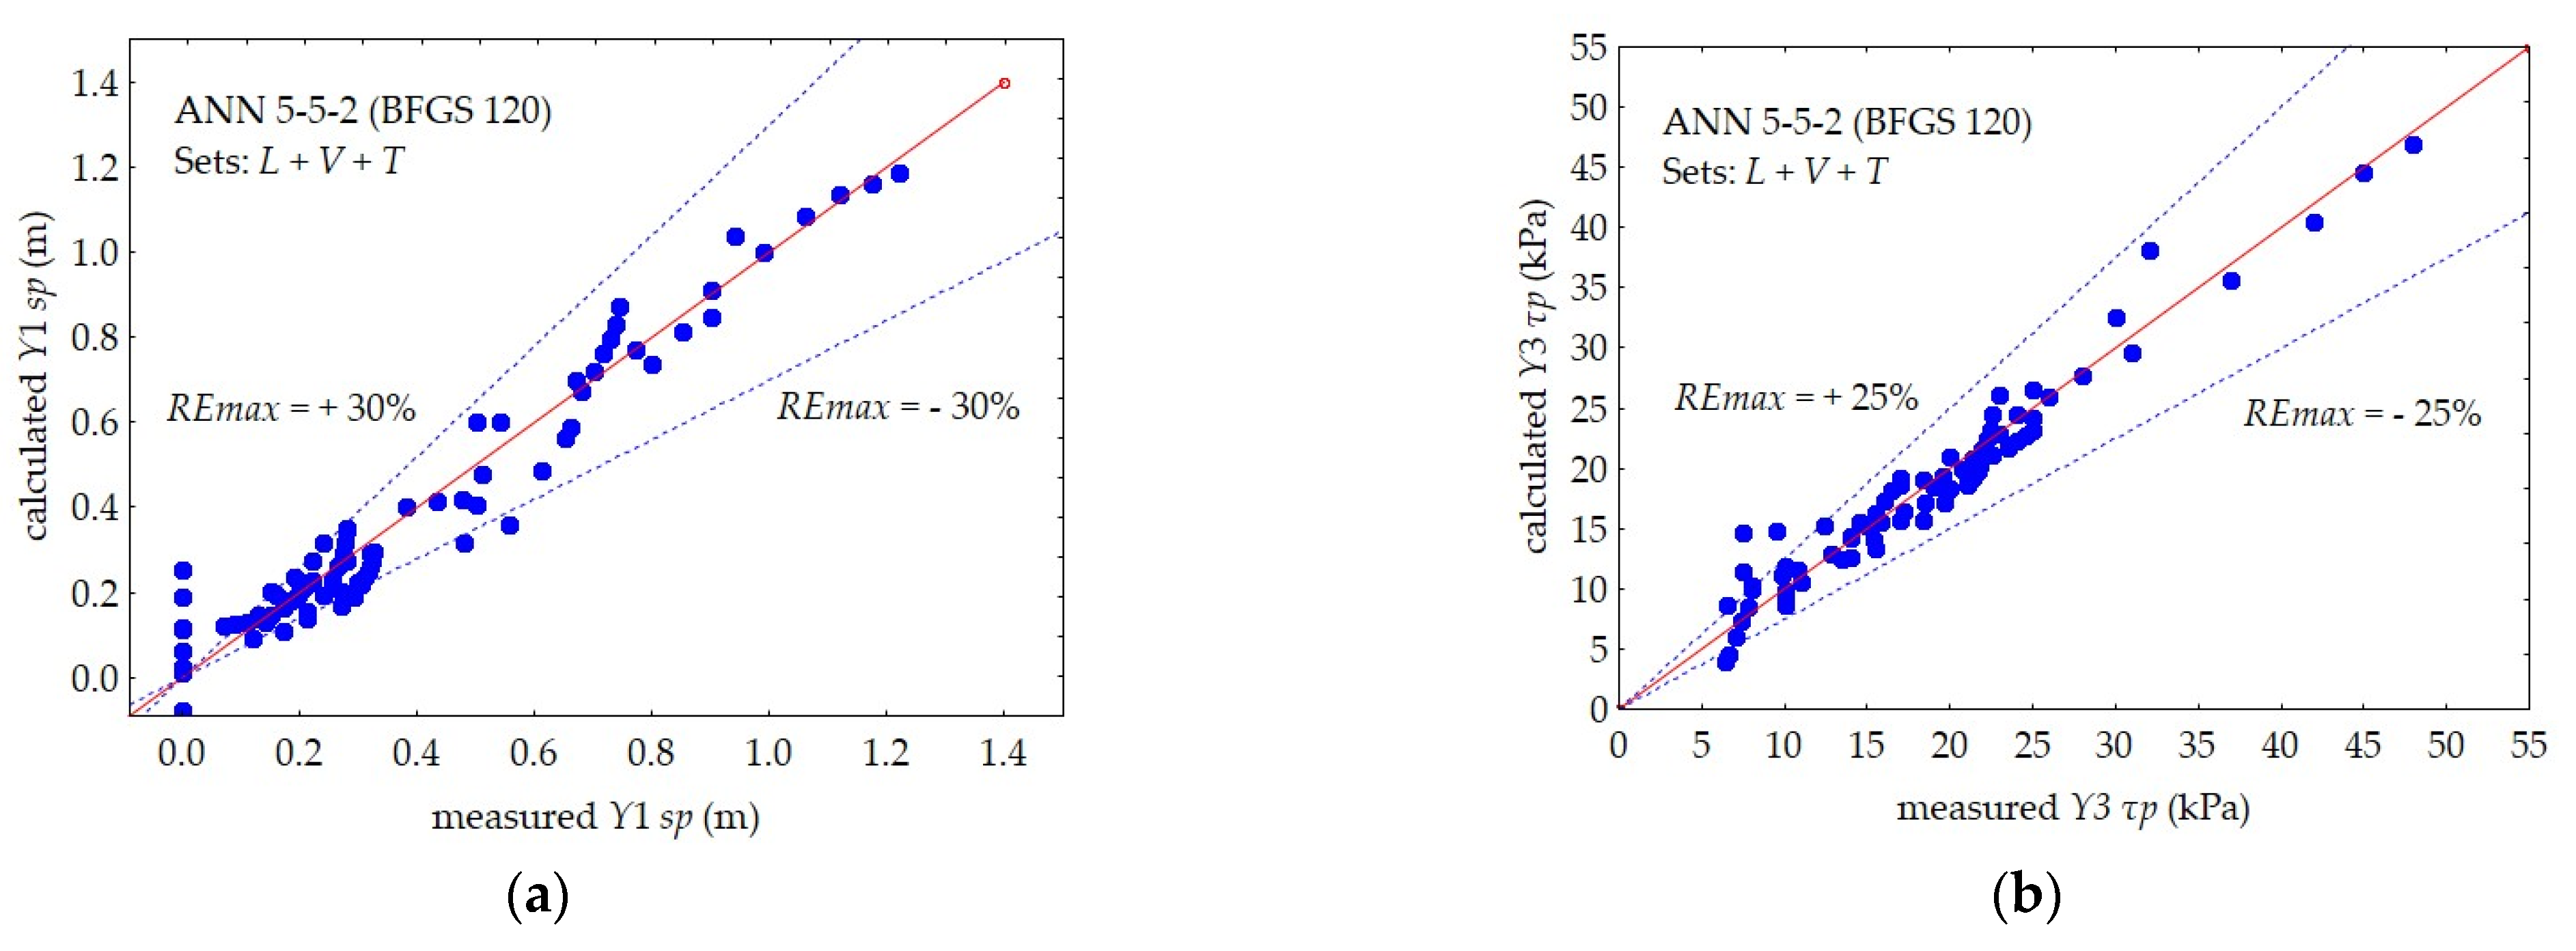
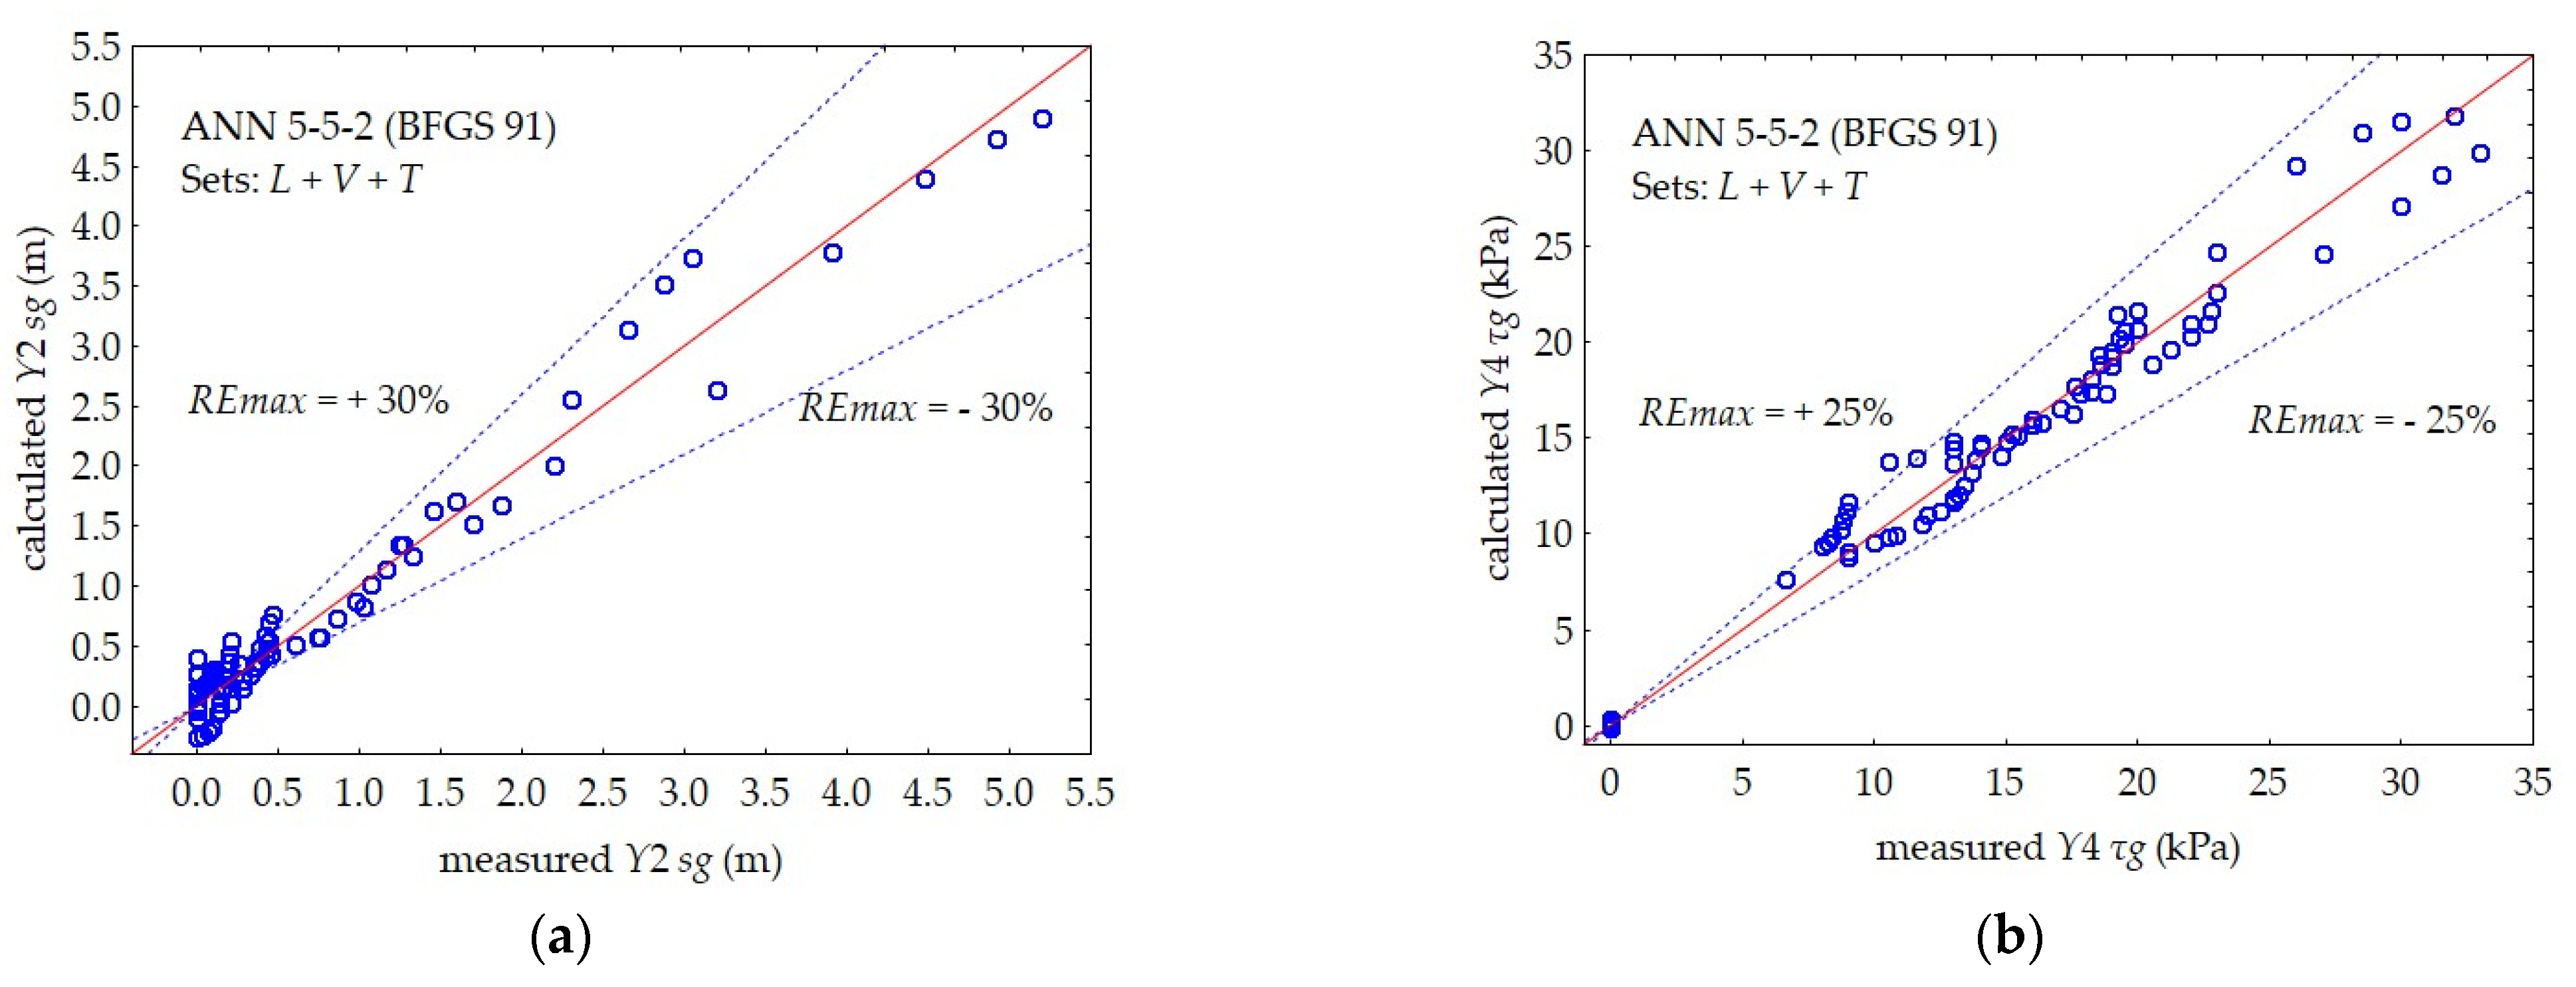
The prediction accuracy, i.e., the maximum relative error of the REmax prediction of the individual dependent variables, is shown in Figure 10, Figure 11 and Figure 12.
The neural network with the 9–5–4 architecture simultaneously predicted the values of four output variables for the subsoil consisting of layers of peat and gyttja (Y1–Y4).
In the case of a single-layer subsoil, a separate 5–5–2 neural network was used, predicting two dependent variables for the peat layer (Y1 and Y3) and a separate 5–5–2 network for the gyttja layer (Y2 and Y4).
The maximum relative error of the REmax prediction of the 9–5–4 neural network, simultaneously predicting the values of the four output variables: Y1 sp, Y2 sg, Y3 τp, and Y4 τg, was about 25% for all dependent variables.
The maximum relative error of the REmax prediction of the 5–5–2 neural network, simultaneously predicting the values of the two output variables for the peat layer: Y1 sp and Y3 τp, was approximately 30% and 25%, respectively.
The maximum relative error of REmax prediction of the 5–5–2 neural network, simultaneously predicting the values of the two output variables for the gyttja layer: Y2 sg and Y4 τg, was approximately 30% and 25%, respectively.

5. Discussion

Based on the comparison of the prediction error measures, it can be seen that, in the studied range of data values, the multiple regression models have determination coefficients R2 = 0.632 and 0.881 (i.e., explain 63.2 and 88.1 of data variability) for the equations for predicting peat or gyttja settlement, respectively, and the maximum relative prediction errors of both equations are of approximately REmax = ±60%. The equations for predicting the undrained shear strength for peat and gyttja have R2 = 0.699 and 0.888 and REmax = ±40% and ±35%, respectively.
The analysis of obtained results indicates that the prediction of the settlement in time and undrained shear strength in time in the case of single-layer subsoils consisted peat or gyttja layers can be done using a separate neural network for peat with an architecture of 5–5–2 and a separate neural network for gyttja 5–5–2. In the case of double-layer of subsoil consisting peat and gyttja layers, the prediction of the settlement in time and undrained shear strength in time can be done using the presented neural network with an architecture of 9–5–4.
An artificial neural network with four outputs 9–5–4 has the error measures for output variables: coefficient of determination R2 = 0.943–0.986 in the testing subset, and for all output variables a maximum relative prediction errors, REmax = ±25%. Neural network 5–5–2 for peat has the errors measures for settlement and undrained shear strength respectively: R2 = 0.931 and 0.910 in the testing subset, and REmax = ±30% and 25%. Neural network 5–5–2 for gyttja has R2 = 0.949 and 0.982 in the testing subset, and REmax = ±30% and ±25%, respectively.

6. Conclusions

In this study, regression and neural modeling of settlement and undrained shear strength in the time of organic subsoil loaded by embankment was carried out. Empirical modeling was applied based on the results of field and laboratory tests of organic soils, using multiple regression equations and artificial neural networks of the MLP type. For the preliminary design of embankments on organic subsoil to the prediction of settlement and undrained shear strength in time the empirical relationships based on the independent variables: the vertical stress, thickness, water content, initial undrained shear strength of peat and gyttja, and time were developed.
The neural model presented in this study provided a more reliable prediction of the settlement in comparison to the statistical models, with a maximum relative prediction error REmax of peat about ±25% and 30% and gyttja about ±25% and 30% for double-layer and single-layer subsoils as well as of the undrained shear strength of peat about ±25% and gyttja about ±25% for both cases. The statistical multiple regression models had greater errors (REmax = ±35–60%) than the neural models.
Based on the analysis of the research results, it can be concluded that artificial neural networks can be used to predict settlement and undrained shear strength in time of the organic subsoil within the range of data under investigation. Artificial neural networks are characterized by better prediction accuracy than statistical regression models. Artificial neural networks with four outputs can be used to predict both settlement and undrained shear strength in time of double-layer subsoil from peat and gyttja layers, neural networks with two outputs can be used to predict both settlement and undrained shear strength in time of a single-layer subsoil from peat or gyttja.

Author Contributions

Z.L. analysed the test results and prepared the manuscript. M.J.S. performed the statistical analysis, and Artificial Neural Network analysis and prepared the manuscript. All authors have read and agreed to the published version of the manuscript.

Funding

This work was supported by the Polish Ministry of Education and Science.

Institutional Review Board Statement

Not applicable.

Informed Consent Statement

Not applicable.

Data Availability Statement

Data available on request.

Acknowledgments

The field and laboratory investigations at the Antoniny test site were carried out in cooperation between the Department of Geotechnical Engineering of the Warsaw University of Life Sciences—SGGW and the Swedish Geotechnical Institute in 1983–1987. This work was carried out in cooperation with partners from the Warsaw University of Life Sciences, Poland, and the Bialystok University of Technology between 2021–2022, it was supported by the Polish Ministry of Education and Science.

Conflicts of Interest

The authors declare no conflict of interest.

References

  1. Wolski, W.; Hartlen, J. (Eds.) Embankments on Organic Soils; Elsevier: Amsterdam, The Netherlands, 1996; Volume 80. [Google Scholar]
  2. Balkema, A.A. CUR Building on Soft Soils; Report 162; CUR, Ed.; Routledge: Oxfordshire, UK, 1996. [Google Scholar]
  3. Duncan, J.M.; Wright, S.G. Soil Strength and Slope Stability; John Willey & Sons: Hoboken, NJ, USA, 2005. [Google Scholar]
  4. Ladd, C.C. Stability evaluation during staged construction. J. Geotech. Eng. Div. 1991, 117, 540–615. [Google Scholar] [CrossRef]
  5. Barden, L. Primary and secondary compression of clay and peat. Géotechnique 1968, 18, 1–24. [Google Scholar] [CrossRef]
  6. Šuklje, L. The analysis of the consolidation process by the Isotaches method. In Proceedings of the 4th International Conference Soil Mechanics Foundation Engineering, London, UK, 12–24 August 1957; pp. 200–206. Available online: https://www.issmge.org/uploads/publications/1/41/1957_01_0044.pdf (accessed on 7 October 2022).
  7. Watabe, Y.; Udaka, K.; Nakatani, Y.; Leroueil, S. Long-term consolidation behaviour interpreted with isotache concept for worldwide clays. Soils Found. 2012, 52, 449–464. [Google Scholar] [CrossRef] [Green Version]
  8. Christensen, R.W.; Wu, T.H. Analysis of Clay Deformations as a Rate Process. J. Soil Mech. Found. Div. 1964, 90, 125–157. [Google Scholar] [CrossRef]
  9. Janbu, N. The resistance concept applied to deformations of soils. In Proceedings of the 7th International Conference Soil Mechanics Foundation Engineering, Mexico City, Mexico, 29 August 1969; pp. 191–196. Available online: https://www.issmge.org/uploads/publications/1/38/1969_01_0024.pdf (accessed on 7 October 2022).
  10. Yaid, Y.P.; Campanella, R.G. Time-dependent behaviour of undisturbed clay. J. Geotech. Eng. Div. 1977, 103, 693–709. [Google Scholar]
  11. Tavenas, F.; Leroueil, S.; La Rochelle, P.; Roy, M. Creep behaviour of an undisturbed lightly over consolidated clay. Can. Geotech. J. 1978, 15, 402–423. [Google Scholar] [CrossRef]
  12. Lechowicz, Z.; Szymański, A. Creep behaviour of organic soils. Ann. Wars. Agricult. Univ. Land Recl. 1988, 24, 99–106. [Google Scholar]
  13. Acharya, M.P.; Hendry, M.T.; Martin, C.D. Creep behaviour of intact and remoulded fibrous peat. Acta Geotech. 2018, 13, 399–417. [Google Scholar] [CrossRef]
  14. Larsson, R. Behaviour of Organic Clay and Gyttja; Report No. 38; Swedish Geotechnical Institute: Linköping, Sweden, 1990.
  15. Edil, T. Recent advances in geotechnical characterization and construction over peats and organic soils. In Proceedings of the 2nd International Conference on Advances in Soft Soil Engineering and Technology, Putrajava, Malaysia, 2–4 July 2003; pp. 3–23. [Google Scholar]
  16. Long, M. Review of peat strength, peat characterisation and constitutive modelling of peat with reference to landslides. Stud. Geotech. Mech. 2005, 27, 67–90. [Google Scholar]
  17. Lechowicz, Z.; Batory, J.; Hyb, W. Variability assessment of undrained shear strength of organic soils obtained from field vane tests. Ann. Wars. Agric. Univ. Land Recl. 2004, 35, 161–170. [Google Scholar]
  18. Lechowicz, Z. An evaluation of the increase in shear strength of organic soils. In Proceedings of the International Workshop on Advances in Understanding and Modelling the Mechanical Behaviour of Peat, Balkema, Delft, The Netherlands, 16–18 June 1994; pp. 167–179, ISBN 90-5410-366-3. [Google Scholar]
  19. O’Kelly, B.O. Measurement, interpretation and recommended use of laboratory strength properties of fibrous peat. Geotech. Res. 2017, 4, 136–171. [Google Scholar] [CrossRef] [Green Version]
  20. Boylan, N.; Long, M. Evaluation of peat strength for stability assessments. Geotech. Eng. 2014, 167, 421–430. [Google Scholar] [CrossRef] [Green Version]
  21. Ching, J.; Phoon, K.-K. Multivariate distribution for undrained shear strengths under various test procedures. Can. Geotech. J. 2013, 50, 907–923. [Google Scholar] [CrossRef]
  22. Madaschi, A.; Gajo, A. One-dimensional response of peaty soils subjected to a wide range of oedometric conditions. Géotechnique 2015, 65, 274–286. [Google Scholar] [CrossRef]
  23. Hendry, M.T.; Sharma, J.S.; Martin, C.D.; Barbour, S.L. Effect of fibre content and structure on anisotropic elastic stiffness and shear strength of peat. Can. Geotech. J. 2012, 49, 403–415. [Google Scholar] [CrossRef]
  24. El Mouchi, A.; Siddiqua, S.; Wijewickreme, D.; Polinder, H. A Review to Develop new Correlations for Geotechnical Properties of Organic Soils. Geotech. Geol. Eng. 2021, 39, 3315–3336. [Google Scholar] [CrossRef]
  25. Trafford, A.; Long, M. Relationship between Shear-Wave Velocity and Undrained Shear Strength of Peat. J. Geotech. Geoenviron. Eng. 2020, 146, 04020057. [Google Scholar] [CrossRef]
  26. Barden, L. Time dependent deformation of normally consolidated clays and peats. J. Soil Mech. Found. Div. 1969, 95, 1–31. [Google Scholar] [CrossRef]
  27. Berry, P.L.; Poskitt, T.J. The consolidation of peat. Géotechnique 1972, 22, 27–52. [Google Scholar] [CrossRef]
  28. Den Haan, E.J. A compression model for non-brittle soft clays and peat. Géotechnique 1996, 46, 1–16. [Google Scholar] [CrossRef]
  29. Yin, J.-H.; Zhu, J.-G.; Graham, J. A new elastic viscoplastic model for time-dependent behaviour of normally and overconsolidated clays: Theory and verification. Can. Geotech. J. 2002, 39, 157–173. [Google Scholar] [CrossRef]
  30. Wheeler, S.J.; Näätänen, A.; Karstunen, M.; Lojander, M. An anisotropic elastoplastic model for soft clays. Can. Geotech. J. 2003, 40, 403–418. [Google Scholar] [CrossRef]
  31. Grimstad, G.; Degago, S.A.; Nordal, S.; Karstunen, M. Modeling creep and rate effects in structured anisotropic soft clays. Acta Geotech. 2010, 5, 69–81. [Google Scholar] [CrossRef]
  32. Karstunen, M.; Yin, Z.-Y. Modelling time-dependent behaviour of Murro test embankment. Géotechnique 2010, 60, 735–749. [Google Scholar] [CrossRef]
  33. Yin, Z.-Y.; Karstunen, M. Modelling strain-rate-dependency of natural soft clays combined with anisotropy and destructuration. Acta Mech. Solida Sin. 2011, 24, 216–230. [Google Scholar] [CrossRef]
  34. Yin, Z.-Y.; Xu, Q.; Yu, C. Elastic viscoplastic modeling for natural soft clays considering nonlinear creep. ASCE Int. J. Geomech. 2015, 15, A6014001. [Google Scholar] [CrossRef] [Green Version]
  35. Sivasithamparam, N.; Karstunen, M.; Bonnier, P. Modelling creep behaviour of anisotropic soft soils. Comput. Geotech. 2015, 69, 46–57. [Google Scholar] [CrossRef] [Green Version]
  36. Mirjalili, M.; Kimoto, S.; Oka, F.; Hattori, T. Long-term consolidation analysis of a large-scale embankment construction on soft clay deposits using an elasto-viscoplastic model. Soils Found. 2012, 52, 18–37. [Google Scholar] [CrossRef] [Green Version]
  37. Zwanenburg, C.; Den Haan, E.J.; Kruse, G.A.M.; Koelewijn, A.R. Failure of a trial embankment on peat in Booneschans, the Netherlands. Géotechnique 2012, 62, 479–490. [Google Scholar] [CrossRef]
  38. Hendry, M.T.; Martin, C.D.; Barbour, S.L. Measurement of cyclic response of railway embankments and underlying soft peat foundations to heavy axle loads. Can. Geotech. J. 2013, 50, 467–480. [Google Scholar] [CrossRef]
  39. Zwanenburg, C.; Jardine, R.J. Laboratory, in situ and full-scale load tests to assess flood embankment stability on peat. Géotechnique 2015, 65, 309–326. [Google Scholar] [CrossRef] [Green Version]
  40. Draper, N.R.; Smith, H. Applied Regression Analysis, 3rd ed.; Wiley: New York, NY, USA, 1998. [Google Scholar]
  41. Moayedi, H.; Mosallanezhad, M.; Rashid, A.S.A.; Jusoh, W.A.W.; Muazu, M.A. A systematic review and meta-analysis of artificial neural network application in geotechnical engineering: Theory and application. Neural Comput. Appl. 2019, 32, 495–518. [Google Scholar] [CrossRef]
  42. Kordnaeij, A.; Kalantary, F.; Kordtabar, B.; Mola-Abasi, H. Prediction of recompression index using GMDH-type neural network based on geotechnical soil properties. Soils Found. 2015, 55, 1335–1345. [Google Scholar] [CrossRef] [Green Version]
  43. Sulewska, M.J.; Zabielska-Adamska, K. Data compression by principal component analysis (PCA) in modelling of soil density parameters based on soil granulation. Geol. Q. 2015, 59, 400–407. [Google Scholar] [CrossRef]
  44. Ghaboussi, J. Biologically inspired soft computing methods in structural mechanics and engineering. Struct. Eng. Mech. 2001, 11, 485–502. [Google Scholar] [CrossRef]
  45. Moayedi, H.; Bui, D.T.; Dounis, A.; Foong, L.K.; Kalantar, B. Novel nature-inspired hybrids of neural computing for estimating soil shear strength. Appl. Sci. 2019, 9, 4643. [Google Scholar] [CrossRef] [Green Version]
  46. Bishop, C. Neural Networks for Pattern Recognition; Oxford University Press: Northamptonshire, UK, 1995. [Google Scholar]
  47. Patterson, D. Artificial Neural Networks; Prentice Hall: Singapore, 1996. [Google Scholar]
  48. Shahin, M.A.; Jaksa, M.B.; Maier, H.R. Artificial neural network applications in geotechnical engineering. Aust. Geomech. 2001, 36, 49–62. [Google Scholar]
  49. Shahin, M.A.; Maier, H.R.; Jaksa, M.B. Predicting settlement of shallow foundation using neural networks. J. Geotech. Geoenv. Eng. 2002, 128, 785–793. [Google Scholar] [CrossRef]
  50. Chik, Z.; Aljanabi, Q.A.; Kasa, A.; Taha, M.R. Tenfold cross validation artificial neural network modeling of the settlement behavior of a stone column under a highway embankment. Arab. J. Geosci. 2014, 7, 4877–4887. [Google Scholar] [CrossRef]
  51. Szymański, A.; Lechowicz, Z. Back analysis of organic subsoil settlements. Ann. Wars. Agric. Univ. Land Recl. 1986, 22, 45–51. [Google Scholar]
  52. Wolski, W.; Szymański, A.; Mirecki, J.; Lechowicz, Z.; Larsson, R.; Hartlen, J.; Garbulewski, K.; Bergdahl, U. Two Stage-Constructed Embankments on Organic Soils; Report No. 32; Swedish Geotechnical Institute: Linköping, Sweden, 1988.
  53. Wolski, W.; Szymański, A.; Lechowicz, Z.; Larsson, R.; Hartlen, J.; Bergdahl, U. Full-Scale Failure Test on Stage-Constructed Test Fill on Organic Soil; Report No. 36; Swedish Geotechnical Institute: Linköping, Sweden, 1989.
  54. Bąkowski, J.; Lechowicz, Z. Stability analysis of staged embankment on organic subsoil using the load path method. Ann. Wars. Agric. Univ. Land Recl. 2004, 35, 79–88. [Google Scholar]
  55. Lechowicz, Z.; Fukue, M.; Rabarijoely, S.; Sulewska, M.J. Evaluation of the undrained shear strength of organic soils from a dilatometer test using artificial neural networks. Appl. Sci. 2018, 8, 1395. [Google Scholar] [CrossRef]
  56. Lechowicz, Z. An evaluation of the increase in shear strength of organic soils under embankment loading. In Monograph; WULS: Warsaw, Poland, 1992. (In Polish) [Google Scholar]
  57. Lechowicz, Z.; Rabarijoely, S. Evaluation of organic subsoil conditions after large deformations. In Proceedings of the 2nd International Conference on Problematic Soils, Petaling Jaya, Malaysia, 3–5 December 2005; Volume 3, pp. 1075–1082. [Google Scholar]
  58. Larsson, R.; Nilson, G.; Rogbeck, J. Determination of Organic Content, Carbonate Content and Sulphur Content in Soils; Report No. 27E; Swedish Geotechnical Institute: Linköping, Sweden, 1987.
  59. Larsson, R.; Bergdahl, U.; Eriksson, L. Evaluation of Shear Strength in Cohesive Soils with Special Reference to Swedish Practice and Experience; SGI: Linköping, Sweden, 1984; Volume 3, pp. 1–32.
  60. StatSoft Polska Ltd. STATISTICA—Package Documentation; Polish Edition 2002; StatSoft Polska Ltd.: Kraków, Poland, 2002. (In Polish) [Google Scholar]
Figure 1. Test embankments at the Białośliwie site: (a) embankment No. 2, (b) embankment No. 4, 1—surface settlement gauge, 2—deep settlement gauge.
Materials 16 00125 g001
Figure 2. Test embankment at the Antoniny site: (a) 1st stage, (b) 2nd stage, (c) 3rd stage, 1—surface settlement gauge, and 2—deep settlement gauge.
Materials 16 00125 g002
Figure 3. Test embankment at the Wonieść site: 1—surface settlement gauge, 2—deep settlement gauge. 3—reinforcement steel mattress.
Materials 16 00125 g003
Figure 4. The embankment dam at the Koszyce site, • profiles.
Materials 16 00125 g004
Figure 5. Test embankment No. 2 at the Białośliwie site: (a) settlement versus time, (b) undrained shear strength versus time.
Materials 16 00125 g005
Figure 6. Test embankment No. 4 at the Białośliwie site: (a) settlement versus time, (b) undrained shear strength versus time.
Materials 16 00125 g006
Figure 7. Test embankment at the Antoniny site: (a1a3) settlement versus time, (b1b3) undrained shear strength versus time.
Materials 16 00125 g007
Figure 8. Test embankment at the Wonieść site: (a) settlement versus time, (b) undrained shear strength versus time.
Materials 16 00125 g008
Figure 9. Test embankment at the Koszyce site: (a1a3) settlement versus time, (b1b3) undrained shear strength versus time.
Materials 16 00125 g009aMaterials 16 00125 g009b
Figure 10. Comparison between the measured and calculated values by ANN 9–5–4 in subsets L + V + T: (a) Y1 sp, (b) Y2 sg, (c) Y3 τp, and (d) Y4 τg.
Materials 16 00125 g010
Figure 11. Comparison between the measured and calculated values by ANN 5–5–2 in subsets L + V + T for peat: (a) Y1 sp, (b) Y3 τp.
Materials 16 00125 g011
Figure 12. Comparison between the measured and calculated values by ANN 5–5–2 in subsets L + V + T for gyttja: (a) Y2 sg, (b) Y4 τg.
Materials 16 00125 g012
Table 1. Variables analyzed and the statistical specifications of the database.
VariablesNotationsMinimumMaximumAverageStandard Deviation
of Sample
X1 σpVertical stress on peat layer, (kPa)1910043.124.6
X2 σgVertical stress on gyttja layer, (kPa)09534.226.7
X3 hpThickness of peat layer, (m)1.53.72.50.8
X4 hgThickness of gyttja layer, (m)0.014.06.25.0
X5 wpWater content of peat, (%)232650438.5149.1
X6 wgWater content of gyttja, (%)0150102.645.8
X7 tTime, (days)05100732.61294.4
X8 τp0Initial undrained shear strength of peat, (kPa)6.017.09.13.2
X9 τg0Initial undrained shear strength of gyttja, (kPa)014.09.24.5
Y1 spSettlement of peat layer, (m)0.001.220.380.31
Y2 sgSettlement of gyttja layer, (m)0.005.200.741.17
Y3 τpUndrained shear strength of peat, (kPa)6.048.018.68.5
Y4 τgUndrained shear strength of gyttja, (kPa)0.033.014.48.4
Table 2. Summary of input and output values for the statistical and ANN analyses.
No.Site/
Variable
X1
σp
(kPa)
X2
σg
(kPa)
X3
hp
(m)
X4
hg
(m)
X5 wp
(%)
X6 wg
(%)
X7
t
(days)
X8 τp0
(kPa)
X9 τg0
(kPa)
Y1
sp
(m)
Y2
sg
(m)
Y3
τp
(kPa)
Y4
τg
(kPa)
1Białośliwie
No. 2
35321.502.0041012007.510.50.0000.0007.510.5
235321.502.0041012077.510.50.0700.0309.511.6
335321.502.00410120217.510.50.1400.06012.413.0
435321.502.00410120357.510.50.2100.09014.515.0
535321.502.00410120847.510.50.2700.12017.217.5
635321.502.004101201207.510.50.2900.14018.518.8
735321.502.004101201807.510.50.3030.15520.020.5
835321.502.004101202107.510.50.3100.16821.021.2
935321.502.004101202407.510.50.3150.18021.422.0
1035321.502.004101202707.510.50.3190.18821.722.6
1135321.502.004101203007.510.50.3230.19521.822.8
1235321.502.004101203507.510.50.3260.20022.023.0
13Białośliwie
No. 4
4003.500.00430007.50.00.0000.0007.50.0
144003.500.00430077.50.00.2800.00010.00.0
154003.500.004300217.50.00.4800.00014.00.0
164003.500.004300357.50.00.5550.00015.50.0
174003.500.004300847.50.00.6100.00018.40.0
184003.500.0043001207.50.00.6500.00019.70.0
194003.500.0043001807.50.00.6780.00021.00.0
204003.500.0043002107.50.00.7000.00021.40.0
214003.500.0043002407.50.00.7150.00021.90.0
224003.500.0043002707.50.00.7270.00022.20.0
234003.500.0043003007.50.00.7360.00022.40.0
244003.500.0043003507.50.00.7430.00022.50.0
25Antoniny
No. 1/1
21202.604.7031011006.08.00.0000.0006.08.0
2621202.604.70310110156.08.00.0900.0306.48.2
2721202.604.70310110306.08.00.1270.0506.68.4
2821202.604.70310110606.08.00.1580.0687.08.7
2921202.604.70310110906.08.00.1900.0827.48.8
3021202.604.703101101206.08.00.2200.0927.88.9
3121202.604.703101101556.08.00.2400.1008.09.0
32Antoniny
No. 1/2
20192.364.6027410608.09.00.0000.0008.09.0
3320192.364.60274106308.09.00.1200.1509.810.0
3420192.364.60274106508.09.00.1700.20010.810.5
3520192.364.602741061008.09.00.2100.28012.811.8
3620192.364.602741061508.09.00.2400.32014.012.5
3720192.364.602741062008.09.00.2550.35515.013.0
3820192.364.602741062508.09.00.2650.38515.513.4
3920192.364.602741063008.09.00.2720.41016.013.7
4020192.364.602741063508.09.00.2770.42816.513.8
4120192.364.602741064108.09.00.2800.44017.014.0
42Antoniny
No. 1/3
19182.084.1623291017.014.00.0000.00017.014.0
4319182.084.16232915017.014.00.0700.13518.415.2
4419182.084.162329110017.014.00.1100.20019.516.0
4519182.084.162329120017.014.00.1500.27020.717.0
4619182.084.162329130017.014.00.1700.32021.617.8
4719182.084.162329140017.014.00.1840.35522.518.2
4819182.084.162329150017.014.00.1960.38523.518.6
4919182.084.162329160017.014.00.2050.41424.019.0
5019182.084.162329170017.014.00.2130.44124.619.3
5119182.084.162329176017.014.00.2200.45525.019.5
52Wonieść70603.707.1050015006.56.60.0000.0006.56.6
5370603.707.10500150306.56.60.5000.25011.09.0
5470603.707.10500150606.56.60.6600.45013.510.8
5570603.707.10500150906.56.60.8000.60015.412.0
5670603.707.105001501206.56.60.9000.74017.013.2
5770603.707.105001501806.56.60.9900.86019.014.8
5870603.707.105001502406.56.61.0600.97021.416.0
5970603.707.105001503006.56.61.1201.07023.017.6
6070603.707.105001503606.56.61.1751.16024.018.5
6170603.707.105001504506.56.61.2201.24025.019.2
62Koszyce
VIII A
100952.0014.00650130010.013.00.0000.00010.013.0
63100952.0014.0065013073010.013.00.5002.20026.020.0
64100952.0014.00650130110010.013.00.6703.20031.023.0
65100952.0014.00650130210010.013.00.7703.90037.026.0
66100952.0014.00650130310010.013.00.8504.48042.028.5
67100952.0014.00650130410010.013.00.9004.92045.030.0
68100952.0014.00650130510010.013.00.9405.20048.032.0
69Koszyce
X A
35322.0014.00650130010.013.00.0000.00010.013.0
7035322.0014.0065013073010.013.00.1500.75014.015.4
7135322.0014.00650130110010.013.00.2001.02015.816.3
7235322.0014.00650130210010.013.00.2401.26019.018.2
7335322.0014.00650130310010.013.00.2701.45021.019.0
7435322.0014.00650130410010.013.00.2971.59022.019.5
7535322.0014.00650130510010.013.00.3201.70023.020.0
76Koszyce
X B
65602.0014.00650130010.013.00.0000.00010.013.0
7765602.0014.0065013073010.013.00.2801.32017.019.0
7865602.0014.00650130110010.013.00.3801.87020.022.0
7965602.0014.00650130210010.013.00.4342.30025.027.0
8065602.0014.00650130310010.013.00.4752.65028.030.0
8165602.0014.00650130410010.013.00.5102.87030.031.5
8265602.0014.00650130510010.013.00.5403.04032.033.0
Table 3. Matrix of linear simple correlation coefficients r for peat.
VariableX1 σpX3 hpX5 wpX7 tX8 τp0Y1 spY3 τp
X1 σp1.000
X3 hp0.1691.000
X5 wp0.779−0.0261.000
X7 t0.400−0.2720.5911.000
X8 τp0−0.187−0.378−0.2200.1701.000
Y1 sp0.6170.5420.3820.252−0.2881.000
Y3 τp0.535−0.1650.4000.6830.3310.6021.000
Table 4. Matrix of linear simple correlation coefficients r for gyttja.
VariableX2 σgX4 hgX6 wgX7 tX9 τg0Y2 sgY4 τg
X2 σg1.000
X4 hg0.7571.000
X6 wg0.7130.6321.000
X7 t0.4500.6660.2571.000
X9 τg00.4810.6190.7140.3911.000
Y2 sg0.7440.7230.3690.8210.4021.000
Y4 τg0.6780.6470.7090.6390.8150.7131.000
Table 5. Statistical multiple regression models.
FormulaR2±SEE±REmax
(%)
Formula Number
s p = 0.288 + 0.0077 σ p + 0.213 h p 0.00053 w p + 0.000072 t 0.6320.19360(4)
s g = 0.0256 + 0.029 σ g 0.0065 w g + 0.00053 t 0.8810.41160(5)
τ p = 10,639 + 0.231 σ p 0.025 w p + 0.0041 t + 0.659 τ p 0 0.6994.75040(6)
τ g = 0.655 + 0.127 σ g 0.746 h g + 0.027 w g + 0.0031 t + 1.125 τ g 0 0.8882.89535(7)
Disclaimer/Publisher’s Note: The statements, opinions and data contained in all publications are solely those of the individual author(s) and contributor(s) and not of MDPI and/or the editor(s). MDPI and/or the editor(s) disclaim responsibility for any injury to people or property resulting from any ideas, methods, instructions or products referred to in the content.