
Corrosion Behavior of SiMo Cast Iron under Controlled Conditions


Abstract
1. Introduction
2. Materials and Methods
3. Results
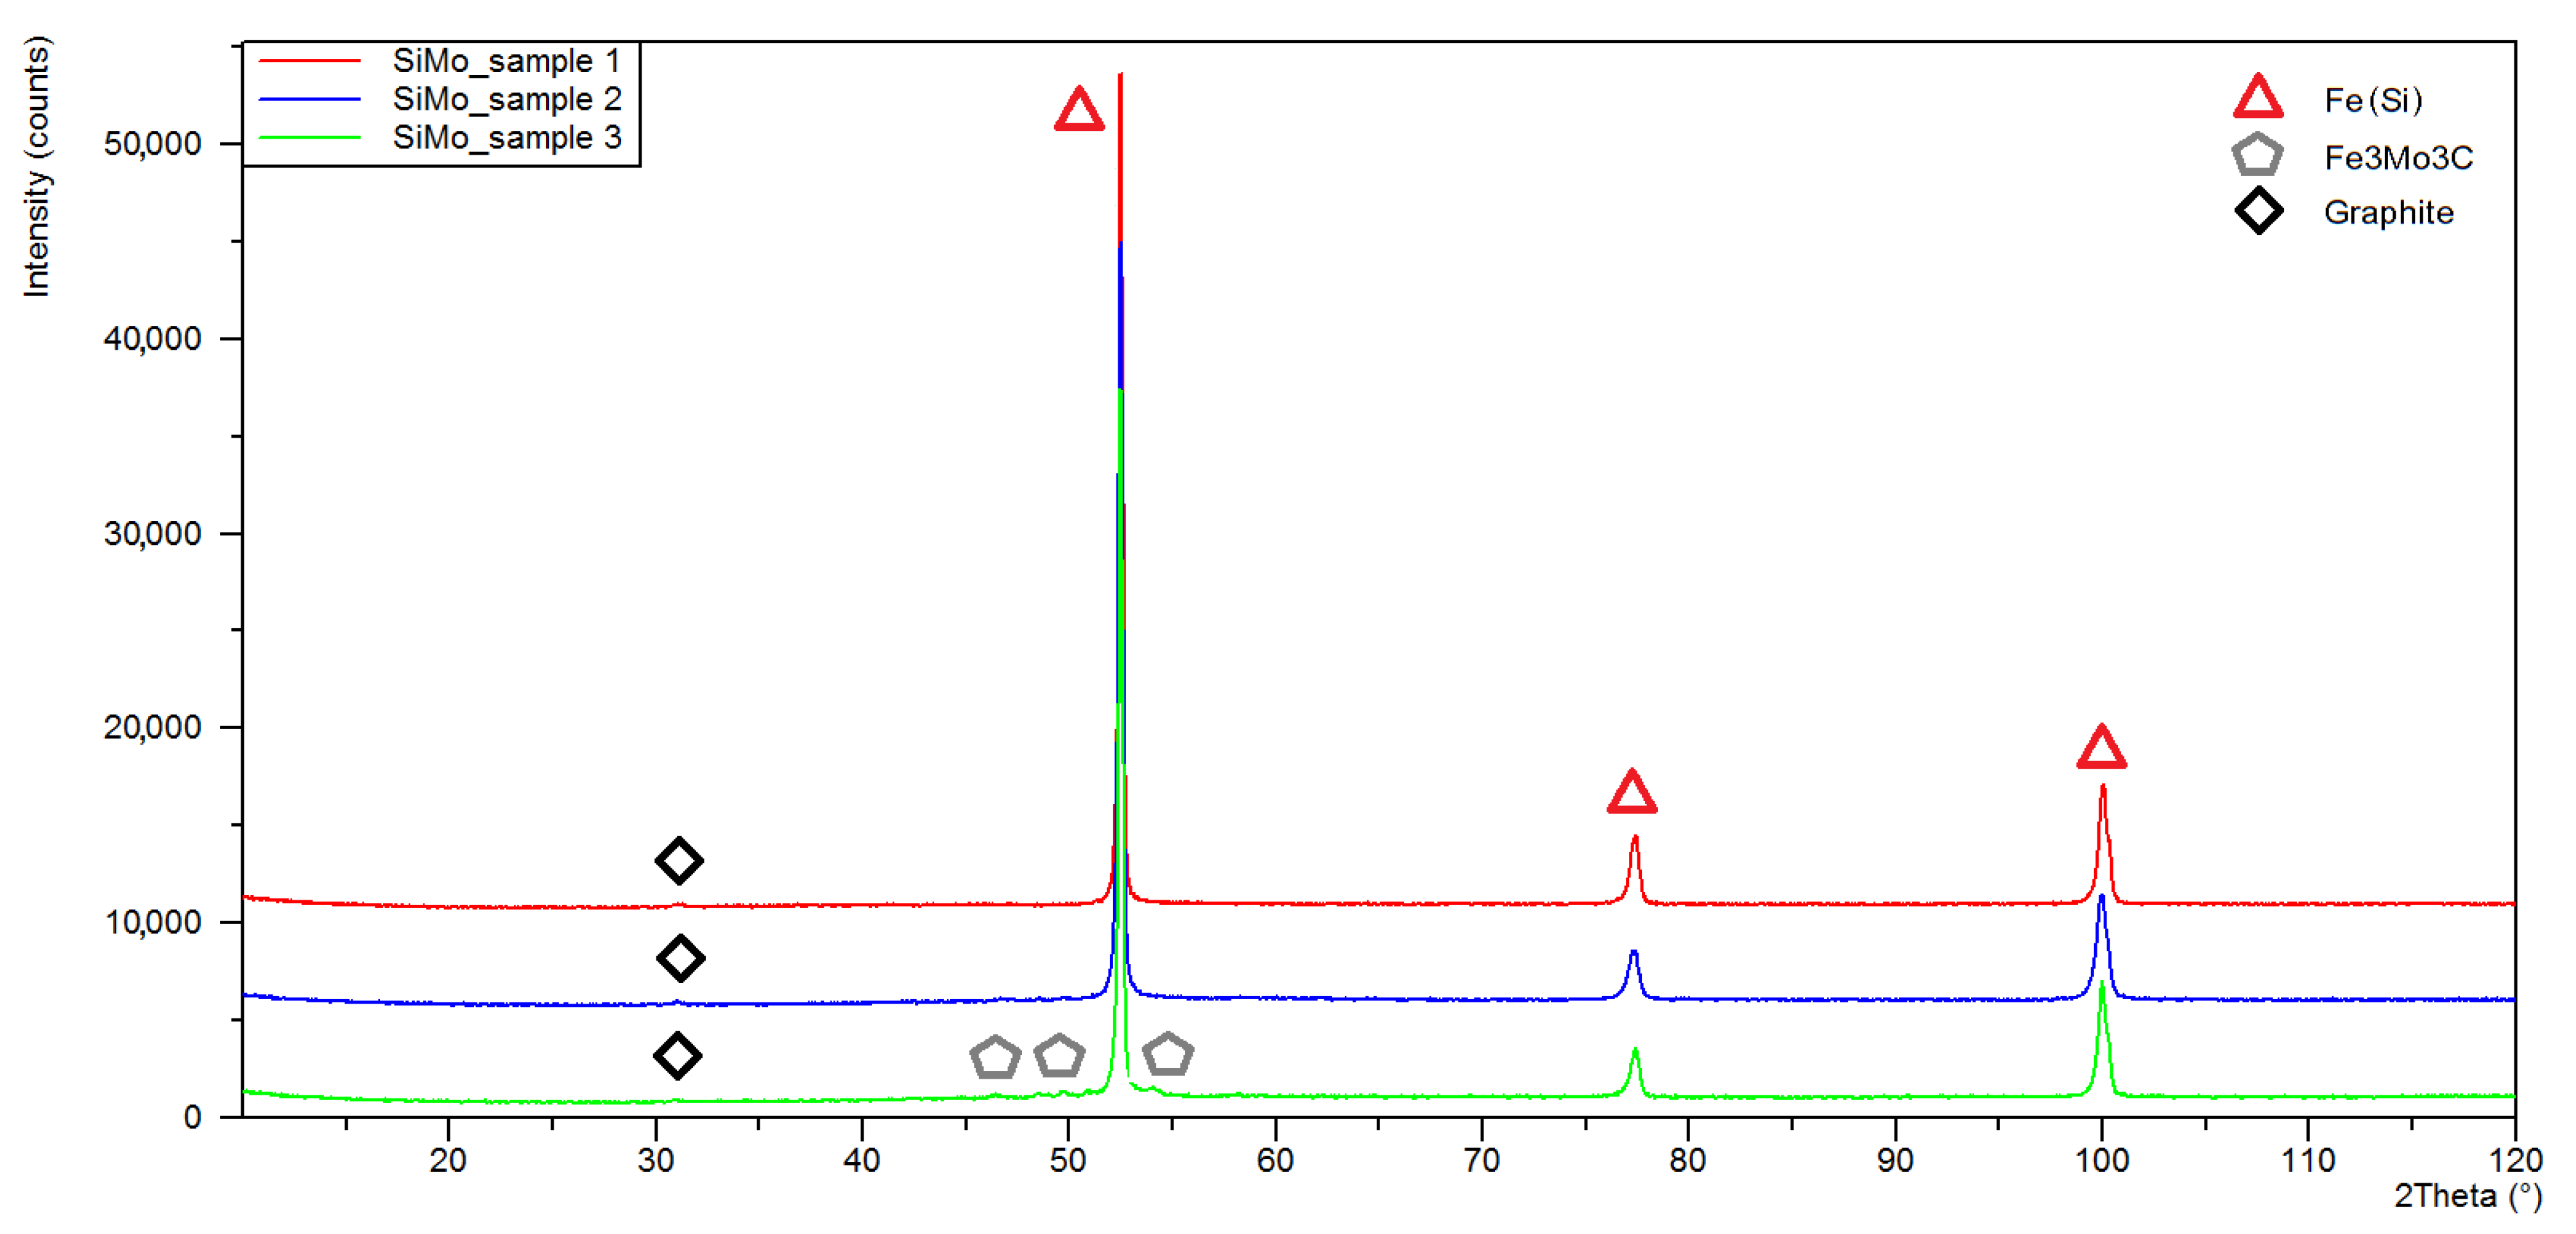
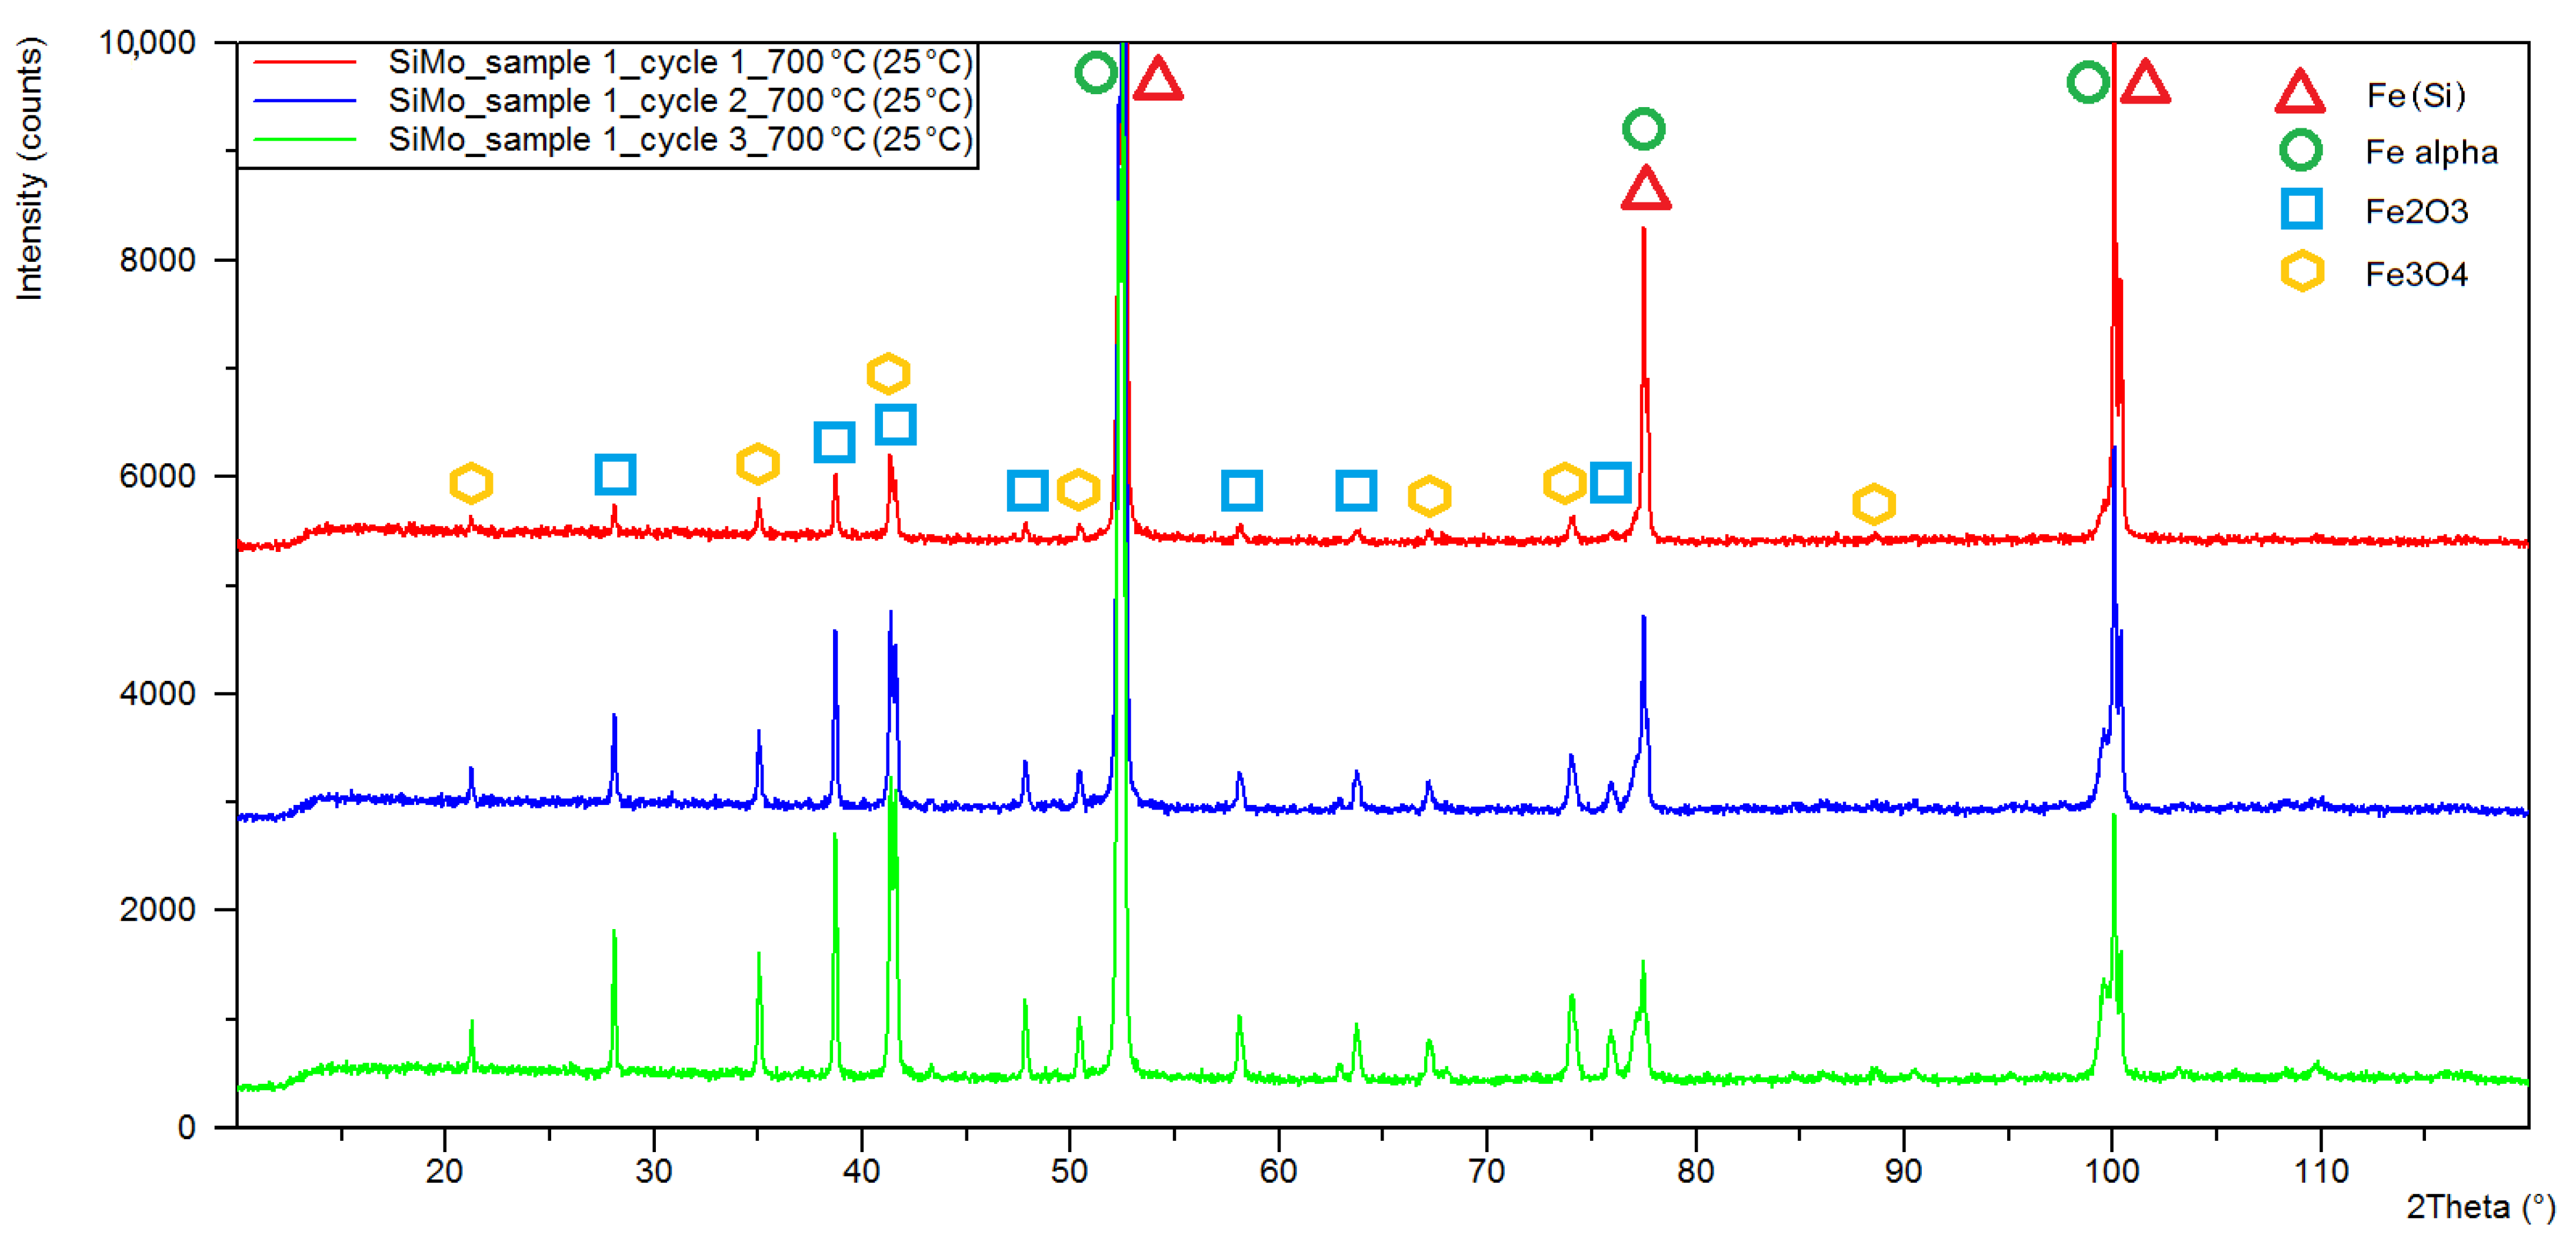
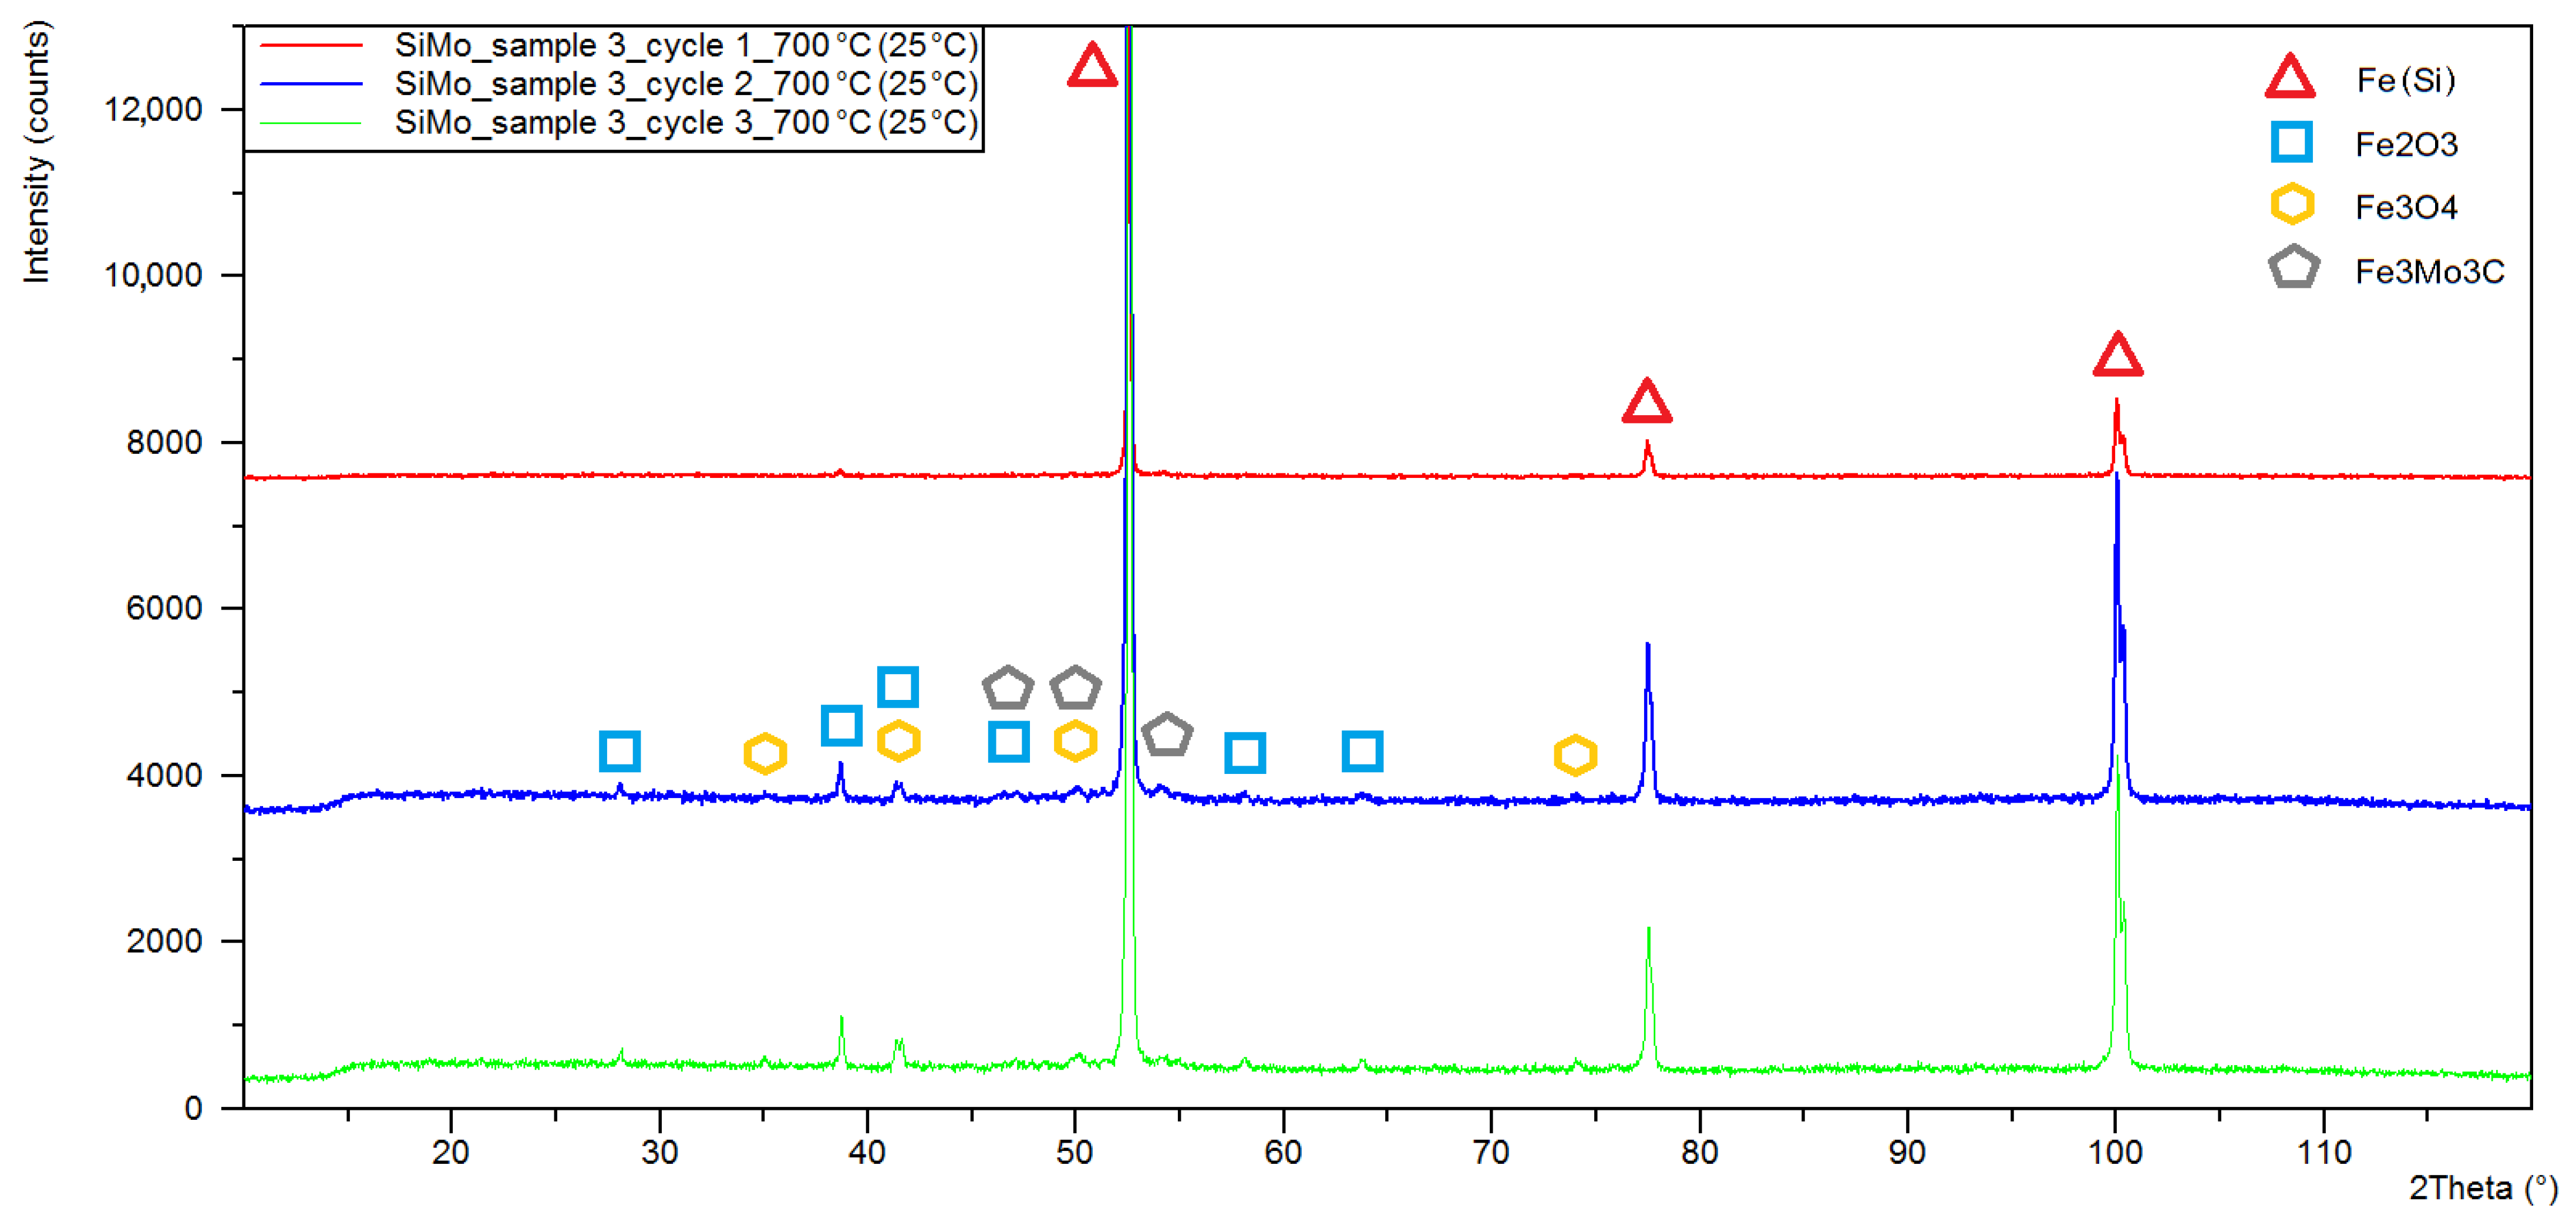
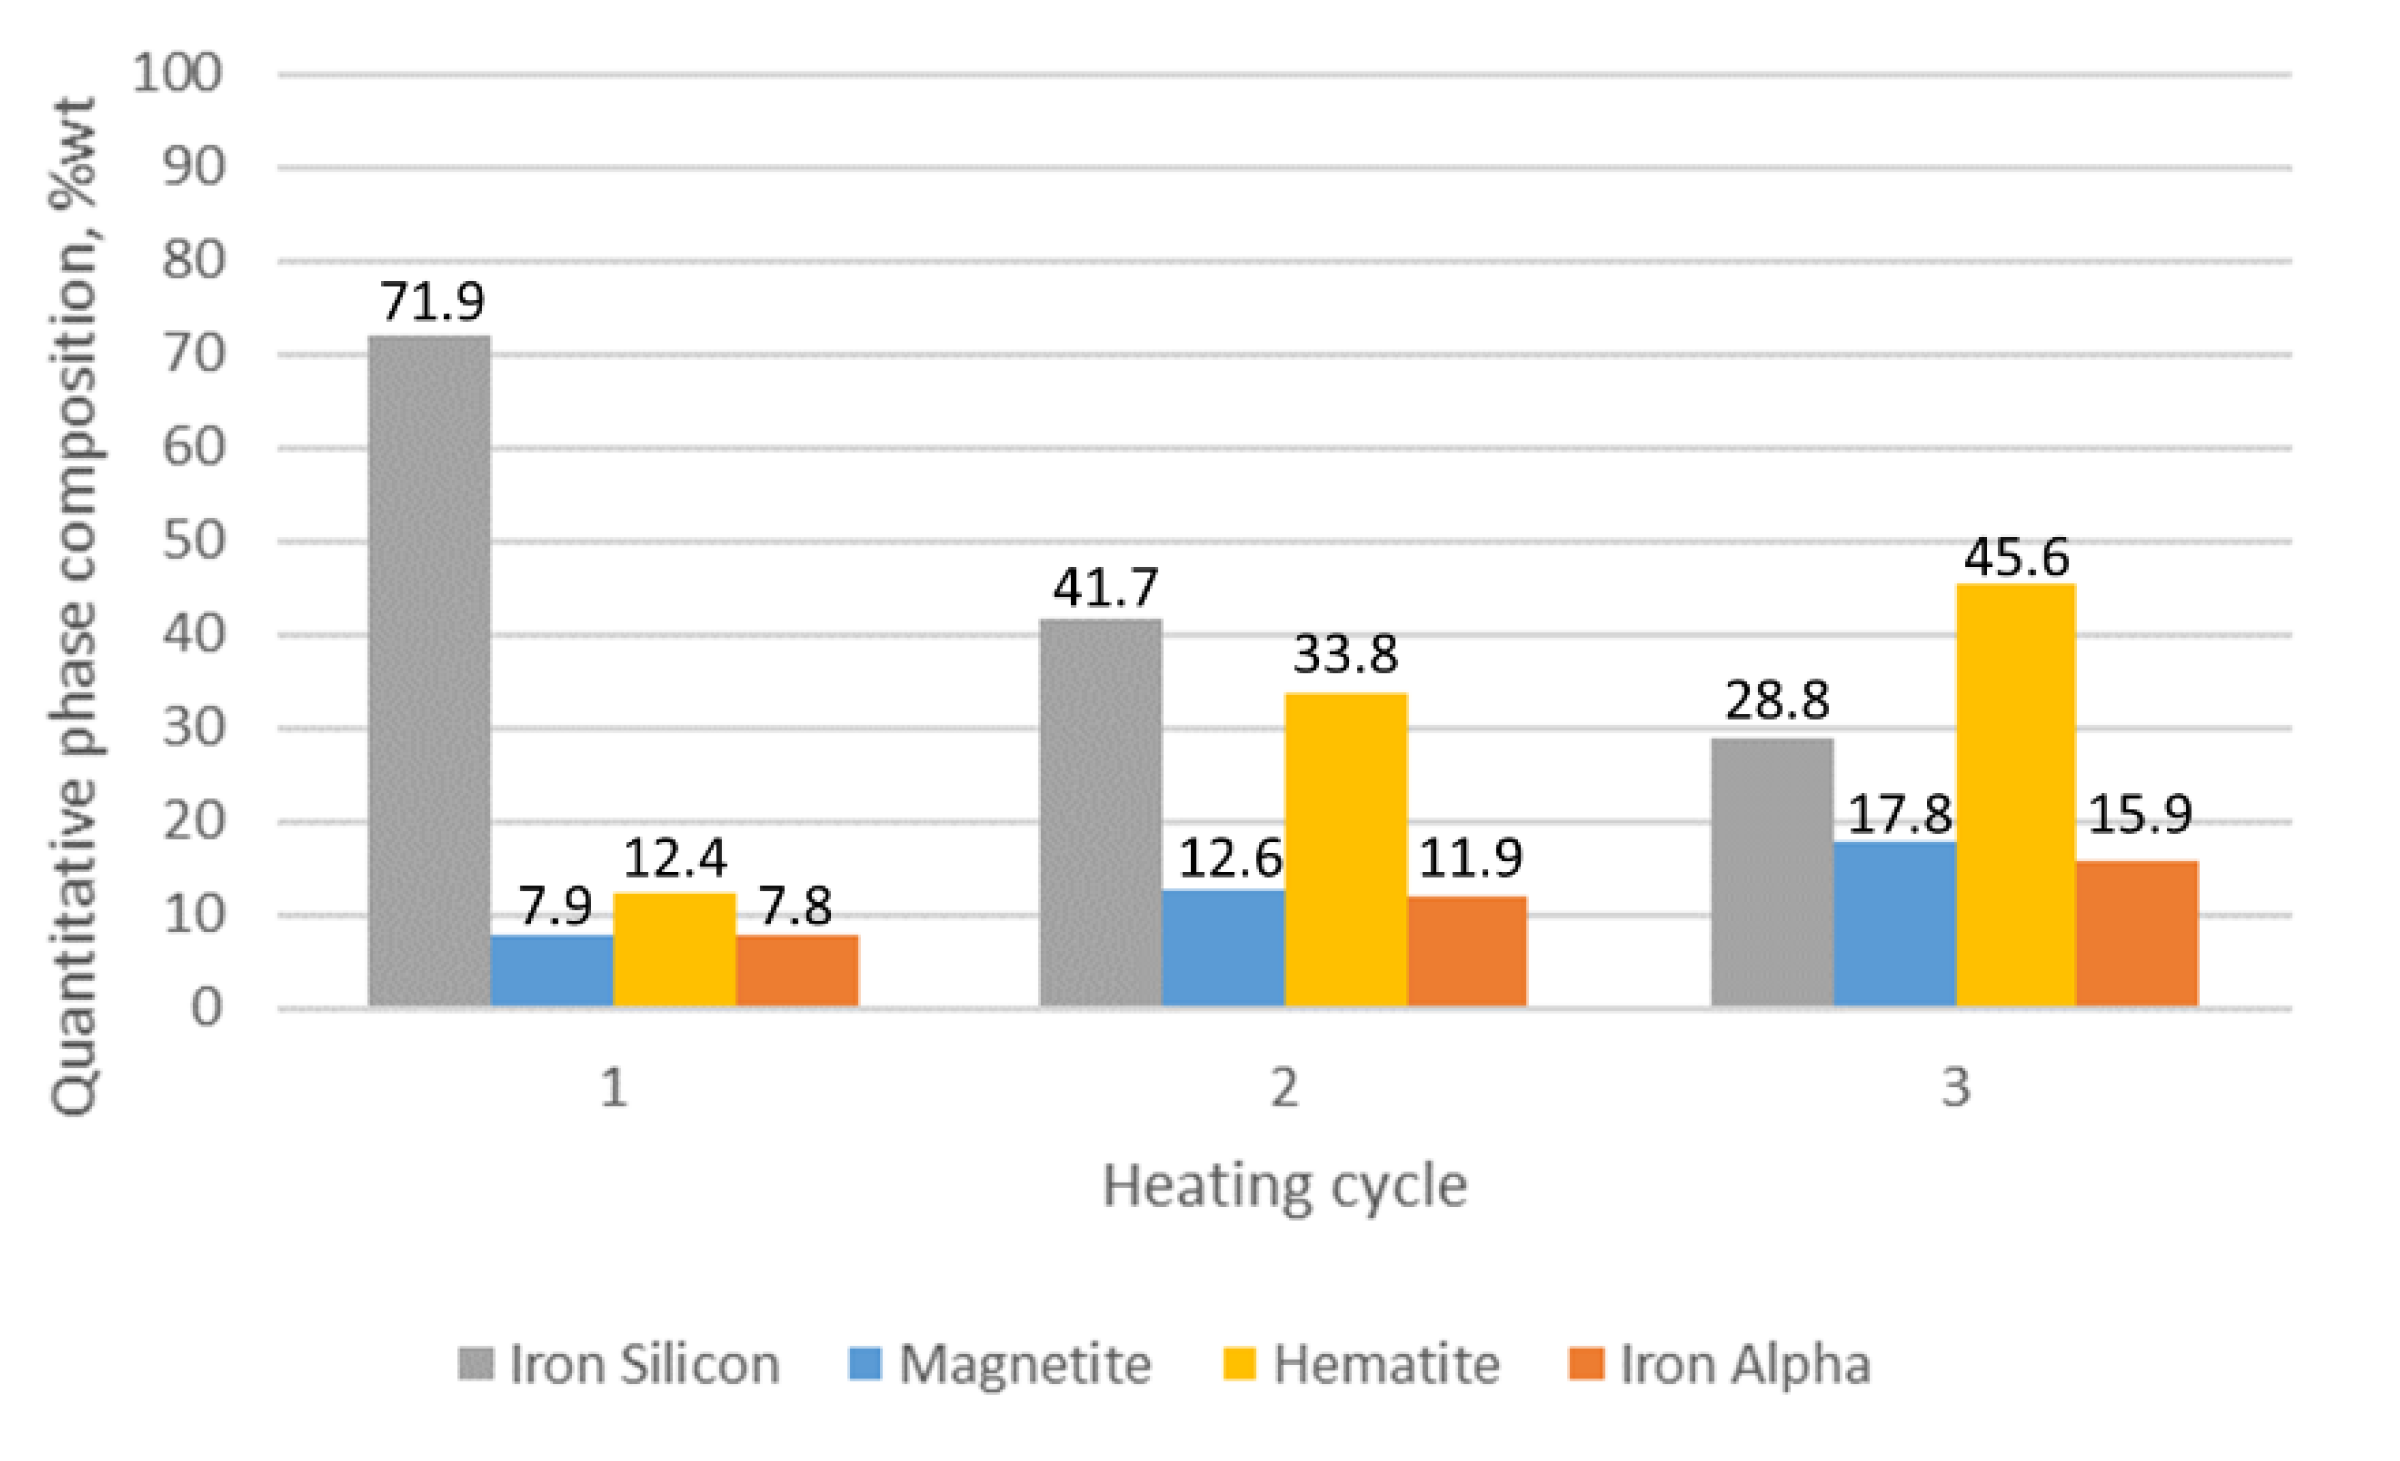
3.1. XRD Analysis
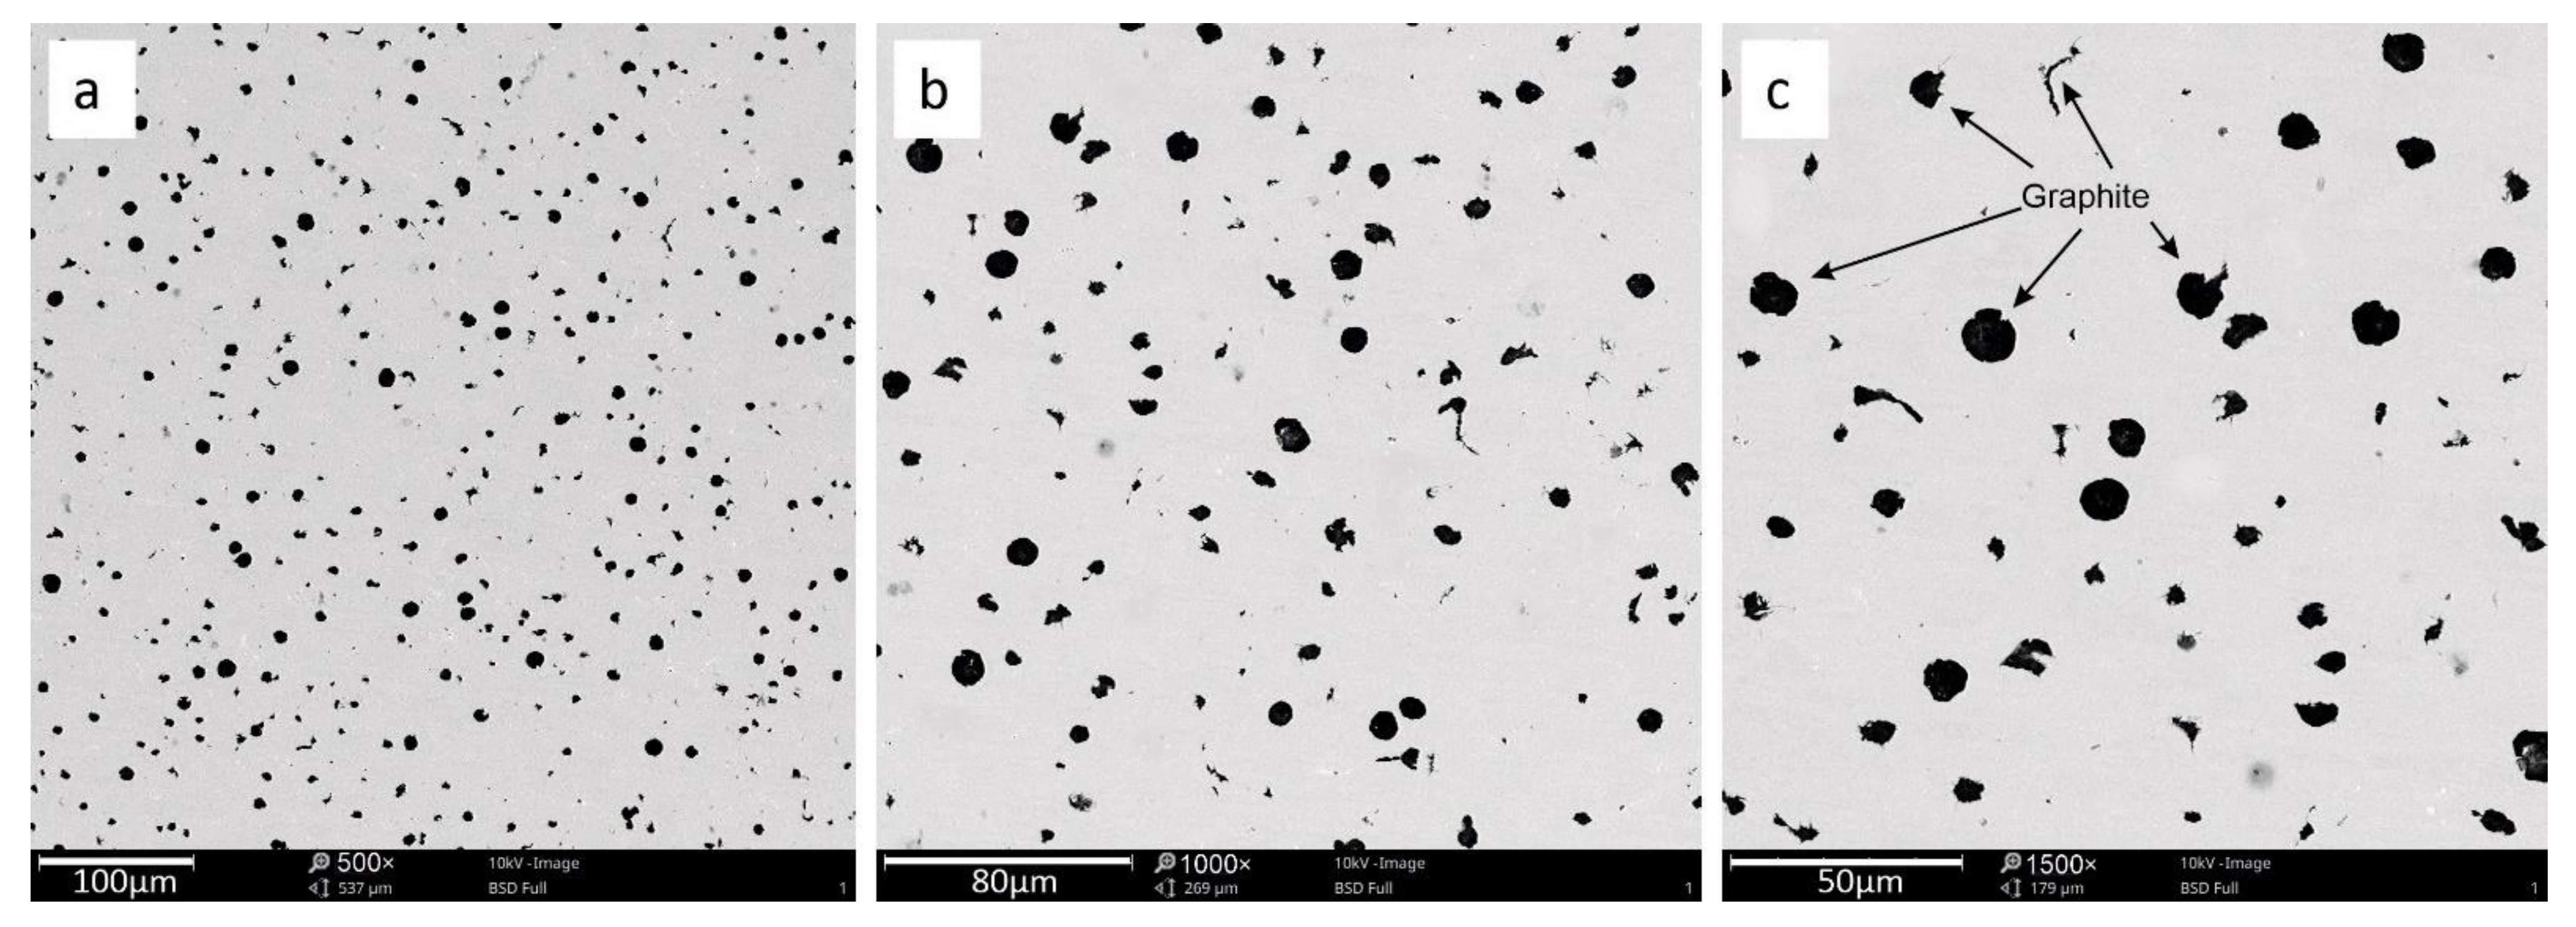
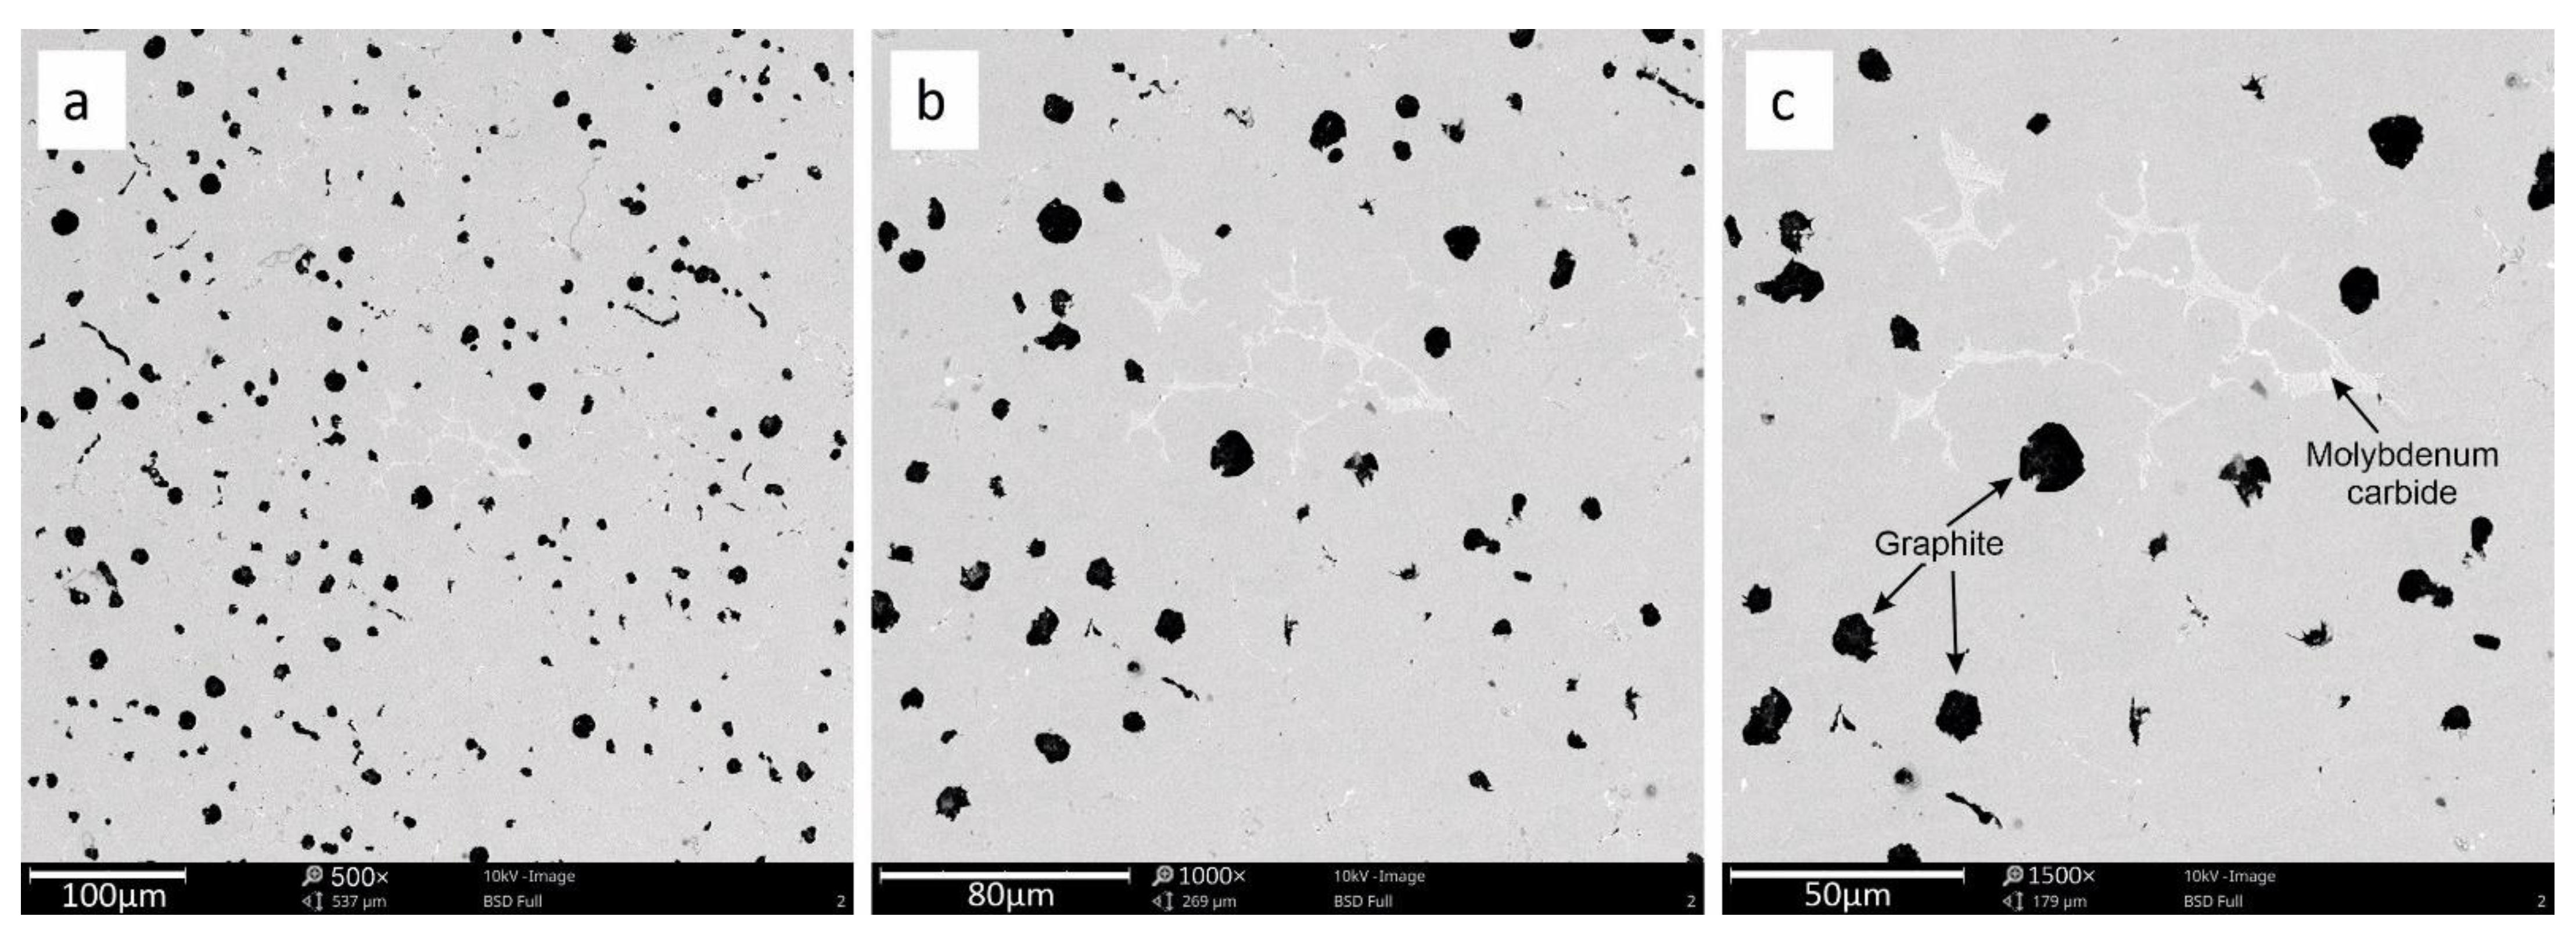
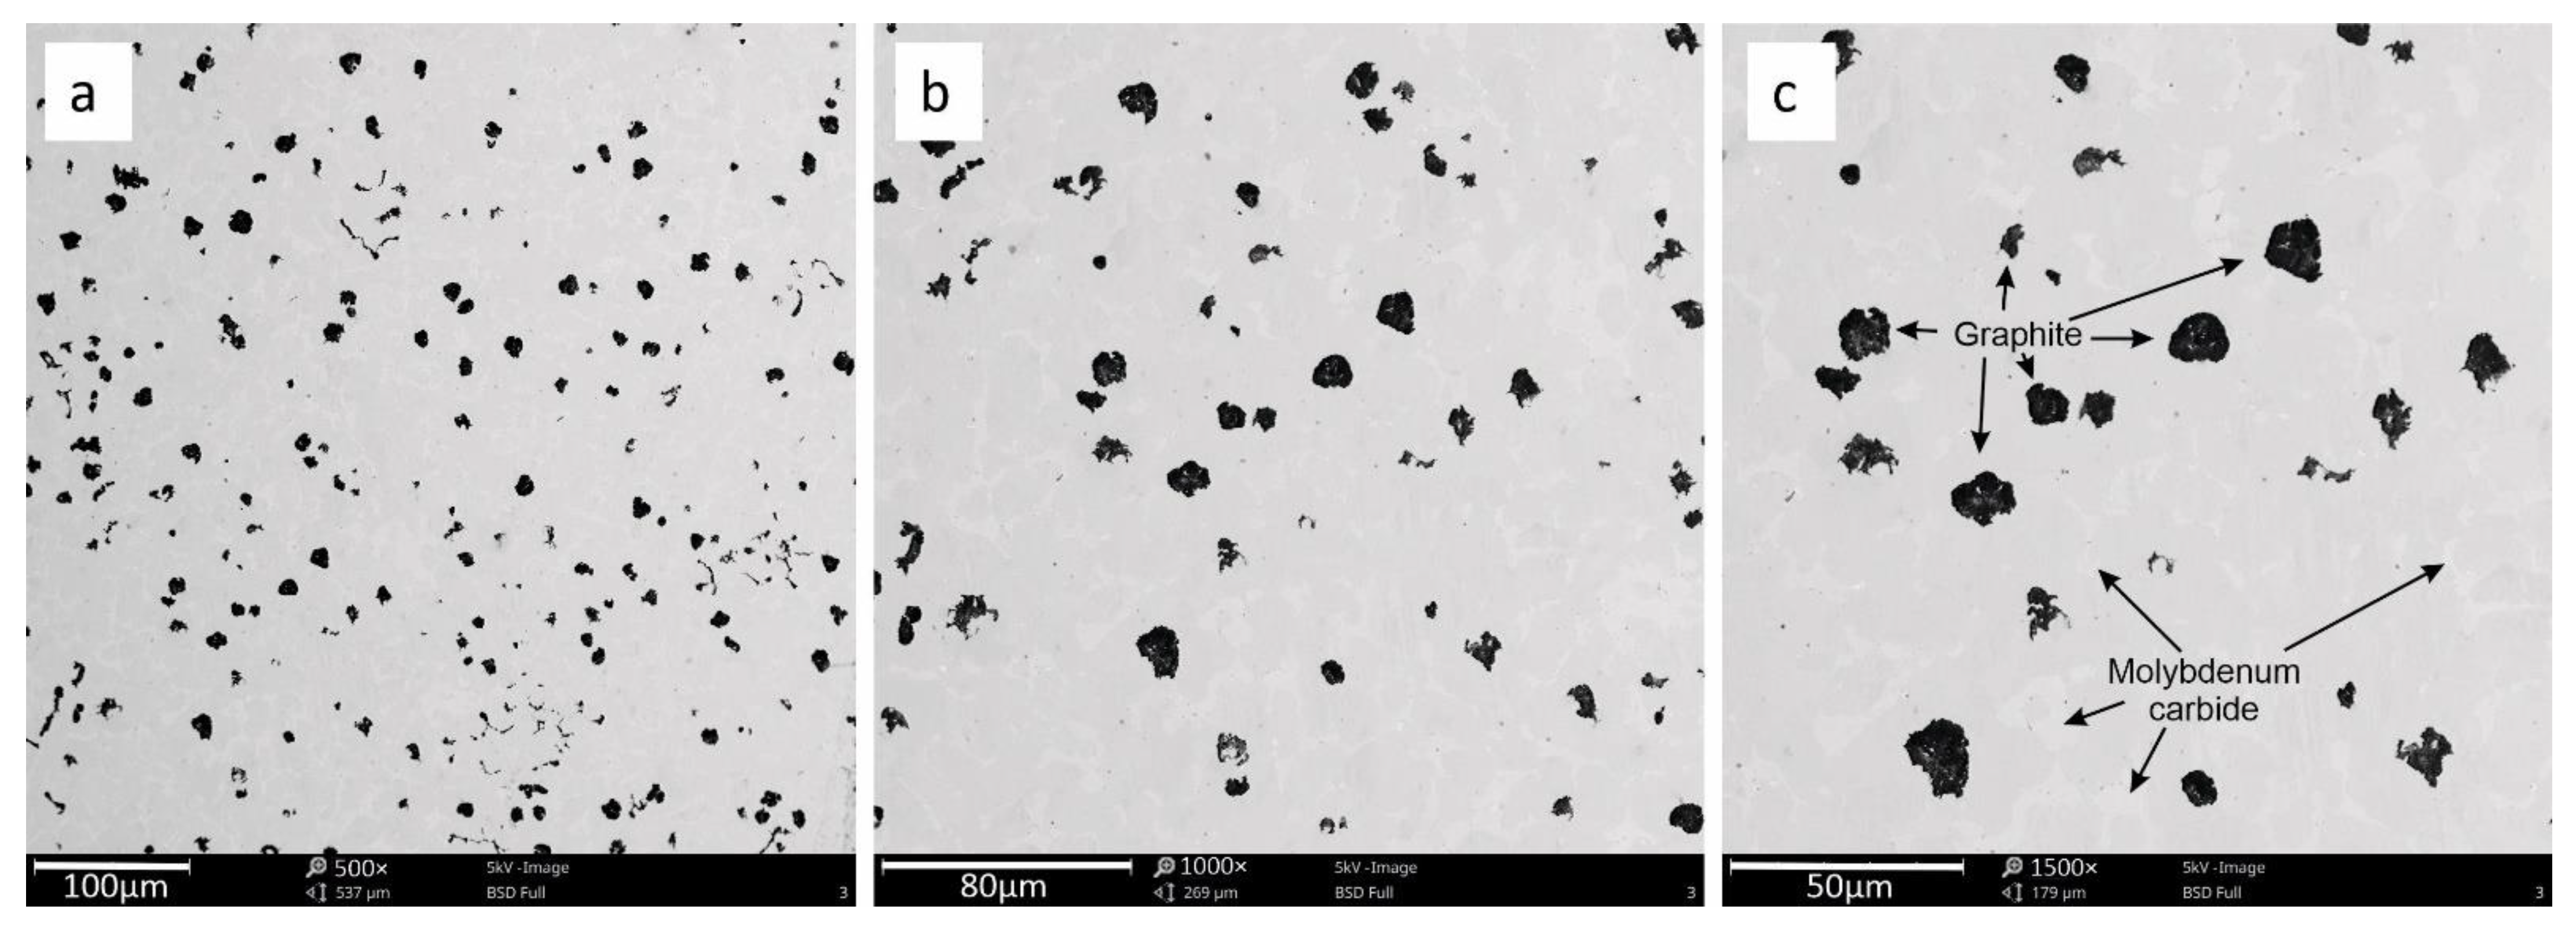
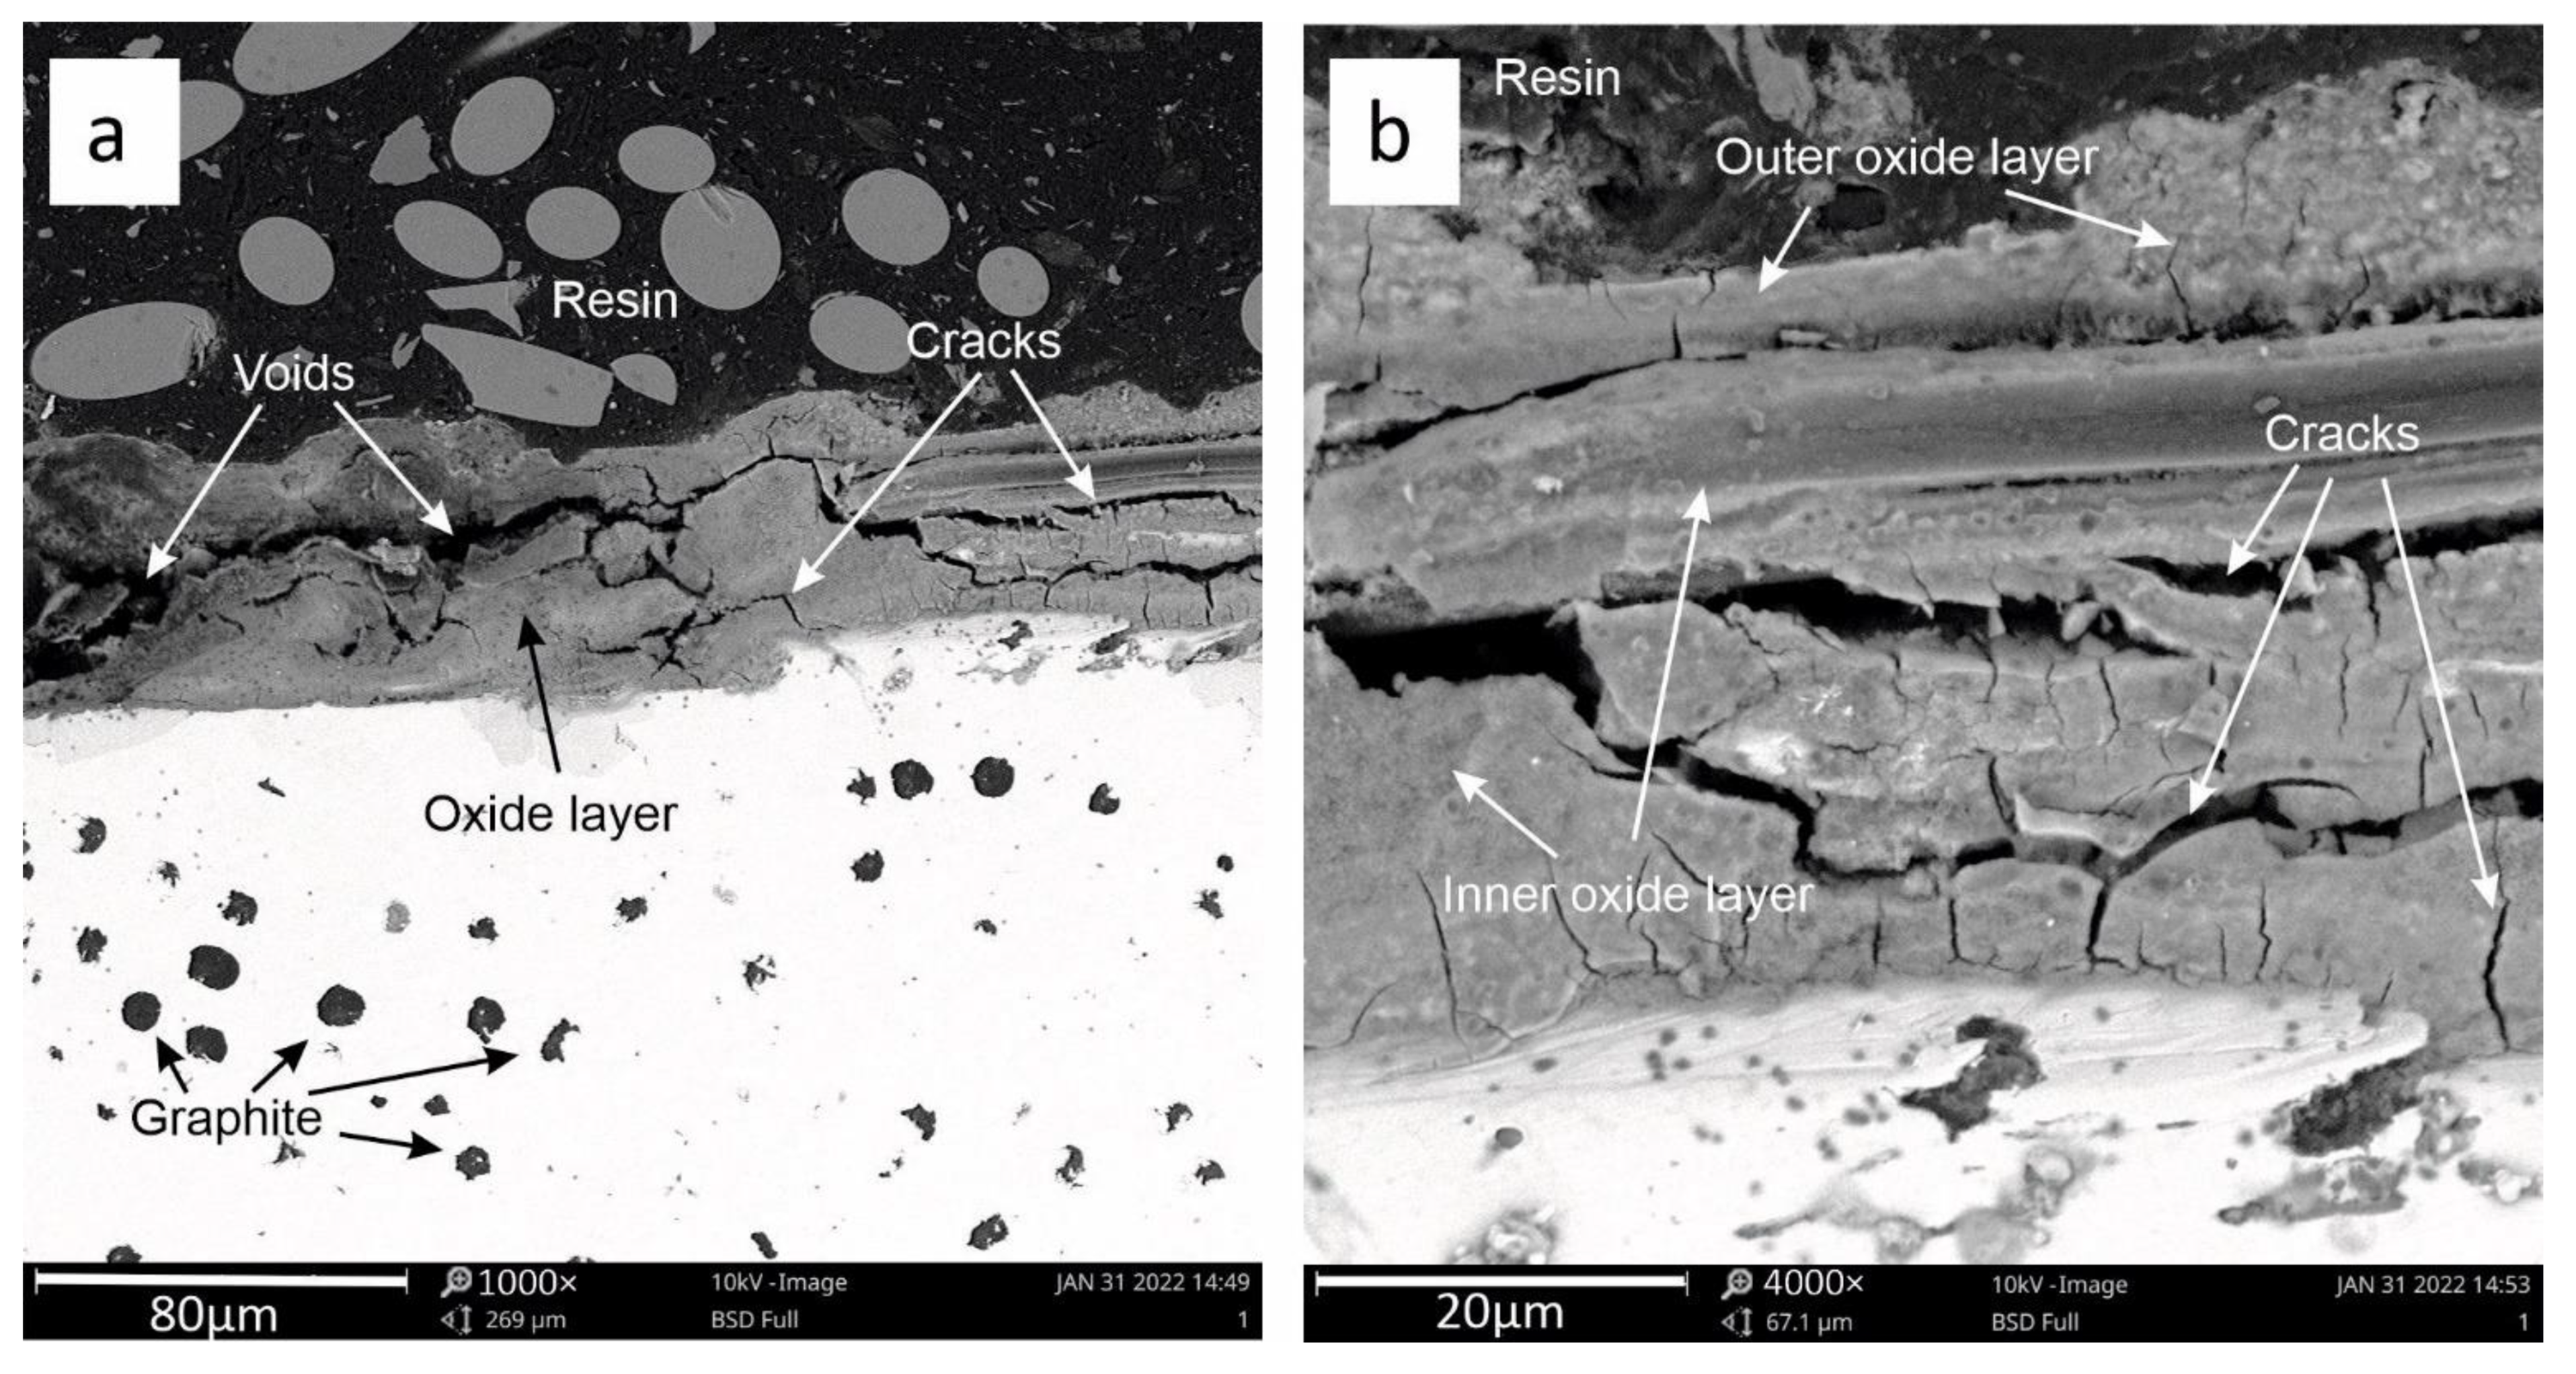
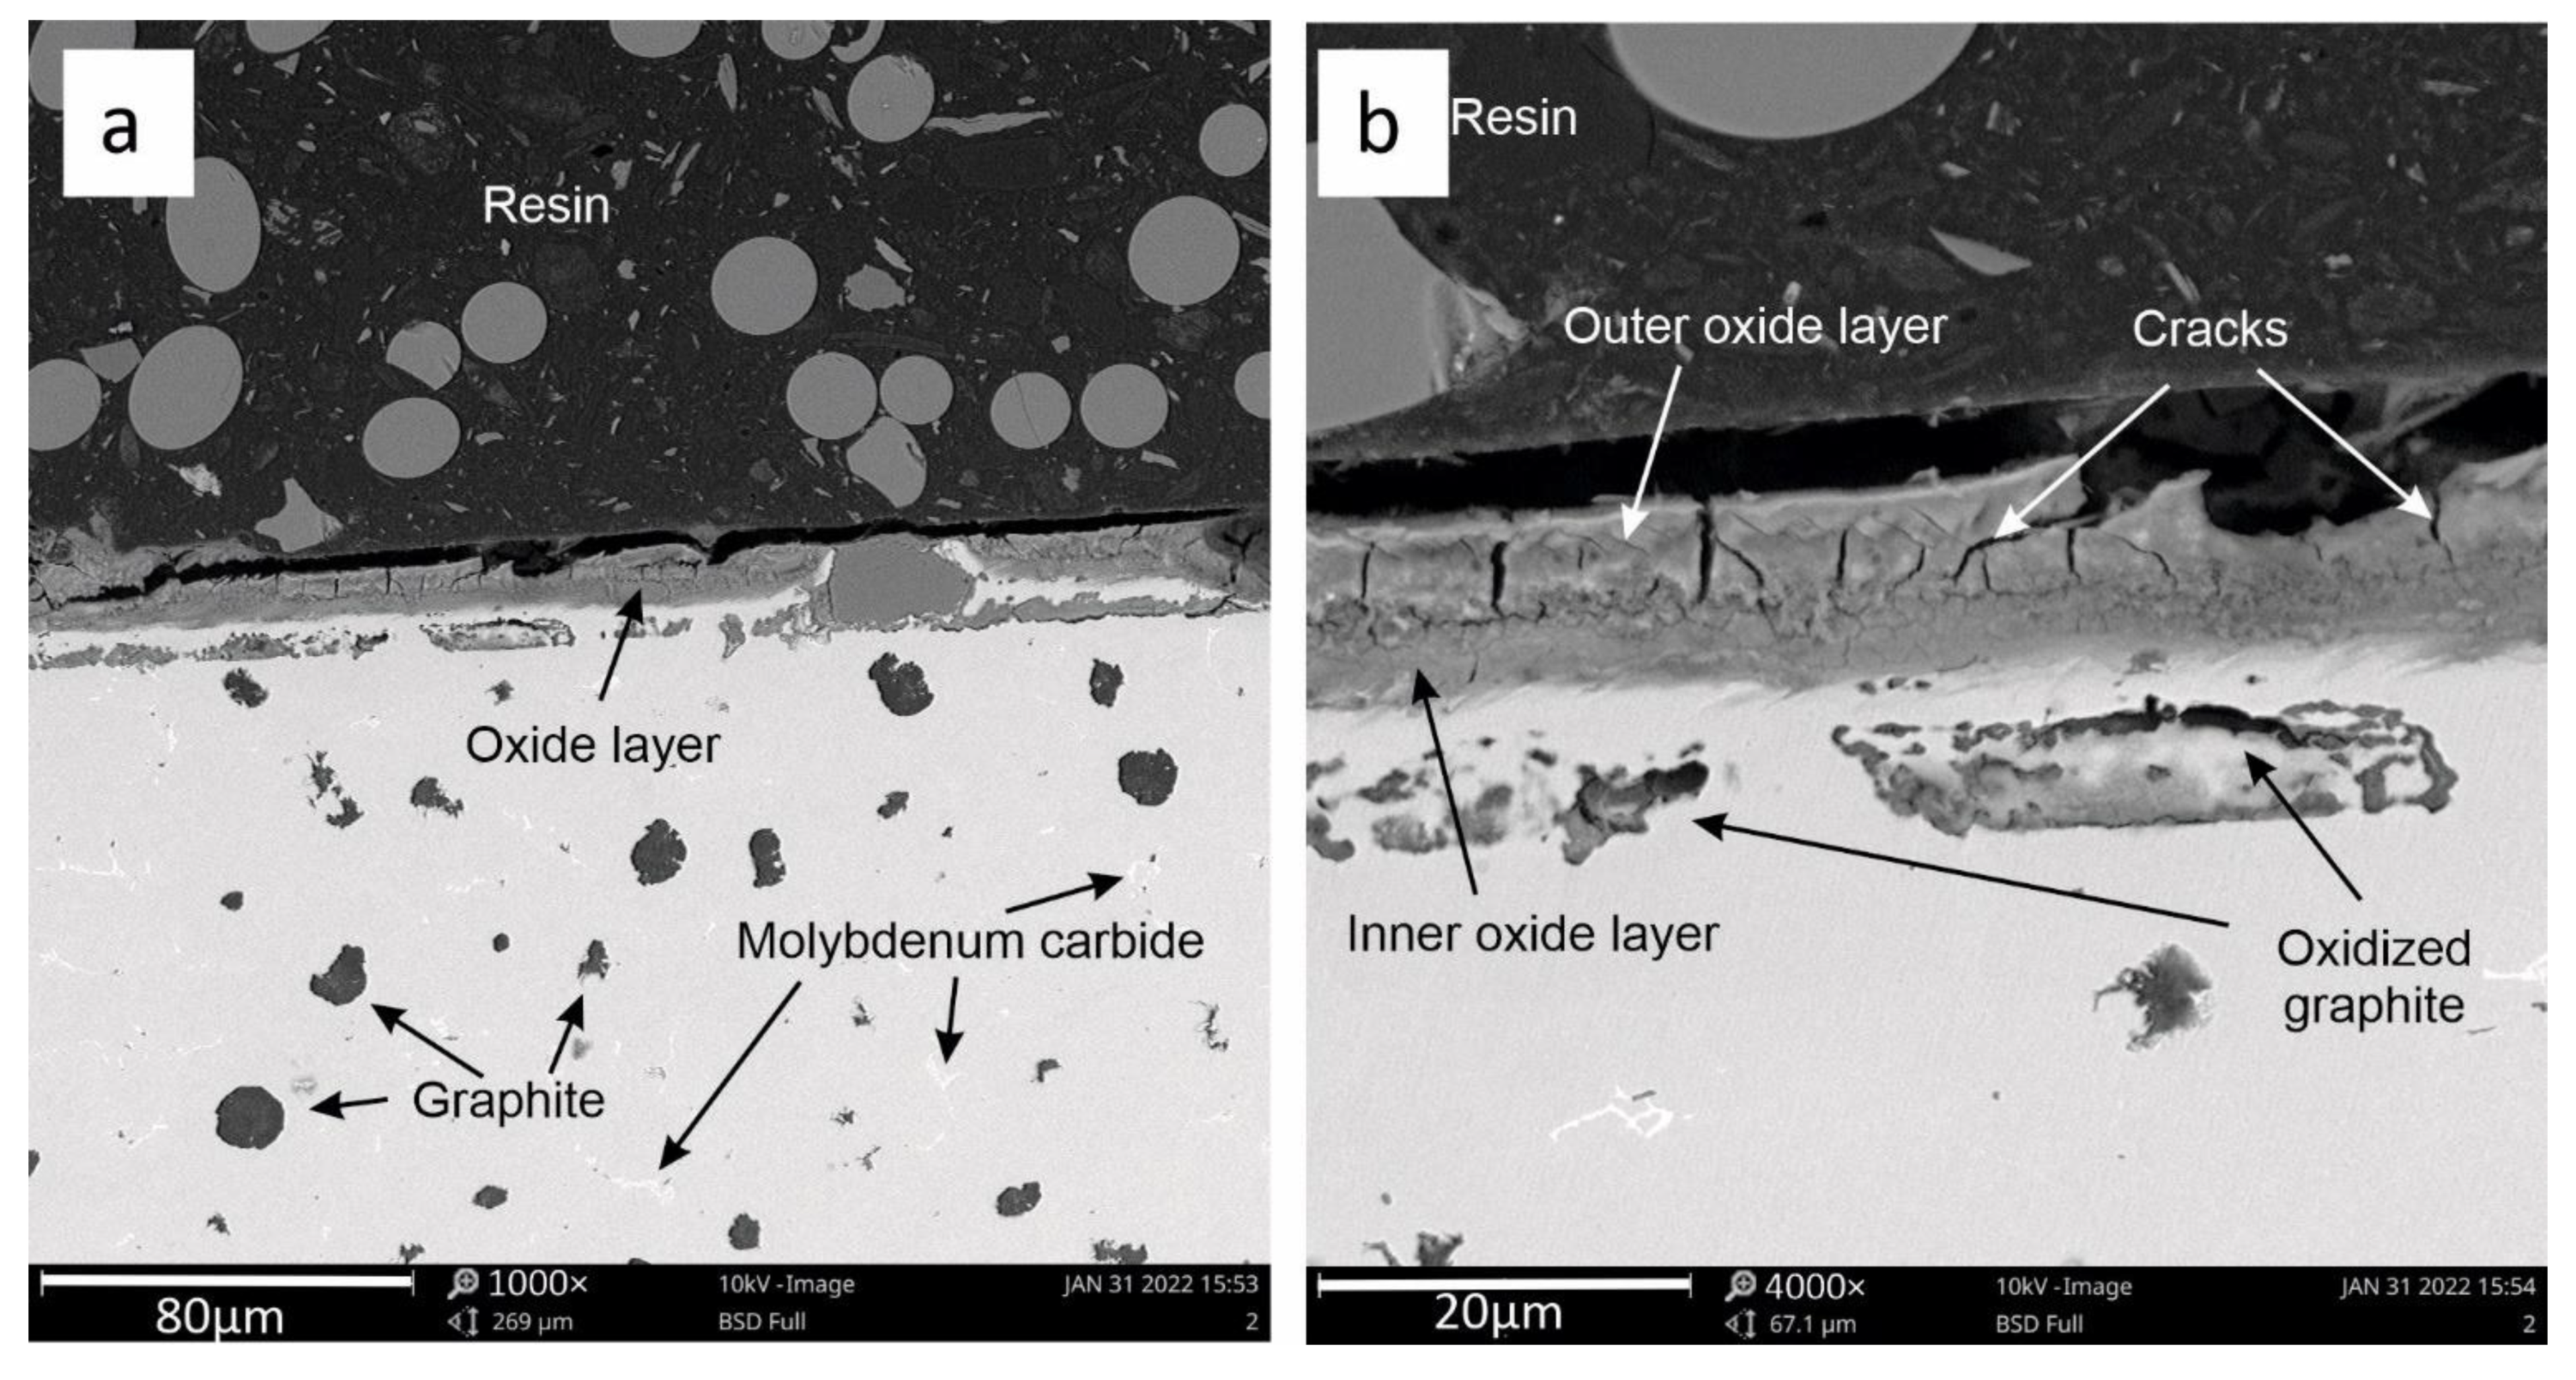
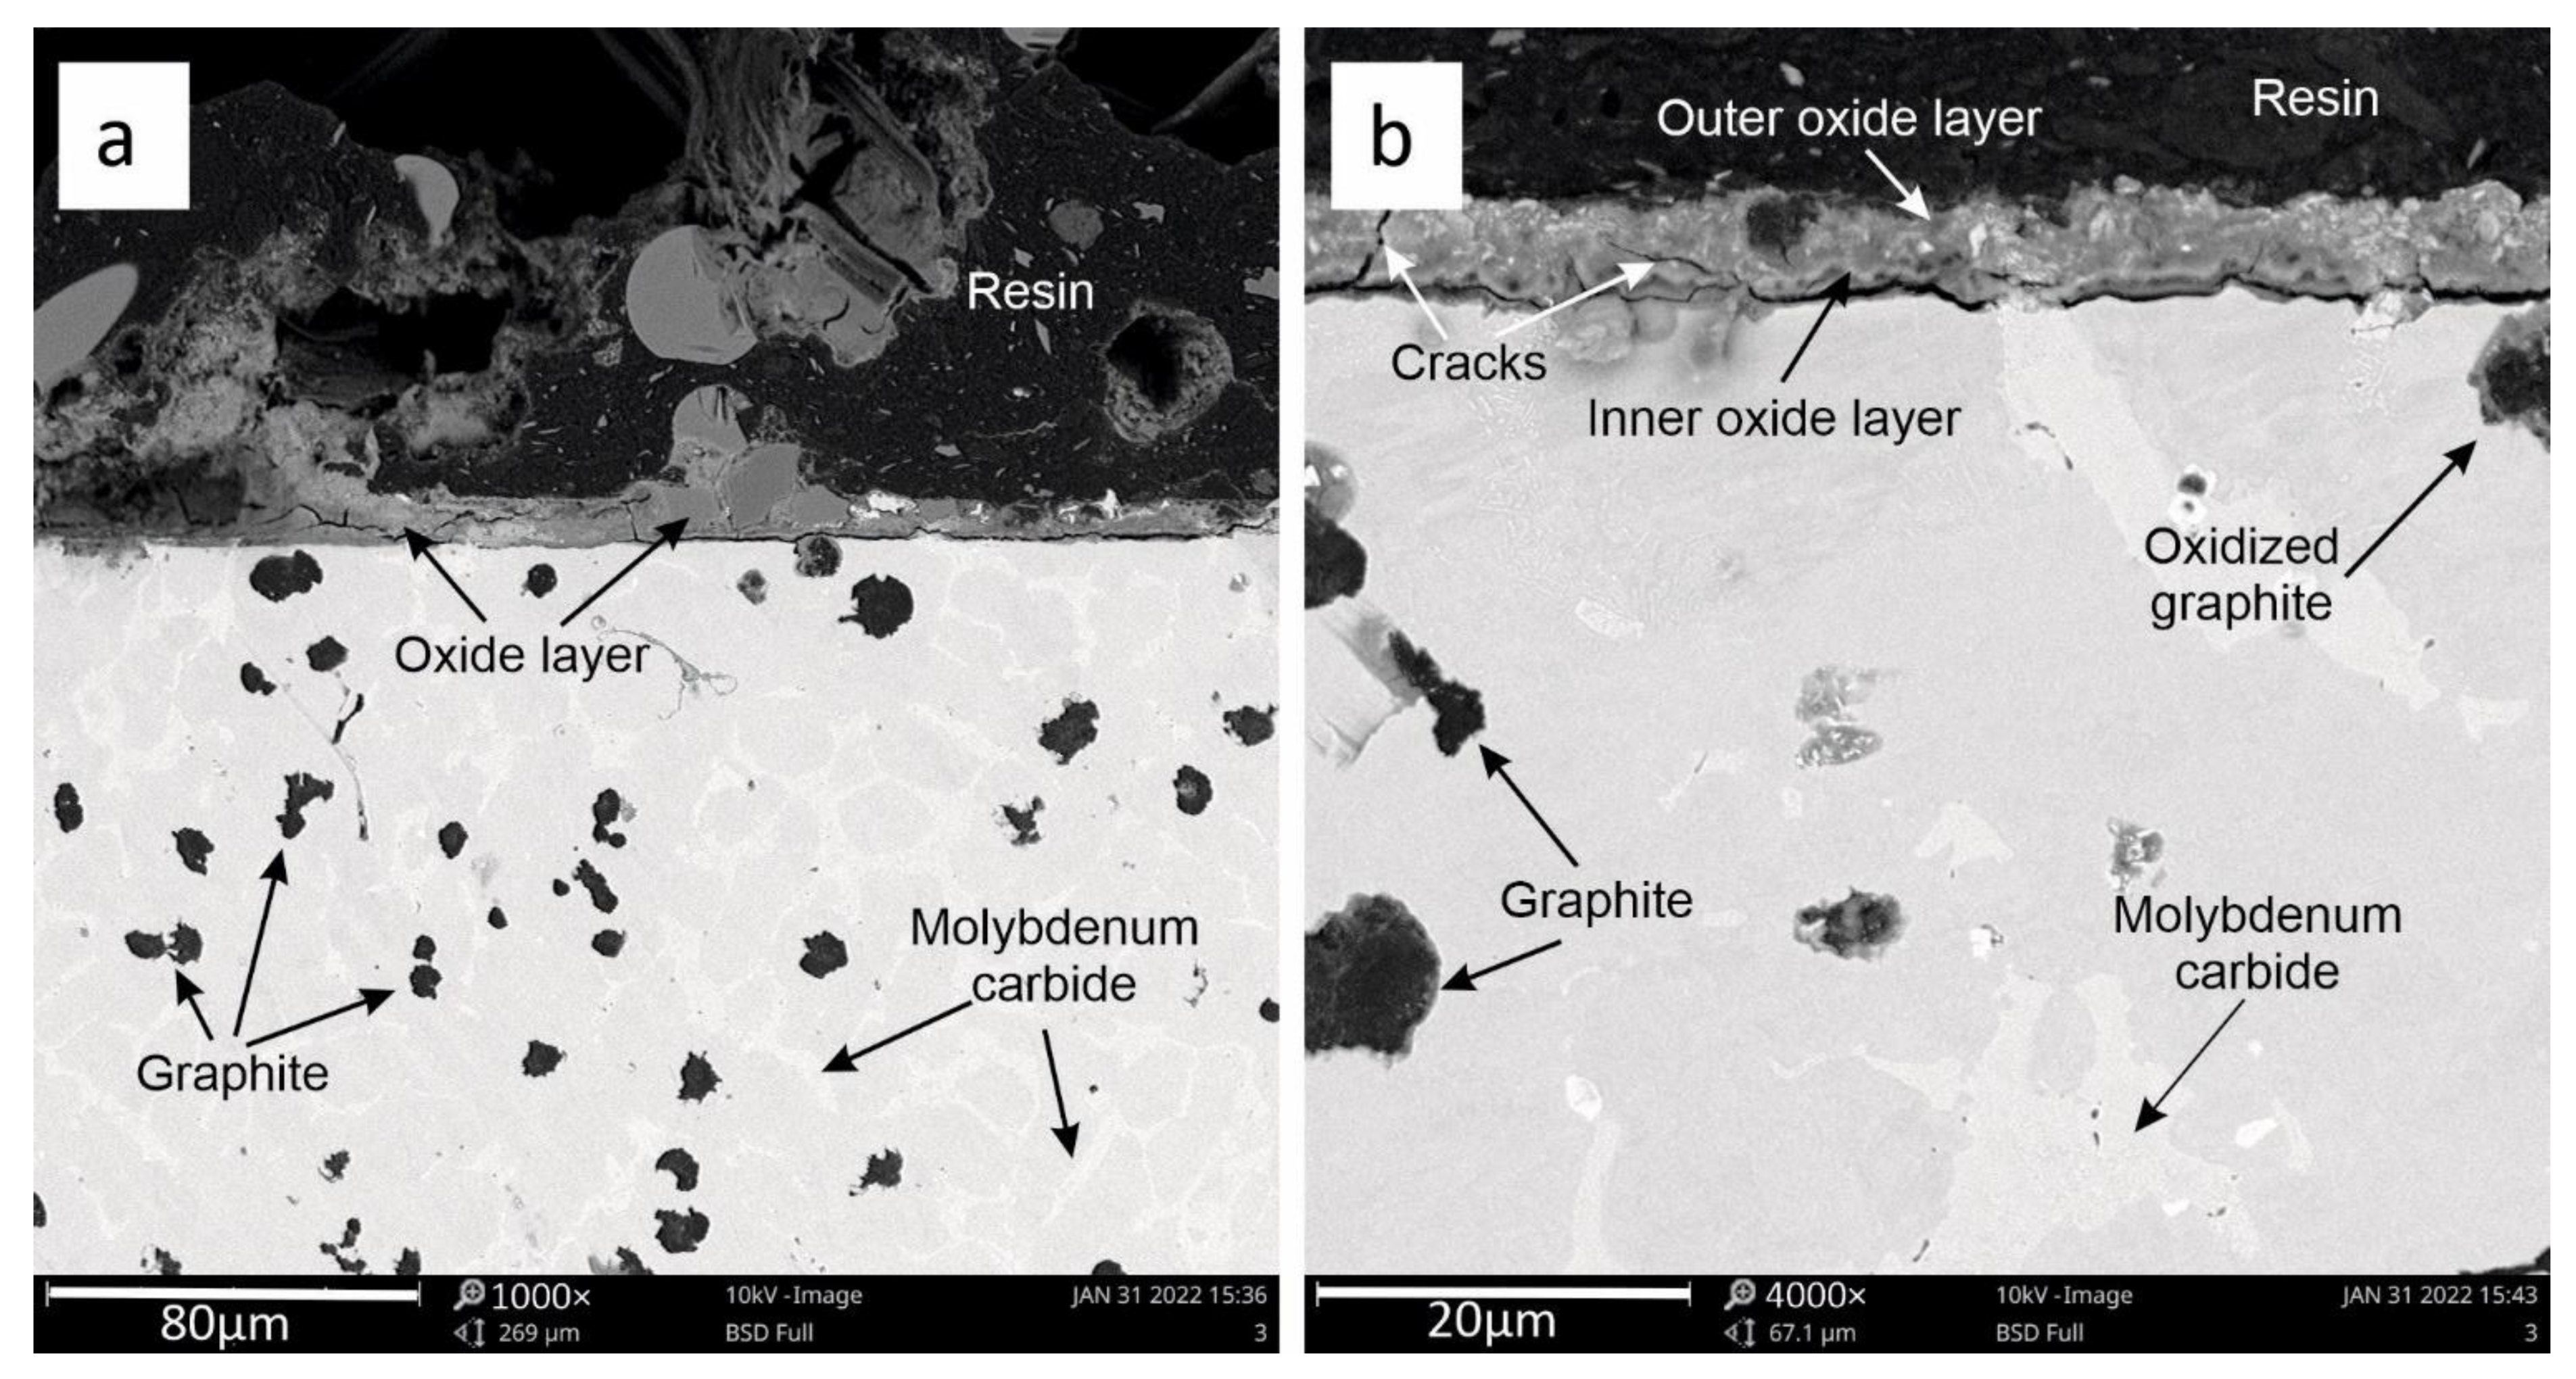
3.2. SEM Analysis
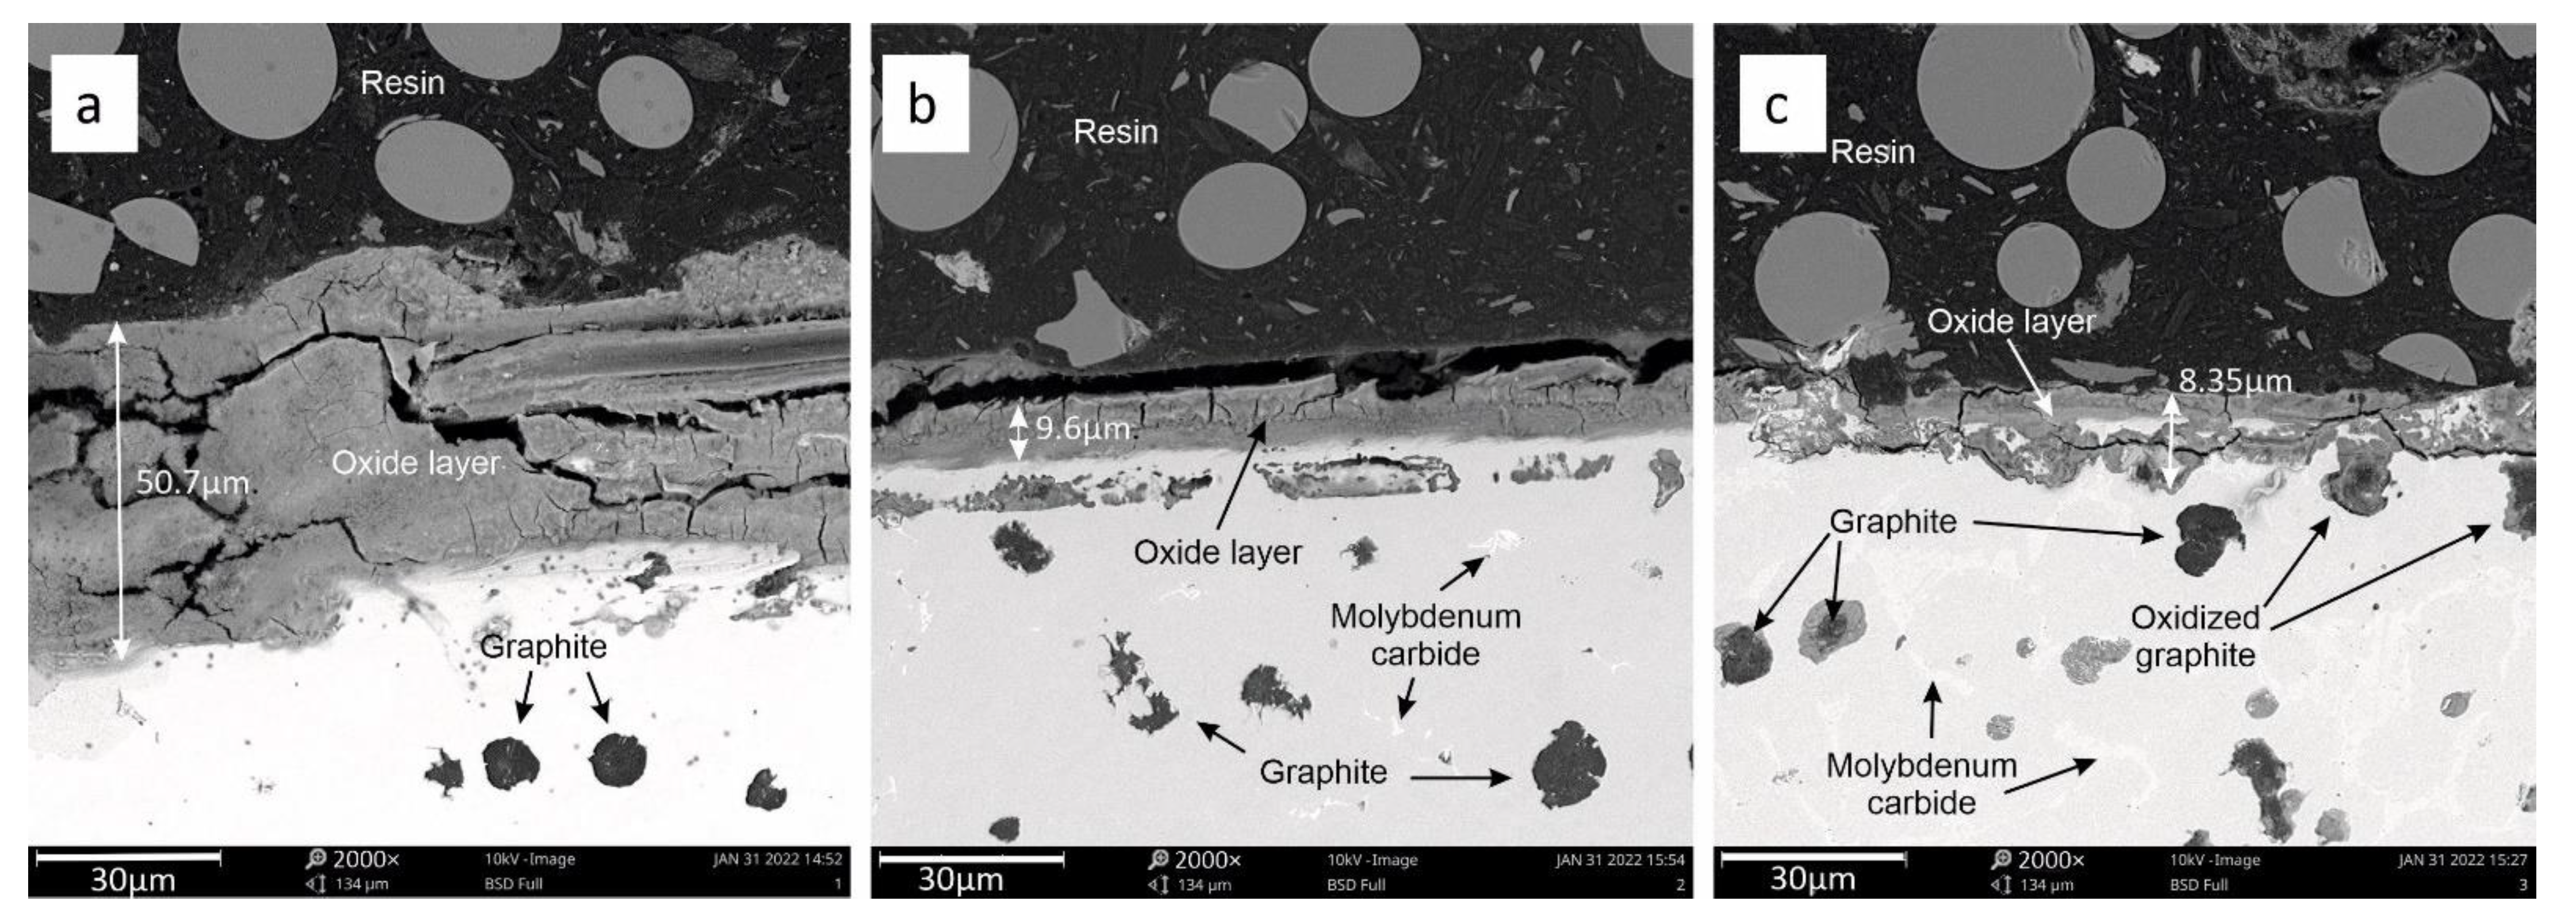
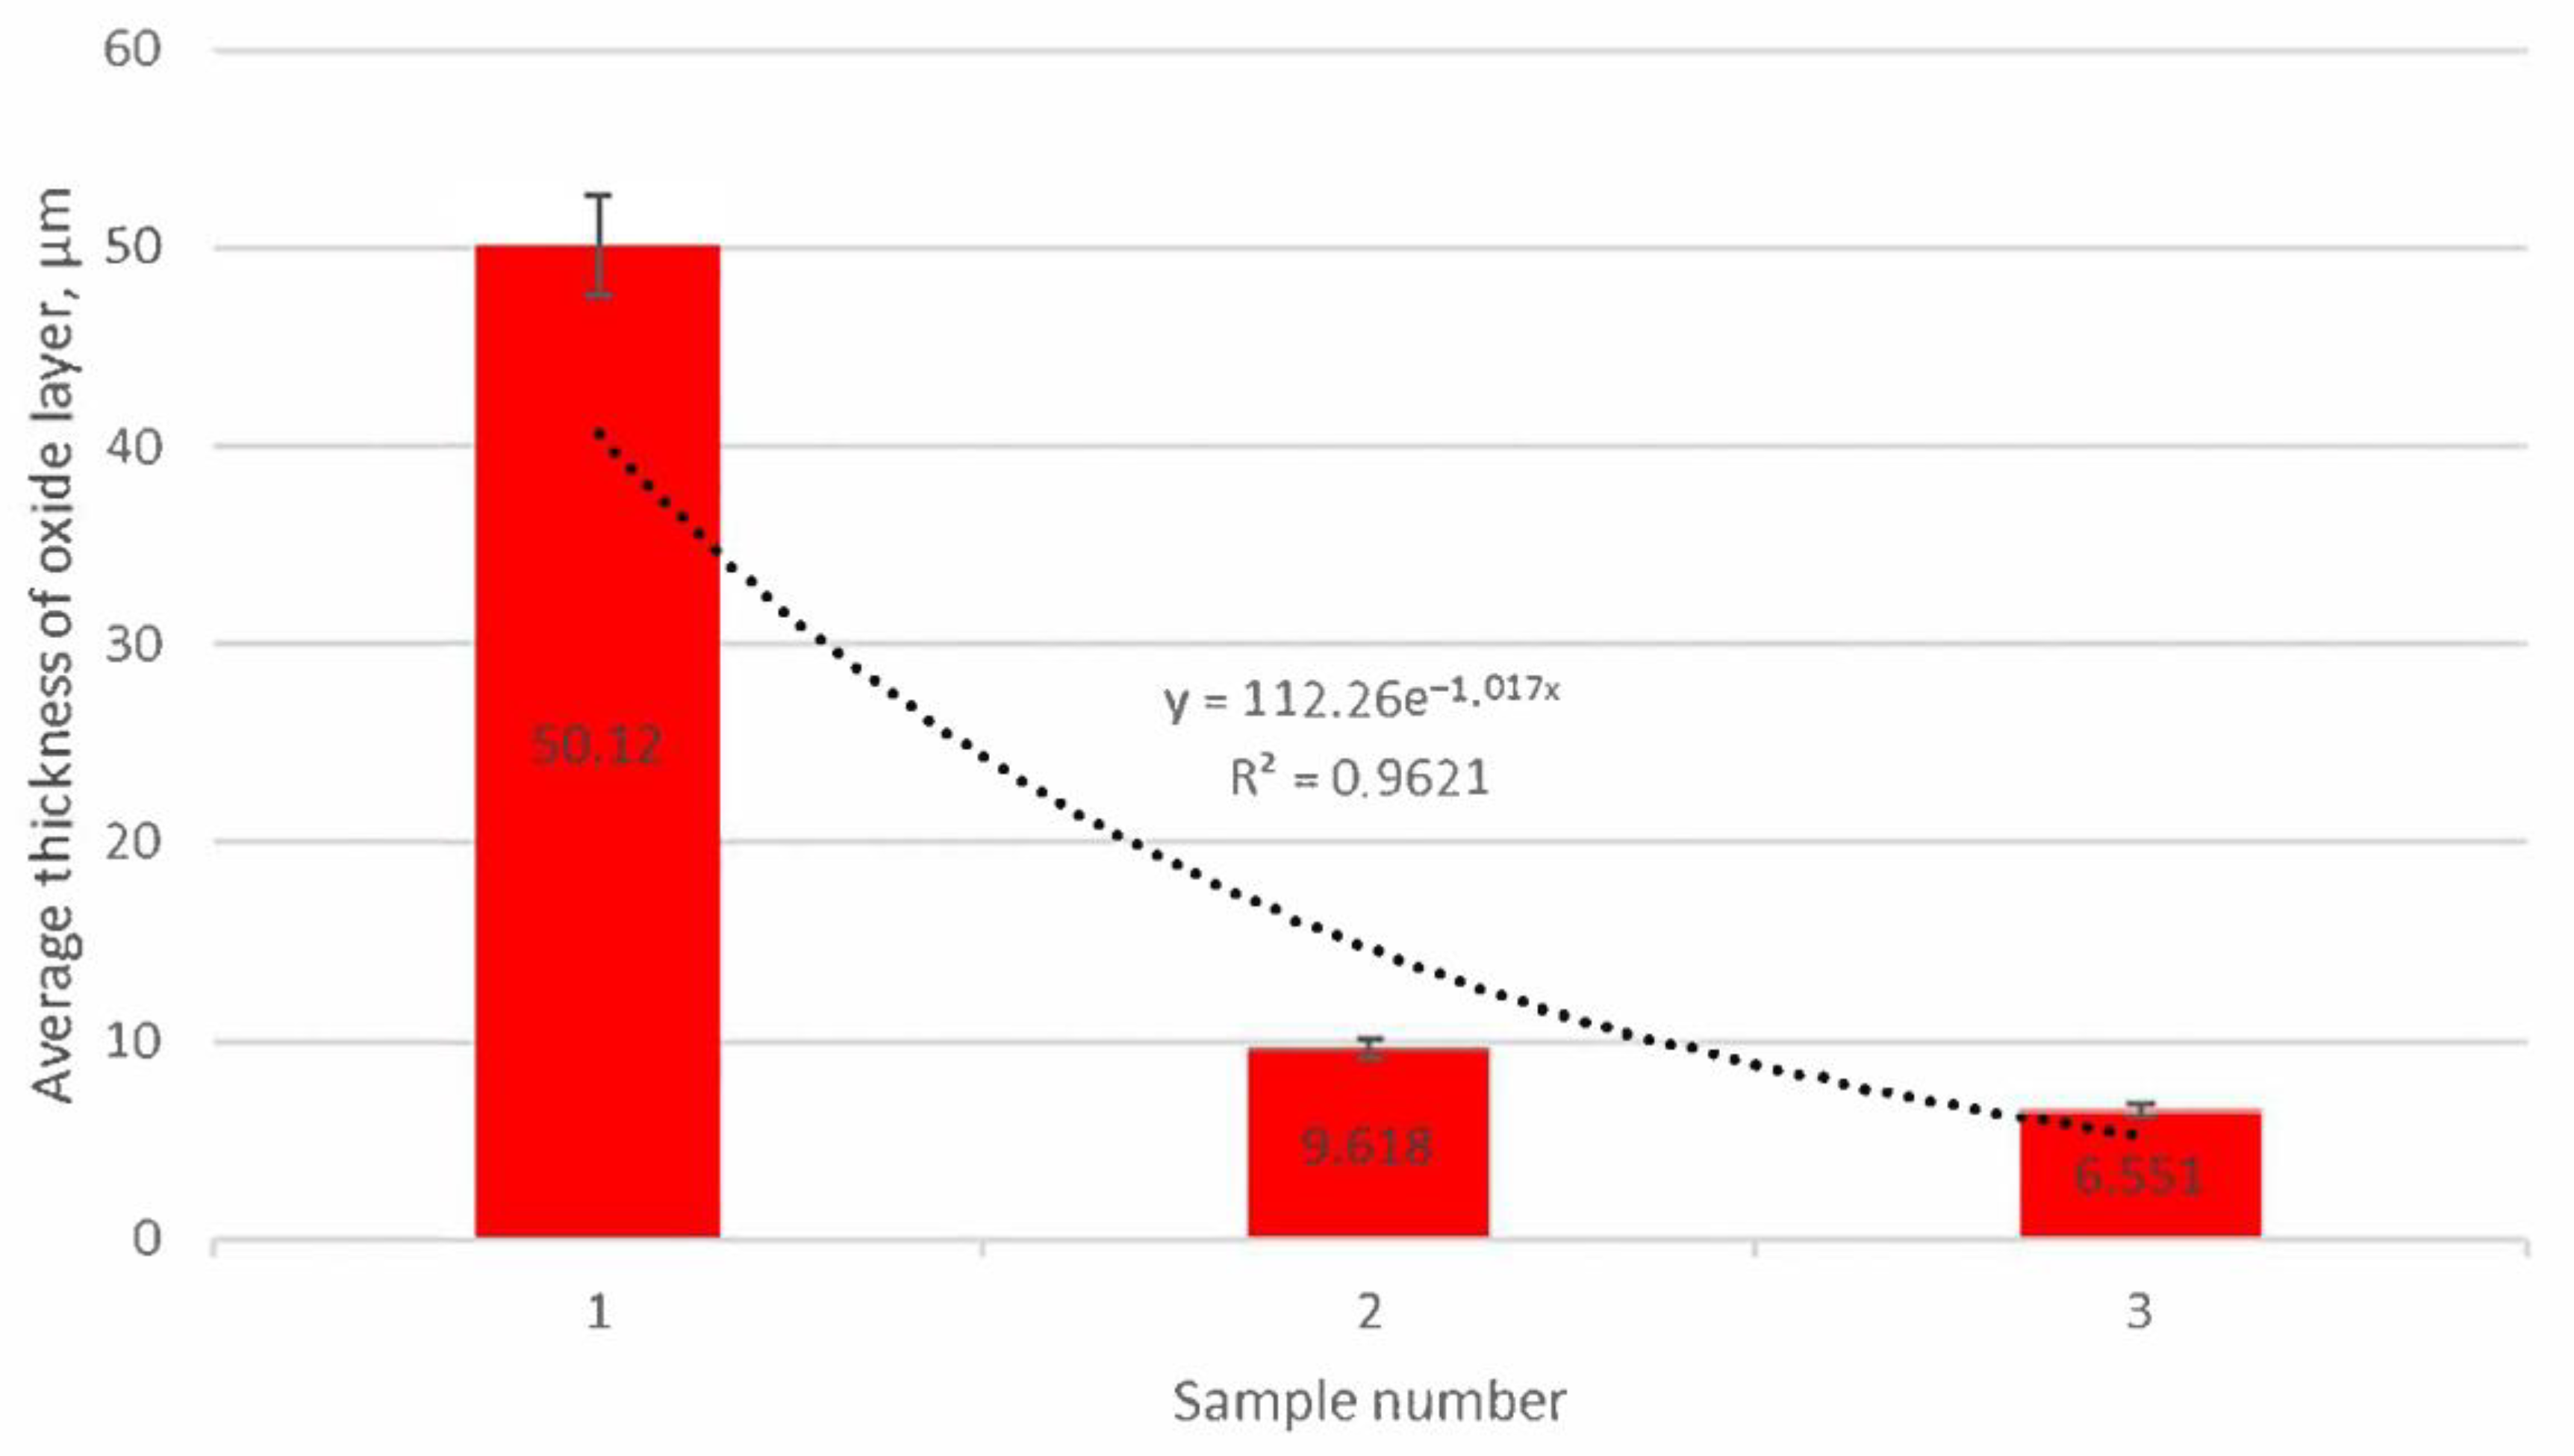
3.3. Oxide Layer Thickness Analysis
4. Discussion
5. Conclusions
- Adding molybdenum to silicon cast iron stabilises the corrosion process and reduces the thickness of the oxide layer.
- For the addition of 1% Mo, the decrease in the thickness of the oxide layer is 80% compared to the alloy without molybdenum.
- Increasing the Mo concentration from 1% to 2% causes a decrease in the oxide layer thickness by about 31% (compared to the alloy with 1% Mo addition).
- The reduction in the oxide layer thickness for the alloy with 2% Mo compared to the alloy without molybdenum addition is about 87%.
- For the alloy without molybdenum addition (sample 1), it is clearly visible that the oxide layer is formed with the decrease in silicon ferrite, the loss of which is 50%.
- For the sample with the addition of 1% Mo, the decrease in the share of silicon ferrite in the top oxide layer is 25.1%, while for the sample with the addition of 2% Mo, the decrease is only 9.7%.
- Increasing the Mo content in the alloy causes a decrease in the share of magnetite and hematite in the oxide surface layer.
- The 1% Mo concentration for cast iron provides an optimum-quality oxide layer.
Author Contributions
Funding
Institutional Review Board Statement
Informed Consent Statement
Data Availability Statement
Conflicts of Interest
References
- Xiang, S.; Jonsson, S.; Hedström, P.; Zhu, B.; Odqvist, J. Influence of ferritic nitrocarburizing on the high-temperature corrosion-fatigue properties of the Si-Mo-Al cast iron SiMo1000. Int. J. Fatigue 2021, 143, 105984. [Google Scholar] [CrossRef]
- Çelik, G.A.; Tzini, M.I.T.; Polat, S.; Atapek, H.; Haidemenopoulos, G.N. Matrix design of a novel ductile cast iron modified by w and al: A comparison between thermodynamic modeling and experimental data. Metall. Mater. Eng. 2020, 26, 15–29. [Google Scholar] [CrossRef]
- Ebel, A.; Brou, S.Y.; Malard, B.; Lacaze, J.; Monceau, D.; Vaissière, L. High-Temperature Oxidation of a High Silicon SiMo Spheroidal Cast Iron in Air with in situ Change in H2O Content. Mater. Sci. Forum 2018, 925, 353–360. [Google Scholar] [CrossRef]
- Lekakh, S.N.; Buchely, M.; O’Malley, R.; Godlewski, L.; Li, M. Thermo-cycling fatigue of SiMo ductile iron using a modified thermo-mechanical test. Int. J. Fatigue 2021, 148, 106218. [Google Scholar] [CrossRef]
- Tholence, F.; Norell, M. High temperature corrosion of cast irons and cast steels in dry air. In Materials Science Forum; Trans Tech Publications Ltd.: Bach, Switzerland, 2001; Volume 369, pp. 197–204. [Google Scholar] [CrossRef]
- Tholence, F.; Norell, M. Nitride precipitation during high temperature corrosion of ductile cast irons in synthetic exhaust gases. J. Phys. Chem. Solids 2005, 66, 530–534. [Google Scholar] [CrossRef]
- Tholence, F.; Norell, M. High temperature corrosion of cast alloys in exhaust environments I-ductile cast irons. Oxid. Met. 2008, 69, 13–36. [Google Scholar] [CrossRef]
- Tholence, F.; Norell, M. AES characterization of oxide grains formed on ductile cast irons in exhaust environments. Surf. Interface Anal. 2002, 34, 535–539. [Google Scholar] [CrossRef]
- Ekström, M.; Szakalos, P.; Jonsson, S. Influence of Cr and Ni on high-temperature corrosion behavior of ferritic ductile cast iron in air and exhaust gases. Oxid. Met. 2013, 80, 455–466. [Google Scholar] [CrossRef]
- Yang, Y.L.; Cao, Z.Y.; Qi, Y.; Liu, Y.B. The study on oxidation resistance properties of ductile cast irons for exhaust manifold at high temperatures. In Advanced Materials Research; Trans Tech Publications Ltd.: Bach, Switzerland, 2010; Volume 97, pp. 530–533. [Google Scholar] [CrossRef]
- Choe, K.H.; Lee, S.M.; Lee, K.W. High temperature oxidation behavior of Si-Mo ferritic ductile cast iron. In Materials Science Forum; Trans Tech Publications Ltd.: Bach, Switzerland, 2010; Volume 654–656, pp. 542–545. [Google Scholar] [CrossRef]
- Ahmad, Z. Types of corrosion: Materials and Environments. In Principles of Corrosion Engineering and Corrosion Control; Ahmad, Z., Ed.; Butterworth-Heinemann: Oxford, UK, 2006; pp. 120–270. [Google Scholar] [CrossRef]
- Stawarz, M.; Janerka, K.; Dojka, M. Selected phenomena of the in-mold nodularization process of cast iron that influence the quality of cast machine parts. Processes 2017, 5, 68. [Google Scholar] [CrossRef]
- Brady, M.P.; Muralidharan, G.; Leonard, D.N. Long-term oxidation of candidate cast iron and stainless steel exhaust system alloys from 650 to 800 °C in air with water vapor. Oxid. Met. 2014, 82, 359–381. [Google Scholar] [CrossRef]
- Zeytin, H.K.; Kubilay, C.; Aydin, H.; Ebrinc, A.A.; Aydemir, B. Effect of microstructure on exhaust manifold cracks produced from SiMo ductile iron. J. Iron Steel Res. Int. 2009, 16, 32–36. [Google Scholar] [CrossRef]
- Mohammadi, F.; Alfantazi, A. Corrosion of ductile iron exhaust brake housing in heavy diesel engines. Eng. Fail. Anal. 2013, 31, 248–254. [Google Scholar] [CrossRef]
- Stawarz, M.; Nuckowski, P.M. Effect of Mo Addition on the Chemical Corrosion Process of SiMo Cast Iron. Materials 2020, 13, 1745. [Google Scholar] [CrossRef] [PubMed]
- Cygan, B.; Stawarz, M.; Jezierski, J. Heat treatment of the SiMo iron castings–case study in the automotive foundry. Arch. Foundry Eng. 2018, 18, 103–109. [Google Scholar] [CrossRef]
- Górny, M.; Kawalec, M.; Gracz, B.; Tupaj, M. Influence of Cooling Rate on Microstructure Formation of Si–Mo Ductile Iron Castings. Metals 2021, 11, 1634. [Google Scholar] [CrossRef]
- Li, D. Mixed graphite cast iron for automotive exhaust component applications. China Foundry 2017, 14, 519–524. [Google Scholar] [CrossRef][Green Version]
- Unkić, F.; Glavaš, Z.; Terzić, K. The influence of elevated temperatures on microstructure of cast irons for automotive engine thermo-mechanical loaded parts. Mater. Geoenviron. 2009, 56, 9–23. [Google Scholar]
- Mervat, M.I.; Nofal, A.; Mourad, M.M. Microstructure and hot oxidation resistance of SiMo ductile cast irons containing Si-Mo-Al. Metall. Mater. Trans. B 2017, 48, 1149–1157. [Google Scholar] [CrossRef]
- Nyashina, G.S.; Kuznetsov, G.V.; Strizhak, P.A. Energy efficiency and environmental aspects of the combustion of coal-water slurries with and without petrochemicals. J. Clean. Prod. 2018, 172, 1730–1738. [Google Scholar] [CrossRef]
- Erzi, E.; Gürsoy, Ö.; Yüksel, Ç.; Colak, M.; Dispinar, D. Determination of Acceptable Quality Limit for Casting of A356 Aluminium Alloy: Supplier’s Quality Index (SQI). Metals 2019, 9, 957. [Google Scholar] [CrossRef]
- Uludağ, M.; Çetin, R.; Dispinar, D.; Tiryakioğlu, M. Characterization of the Effect of Melt Treatments on Melt Quality in Al-7wt % Si-Mg Alloys. Metals 2017, 7, 157. [Google Scholar] [CrossRef]
- Campbell, J. The consolidation of metals: The origin of bifilms. J. Mater. Sci. 2016, 51, 96–106. [Google Scholar] [CrossRef]
- Gyarmati, G.; Fegyverneki, G.; Tokár, M.; Mende, M. Investigation on double oxide film initiated pore formation in aluminum casting alloys. Int. J. Eng. Manag. Sci. 2020, 5, 141–153. [Google Scholar] [CrossRef]
- Stawarz, M.; Dojka, M. Bifilm Inclusions in High Alloyed Cast Iron. Materials 2021, 14, 3067. [Google Scholar] [CrossRef] [PubMed]
- Dojka, M.; Stawarz, M. Bifilm Defects in Ti-Inoculated Chromium White Cast Iron. Materials 2020, 13, 3124. [Google Scholar] [CrossRef]
- Rimmer, A.L.; Elliott, R. Technical Report: The occurrence of graphite flotation in a ductile iron and its effect on the mechanical properties of the austempered iron. Int. J. Cast Met. Res. 2016, 10, 57–65. [Google Scholar] [CrossRef]
- Delin, L.; Logan, R.; Burger, G.; Liao, G.; McFarlan, D.; Black, B.; Williams, R. High Silicon Cast Iron with Mixed Graphite (MG) Shapes for Elevated Temperature Applications. SAE Int. 2007, 116, 530–538. Available online: http://www.jstor.org/stable/44723894 (accessed on 7 April 2022).
- Trepczyńska-Łent, M. The Influence of Heat Treatment and Chemical Composition on the Structure and Mechanical Properties of Thick-walled Ductile Iron Castings. Arch. Foundry Eng. 2018, 18, 71–76. [Google Scholar] [CrossRef]
- Huyan, F.; Larker, R.; Rubin, P.; Hedström, P. Effect of Solute Silicon on the Lattice Parameter of Ferrite in Ductile Irons. ISIJ Int. 2014, 54, 248–250. [Google Scholar] [CrossRef]
- Guzik, E.; Kopyciński, D.; Wierzchowski, D. Manufacturing of Ferritic Low-silicon and Molybdenum Ductile Cast Iron with the Innovative 2PE-9 Technique. Arch. Metall. Mater. 2014, 59, 687–691. [Google Scholar] [CrossRef]
- Clayton, C.R.; Lu, Y.C. A Bipolar Model of the Passivity of Stainless Steel: The Role of Mo Addition. J. Electrochem. Soc. 1986, 133, 2465. [Google Scholar] [CrossRef]
- Newman, R. The dissolution and passivation kinetics of stainless alloys containing molybdenum—1. Coulometric studies of FeCr and FeCrMo alloys. Corros. Sci. 1985, 25, 331–339. [Google Scholar] [CrossRef]
- Olefjord, I.; Brox, B.; Jelvestam, U. Surface Composition of Stainless Steels during Anodic Dissolution and Passivation Studied by ESCA. J. Electrochem. Soc. 1985, 132, 2854. [Google Scholar] [CrossRef]


| Sample Number | Chemical Composition, % of Weight, | |||||||
|---|---|---|---|---|---|---|---|---|
| 1 C | Si | Mo | P | 1 S | Mg | 2 Ceut | Fe (Balance) | |
| 1 | 3.01 | 5.09 | 0.01 | 0.023 | 0.007 | 0.042 | 4.595 | 91.818 |
| 2 | 3.06 | 5.02 | 1.03 | 0.022 | 0.009 | 0.039 | 4.623 | 90.820 |
| 3 | 3.02 | 5.04 | 2.07 | 0.018 | 0.006 | 0.047 | 4.588 | 89.799 |
| Sample Number Heating Cycle | Quantitative Phase Composition (%wt) | ||||
|---|---|---|---|---|---|
| Iron (Si) | Iron Alpha | Magnetite | Hematite | Fe3Mo3C | |
| 1/C1 1 | 71.9 | 7.8 | 7.9 | 12.4 | - |
| 1/C2 2 | 41.7 | 11.9 | 12.6 | 33.8 | - |
| 1/C3 3 | 28.8 | 15.9 | 17.8 | 45.6 | - |
| 2/C1 1 | 93.3 | - | 1.2 | 5.5 | - |
| 2/C2 2 | 81.1 | - | 5.6 | 13.3 | - |
| 2/C3 3 | 68.2 | - | 10.1 | 21.7 | - |
| 3/C1 1 | 95.5 | - | - | 4.5 | - |
| 3/C2 2 | 90 | - | 1.5 | 6.4 | 2 |
| 3/C3 3 | 85.8 | - | 2.9 | 9.8 | 1.6 |
Publisher’s Note: MDPI stays neutral with regard to jurisdictional claims in published maps and institutional affiliations. |
© 2022 by the authors. Licensee MDPI, Basel, Switzerland. This article is an open access article distributed under the terms and conditions of the Creative Commons Attribution (CC BY) license (https://creativecommons.org/licenses/by/4.0/).
Share and Cite
Stawarz, M.; Nuckowski, P.M. Corrosion Behavior of SiMo Cast Iron under Controlled Conditions. Materials 2022, 15, 3225. https://doi.org/10.3390/ma15093225
Stawarz M, Nuckowski PM. Corrosion Behavior of SiMo Cast Iron under Controlled Conditions. Materials. 2022; 15(9):3225. https://doi.org/10.3390/ma15093225
Chicago/Turabian StyleStawarz, Marcin, and Paweł M. Nuckowski. 2022. "Corrosion Behavior of SiMo Cast Iron under Controlled Conditions" Materials 15, no. 9: 3225. https://doi.org/10.3390/ma15093225
APA StyleStawarz, M., & Nuckowski, P. M. (2022). Corrosion Behavior of SiMo Cast Iron under Controlled Conditions. Materials, 15(9), 3225. https://doi.org/10.3390/ma15093225