Article

Seismic Performance and Cost Analysis of UHPC Tall Buildings in UAE with Ductile Coupled Shear Walls

by
Mohammad AlHamaydeh
1,*,
Mohamed Elkafrawy
2,3 and
Shaziya Banu
1
1
Department of Civil Engineering, College of Engineering, American University of Sharjah, Sharjah P.O. Box 26666, United Arab Emirates
2
Ph.D. Program in Material Science and Engineering, College of Arts and Sciences in Collaboration with College of Engineering, American University of Sharjah, Sharjah P.O. Box 26666, United Arab Emirates
3
Structural Engineering Department, Faculty of Engineering, Tanta University, Tanta P.O. Box 31733, Egypt
*
Author to whom correspondence should be addressed.
Materials 2022, 15(8), 2888; https://doi.org/10.3390/ma15082888
Submission received: 10 February 2022 / Revised: 30 March 2022 / Accepted: 12 April 2022 / Published: 14 April 2022
(This article belongs to the Special Issue Ultra High Performance Concrete (UHPC): Current and Future Research)

Abstract

:
The superior mechanical characteristics of ultra-high-performance concrete (UHPC) have attracted the interest of many researchers worldwide. Researchers have attempted to perform comparative analyses on the behavior of UHPC versus conventional and high-strength concrete, with their aim being to gain more insights into the difference between different types of concrete. However, the current state-of-the-art revealed no direct comprehensive comparisons between their behaviors in ductile coupled shear walls under seismic loading. This paper explores a comprehensive side-by-side comparison in terms of seismic behavior and cost analysis for four 60-story archetype buildings. The reference building was designed using high-strength concrete with a strength of 60 MPa. The other three archetype variations incorporated three different UHPC grades: 150 MPa, 185 MPa, and 220 MPa. The plan configuration and the lateral force-resisting system (LFRS) were chosen according to the most common practice in the UAE. The main objective is to report the effect of UHPC on the LFRS (ductile coupled shear walls). Moreover, a simplified initial cost analysis (materials and labor) design was performed. The findings of this paper indicate that the use of UHPC is capable of improving the seismic performance behavior of the lateral system as well as reducing the total initial costs.

1. Introduction

In recent decades, the number of high-rise buildings has increased all over the world. They are designed and built using innovative structural systems and lighter materials. So, these structures tend to be more flexible with lower damping than previous constructions. However, these buildings are more sensitive to dynamic excitation caused by strong earthquake loads in comparison to older structures. The majority of tall structures are prone to seismic loads and vibrations, and, hence, it is essential to design these structures appropriately. The mass, stiffness, natural period, and damping coefficient are the main dynamic characteristics of these structures. If a structure has a lower natural frequency, then it vibrates significantly under seismic loading. In addition, the structural design response is considered an important factor in the design of tall structures [1]. There has been a significant amount of research on tall buildings with various characteristics such as vertical irregularity [2], irregular plans [3], dual structural systems [4,5], and buildings with a basement [6]. In addition, newly-developed techniques to enhance the seismic performance of RC structures, such as using shape memory alloys with superelastic behavior instead of conventional steel bars, have been investigated in several research studies [7,8,9,10]. From a structural design perspective, this type of building requires concrete with superior properties to withstand the high stresses due to the increasing weight of buildings in addition to the lateral loads effect. Nowadays, conventional and high-strength concrete, which has a compressive strength range from 40 to 70 MPa, is commonly used in the design of these buildings. In general, several research studies have categorized concrete based on its compressive strength into conventional (20 to 50 MPa), high-strength (50 to 80 MPa), high performance (80 to 150 MPa), and ultra-high-performance (150 to 220 MPa) concrete [11,12,13]. Conventional concrete is slowly being replaced with a new, more densified type of concrete called ultra-high-performance concrete (UHPC). This new type of concrete is able to possess more advanced properties in terms of compressive strength, durability, tensile strength, ductility [14,15,16,17,18], the placement of concrete, its brittleness, and the life span of the material. UHPC is considered suitable for bridge decks, piers, strengthening and repair applications, high ductility designs, and elements for blast protection [14,19,20,21,22]. Some other UHPC applications include beam shells [23], column shells [24], and closure joints between prefabricated bridge deck elements [25,26]. Moreover, UHPC has a lower porosity and moisture content compared to other concrete types, which assists in structural rehabilitation [16,18,26,27,28]. However, one of the main limitations of UHPC is that it is perceived as a costly material due to its highly-densified structure. Also, UHPC requires high-temperature curing and fine quartz powder, increasing the associated cost and energy consumption [29]. In addition, Liu et al. reported that UHPC loses most of its strength at high temperatures (higher than 500 °C) [30]. However, fire proofing could be implemented in such cases to improve the fire resistance of UHPC. Thus, this paper compares the seismic performance and analyzes the cost of different models of a 60-story building developed using high-strength concrete and UHPC. In addition, this paper utilizes ductile coupled shear walls to resist the applied seismic loading. Shear walls are usually used as the lateral force resistant system due to their high in-plane stiffness. Almost all shear walls tend to have openings due to the architectural requirements of the building. These openings split the shear walls into two or more slender walls connected using coupling beams. The main advantages of utilizing a coupled shear wall system include the reduction of moment due to the coupling action, the dissipation of seismic energy through the coupling beams over the stories, and a higher lateral stiffness compared to the sum of its individual wall piers [31]. Moreover, hybrid coupled shear walls consisting of reinforced concrete shear walls with steel coupling beams are considered a suitable and appropriate alternative to reinforced concrete shear walls [31,32].
Recently, several studies compared different techniques used to optimize the seismic response of RC structures. In other words, using alternative materials such as FRP bars instead of conventional steel reinforcement led to a significant improvement in different aspects, as reported in [33,34,35,36,37,38,39,40,41,42,43,44,45,46,47,48,49,50,51,52,53,54]. Furthermore, cost-analyses were reported in different seismic applications [55,56,57,58,59,60,61,62,63,64,65,66,67]. They mentioned a significant reduction in costs in addition to the enhancement of the performance of structural elements [68,69,70].
Despite the advanced behavior of UHPC in the construction and design industry, no guidance yet exists for the ways in which a designer can optimize the use of UHPC in structural designs. Numerous studies have investigate UHPC [14,26,71,72,73,74,75,76,77,78,79,80,81,82,83,84,85]. Barnett et al. investigated the effect of the addition of fiber on the strength of UHPC [71,79]. A study conducted by Graybeal, in 2007, proved that UHPC gained over 70 MPa of strength within two days of curing time [72,79]. Another study by Wille et al., in 2011, even produced UHPC with a compressive strength of greater than 210 MPa without steam curing or pressure [73,79]. Khalil et al. studied the effect of using UHP-SHCC in retrofitting some existing structures subjected to repeated loading [74,75,76,77].
Naeimi and Moustafa [78] studied the overall behavior, failing mechanism, and reinforcement values of UHPC, as well as the detailing of its design using finite element modeling and using pushover analysis on DIANA FEA. A bridge with two columns was investigated with the use of UHPC instead of traditional concrete. A parametric analysis was investigated in order to study the effect of different steel ratios and other parameters on the overall behavior of the two piers. To evaluate the difference, a similar model was prepared and analyzed using conventional concrete. The results obtained showed that high-strength steel is essential to utilize the mechanical properties of UHPC to the fullest. The results also showed that the UHPC columns carried more flexure when compared to conventional columns, and this may prove to be economical since smaller cross-sections can be utilized for the columns.
Azmee and Shafiq [80] discussed the importance of using UHPC in the structural field and how it is regarded as the future of concrete. The different design procedures and applications of UHPC are discussed in the paper. UHPC is regarded as the future because it exhibits remarkable properties including very high compressive strength values and self-placing and densifying properties. At the end of the paper, the authors manage to confirm that UHPC possesses better properties than conventional concrete and that it can help to improve the sustainability of buildings. However, it is not very commonly used because of its perceived high cost and challenging design procedure.
Oesch et al. [81] examined the properties and behavior of cementitious material in conventional concrete and UHPC at the micro-scale. This was done in order to better understand the role of these materials and further advance concrete design in the future. The authors identified relationships between design parameters of different materials used in concrete mixing, such as the stiffness parameter and information regarding cracking parameters and the crack volume. A negative gradient relationship was obtained between the stiffness parameters and crack volume for both concrete types.
Valikhani et al. [26] discussed the fact that bridges are always exposed to harsh environmental conditions around them. These harsh conditions can lead to the deterioration of concrete and reduce the service life of the bridge. This paper used UHPC as a repair material to fix issues with bridges in service. The UHPC was used as a sealing layer or crack filler on top of the bridge made of conventional concrete. The issue with this repair strategy is that there is very limited knowledge regarding the bond strength between UHPC and conventional concrete. This paper tested the bond strength using 30 specimens tested under the bi-surface shear test with different surface preparation and roughness degrees. The results concluded that the presence of some roughness between the two surfaces (UHPC and conventional concrete) allows for the growth of a strong bond between the two surfaces involved.
Since the flexural capacity of reinforced columns deteriorates with underground motion due to the crushing of the concrete and the buckling of longitudinal steel bars, research has focused on lessening the damage at the plastic hinge regions of bridge columns in order to develop bridge columns that are seismic-resistant. In their efforts to mitigate this issue, Ichikawa et al. [79] studied the use of locating UHPC segments in plastic hinge regions. Three small-scale columns were tested. Two columns were tested by bilateral cyclic loading and had different plastic hinge detailing. One column had a reinforced concrete core covered in a UHPC jacket. Another column was post-tensioned and had a UHPC hollow-core plastic hinge. Despite the differences in detailing, both columns were designed to have the same strength. The point behind the bilateral cyclic loading was to inflict deformations due to flexure and test the possibility of having torsional modes within the columns. The results proved that the concrete core column successfully carried the applied axial loads to a drift of 6%, while the post-tensioned column carried the applied axial load to a drift of 3.5%. The results showed that the UHPC column proved to have a good performance against seismic loads.
Wille et al. [82] tested the validity of most of the flexural stress and strain models available for calculating the flexure strength of UHPC. The authors considered nine models and tested them by comparing the theoretical results obtained from the models to real experimental data. The reason behind this comparison was the common confusion regarding which model accurately represents the performance of UHPC in flexure. For instance, design guidelines suggest that the way to design ultra-high-performance concrete is by using stress–strain relationships and stress block assumptions. However, assumptions are not enough, and the paper in question demonstrated that ultra-high-performance concrete requires more accurate information. Therefore, the given paper evaluated different combinations of compression and tension stress blocks with experimental data and previous research results in order to find the most precise model for UHPC.
Arora et al. [14] explored the different ways of mixing aggregates and binder to produce sustainable and economical UHPC. Both the aggregates and the binder were selected using the maximum packing density suggested by a compressible packing model to produce UHPC with compressive strengths higher than 150 MPa. In order to achieve UHPC, a cement mass replacement between 30% to 50% was studied. Three aggregate sizes of 6.25 mm, 4.75 mm, and 2.36 mm were selected. The preliminary cost analysis indicated that the use of filler materials and cement replacements reduces material costs. This could be attributed to the reduction in ordinary cement paste content.
Many researchers have studied the performance of UHPC, focusing on its development and behavior from a materials-related perspective. Dong [83] examined the findings obtained from material-related journal papers in a structural design context. To do that, Dong modeled prestressed bridge girders made of UHPC instead of traditional concrete. Dong studied their durability, structural integrity, environmental impact, and cost. After comparing the life-cycle cost of the same bridge modeled using UHPC and normal concrete, the results proved that UHPC is sufficient to prolong the service life of a structure while improving the environmental impact in the long run and reducing the annual cost.
Numerous computational methods exist for describing the behavior of UHPC structures under seismic loading. Wang et al. [84] studied a more straightforward method to model the seismic performance of UHPC bridge columns based on the identified fap-shaped hysteretic model. In this model, the elastic stiffness, yield lateral force, post-yield stiffness ratio, and energy dissipation coefficient are calculated. This method focuses on the yield and ultimate states of the columns. The results of a nonlinear dynamic response state that the identified fap-shaped hysteretic model is suitable for estimating the dynamic responses and maximum drift ratio for UHPC bridge columns under earthquake loading. This simplified method can predict the hysteretic characteristics of UHPC.
Experimental and numerical investigations were carried out by Ren et al. [85] to describe the performance of UHPC box piers subjected to seismic loading. The failure mode, hysteretic characteristics, energy dissipation, and stiffness degradation were investigated. In order to better understand the performance of UHPC box piers, parametric analysis was analyzed, and the effect of the axial load ratio and the longitudinal reinforcement ratio on the ductility of UHPC box piers was studied. The results showed that the ductility of UHPC box piers decreases with an increase in the longitudinal reinforcement ratio. The test angle plays a significant role in ductility. The ductility is reduced to the minimum when the direction of the lateral loads becomes normal to the diagonal of the cross-section.
This study investigates the feasibility of using UHPC in tall buildings located in moderate seismicity regions in terms of seismic performance and cost-effectiveness. UHPC demonstrates enhanced properties such as a higher compressive strength, a higher ductility and durability, and a better tensile strength [14,15,16,17,18]. Moreover, seismic hazard maps for the United Arab Emirates (UAE) have not been published in international standards yet since it was considered a zero seismic region as per UBC’ 97 code [86]. However, several research studies have performed a seismic hazard assessment of the UAE and reported that most parts of the UAE have moderate to low seismic hazard activities [87]. The coastal areas of the UAE have relatively higher seismic levels as the closest potential earthquake fault is only 100 km away from them [88]. ETABS software was used to model, analyze, and design most of the structural elements, as discussed in more detail in the coming sections. ETABS software has been produced by Computers and Structures, Inc. (CSI), California [89]. Four different buildings were modeled using different compressive strengths of concrete. The first model was for high-strength concrete with a compressive strength of 60 MPa. In comparison, the other three models were for UHPC with compressive strengths of 150, 185, and 220 MPa.

2. Research Significance

There is a research gap regarding the influence of UHPC on the seismic performance of tall buildings. In addition, there are no codes or standards developed explicitly for structural design using UHPC. UHPC has been found to be an efficient alternative to conventional concrete. Since the Dubai Municipality published its most recent Seismic Code [90], building officials and structural engineering experts have encouraged engineers to perform seismic vulnerability investigations for the building stock in the UAE. Therefore, this project attempts to evaluate UHPC tall buildings with ductile coupled shear walls as LFRSs in moderate seismicity regions such as the UAE. The cost impact of utilizing UHPC in tall buildings has not been fully explored. Thus, a comparative study of the seismic performance and cost implications of utilizing UHPC in tall buildings will add substantial value to the body of knowledge. To achieve this objective, four archetype 60-story buildings were designed using UHPC with compressive strengths of 60, 150, 185, and 220 MPa. Moreover, an initial cost analysis was also performed to determine if UHPC improves the lateral system seismic performance behavior along with a reduction in the total initial costs. To the best of the authors’ knowledge, there are no studies in the available literature that address this research gap. The findings of this paper may lead to further research on this topic, the usage of UHPC in tall buildings, or ultimately to the development of the design codes or standards for the seismic analysis of tall buildings in the UAE.

3. Materials and Methods

Since many high-rise buildings worldwide, especially in the UAE, have a typical number of stories ranging from 40 to 80, the average number of 60 floors was chosen in this research to study the effect of the concrete type. Typically, a 60-story building is considered a tall building, and, particularly in the UAE, plenty of buildings with 60 stories or more exist [91]. However, the authors think that design and ETABS analysis of buildings with greater than 60 stories would be time-consuming and tedious, as numerous iterations were conducted to obtain the most optimum solution for each concrete-type model. Meanwhile, investigating the seismic response of buildings with fewer than 60 stories may not be sufficient to properly understand the seismic effect on tall buildings, especially in the study region. Hence, 60 stories seemed to be the best and most optimum choice for the seismic analysis of tall buildings. In addition, the common concrete grade used in the design of tall buildings is C60 (60 MPa), especially in the UAE. Therefore, the reference model was chosen with a concrete grade of C60. Moreover, UHPC has a compressive strength of 150 to 220 MPa, which can be practically implemented in the construction industry. Therefore, the authors selected three different values, a lowest (150 MPa), a median (185 MPa), and the highest (220 MPa), to be studied in this research.
The purpose of this research paper was to assess and compare difference in terms of structural performance as well as cost when using high-strength concrete or ultra-high-performance concrete in a 60-story building. First, four buildings with different concrete grades (60, 150, 185, and 220 MPa) were modeled and analyzed using ETABS software [89] to meet the seismic serviceability limits (drift-design) according to the ASCE 7-16 standard [92]. For each model, several runs were performed to optimize the structure in terms of the size of elements. Further, design processes for all structural elements were conducted using ETABS [89] and Quick Concrete Wall (QCW) software [93], following IBC-18 [94] and ACI 318-19 [95]. QCW has been produced by Integrated Engineering Software, Inc., Bozeman. In particular, QCW was used in this study, as it provides more detailed design aspects. The comparison between the four models was discussed and summarized in terms of seismic response and cost-effectiveness to provide valuable recommendations at the end of this study.
According to the formula mentioned in ACI 318-19 [71], section 19.2.2, the concrete elastic modulus was determined and defined in the models considering a concrete unit weight of 2500 kg/m3. The high-strength concrete had a compressive strength equal to 60 MPa and the UHPC had three different compressive strength values; 150 MPa; 185 MPa; and 220 MPa. Practically, some engineers consider 60 MPa as a conventional reinforced concrete compressive strength for tall buildings, while others consider it the strength of high-strength concrete. Meanwhile, concrete is considered UHPC if it has a compressive strength greater than or equal to 150 MPa [96]. Other properties for UHPC and HSC were assumed according to Akhnoukh et al. [97,98,99]. Along with the building’s self-weight, it was also subjected to a superimposed dead load of 42.5 psf [2.036 kN/m2], a live load of 50 psf [2.394 kN/m2], a roof live load of 20 psf [0.958 kN/m2] and wall perimeter (cladding) load of 7.5 psf [0.359 kN/m2]. Other parameters such as the Ss and S1 were set equal to 0.935 and 0.365, respectively. These values were obtained based on the Ss and S
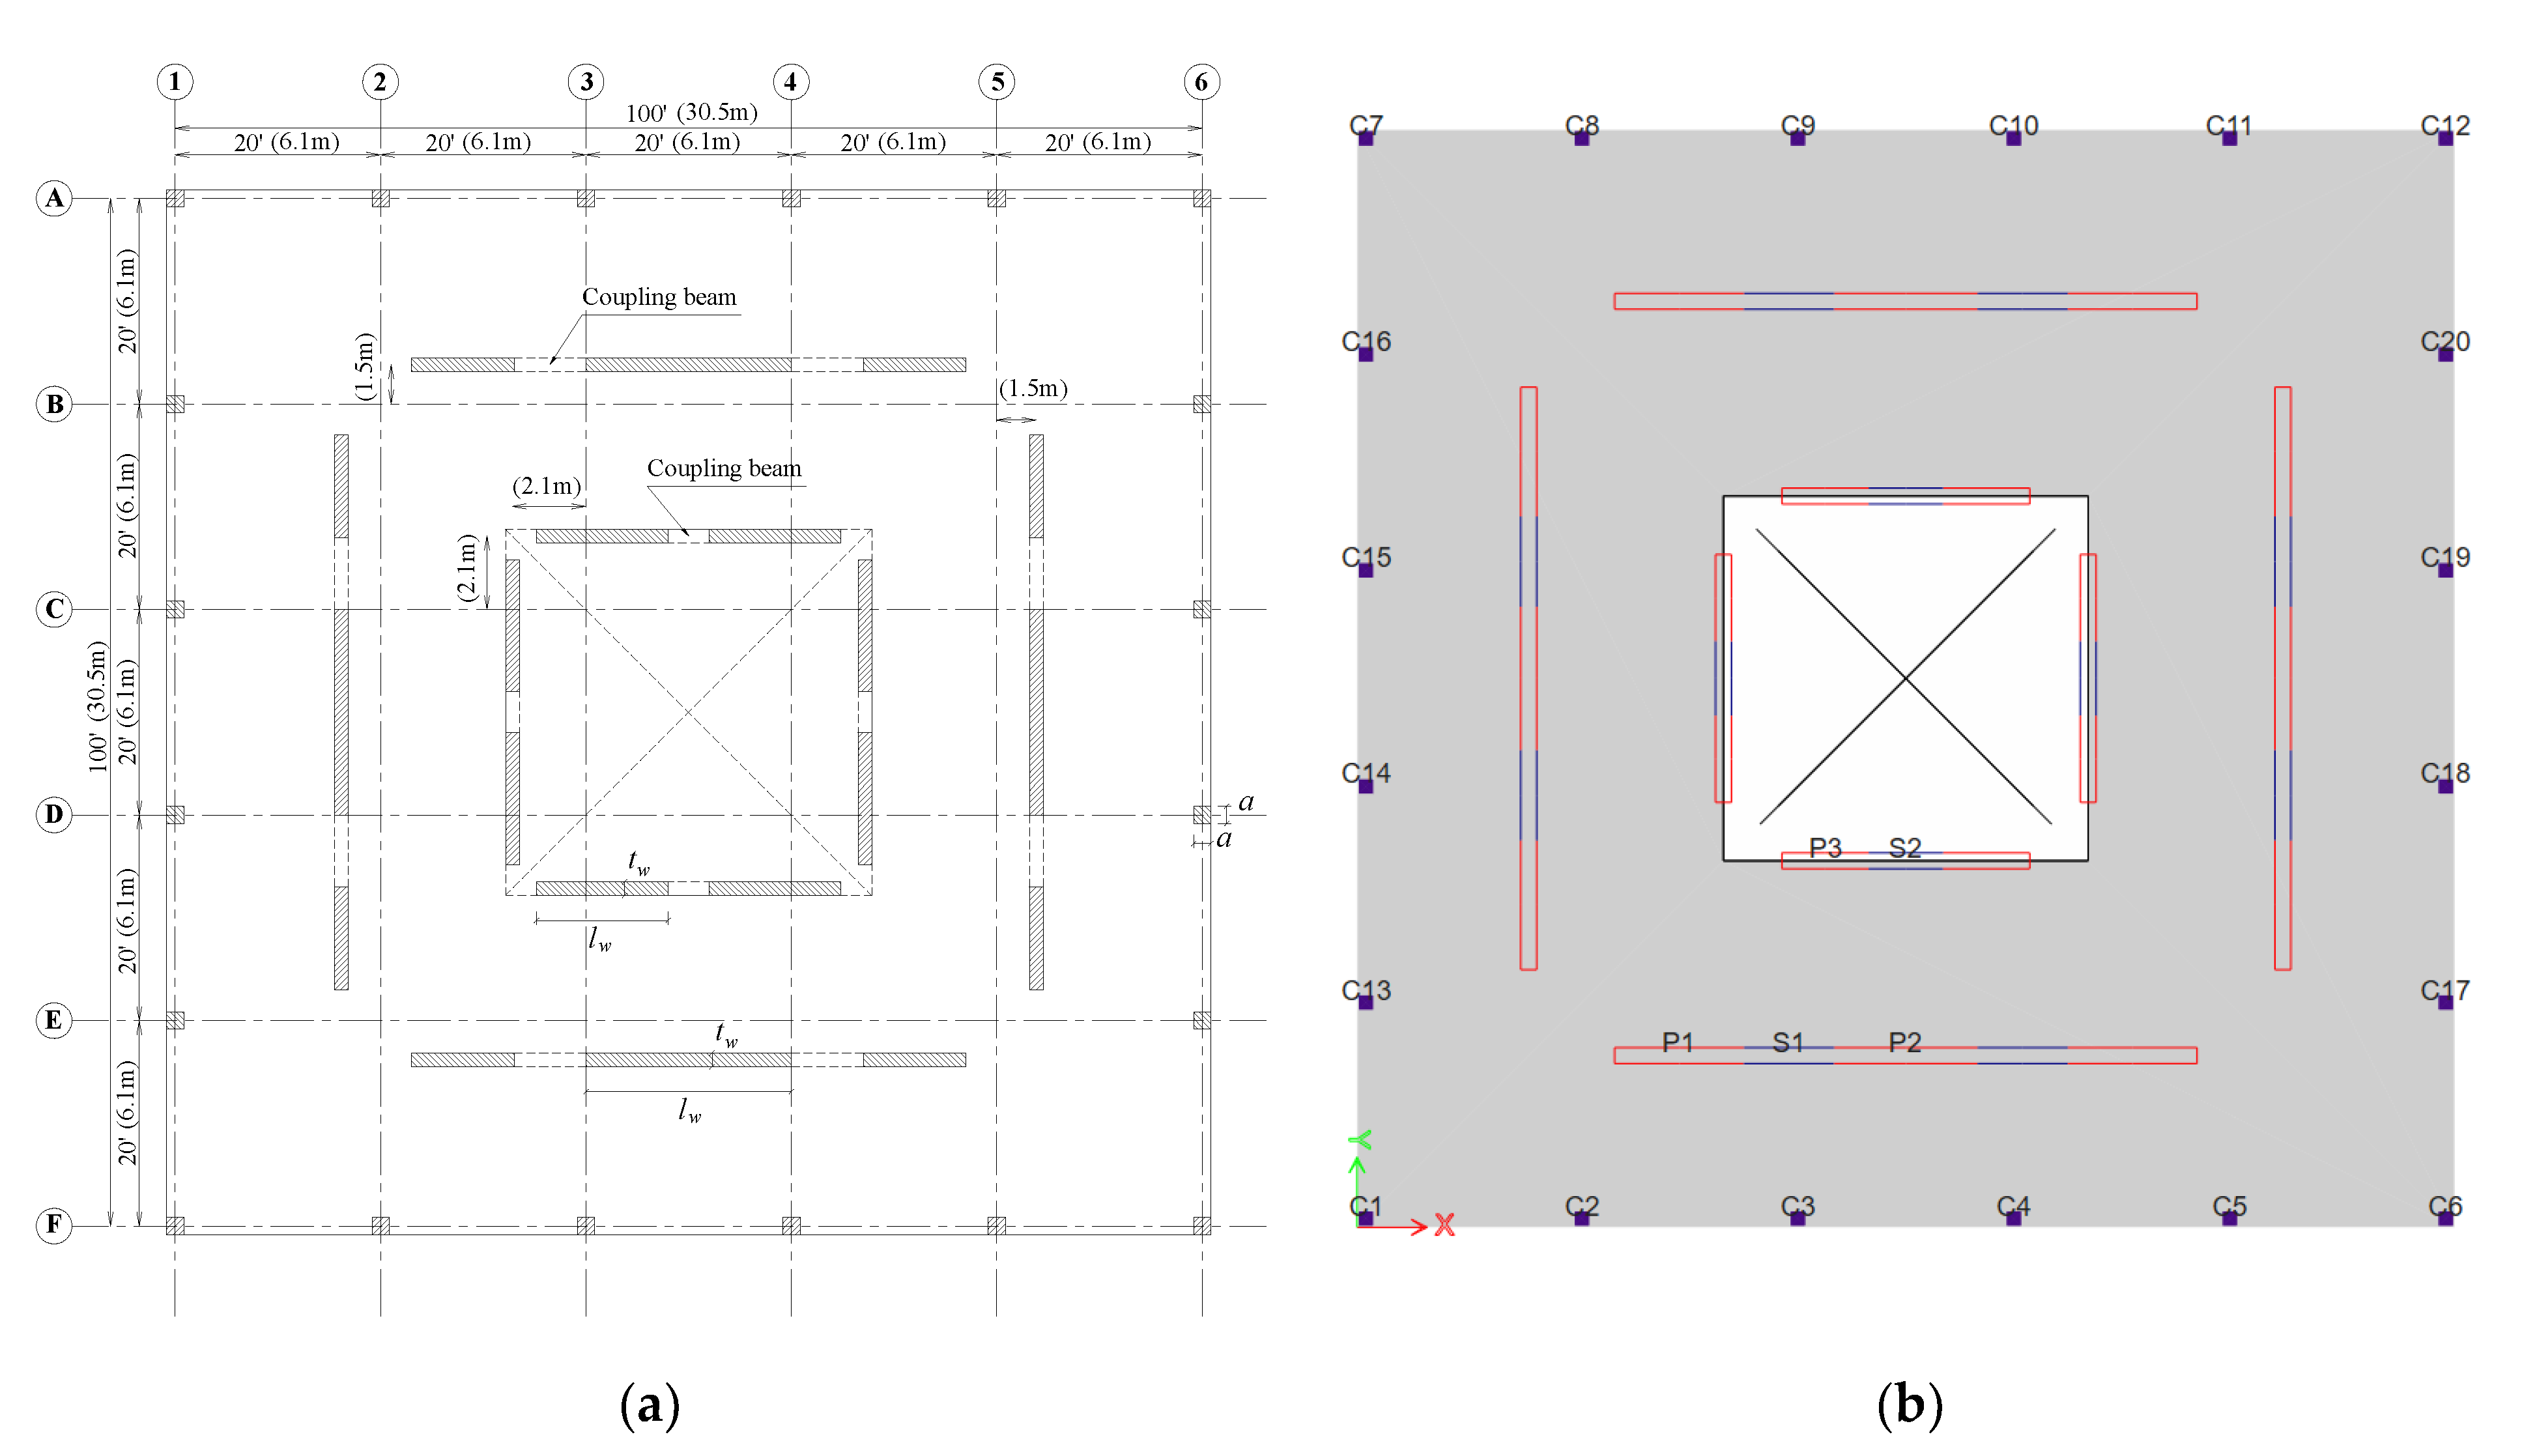
1 values for moderate seismic regions. The long period was set equal to 8 s. The building was designed to meet the seismic requirements of ASCE 7-16 and IBC-18. The layout of each floor of the building being modeled is shown in Figure 1a. The 60-story building was modeled on ETABS with a lateral force resisting system (LFRS) of a special concrete shear wall system coupled with ductile coupling beams. The reason for choosing this LFRS is that it is the most common system used in the United Arab Emirates for tall buildings. The gravity system consisted of flat-plate slabs and square columns. Figure 1b shows the typical plan modeled in ETABS and the labels of structural elements that will be discussed in the coming sections. The structural elements in the model (columns, walls, and coupling beams) were designed and analyzed once with the 60 MPa concrete material and once with UHPC using the ETABS and Quick Concrete Wall software programs. The design process of the columns, piers, and spandrels were carried out every five floors for practical purposes. All structural elements were designed using the load combinations shown in Table 1 according to ACI 318-19 [95]. For vertical (flexural) reinforcement and horizontal (shear) reinforcement, structural steel grades of 460 MPa and 420 MPa, respectively, were used.
Gravity loads such as self-weight, dead, live, and roof live loads were evaluated using the equivalent lateral force (ELF) method. A linear static load case type was used for these loads. For the seismic load, four load cases were produced, namely, seismic load (E), seismic drift (E-Drift), response spectrum without eccentricity (E_RS_X), and response spectrum with eccentricity (E_RS_X-ecc). Seismic load (E) and seismic drift (E-Drift) load cases were analyzed using the equivalent lateral force (ELF) method, while response spectrum without eccentricity (E_RS_X) and response spectrum with eccentricity (E_RS_X-ecc) load cases were evaluated for response spectrum analysis. The main difference between the two response spectrum load cases is that the response spectrum without eccentricity (E_RS_X) has no diaphragm eccentricity, but the response spectrum with eccentricity (E_RS_X-ecc) has a diaphragm eccentricity of 0.05.

3.1. Gravity System

The design of the gravity system included both a slab and columns design. The thickness of slabs was determined based on the applied gravity loads as well as the span between vertical elements. In other words, a serviceability check (deflection and vibration) and strength design were performed to calculate the minimum slab thickness to minimize the building’s weight. The building’s weight significantly affects the seismic analysis, as will be discussed in the coming sections. Thus, a flat plate with a thickness of 0.2 m was selected for all stories. The building was supposed to move laterally under seismic events. Therefore, the gravity system had to be designed to resist this movement without losing its functionality. ASCE 7-16 [92] mentions the importance of achieving the deformation compatibility between all structural elements in the building. Hence, all columns were designed on an additional moment, which was calculated based on the maximum design drift at every five floors of the building. Stiffness modifiers of 0.7 and 0.25 were applied to the columns and slabs of the models as per ACI 318-19 [95] specifications, respectively.

3.2. Lateral Force Resisting System (LFRS)

Special coupled shear walls were used to resist the seismic forces. In ETABS models, all columns were released laterally to consider only the special coupled shear wall in the lateral design. The total dead mass, which includes the self-weight of the entire building and the superimposed loads for finishes, cladding, and brick walls, was used to determine the base shear in ETABS according to ASCE 7-16 [92]. A stiffness modifier of 0.7 was used for the shear walls as per ACI 318-19 [95] specifications. In addition, response spectrum analysis (RSA) was used in the design of the lateral system. The accidental eccentricity of 0.05 was selected according to ASCE 7-16. The scaling factor between the static equivalent force and the response spectrum (RS) force was used to scale the last one up according to ASCE 7-16. Moreover, this standard recommends multiplying the determined scaling factor by (I.g/R), where I is the importance factor, g is the gravity acceleration, and R is the response modification coefficient. Typically, the R value varies between 4.0 and 8.0 [100]. For the moderate seismic region in the UAE, an R-value of 8.0 was considered. According to Ghosh [101], for ductile coupled shear walls, the value of R should be considered as 8.0. For comparison purposes, the value of R was kept constant for both high-strength concrete and UHPC. However, further studies might be conducted to evaluate the validity of this assumption using, for example, nonlinear pushover analysis. Constant seismic parameters were used for high-strength concrete and UHPC models to study the effects of UHPC in detail without the influence of other parameters.

3.2.1. Drift Design

For the drift design, the ETABS software has been used to design the lengths and thicknesses of the shear walls. Several iterations were performed for each model in order to obtain the optimum model in terms of drift-design limits. During these iterations, certain limitations were considered, such as the structure’s natural period being kept in the range of 0.1–0.15 N to prevent the structure from being excessively rigid or flexible. Furthermore, the aspect ratio of the spandrels was kept between 3 to 5. According to Ghosh [
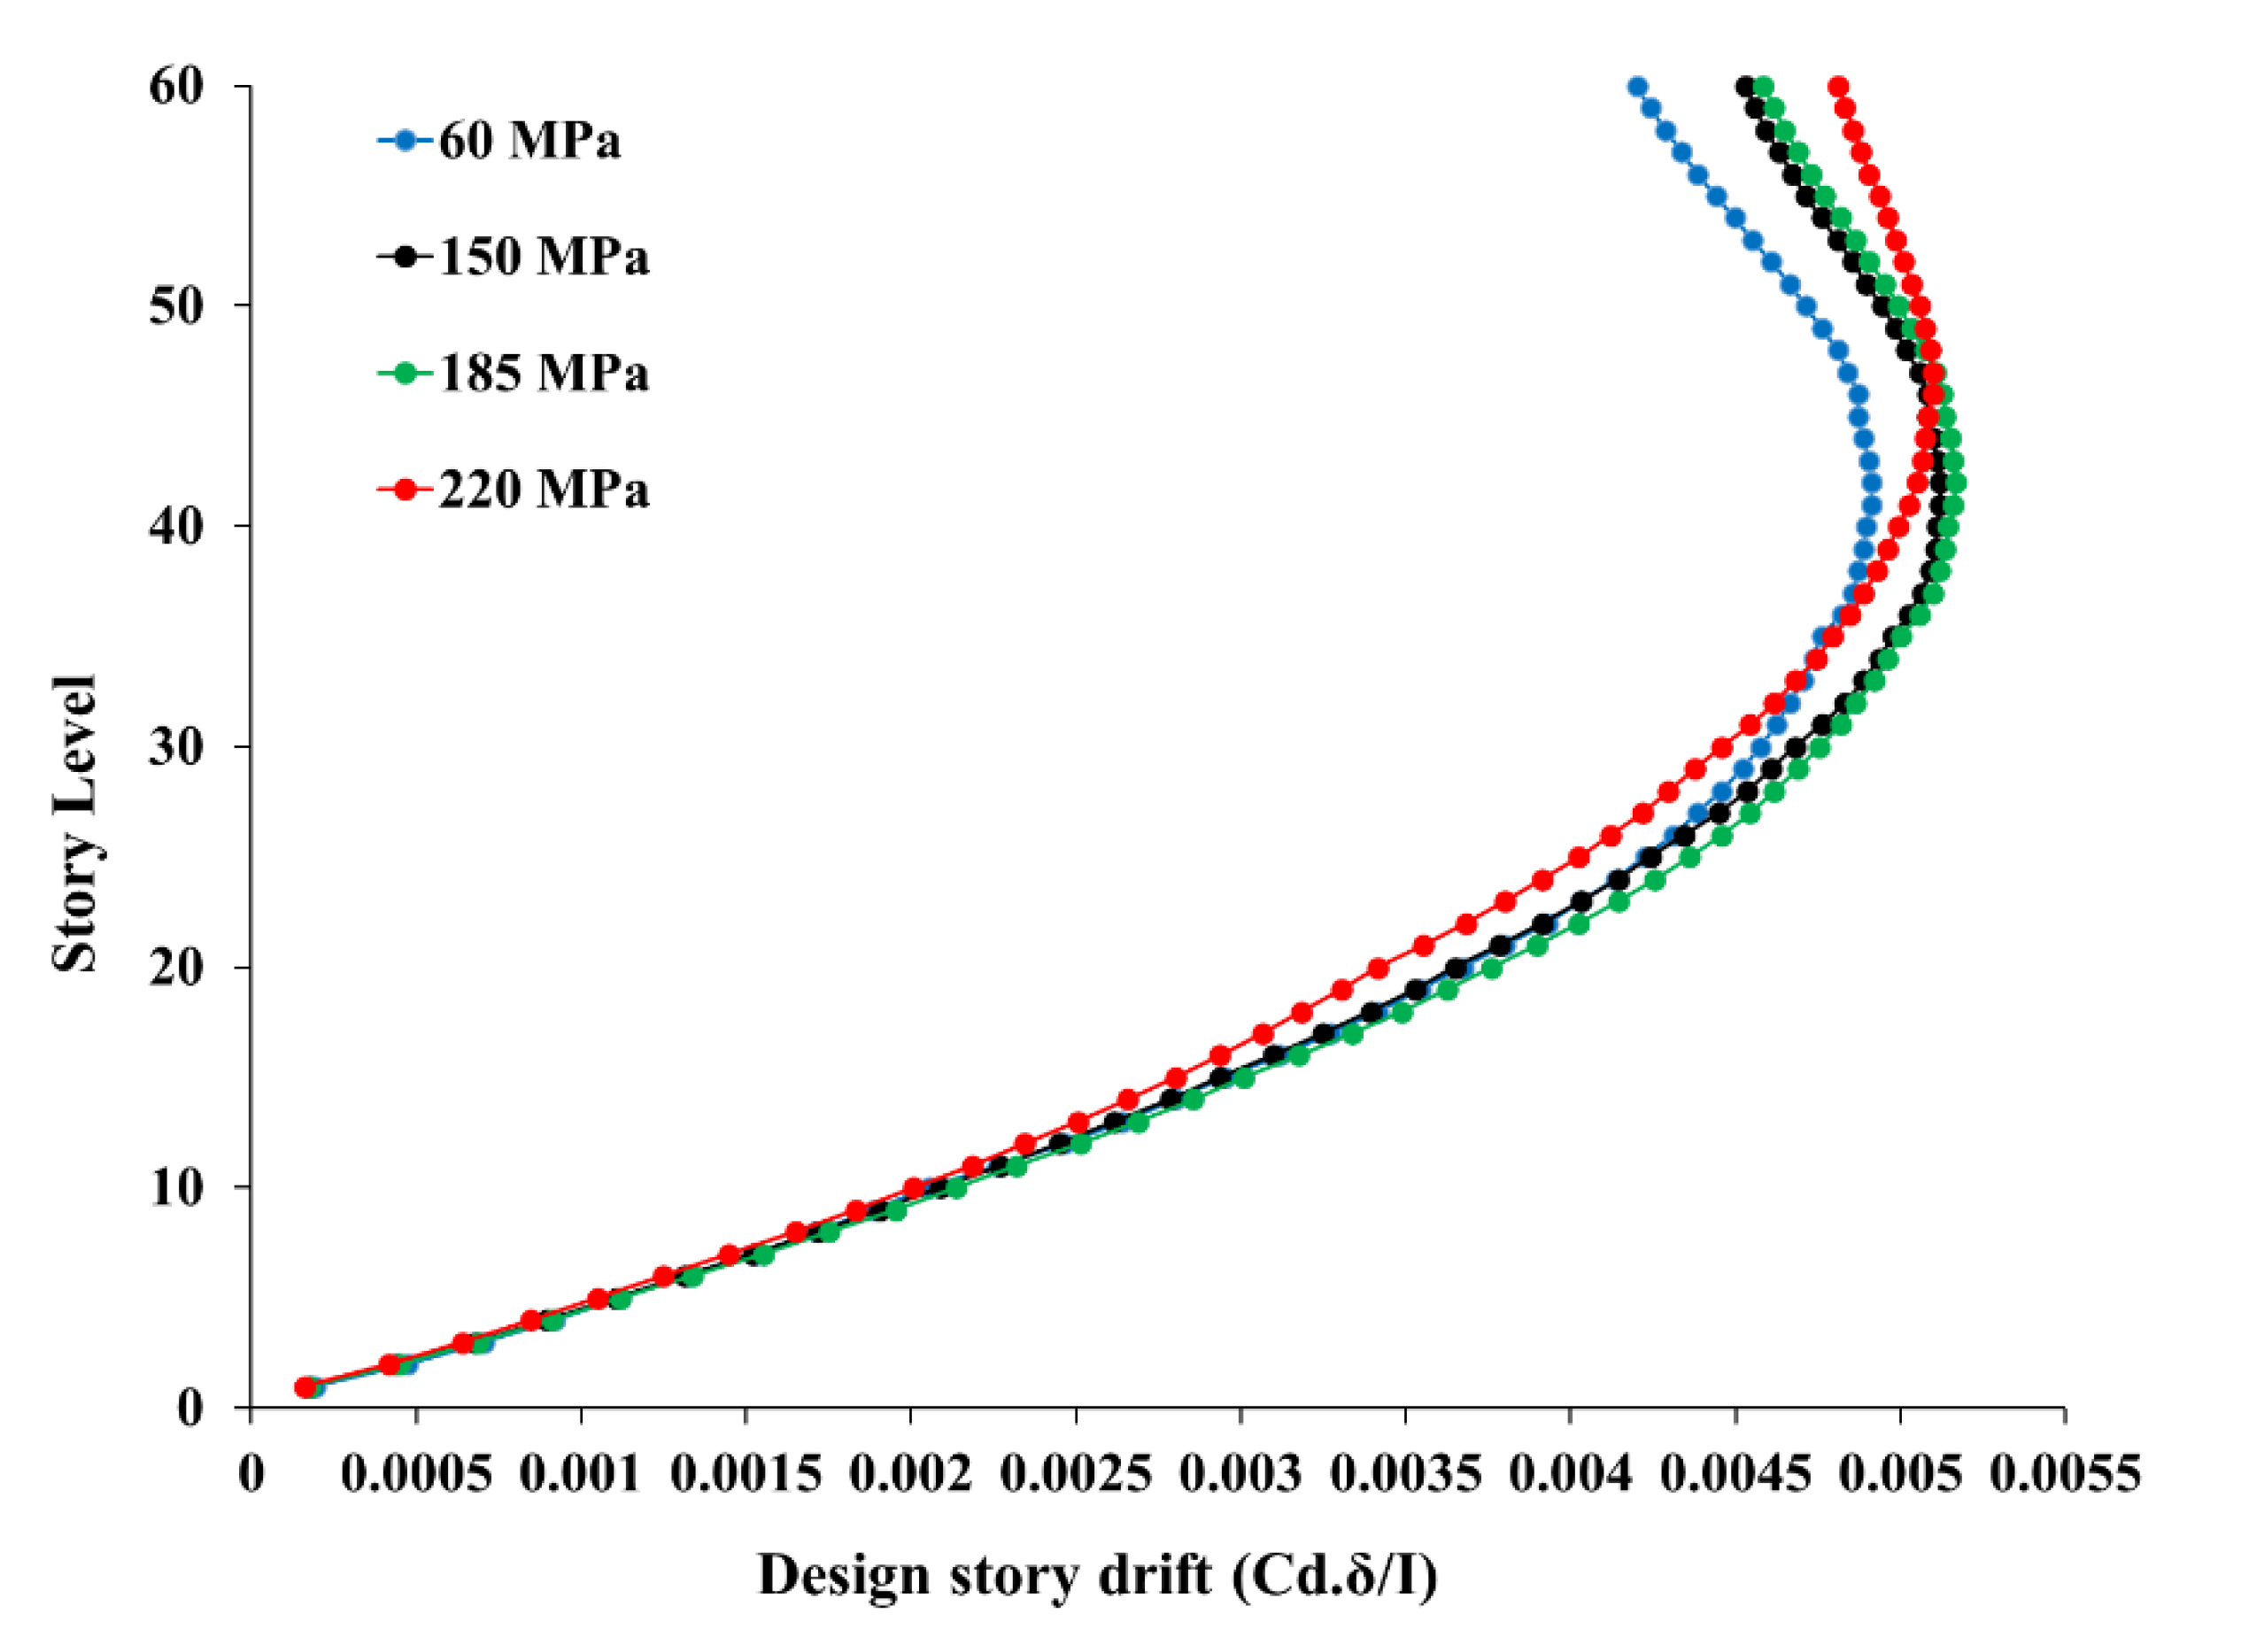
101], maintaining an aspect ratio of 3–5 results in flexural dominant behavior and plastic hinging, which is desirable for coupling beams. The cross-sectional aspect ratio of the walls was kept in the range of 6–12 to prevent unnecessary slenderness complications. In addition, the wall lengths were fixed throughout the height of the building, whereas the thicknesses were varied every five floors. The building was designed to ensure the maximum drift in the stories to be less than 2%, according to ASCE 7-16 [92]. The drift values determined from ETABS are elastic and should be converted to the design story drift by multiplying the elastic values by Cd/I, where Cd is the deflection amplification factor taken as per ASCE 7-16 [92].

3.2.2. Strength Design

Both the ETABS and Quick Concrete Wall (QCW) programs were utilized for the strength design. ETABS was used in the design of the columns, shear walls, and coupling beams. Moreover, QCW was used to review the design of shear walls in addition to calculating the boundary elements requirements according to ACI 318-19 [95]. Due to the symmetrical shape of the building, only three piers (piers 1, 2, and 3), two spandrels (spandrels 1 and 2), and three columns (columns 1, 2, and 3) were designed every five floors. The notations of the piers, spandrels, and columns are depicted in Figure 1b.

4. Results and Discussion

The subsequent sections report the results of this investigation. Furthermore, they provide a detailed comparison of the seismic performances and cost-effectiveness of the high-strength concrete and the UHPC models.

4.1. Seismic Performance

Modal analysis was performed using the Eigen method. Figure 2 demonstrates a sample of the first three modes for the high-strength concrete building (60 MPa). The first and second modes were a combination of translations in the x and y directions. The third mode was the torsional mode. The same behavior was observed in all models. Table 2 shows the results of the first 15 modes for the four buildings. ASCE 7-16 [92] recommends using a number of modes that guarantee including at least 90% of the total mass source of the building. The 90% was achieved at mode #15; hence, there was no need for running more modes. However, 30 modes were selected in the ETABS model for each building to increase the accuracy. Table 3 presents the seismic parameters used for the base shear calculation as per ASCE 7-16 [92]. The standard limits the time period used for strength design to a specific limit. On the other hand, the standard allows using the actual time period calculated based on the modal analysis for the drift check. The two values of time periods are tabulated in Table 3. A summary of the shear wall, boundary elements, coupling beams, and columns designs are tabulated in Table 4, Table 5, Table 6 and Table 7, respectively. Table 4 provides the shear wall length (L), thickness (b), vertical reinforcement ratio ( μ V ), and area of horizontal reinforcement (As,H). It can be noticed that, by increasing the compressive strength of the concrete, most of the cross-sections become smaller. For example, pier P1 at story 1–5 had a length and thickness of 4.55 and 0.65 m, respectively, at 60 MPa concrete strength, but the pier length and thickness reduced to 3.75 and 0.6 m, respectively, at 150 MPa. In addition, the reinforcement ratios also decrease. This reduces the cost of steel reinforcement used in the building and accordingly decreases the amount of work and manpower needed at the construction site. Table 5 summarizes boundary element details such as length (Lbe), thickness (bbe), and horizontal reinforcement in long (As,H,L) and short (As,H,S) directions. The pier boundary element sizes and the horizontal reinforcement in the long direction were observed to have reduced with an increase in concrete compressive strength. As at story 1–5, the length and thicknesses of pier P1 for 60 MPa, 150 MPa, 185 MPa, and 220 MPa were found to be about 2.05 and 1.3 m, 1.6 and 0.6 m, 1 and 0.6 m, and 0.75 and 0.55 m, respectively. However, the horizontal reinforcement in the short direction increased with an increase in concrete strength, but at higher stories, the requirement of boundary elements reduced with higher concrete strengths. Hence, for the overall building, an increase in concrete strength led to a reduction in the boundary element requirements. Moreover, at a higher concrete strength of 220 MPa, the boundary elements were required only for pier P1 at the base stories, while the P2 and P3 piers did not require any boundary elements throughout the building. It shows that using concrete with a higher compressive strength leads to a significant reduction in the boundary element sizes, which, in turn, enhances the functionality of the free space in the building from an architectural perspective. In general, the reduction in the cross-section of the elements reduces the total building weight, decreasing the foundation’s cost. Table 6 presents the spandrel top (As,T), bottom (As,B), vertical (As,V), and horizontal (As,H) reinforcement areas. In general, the reinforcement areas reduced with an increase in concrete compressive strengths, validating the previous pier design and boundary element design results. A reduction in reinforcement ratios were also noticed with an increase in the story levels. This reduction occurred since higher story levels are susceptible to lower loading compared to base stories. Table 7 provides the column dimensions sizes (length, L and thickness, b) and their vertical reinforcement ratios ( μ V ) for all stories and compressive strengths. The column sizes and their reinforcement ratios appear to decrease with an increase in concrete strength from 60 MPa to 150 MPa. Therefore, the results of Table 4, Table 5, Table 6 and Table 7 prove that an increase in concrete strength reduces pier, spandrel, and column sizes and their reinforcement requirements.
Figure 3 shows the design story drift at each story for the buildings. The maximum story drift was around 5% near the 40th story. All buildings exhibit almost the same drift behavior, with a significant reduction in cross-sections as well as reinforcement ratios, which leads to better cost-saving. The story drift values were observed to have increased until story 40, and then a slight reduction in drift was observed beyond the 40th story (as shown in Figure 3). The maximum story drifts of 60 MPa, 150 MPa, 185 MPa, and 220 MPa models were found to be about 4.9%, 5.1%, 5.2% and 5.1%, respectively. Therefore, a slight increase of about 4% and 2% was noticed in the maximum story drifts between the 60 MPa to 150 MPa models and the 150 MPa to 185 MPa models, respectively. This proves that UHPC models with compressive strengths of 150 MPa and 185 MPa are more flexible when compared to the high-strength concrete (60 MPa) model. However, a reduction in maximum story drift of about 2% was observed in reaction to the 220 MPa model compared to 185 MPa, which means that the UHPC 220 MPa model is slightly stiffer than the UHPC 185 MPa model.
The induced overturning moment (OTM) was calculated by multiplying each story force, calculated from ETABS, by the corresponding story height to the foundation level. Figure 4 shows the OTM values for the four models. The 150 MPa and 185 MPa models exhibit lower values of OTM. The reduction of the OTM leads to a cost reduction in the foundation design. Moreover, the resisting moment of all four models was calculated and is reported in Figure 5. The resisting moment was determined by multiplying the total weight of each building, which was used in calculating the OTM, by the resisting moment arm. The resisting moment arm was assumed to equal the half-length of the building in addition to 1.0 m, considering that all buildings have a similar plan-foundation, which in most cases is a square raft over piles that has the same dimensions of the building on plan with a cantilever of 1.0 m each side. Furthermore, the weight of the foundation was considered when calculating the resisting moment and was assumed constant for all models, considering the raft having an approximate depth of 3.5 m. A decrease of less than 5.0% was observed in the UHPC models compared to the high-strength concrete model, and this was because the final weight of the UHPC models was slightly (less than 5.0%) lower than the high-strength concrete model. However, the difference in the weights was not significant enough to decrease the resisting moment of the models. The ratio of the resisting moment over the overturning moment is called the factor of safety. Figure 6 presents the factor of safety of the four models, which are greater than 3.5. Therefore, the models are safe against instability due to overturning.
Figure 7 shows the story shear and story stiffness at each floor of the four buildings. All buildings exhibit very similar values in terms of story shear and stiffness. Both story shear and stiffnesses were reduced with an increase in story levels. Figure 7a clearly shows that at the base story, UHPC 150 MPa, 185 MPa, and 220 MPa have slightly lower shear values in comparison with the high-strength concrete model; this is due to the higher compressive strength of UHPC when compared to high-strength concrete. Story 1 shows cumulative shear values that were observed to have decreased with an increase in concrete strength values (as shown in Figure 7a). Meanwhile, the total stiffness values of story 1 increased with an increase in compressive strengths, except in the case of UHPC 185 MPa, which had a stiffness value nearly the same as the high-strength concrete model (as shown in Figure 7b).

4.2. Cost Analysis

In this section, detailed quantity surveying was conducted. The results are summarized in Table 8. The costs are shown in AED in addition to US dollars (USD) in brackets. The cost for concrete was assumed to be 290 AED/m3 (78.3 USD/m3) and that of UHPC as 550, 600, and 650 AED/m3 (148.5, 162, and 175.5 USD/m3), for 150, 185, and 220 MPa, respectively, based on the UAE market value at the time of the study. In addition, the cost of steel in the UAE market ranges between 2800 and 3000 AED/m3 (756–810 USD/m3). Thus, an average value of 2900 AED/m3 (783 USD/m3) was used in this study. As discussed in El-Tawil et al. [102], UHPC can effectively reduce the dead weight of the structure, as well as indirect costs relating to transportation, manpower, overheads, and formwork costs. The authors of El-Tawil et al.’s paper reported that indirect costs range between 3 and 7 times the direct cost of the reference concrete. The reference concrete refers to the one with the lowest strength value, which in this study is the high-strength concrete. An average value of 5 was considered in this study. Hence, if the cost of the reference concrete is denoted as ‘X’, the additional indirect costs equals 5X. Accordingly, the total cost of each concrete model was equal to 5X in addition to the direct cost obtained for that model. On the other hand, the reduction in indirect costs can be denoted by Z, as proposed by El-Tawil et al. [102]. Moreover, in El-Tawil et al.’s study, the authors recommended values of Z ranging between 10% and 60%, depending on the expected reduction in indirect costs. In this study, reasonable values of Z were proposed and were 40%, 50%, and 60% for the UHPC of 150, 185, and 220 MPa, respectively. These values were chosen considering that higher compressive strengths lead to a higher reductions in indirect costs. The indirect cost of UHPC is calculated as shown in Equation (1):
100 Z 100 × i n d i r e c t   c o s t   o f   c o n v e n t i o n a l   c o n c r e t e = 100 Z 100 × 5 X ,
When substituting the cost of the reference concrete (HSC) in place of X, the indirect costs were evaluated as AED (USD) 11,430,022 (3,111,818), 5,868,620 (1,597,729), 4,708,592 (1,281,912), and 4,273,390 (1,163,428) for the high-strength concrete and UHPC 150, 185, 220 MPa, respectively. The results show that using UHPC can save up to around AED (USD) 5,500,000 (1,497,413) from the indirect cost, as shown in Table 8. In addition, Figure 8 shows the total cost of each building. The total cost of UHPC was determined to be lower than the high-strength concrete model, as shown in Table 8. It is worth mentioning that initial construction and curing costs were also considered in the indirect costs, so even with the inclusion of all indirect costs, the UHPC models were found to be relatively less expensive. In general, increasing the strength of the concrete results in more compact cross sections in reinforced concrete structural members. This produces a smaller volume of concrete. Table 8 also shows that the concrete volume follows this trend except for when increasing from 185 to 220 MPa, which results in a higher concrete volume in comparison to 185 MPa. This is attributed to the larger dimensions of P3 in this model compared to other models. This is a clear indication that when using the 220 UHPC, the drift limit states govern the strength limit states (the shear wall design is controlled by the drift rather than the strength). As such, the shear walls sizes are increased to satisfy the drift limitations and thus cause a greater volume of concrete when compared to 185 MPa.
This proves that the model used for UHPC 220 MPa may not be the most optimum design and further modeling could be performed in order to achieve a more efficient and optimum design for UHPC 220 MPa. However, since the total cost of the UHPC 220 MPa model is lower than the high-strength concrete model and the UHPC 150 MPa model, the UHPC 220 MPa design is in fact not overly inefficient and can be used for the analysis of this study. A significant reduction in total cost in AED and USD can be noticed clearly in Figure 8. A reduction in the total cost of 25%, 31%, and 26% can be achieved by using UHPC of 150, 185, and 220 MPa, respectively, rather than high-strength concrete.

5. Conclusions

In this paper, four models for a 60-story building were developed to quantify the effect of using UHPC as a replacement for high-strength concrete. The modal analysis results and the design summary of the columns and the special concrete coupled shear walls were presented and discussed. The main findings of this study are summarized as follows:
  • All buildings exhibited a similar seismic response but with smaller structural elements in UHPC buildings.
  • A reduction in the dead weight of the building was observed, in addition to a lower value for overturning moments, for the UHPC building compared to the high-strength concrete building, which results to cost-saving in the design of the foundation.
  • The results showed that by increasing the strength of concrete from high-strength concrete of 60 MPa to the UHPC of 150, 185, and 220 MPa, the total initial costs were reduced by 25%, 31%, and 26%, respectively.
  • In terms of seismic performance and cost analysis, the best results were observed when using the UHPC of 185 MPa. Therefore, this study recommends using the UHPC in tall buildings instead of high-strength concrete.
  • The reduction in the cost can be attributed to the decrease in the dead load of the structure, the smaller sizes of the required structural elements for lateral load resistance (ductile coupled shear walls), and lower manpower transportation costs.
  • Future nonlinear analysis (e.g., pushover) is highly recommended to validate the assumed parameters (such as the response modification coefficient; R) for UHPC tall buildings.

Author Contributions

Conceptualization, M.A. and M.E.; methodology, M.A. and M.E.; software, M.A. and M.E.; validation, M.A. and M.E.; formal analysis, M.A. and M.E.; investigation, M.A., M.E. and S.B.; resources, M.A. and M.E.; data curation, M.E. and S.B.; writing—original draft preparation, M.E. and S.B.; writing—review and editing, M.A.; visualization, M.A. and M.E.; supervision, M.A.; project administration, M.A. and M.E.; funding acquisition, M.A. All authors have read and agreed to the published version of the manuscript.

Funding

This research was financially supported by the American University of Sharjah (AUS) through the Faculty Research Grant program (FRG20-M-E152), the Open Access Program (OAP22-CEN-089), and the College of Engineering Faculty Professional Development (CEN-FPD) program.

Institutional Review Board Statement

Not applicable.

Informed Consent Statement

Not applicable.

Acknowledgments

The authors would like to thank Zin Mahaini, Zeinah Elnassar, and Mennaallah ElGharib for their contributions during the initial stages of this study. This research was financially supported by the American University of Sharjah (AUS) through the Faculty Research Grant program (FRG20-M-E152), the Open Access Program (OAP22-CEN-089), and the College of Engineering Faculty Professional Devlopment (CEN-FPD) program. The authors greatly appreciate this financial support. This paper represents the opinions of the authors and does not intend to represent the position or opinions of the AUS.

Conflicts of Interest

The authors declare no conflict of interest.

References

  1. Mahmoud, S. Horizontally connected high-rise buildings under earthquake loadings. Ain Shams Eng. J. 2019, 10, 227–241. [Google Scholar] [CrossRef]
  2. Mwafy, A.; Khalifa, S. Effect of vertical structural irregularity on seismic design of tall buildings. Struct. Des. Tall Spec. Build. 2017, 26, e1399. [Google Scholar] [CrossRef]
  3. Özuygur, A.R. Performance-based seismic design of an irregular tall building in Istanbul. Struct. Des. Tall Spec. Build. 2015, 24, 703–723. [Google Scholar] [CrossRef]
  4. Değer, Z.T.; Yang, T.Y.; Wallace, J.W.; Moehle, J. Seismic performance of reinforced concrete core wall buildings with and without moment resisting frames. Struct. Des. Tall Spec. Build. 2015, 24, 477–490. [Google Scholar] [CrossRef]
  5. Ghodsi, T.; Ruiz, J.A.F. Pacific earthquake engineering research/seismic safety commission tall building design case study 2. Struct. Des. Tall Spec. Build. 2010, 19, 197–256. [Google Scholar] [CrossRef]
  6. Jeong, S.Y.; Kang, T.H.K.; Yoon, J.K.; Klemencic, R. Seismic performance evaluation of a tall building: Practical modeling of surrounding basement structures. J. Build. Eng. 2020, 31, 101–420. [Google Scholar] [CrossRef]
  7. Wang, B.; Zhu, S. Cyclic behavior of iron-based shape memory alloy bars for high-performance seismic devices. Eng. Struct. 2022, 252, 113588. [Google Scholar] [CrossRef]
  8. Rosa, D.I.H.; Hartloper, A.; de Castro e Sousa, A.; Lignos, D.G.; Motavalli, M.; Ghafoori, E. Experimental behavior of iron-based shape memory alloys under cyclic loading histories. Constr. Build. Mater. 2021, 272, 121712. [Google Scholar] [CrossRef]
  9. Raza, S.; Michels, J.; Shahverdi, M. Uniaxial behavior of pre-stressed iron-based shape memory alloy rebars under cyclic loading reversals. Constr. Build. Mater. 2022, 326, 126900. [Google Scholar] [CrossRef]
  10. Elkafrawy, M.E.; Khalil, A.M.; Abuzaid, W.; Hawileh, R.A.; Alhamaydeh, M. Nonlinear Finite Element Analysis (NLFEA) of Pre- stressed RC Beams Reinforced with Iron-Based Shape Memory Alloy (Fe-SMA). In Proceedings of the 4th International Multiconferences in Advance in Science and Engineering Technology (ASET 2022), Dubai, United Arab Emirates, 21–24 February 2022; IEEE: Piscataway, NJ, USA, 2022. [Google Scholar]
  11. Babalola, O.E.; Awoyera, P.O.; Le, D.H.; Bendezú Romero, L.M. A review of residual strength properties of normal and high strength concrete exposed to elevated temperatures: Impact of materials modification on behaviour of concrete composite. Constr. Build. Mater. 2021, 296, 123448. [Google Scholar] [CrossRef]
  12. Kodur, V.K.R.; Raut, N.K.; Mao, X.Y.; Khaliq, W. Simplified approach for evaluating residual strength of fire-exposed reinforced concrete columns. Mater. Struct. Constr. 2013, 46, 2059–2075. [Google Scholar] [CrossRef]
  13. Ni, S.; Gernay, T. Predicting residual deformations in a reinforced concrete building structure after a fire event. Eng. Struct. 2020, 202, 109853. [Google Scholar] [CrossRef]
  14. Arora, A.; Almujaddidi, A.; Kianmofrad, F.; Mobasher, B.; Neithalath, N. Material Design of Economical Ultra-High Performance Concrete (UHPC) and Evaluation of Their Properties; Elsevier: Amsterdam, The Netherlands, 2019; Volume 104, ISBN 0014809656023. [Google Scholar]
  15. Wang, C.; Yang, C.; Liu, F.; Wan, C.; Pu, X. Preparation of Ultra-High Performance Concrete with common technology and materials. Cem. Concr. Compos. 2012, 34, 538–544. [Google Scholar] [CrossRef]
  16. Graybeal, B. Ultra-High Performance Concrete. FHWA Publication No: FHWA-HRT-11-038; U.S. Department of Transportation Federal Highway Administration: McLean, VA, USA, 2011. [Google Scholar]
  17. Wille, K.; Boisvert-Cotulio, C. Material efficiency in the design of ultra-high performance concrete. Constr. Build. Mater. 2015, 86, 33–43. [Google Scholar] [CrossRef]
  18. Russell, H.G.; Graybeal, B.A. Ultra-High Performance Concrete: A State-of-the-Art Report for the Bridge Community; U.S. Department of Transportation Federal Highway Administration: McLean, VA, USA, 2013. [Google Scholar]
  19. Vitek, J.L.; Coufal, R.; Čítek, D. UHPC—Development and Testing on Structural Elements. Procedia Eng. 2013, 65, 218–223. [Google Scholar] [CrossRef] [Green Version]
  20. Maya, L.F.; Graybeal, B. Experimental study of strand splice connections in UHPC for continuous precast prestressed concrete bridges. Eng. Struct. 2017, 133, 81–90. [Google Scholar] [CrossRef]
  21. Brühwiler, E.; Denarié, E. Rehabilitation and strengthening of concrete structures using ultra-high performance fibre reinforced concrete. Struct. Eng. Int. 2013, 23, 450–457. [Google Scholar] [CrossRef]
  22. Tazarv, M.; Saiidi, M.S. UHPC-filled duct connections for accelerated bridge construction of RC columns in high seismic zones. Eng. Struct. 2015, 99, 413–422. [Google Scholar] [CrossRef]
  23. Azizinamini, A.; Rehmat, S.; Sadeghnejad, A. Enhancing Resiliency and Delivery of Bridge Elements using Ultra-High Performance Concrete as Formwork. Transp. Res. Rec. 2019, 2673, 443–453. [Google Scholar] [CrossRef]
  24. Caluk, N.; Mantawy, I.; Azizinamini, A. Durable Bridge Columns using Stay-In-Place UHPC Shells for Accelerated Bridge Construction. Infrastructures 2019, 4, 25. [Google Scholar] [CrossRef] [Green Version]
  25. Graybeal, B.A. Behavior of Ultra-High Performance Concrete Connections Between Precast Bridge Deck Elements. In Proceedings of the 2010 Concrete Bridge Conference: Achieving Safe, Smart & Sustainable Bridges, Phoenix, AZ, USA, 24–26 February 2010; Volume 24, pp. 1–13. [Google Scholar]
  26. Valikhani, A.; Jahromi, A.J.; Mantawy, I.M.; Azizinamini, A. Experimental evaluation of concrete-to-UHPC bond strength with correlation to surface roughness for repair application. Constr. Build. Mater. 2020, 238, 117753. [Google Scholar] [CrossRef]
  27. Richard, P.; Cheyrezy, M. Composition of Reactive Powder Concretes. Cem. Concr. Res. 1995, 25, 1501–1511. [Google Scholar] [CrossRef]
  28. Graybeal, B.A. Material Property Characterization of Ultra-High Performance Concrete; U.S. Department of Transportation Federal Highway Administration: McLean, VA, USA, 2006. [Google Scholar]
  29. Zhang, J.; Zhao, Y.; Li, H. Experimental Investigation and Prediction of Compressive Strength of Ultra-High Performance Concrete Containing Supplementary Cementitious Materials. Adv. Mater. Sci. Eng. 2017, 2017, 4563164. [Google Scholar] [CrossRef] [Green Version]
  30. Liu, K.; Wu, C.; Li, X.; Tao, M.; Li, J.; Liu, J.; Xu, S. Fire damaged ultra-high performance concrete (UHPC) under coupled axial static and impact loading. Cem. Concr. Compos. 2022, 126, 104340. [Google Scholar] [CrossRef]
  31. Cheng, M.Y.; Fikri, R.; Chen, C.C. Experimental study of reinforced concrete and hybrid coupled shear wall systems. Eng. Struct. 2015, 82, 214–225. [Google Scholar] [CrossRef]
  32. Harries, K.A.; Mitchell, D.; Cook, W.D.; Redwood, R.G. Seismic Response of Steel Beams Coupling Concrete Walls. J. Struct. Eng. 1993, 119, 3611–3629. [Google Scholar] [CrossRef] [Green Version]
  33. AlHamaydeh, M.; Orabi, M.A. Experimental quantification of punching shear capacity for large-scale GFRP-reinforced flat slabs made of synthetic fiber-reinforced self-compacting concrete dataset. Data Br. 2021, 37, 107196. [Google Scholar] [CrossRef]
  34. AlHamaydeh, M.; Orabi, M.A.; Ahmed, M.; Mohamed, S.; Jabr, A.; Al Hariri, M.K. Punching Shear Capacity of Macro Synthetic Fiber-Reinforced Concrete Two-Way Slabs with GFRP Rebars. In Proceedings of the 11th International Conference on Composite Science & Technology (ICCST-11), American University of Sharjah, Sharjah, United Arab Emirates, 4–6 April 2017. [Google Scholar]
  35. Tiberti, G.; Trabucchi, I.; AlHamaydeh, M.; Minelli, F.; Plizzari, G.A. Crack development in steel-fibre-reinforced concrete members with conventional rebars. Mag. Concr. Res. 2019, 71, 599–610. [Google Scholar] [CrossRef]
  36. Yehia, S.; AlHamaydeh, M.; El Kalie, S.; Ibrahim, Y. Recommended Concrete Properties for High Strength Steel Reinforcement—Overview. In Proceedings of the Central European Congress on Concrete Engineering (CCC 2011), Balatonfüred, Hungary, 22–23 September 2011; pp. 1–4. [Google Scholar]
  37. Yehia, S.; AlHamaydeh, M.; Farrag, S. High Strength Lightweight SCC Matrix with Partial Normal Weight Coarse Aggregate Replacement : Strength and Durability Evaluations. J. Mater. Civ. Eng. ASCE 2014, 26, 4014086. [Google Scholar] [CrossRef]
  38. Yehia, S.; AlHamaydeh, M.; Al Ali, H.; Al Jarwan, M.; Al-Khanchi, Y. Effect of Aggregate Source on the Development of High Strength Lightweight SCC Matrix. In Proceedings of the 7th International Conference on Material Sciences (CSM7), Beirut, Lebanon, 20–22 May 2010. [Google Scholar]
  39. Abdalla, S.; Abed, F.; AlHamaydeh, M. Behavior of CFSTs and CCFSTs under Quasi-Static Axial Compression. J. Constr. Steel Res. 2013, 90, 235–244. [Google Scholar] [CrossRef]
  40. Tiberti, G.; Trabucchi, I.; AlHamaydeh, M.; Minelli, F.; Plizzari, G. Crack Control in Concrete Members Reinforced by Conventional Rebars and Steel Fibers. In IOP Conference Series: Materials Science and Engineering; IOP Publishing: Bristol, UK, 2017. [Google Scholar] [CrossRef]
  41. Yehia, S.; AlHamaydeh, M.; Al-Khanchi, Y.; Ghonima, O. Investigation of Utilizing Lightweight Fine Aggregate on the Development of SCC Matrix. In Proceedings of the 7th International Conference on Material Sciences (CSM7), Beirut, Lebanon, 20–22 May 2010. [Google Scholar]
  42. AlHamaydeh, M.; Jarallah, H.; Ahmed, M. Punching Shear Capacity of Two-Way Slabs Made with Macro Synthetic Fiber-Reinforced Concrete. In Proceedings of the 11th International Conference on Composite Science and Technology (ICCST-11), American University of Sharjah, Sharjah, United Arab Emirates, 4–6 April 2017. [Google Scholar]
  43. AlHamaydeh, M.; Anwar Orabi, M. Punching Shear Behavior of Synthetic Fiber-Reinforced Self-Consolidating Concrete Flat Slabs with GFRP Bars. J. Compos. Constr. 2021, 25, 4021029. [Google Scholar] [CrossRef]
  44. Yehia, S.; Alhamaydeh, M.; Abed, F.; Rabie, M.; Resheidat, S.; El-Kalie, S.; Abudagga, M. Evaluation of Concrete Properties for High Strength Steel Applications. IABSE Symp. Rep. 2013, 99, 1083–1090. [Google Scholar] [CrossRef]
  45. AlHamaydeh, M.; Amin, F. Strength Curves of Slender Geopolymer Concrete Columns_Dataset. Zenodo 2021. [Google Scholar] [CrossRef]
  46. AlHamaydeh, M.; Afghan, F.; Mithani, R.; Besiso, T.; Al Salim, H. Shear Strength of Circular Beams Made of Geopolymer Concrete and Reinforced with GFRP Rebars. In AIP Conference Proceedings; AIP Publishing LLC: Melville, NY, USA, 2020. [Google Scholar] [CrossRef]
  47. AlHamaydeh, M.; Amin, F. Interaction Diagrams of Geopolymer FRC Slender Columns with Double-Layer Reinforcement_Dataset V1. Zenodo 2021. [Google Scholar] [CrossRef]
  48. AlHamaydeh, M.; Markou, G.; Saadi, D. Nonlinear FEA of Soil-Structure-Interaction Effects on RC Shear Wall Structures. Eccomas Proceedia COMPDYN 2017, 3476–3490. [Google Scholar] [CrossRef] [Green Version]
  49. Markou, G.; Alhamaydeh, M. 3D finite element modeling of GFRP-reinforced concrete deep beams without shear reinforcement. Int. J. Comput. Methods 2018, 15, 1850001. [Google Scholar] [CrossRef]
  50. Yehia, S.; AlHamaydeh, M.; Alhajri, R.; Abdelsalam, A.; Farid, A. Steel Fiber SCC High Strength Lightweight Concrete with Local Available Materials. In Proceedings of the Central European Congress on Concrete Engineering (CCC 2011), Balatonfüred, Hungary, 22–23 September 2011; pp. 1–4. [Google Scholar]
  51. Yehia, S.; Alhamaydeh, M.; Alhajri, R.; Abdelsalam, A. Development and Evaluation of Self-Consolidated High Strength Lightweight Steel Fiber Concrete in UAE. In Proceedings of the IABSE Symposium Report, Rotterdam, The Netherlands, 6–8 May 2013; Volume 99, pp. 1068–1074. [Google Scholar]
  52. Markou, G.; AlHamaydeh, M.; Saadi, D. Effects of the Soil-Structure-Interaction Phenomenon on RC Structures with Pile Foundations. In Proceedings of the 9th GRACM International Congress on Computational Mechanics, Chania, Greece, 4–6 June 2018. [Google Scholar]
  53. Abed, F.; El-Chabib, H.; AlHamaydeh, M. Shear characteristics of GFRP-reinforced concrete deep beams without web reinforcement. J. Reinf. Plast. Compos. 2012, 31, 1063–1073. [Google Scholar] [CrossRef]
  54. Abed, F.; AlHamaydeh, M.; Abdalla, S. Experimental and numerical investigations of the compressive behavior of concrete filled steel tubes (CFSTs). J. Constr. Steel Res. 2013, 80, 429–439. [Google Scholar] [CrossRef]
  55. AlHamaydeh, M.; Abdalla, J.; Abdalla, S.; Al-Rahmani, A.; Mostafa, A. Inelastic Seismic Demands For Reinforced Concrete Frames In Dubai. In Proceedings of the 14th European Earthquake Engineering Conference (14EEEC), Ohrid, Macedonia, 30 August–3 September 2010. [Google Scholar]
  56. AlHamaydeh, M.; Hussain, S. Innovative Design of a Seismically-Isolated Building with Supplemental Damping. In Proceedings of the 14th European Conference on Earthquake Engineering (ECEE’10), Ohrid, Macedonia, 30 August–3 September 2010. [Google Scholar]
  57. AlHamaydeh, M.; Galal, K.; Yehia, S. Impact of Lateral Force-Resisting System and Design/Construction Practices on Seismic Performance and Cost of Tall Buildings in Dubai, UAE. Earthq. Eng. Eng. Vib. J. 2013, 12, 385–397. [Google Scholar] [CrossRef]
  58. AlHamaydeh, M.; Yehia, S.; Aly, N.; Douba, A.; Hamzeh, L. Design Alternatives for Lateral Force-Resisting Systems of Tall Buildings in Dubai, UAE. Int. J. Civ. Environ. Eng. 2012, 6, 185–188. [Google Scholar]
  59. AlHamaydeh, M.; Abdullah, S.; Hamid, A.; Mustapha, A. Seismic design factors for RC special moment resisting frames in Dubai, UAE. Earthq. Eng. Eng. Vib. 2011, 10, 495–506. [Google Scholar] [CrossRef]
  60. AlHamaydeh, M.; Aly, N.; Galal, K. Effect of Diverse Seismic Hazard Estimates on Design and Performance of RC Shear Wall Buildings in Dubai, UAE. In Proceedings of the 2015 World Congress on Advances in Structural Engineering and Mechanics (ASEM15), Incheon, Korea, 25–29 August 2015. [Google Scholar]
  61. AlHamaydeh, M.; Aly, N.; Galal, K. Seismic Response and Life-Cycle Cost of Reinforced Concrete Special Structural Wall Buildings in Dubai, UAE. Struct. Concr. 2018, 19, 771–782. [Google Scholar] [CrossRef]
  62. Aly, N.; AlHamaydeh, M.; Galal, K. Quantification of the Impact of Detailing on the Performance and Cost of RC Shear Wall Buildings in Regions with High Uncertainty in Seismicity Hazards. J. Earthq. Eng. 2020, 24, 421–446. [Google Scholar] [CrossRef]
  63. Hussain, S.; AlHamaydeh, M.; Aly, N. Jakarta’s First Seismic-Isolated Building—A 25 Story Tower. In Proceedings of the 15th World Conference on Earthquake Engineering (15 WCEE), Lisbon, Portugal, 24–28 September 2012. [Google Scholar]
  64. AlHamaydeh, M.; Hussain, S.; Tasbihgoo, F. Design of a High-Rise Building Utilizing Supplemental Damping. In Proceedings of the 14th European Earthquake Engineering Conference (14EEEC), Ohrid, Macedonia, 30 August–3 September 2010. [Google Scholar]
  65. AlHamaydeh, M.; Aly, N.; Galal, K. Impact of Seismicity on Performance and Cost of RC Shear Wall Buildings in Dubai, United Arab Emirates. ASCE J. Perform. Constr. Facil. 2017, 31, 4017083. [Google Scholar] [CrossRef]
  66. AlHamaydeh, M.; Amin, F. Data for Interaction Diagrams of Geopolymer FRC Slender Columns with Double-Layer GFRP and Steel Reinforcement. Data 2021, 6, 43. [Google Scholar] [CrossRef]
  67. AlHamaydeh, M.; Amin, F. Strength Curve Data for Slender Geopolymer Concrete Columns with GFRP, Steel and Hybrid Reinforcement. Data Br. 2021, 39, 107589. [Google Scholar] [CrossRef]
  68. Alhamaydeh, M.; Elkafrawy, M.E.; Kyaure, M.; Elyas, M.; Uwais, F. Cost Effectiveness of UHPC Ductile Coupled Shear Walls for High-Rise Buildings in UAE Subjected to Seismic Loading. In Proceedings of the 4th International Multiconferences in Advance in Science and Engineering Technology (ASET 2022), Dubai, United Arab Emirates, 21–24 February 2022; IEEE: Piscataway, NJ, USA, 2022. [Google Scholar]
  69. Alhamaydeh, M.; Elkafrawy, M.E.; Amin, F.M.; Maky, A.M.; Mahmoudi, F. Analysis and Design of UHPC Tall Buildings in UAE with Ductile Coupled Shear Walls Lateral Load Resisting System. In Proceedings of the 4th International Multiconferences in Advance in Science and Engineering Technology (ASET 2022), Dubai, United Arab Emirates, 21–24 February 2022; IEEE: Piscataway, NJ, USA, 2022. [Google Scholar]
  70. Alhamaydeh, M.; Elkafrawy, M.E.; Aswad, N.G.; Talo, R.; Banu, S. Evaluation of UHPC Tall Buildings in UAE with Ductile Coupled Shear Walls under Seismic Loading. In Proceedings of the 4th International Multiconferences in Advance in Science and Engineering Technology (ASET 2022), Dubai, United Arab Emirates, 21–24 February 2022; IEEE: Piscataway, NJ, USA, 2022. [Google Scholar]
  71. Barnett, S.J.; Lataste, J.F.; Parry, T.; Millard, S.G.; Soutsos, M.N. Assessment of fibre orientation in ultra high performance fibre reinforced concrete and its effect on flexural strength. Mater. Struct. 2010, 43, 1009–1023. [Google Scholar] [CrossRef]
  72. Graybeal, B.A. Compressive Behavior of Ultra-High-Performance Fiber-Reinforced Concrete. ACI Mater. J. 2007, 104, 146–152. [Google Scholar]
  73. Wille, K.; Naaman, A.E.; Parra-Montesinos, G.J. Ultra-High Performance Concrete with compressive strength exceeding 150 MPa (22 ksi): A simpler way. ACI Mater. J. 2011, 108, 46–54. [Google Scholar] [CrossRef]
  74. Khalil, A.E.-H.; Etman, E.; Atta, A.; Essam, M. Behavior of RC beams strengthened with strain hardening cementitious composites (SHCC) subjected to monotonic and repeated loads. Eng. Struct. 2017, 140, 151–163. [Google Scholar] [CrossRef]
  75. Khalil, A.E.-H.; Etman, E.; Atta, A.; Essam, M. Nonlinear behavior of RC beams strengthened with strain hardening cementitious composites subjected to monotonic and cyclic loads. Alex. Eng. J. 2016, 55, 1483–1496. [Google Scholar] [CrossRef]
  76. Khalil, A.E.-H.; Etman, E.; Atta, A.; Essam, M. Ductility Enhancement of Rc Beams Strengthened With Strain Hardening Cementitious Composites. Proc. Int. Struct. Eng. Constr. 2020, 4, 1–6. [Google Scholar] [CrossRef]
  77. Khalil, A.E.-H.; Etman, E.; Atta, A.; Essam, M. Strengthening of Rc Beams Subjected To Cyclic Load Using Ultra High-Performance Strain Hardening Cementitious Composites. Proc. Int. Struct. Eng. Constr. 2020, 4, 1–6. [Google Scholar] [CrossRef]
  78. Naeimi, N.; Moustafa, M.A. Numerical modeling and design sensitivity of structural and seismic behavior of UHPC bridge piers. Eng. Struct. 2020, 219, 110792. [Google Scholar] [CrossRef]
  79. Ichikawa, S.; Matsuzaki, H.; Moustafa, A.; ElGawady, M.A.; Kawashima, K. Seismic-Resistant Bridge Columns with Ultrahigh-Performance Concrete Segments. J. Bridg. Eng. 2016, 21, 4016049. [Google Scholar] [CrossRef]
  80. Azmee, N.M.; Shafiq, N. Ultra-high performance concrete: From fundamental to applications. Case Stud. Constr. Mater. 2018, 9, e00197. [Google Scholar] [CrossRef]
  81. Oesch, T.S.; Landis, E.N.; Kuchma, D.A. Conventional Concrete and UHPC Performance–Damage Relationships Identified Using Computed Tomography. J. Eng. Mech. 2016, 142, 4016101. [Google Scholar] [CrossRef]
  82. Wille, K.; El-Tawil, S.; Naaman, A.E. Properties of strain hardening ultra high performance fiber reinforced concrete (UHP-FRC) under direct tensile loading. Cem. Concr. Compos. 2014, 48, 53–66. [Google Scholar] [CrossRef]
  83. Dong, Y. Performance assessment and design of ultra-high performance concrete (UHPC) structures incorporating life-cycle cost and environmental impacts. Constr. Build. Mater. 2018, 167, 414–425. [Google Scholar] [CrossRef]
  84. Wang, Z.; Wang, J.; Zhao, G.; Zhang, J. Modeling Seismic Behavior of Precast Segmental UHPC Bridge Columns in a Simplified Method. Bull. Earthq. Eng. 2020, 18, 3317–3349. [Google Scholar] [CrossRef]
  85. Ren, L.; Fang, Z.; Zhong, R.; Wang, K. Experimental and Numerical Investigations of the Seismic Performance of UHPC Box Piers. KSCE J. Civ. Eng. 2019, 23, 597–607. [Google Scholar] [CrossRef]
  86. International Conference of Building Officials. 1997 Uniform Building Code; International Conference of Building Officials: Washington, DC, USA, 1997; Volume 2. [Google Scholar]
  87. Abdalla, J.A.; Al-Homoud, A.S. Seismic hazard assessment of United Arab emirates and its surroundings. J. Earthq. Eng. 2004, 8, 817–837. [Google Scholar] [CrossRef]
  88. Gulf News Experts urge study on UAE earthquake risk. Al Nisr Publ. LLC 2022. Available online: https://gulfnews.com/uae/experts-urge-study-on-uae-earthquake-risk-1.414881 (accessed on 10 January 2022).
  89. CSI. ETABS, Computers and Structures Inc. 2018. Available online: https://www.csiamerica.com/products/etabs (accessed on 10 January 2022).
  90. Municipality, D.; Dubai Municipality Seismic Code. Dubai Local Stand. 2013. Available online: https://www.dm.gov.ae/wp-content/uploads/2020/11/DB_SEISMIC-DESIGN-CODEF-OR-DUBAI.pdf (accessed on 10 January 2022).
  91. International Bar Association Safety Concerns Resurface after High-Rise Building Fires in UAE. Available online: https://www.ibanet.org/article/01023447-2e86-42ab-9990-1be466eed307 (accessed on 12 January 2022).
  92. American Society of Civil Engineers. Minimum Design Loads and Associated Criteria for Buildings and Other Structures; American Society of Civil Engineers: Reston, VA, USA, 2016; ISBN 9780784479964. [Google Scholar]
  93. IES. QuickConcreteWall, Integrated Engineering Software. 2021. Available online: https://www.iesweb.com/quick/#qcw (accessed on 10 January 2022).
  94. IBC. 2018 International Building Code (IBC)|ICC Digital Codes. International Code Council. 2018. Available online: https://codes.iccsafe.org/content/IBC2018P6 (accessed on 11 March 2022).
  95. ACI 318-19 Building Code Requirements for Structural Concrete (ACI 318-19) Commentary on Building Code Requirements for Structural Concrete (ACI 318R-19); American Concrete Institute: Farmington Hills, MI, USA, 2019.
  96. Holland, R.B.; Kurtis, K.E.; Kahn, L.F. Effect of Different Concrete Materials on the Corrosion of the Embedded Reinforcing Steel; Elsevier: Amsterdam, The Netherlands, 2016; ISBN 9781782424024. [Google Scholar]
  97. Akhnoukh, A.K.; Buckhalter, C. Ultra-high-performance concrete: Constituents, mechanical properties, applications and current challenges. Case Stud. Constr. Mater. 2021, 15, e00559. [Google Scholar] [CrossRef]
  98. Haber, Z.B.; De la Varga, I.; Graybeal, B.A.; Nakashoji, B.; El-Helou, R. Properties and Behavior of UHPC-Class Materials; United States, Federal Highway Administration, Office of Infrastructure Research and Development: McLean, VA, USA, 2018; p. 153. [Google Scholar]
  99. Rashid, M.A.; Mansur, M.A.; Paramasivam, P. Correlations between Mechanical Properties of High-Strength Concrete. J. Mater. Civ. Eng. 2002, 14, 230–238. [Google Scholar] [CrossRef]
  100. Abdi, H.; Hejazi, F.; Jaafar, M.S. Response modification factor—Review paper. IOP Conf. Ser. Earth Environ. Sci. 2019, 357, 12003. [Google Scholar] [CrossRef]
  101. Ghosh, S.K. Ductile Coupled Reinforced Concrete Shear Walls and Coupled Composite Steel Plate Shear Walls as Distinct Seismic Force-Resisting Systems in ASCE 7. 2019 SEAOC Conv. Proc. 2019, 6, 339–347. [Google Scholar]
  102. El-Tawil, S.; Tai, Y.-S.; Rogers, D.; Larrard, D. Open Recipe Ultrahigh Performance Concrete: Busting the cost myth. Concr. Int. 2020, 42, 33–38. [Google Scholar]
Figure 1. (a) Typical floor layout configuration; (b) floor plan on ETABS.
Materials 15 02888 g001
Figure 2. Sample of results for the 60 MPa ETABS model: (a) First mode; (b) second mode; (c) third mode.
Materials 15 02888 g002aMaterials 15 02888 g002b
Figure 3. Design story drift.
Materials 15 02888 g003
Figure 4. Overturning moment.
Materials 15 02888 g004
Figure 5. Resisting moment.
Materials 15 02888 g005
Figure 6. Factor of Safety against overturning R e s i s t i n g   M o m e n t O v e r t u r n i n g   M o m e n t .
Materials 15 02888 g006
Figure 7. (a) Story shear; (b) story stiffness.
Materials 15 02888 g007
Figure 8. Total cost in AED (USD).
Materials 15 02888 g008
Table 1. Load combinations.
NameFormulaDescription
U11.4DDead
U21.2D + 1.6LDead + Live
U31.2D + 1.6L + 0.5LrDead + Live + Roof Live
U41.2D + 1.0L + 1.6LrDead + Live + Roof Live
U51.3D + 0.5L ± 1.0EDead (max) + Live ± Seismic
U60.8D ± 1.0EDead (min) ± Seismic
Table 2. Modal analysis results.
ModePeriod (s)DirectionSumUXSumUYSumUZ
60 MPa150 MPa185 MPa220 MPa
16.6246.8137.0076.56UX + UY0.30870.29233.82 × 10−5
26.5846.7946.9956.556UX + UY0.60110.60113.84 × 10−5
33.8914.7985.1442.862RZ0.60110.60110.6644
41.7041.6911.6941.502UX + UY0.68870.68690.6644
51.6971.6881.6931.502UX + UY0.77460.77460.6644
61.2091.3551.3890.957RZ0.77460.77460.7914
70.7860.7460.7450.642UX + UY0.81050.81020.7915
80.7830.7450.7450.642UX + UY0.8460.8460.7915
90.6280.640.6410.511RZ0.8460.8460.8538
100.4730.4340.4310.368UX + UY0.86650.86630.8538
110.4720.4330.4310.368UX + UY0.88670.88670.8538
120.3950.3790.3750.322RZ0.88670.88670.8909
130.3270.2910.2880.248UX + UY0.89990.89970.8909
140.3260.2910.2880.248UX + UY0.91290.91290.8909
150.2790.2570.2520.228RZ0.91290.91290.9157
Table 3. Seismic parameters for base shear calculation.
Design CriteriaCt and XSSS1TL (s)FaFvSDSSD1R Ω CdIPeriod Used (s)Coeff UsedWeight Used (kN)Base Shear (kN)
60 MPaStrength0.02; 0.750.9350.36580.80.80.50.282.5814.4570.021482,81210,593.5
Drift6.5840.003482,8121784.4
150 MPaStrength4.4570.021464,76910,197.6
Drift6.7940.003464,7691664.6
185 MPaStrength4.4570.021458,67710,063.9
Drift6.9950.003458,6771595.5
220 MPaStrength4.4570.021480,25310,537.4
Drift6.5560.003480,2531782.4
Table 4. Shear walls design summary.
FloorsPier Label60 Mpa150 Mpa185 Mpa220 Mpa
L (m)b (m)ρV (%)As,H (mm2/m)L (m)b (m)ρV (%)As,H (mm2/m)L (m)b (m)ρV (%)As,H (mm2/m)L (m)b (m)ρV (%)As,H (mm2/m)
1–5P14.550.650.8416303.750.62.1115003.650.62.5815003.70.551.81380
P23.70.650.2516304.10.60.2515004.050.60.2515003.30.550.251380
P32.90.50.2512502.70.450.2511302.450.40.2510003.80.50.981250
6–10P14.550.60.4615003.750.551.6113803.650.552.0513803.70.51.361250
P23.70.60.2515004.10.550.2513804.050.550.2513803.30.50.251250
P32.90.450.2511302.70.40.2510002.450.350.258803.80.450.931130
11–15P14.550.50.2512503.750.51.1612503.650.51.5512503.70.50.911250
P23.70.50.2512504.10.50.2512504.050.50.2512503.30.50.251250
P32.90.350.258802.70.350.258802.450.30.257503.80.450.71130
16–20P14.550.450.2511303.750.450.7211303.650.451.0611303.70.50.521250
P23.70.450.2511304.10.450.2511304.050.450.2511303.30.50.251250
P32.90.30.257502.70.30.257502.450.250.256303.80.450.441130
21–25P14.550.40.2510003.750.40.2510003.650.40.510003.70.40.371000
P23.70.40.2510004.10.40.2510004.050.40.2510003.30.40.251000
P32.90.30.257502.70.250.256302.450.250.256303.80.350.25880
26–30P14.550.40.2510003.750.350.258803.650.40.2510003.70.40.251000
P23.70.40.2510004.10.350.258804.050.40.2510003.30.40.251000
P32.90.30.257502.70.250.256302.450.250.256303.80.350.25880
31–35P14.550.40.2510003.750.30.257503.650.350.258803.70.350.25880
P23.70.40.2510004.10.30.257504.050.350.258803.30.350.25880
P32.90.30.257502.70.250.256302.450.250.256303.80.30.25750
36–40P14.550.30.257503.750.250.256303.650.30.257503.70.30.25750
P23.70.30.257504.10.250.256304.050.30.257503.30.30.25750
P32.90.250.256302.70.250.256302.450.250.256303.80.30.25750
41–45P14.550.250.256303.750.250.256303.650.250.256303.70.250.25630
P23.70.250.256304.10.250.256304.050.250.256303.30.250.25630
P32.90.250.256302.70.250.256302.450.250.256303.80.250.25630
46–50P14.550.20.255003.750.20.255003.650.20.255003.70.20.25500
P23.70.20.255004.10.20.255004.050.20.255003.30.20.25500
P32.90.20.255002.70.20.255002.450.20.255003.80.20.25500
51–55P14.550.20.255003.750.20.425003.650.20.45003.70.20.5500
P23.70.20.255004.10.20.255004.050.20.255003.30.20.41500
P32.90.20.255002.70.20.255002.450.20.255003.80.20.25500
56–60P14.550.20.765003.750.21.025003.650.20.975003.70.21.29500
P23.70.20.475004.10.20.645004.050.20.625003.30.21.23500
P32.90.20.255002.70.20.485002.450.20.765003.80.20.45500
Table notations: L (wall length), b (wall thickness), ρV (vertical reinforcement ratio), As,H (horizontal reinforcement).
Table 5. Boundary element design summary.
FloorsPier Label60 Mpa150 Mpa185 Mpa220 Mpa
Lbe (m)bbe (m)As,H,L (mm2/m)As,H,S (mm2/m)Lbe (m)bbe (m)As,H,L (mm2/m)As,H,S (mm2/m)Lbe (m)bbe (m)As,H,L (mm2/m)As,H,S (mm2/m)Lbe (m)bbe (m)As,H,L (mm2/m)As,H,S (mm2/m)
1–5P12.051.347,50271371.60.645,70816,40810.634,75220,2720.750.5530,53021,930
P21.41.332,29271370.550.614,94316,408NANANANANANANANA
P31.13125,85753820.60.4516,40812,0130.450.414,84213,032NANANANA
6–10P12.051.247,50265521.30.5536,91814,9430.90.5531,13218,4620.70.528,38019,780
P21.41.232,29265520.550.5514,94314,943NANANANANANANANA
P31.130.925,85747970.60.416,40810,5480.50.3516,65211,222NANANANA
11–15P12.05147,50253821.050.529,59313,4780.80.527,51216,652NANANANA
P21.53135,2175382NANANANANANANANANANANANA
P31.30.729,95236270.60.3516,40890830.50.316,6529412NANANANA
16–20P11.950.945,16247970.90.4525,19812,0130.750.4525,70214,842NANANANA
P21.50.934,6324797NANANANANANANANANANANANA
P31.330.630,53730420.650.317,87376180.550.2518,8707770NANANANA
21–25P11.80.841,65242121.850.453,03310,548NANANANANANANANA
P21.480.834,0474212NANANANANANANANANANANANA
P31.130.625,85730420.650.2517,8736153NANANANANANANANA
26–30P11.940.633,46242120.70.3519,3389083NANANANANANANANA
P21.670.628,7824212NANANANANANANANANANANANA
P31.240.4521,17730420.550.2514,9436153NANANANANANANANA
31–35P11.60.627,6124212NANANANANANANANANANANANA
P21.370.623,5174212NANANANANANANANANANANANA
P310.4517,0823042NANANANANANANANANANANANA
36–40P11.70.4529,3673042NANANANANANANANANANANANA
P21.470.4525,2723042NANANANANANANANANANANANA
P30.90.4515,3273042NANANANANANANANANANANANA
41–45P11.570.4527,0273042NANANANANANANANANANANANA
P21.340.4522,9323042NANANANANANANANANANANANA
P30.470.37577222457NANANANANANANANANANANANA
46–50P11.240.4521,9013146NANANANANANANANANANANANA
P21.170.4521,2043224NANANANANANANANANANANANA
P30.60.276162176NANANANANANANANANANANANA
51–55P10.80.294241984NANANANANANANANANANANANA
P20.550.269362176NANANANANANANANANANANANA
P3NANANANANANANANANANANANANANANANA
56–60P1NANANANANANANANANANANANANANANANA
P2NANANANANANANANANANANANANANANANA
P3NANANANANANANANANANANANANANANANA
Table notations: Lbe (boundary element length), bbe (boundary element thickness), As,H,L (horizontal reinforcement in long direction), As,H,S (horizontal reinforcement in short direction).
Table 6. Spandrels design summary.
FloorsSpandrel Label60 MPa150 MPa185 MPa220 MPa
As,T (mm2)As,B (mm2)As,V (mm2/m)As,H (mm2/m)As,T (mm2)As,B (mm2)As,V (mm2/m)As,H (mm2/m)As,T (mm2)As,B (mm2)As,V (mm2/m)As,H (mm2/m)As,T (mm2)As,B (mm2)As,V (mm2/m)As,H (mm2/m)
1–5S17110625952501630570251694590150062705832578015005021454146801380
S22244181813701250233320151460113021091856149010004688426850701250
6–10S16902635355601500545649874560138060585643572013804629426644701250
S2194415631160113020411791133010001802162413108804573417150801130
11–15S16063549249101250508446344320125057035270544012504399404542101250
S21956158614808802044169515408801766144114607504506412250201130
16–20S15854527548001130477243164130113054054964523011304003365237001250
S21721137313207501941160115607501628130914106304909447655701130
21–25S15483489945601000451340584000100050404602494010004106373040901000
S2156212541150750176514511490630154212701360630370333874250880
26–30S1508845574250100041733727377088046794237452010003956354439601000
S2146411791050750158313061290630151412561340630358132814100880
31–35S14573409838001000372032823410750435238924210880336630253400880
S212661012820750154812931280630134311601120630317429003690750
36–40S1382333903310750318127612960630341829913320750296926483030750
S21144915820630152812991290630139911981270630284926023260750
41–45S1322428292850630273023252470630284224452780630244421482500630
S21020819690630129911191010630129911601150630231520952660630
46–50S1250421572260500204516791850500217718112140500192016571980500
S2756581500500993895770500996928880500169615031920500
51–55S1172614411500500140410741140500145711351280500138911641300500
S252935850050084764850050089071350050010251012960500
56–60S167458950050010056185005001061856660500865618500500
S2529500500500433296500500408263500500866688500500
Table notations: As,T (top reinforcement area), As,B (bottom reinforcement area), As,V (vertical reinforcement area), and As,H (horizontal reinforcement area).
Table 7. Columns design summary.
FloorsPier Label60 MPa150 MPa185 MPa220 MPa
Cross Section (m) ρ V ( % ) Cross Section (m) ρ V ( % ) Cross Section (m) ρ V ( % ) Cross Section (m) ρ V ( % )
1–5C10.55 × 0.551.450.50 × 0.5010.50 × 0.5010.50 × 0.501
C20.55 × 0.554.040.50 × 0.5010.50 × 0.5010.50 × 0.501
C30.55 × 0.552.950.50 × 0.5010.50 × 0.5010.50 × 0.501
6–10C10.55 × 0.5510.50 × 0.5010.50 × 0.5010.50 × 0.501
C20.55 × 0.552.490.50 × 0.5010.50 × 0.5010.50 × 0.501
C30.55 × 0.551.770.50 × 0.5010.50 × 0.5010.50 × 0.501
11–15C10.50 × 0.501.690.45 × 0.4510.45 × 0.4510.50 × 0.501
C20.50 × 0.503.720.45 × 0.4510.45 × 0.4510.50 × 0.501
C30.50 × 0.503.290.45 × 0.4510.45 × 0.4510.50 × 0.501
16–20C10.50 × 0.5010.45 × 0.4510.45 × 0.4510.40 × 0.401
C20.50 × 0.501.680.45 × 0.4510.45 × 0.4510.40 × 0.401
C30.50 × 0.501.510.45 × 0.4510.45 × 0.4510.40 × 0.401
21–25C10.50 × 0.5010.45 × 0.4510.40 × 0.4010.40 × 0.401
C20.50 × 0.5010.45 × 0.4510.40 × 0.4010.40 × 0.401
C30.50 × 0.5010.45 × 0.4510.40 × 0.4010.40 × 0.401
26–30C10.45 × 0.4510.40 × 0.4010.40 × 0.4010.40 × 0.401
C20.45 × 0.4510.40 × 0.4010.40 × 0.4010.40 × 0.401
C30.45 × 0.4510.40 × 0.4010.40 × 0.4010.40 × 0.401
31–35C10.45 × 0.4510.40 × 0.4010.40 × 0.4010.40 × 0.401
C20.45 × 0.4510.40 × 0.4010.40 × 0.4010.40 × 0.401
C30.45 × 0.4510.40 × 0.4010.40 × 0.4010.40 × 0.401
36–40C10.45 × 0.4510.40 × 0.4010.40 × 0.4010.40 × 0.401
C20.45 × 0.4510.40 × 0.4010.40 × 0.4010.40 × 0.401
C30.45 × 0.4510.40 × 0.4010.40 × 0.4010.40 × 0.401
41–45C10.45 × 0.4510.40 × 0.4010.40 × 0.4010.40 × 0.401
C20.45 × 0.4510.40 × 0.4010.40 × 0.4010.40 × 0.401
C30.45 × 0.4510.40 × 0.4010.40 × 0.4010.40 × 0.401
46-50C10.45 × 0.4510.40 × 0.4010.40 × 0.4010.40 × 0.401
C20.45 × 0.4510.40 × 0.4010.40 × 0.4010.40 × 0.401
C30.45 × 0.4510.40 × 0.4010.40 × 0.4010.40 × 0.401
51–55C10.45 × 0.4510.40 × 0.4010.40 × 0.4010.40 × 0.401
C20.45 × 0.4510.40 × 0.4010.40 × 0.4010.40 × 0.401
C30.45 × 0.4510.40 × 0.4010.40 × 0.4010.40 × 0.401
56–60C10.45 × 0.4510.40 × 0.4010.40 × 0.4010.40 × 0.401
C20.45 × 0.4510.40 × 0.4010.40 × 0.4010.40 × 0.401
C30.45 × 0.4510.40 × 0.4010.40 × 0.4010.40 × 0.401
Table notations: ρ V (vertical reinforcement ratio).
Table 8. Cost analysis.
60 MPa150 MPa185 MPa220 MPa
Concrete Volume (m3)7882674564947367
Steel Weight (Tons)1217116011021273
Concrete Cost, AED (USD)2,286,004 (622,363)3,710,047 (1,010,058)3,896,766 (1,060,892)4,789,144 (1,303,842)
Steel Cost, AED (USD)3,529,441 (960,888)3,364,513 (915,987)3,197,987 (870,650)3,693,968 (1,005,681)
Direct Cost, AED (USD)5,815,445 (1,583,252)7,074,560 (1,926,046)7,094,753 (1,931,543)8,483,112 (2,309,523)
Indirect Cost, AED (USD)11,430,022 (3,111,818)5,868,620 (1,597,729)4,708,592 (1,281,912)4,273,390 (1,163,428)
Total Cost, AED (USD)17,245,467 (4,695,071)12,943,180 (3,523,775)11,803,345 (3,213,455)12,756,502 (3,472,952)
Publisher’s Note: MDPI stays neutral with regard to jurisdictional claims in published maps and institutional affiliations.

