
Using Artificial Intelligence Techniques to Predict Punching Shear Capacity of Lightweight Concrete Slabs


Abstract
:1. Introduction
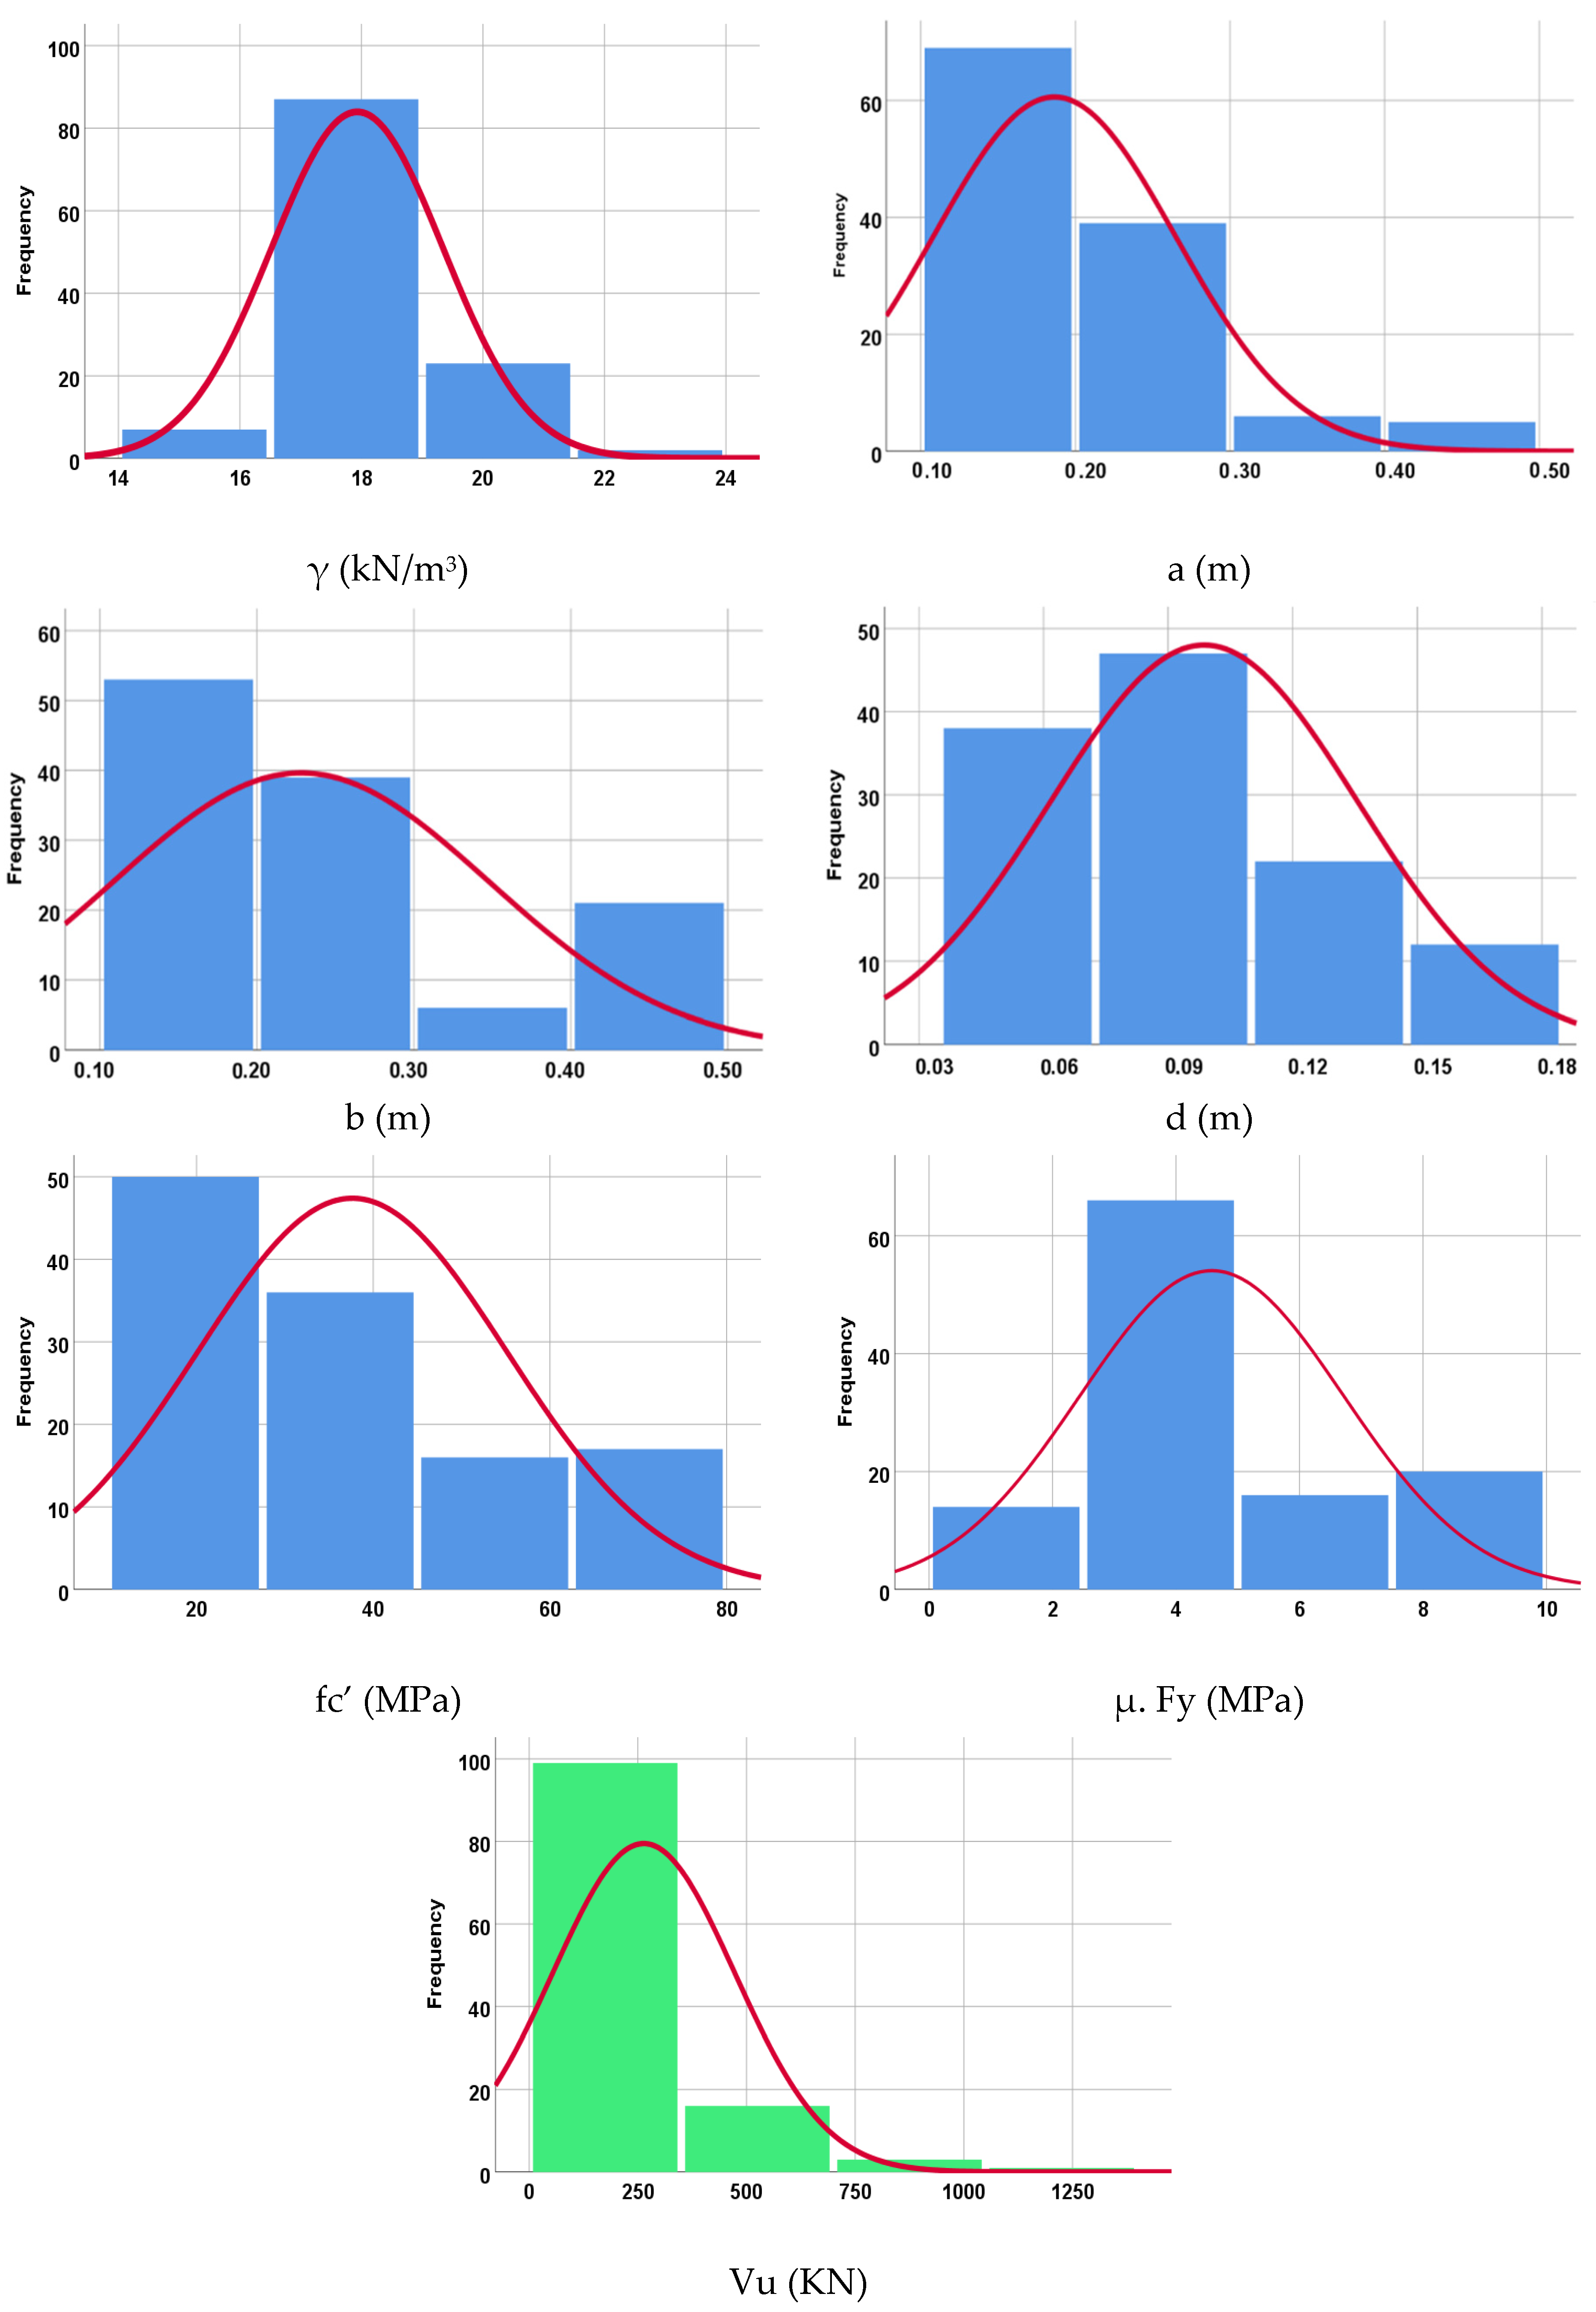
2. Experimental Database
3. Selected Design Model
4. Correlation and Effective Parameters
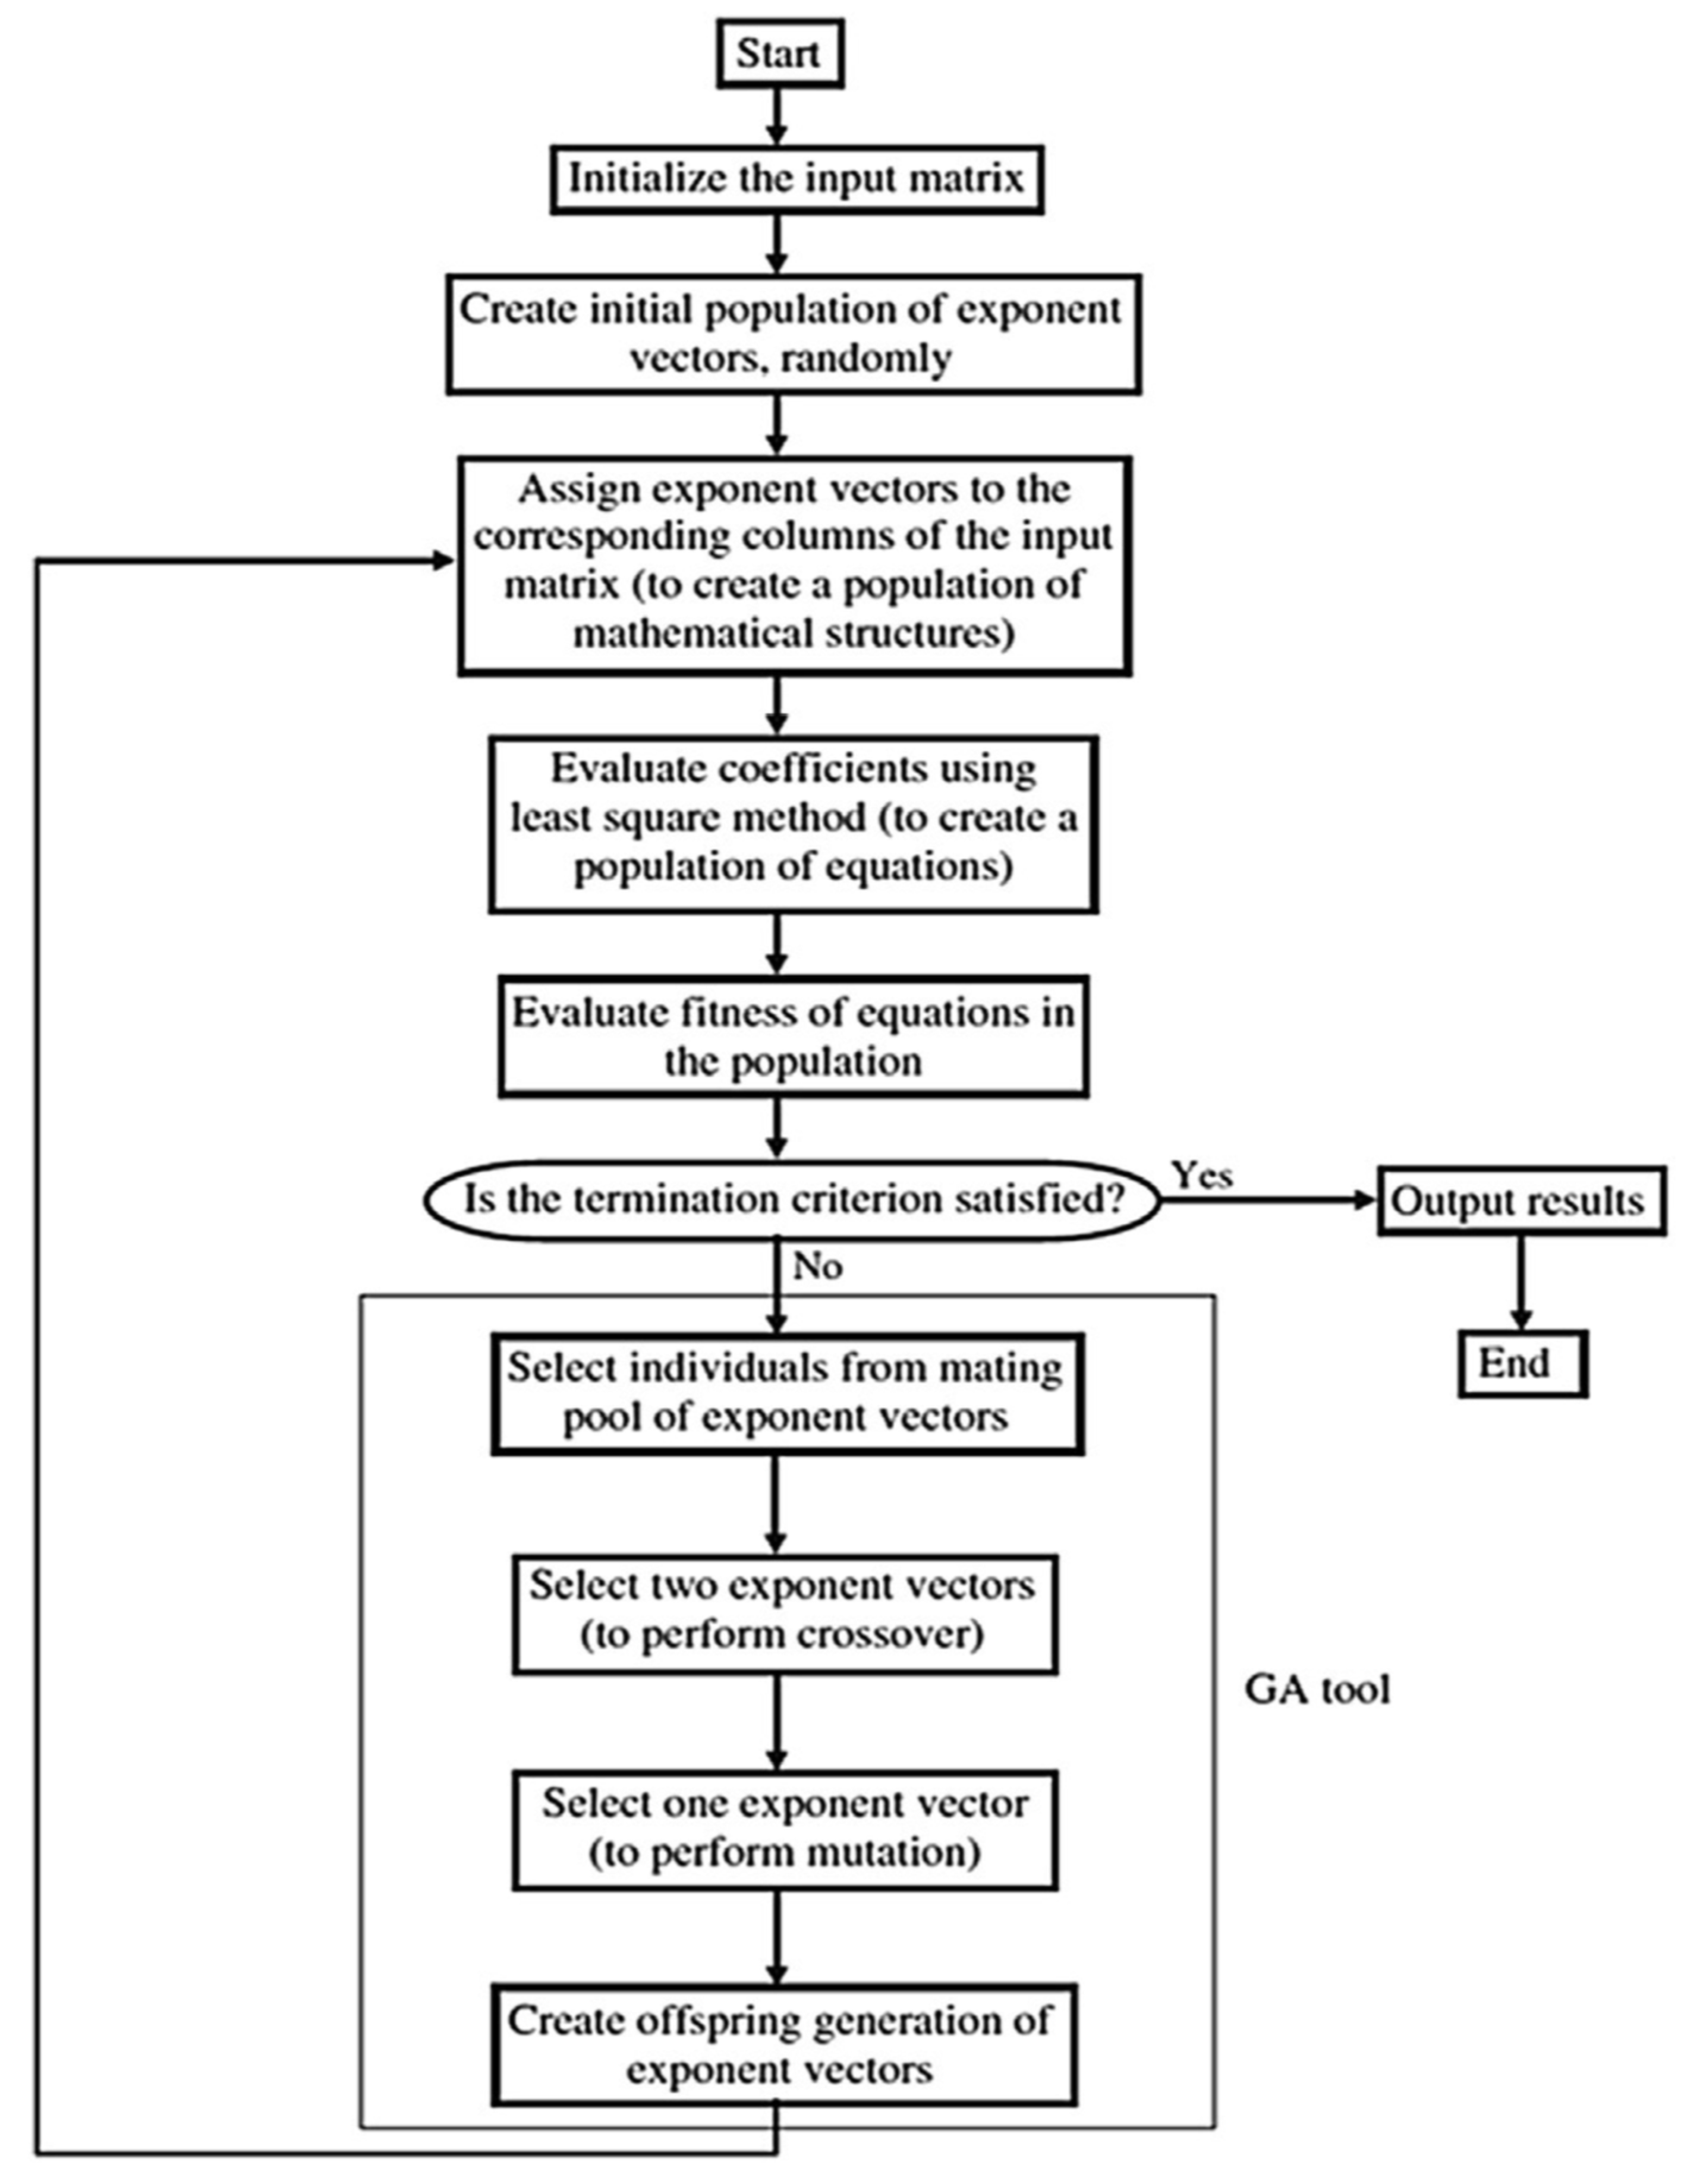
5. AI Model Development
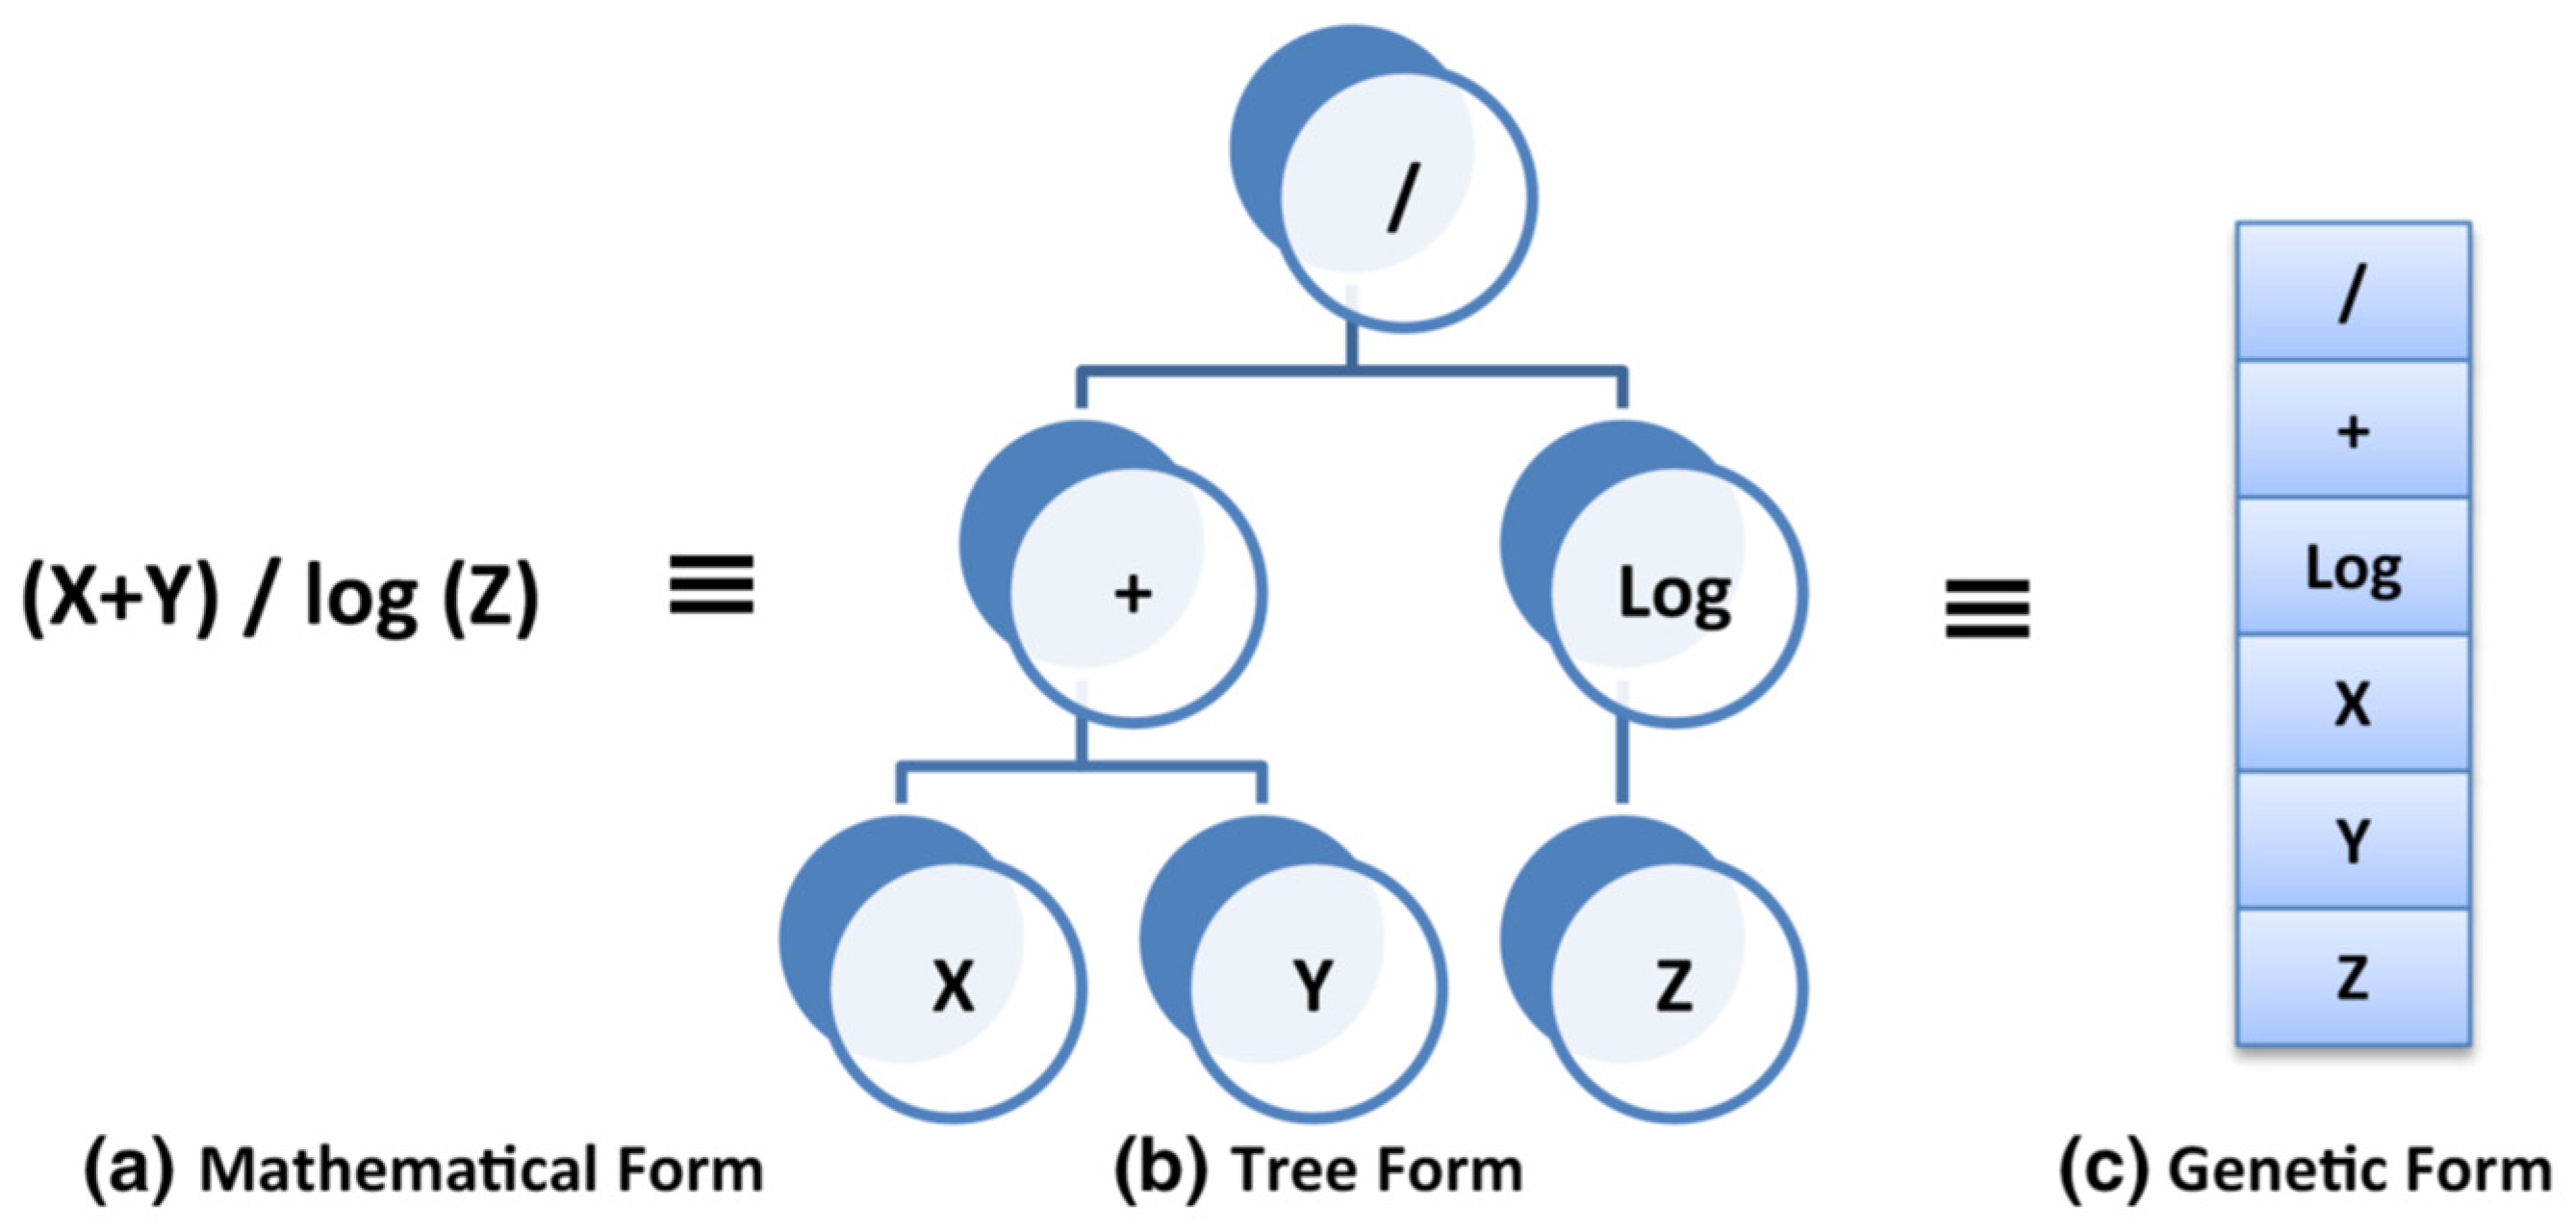
5.1. GP Model
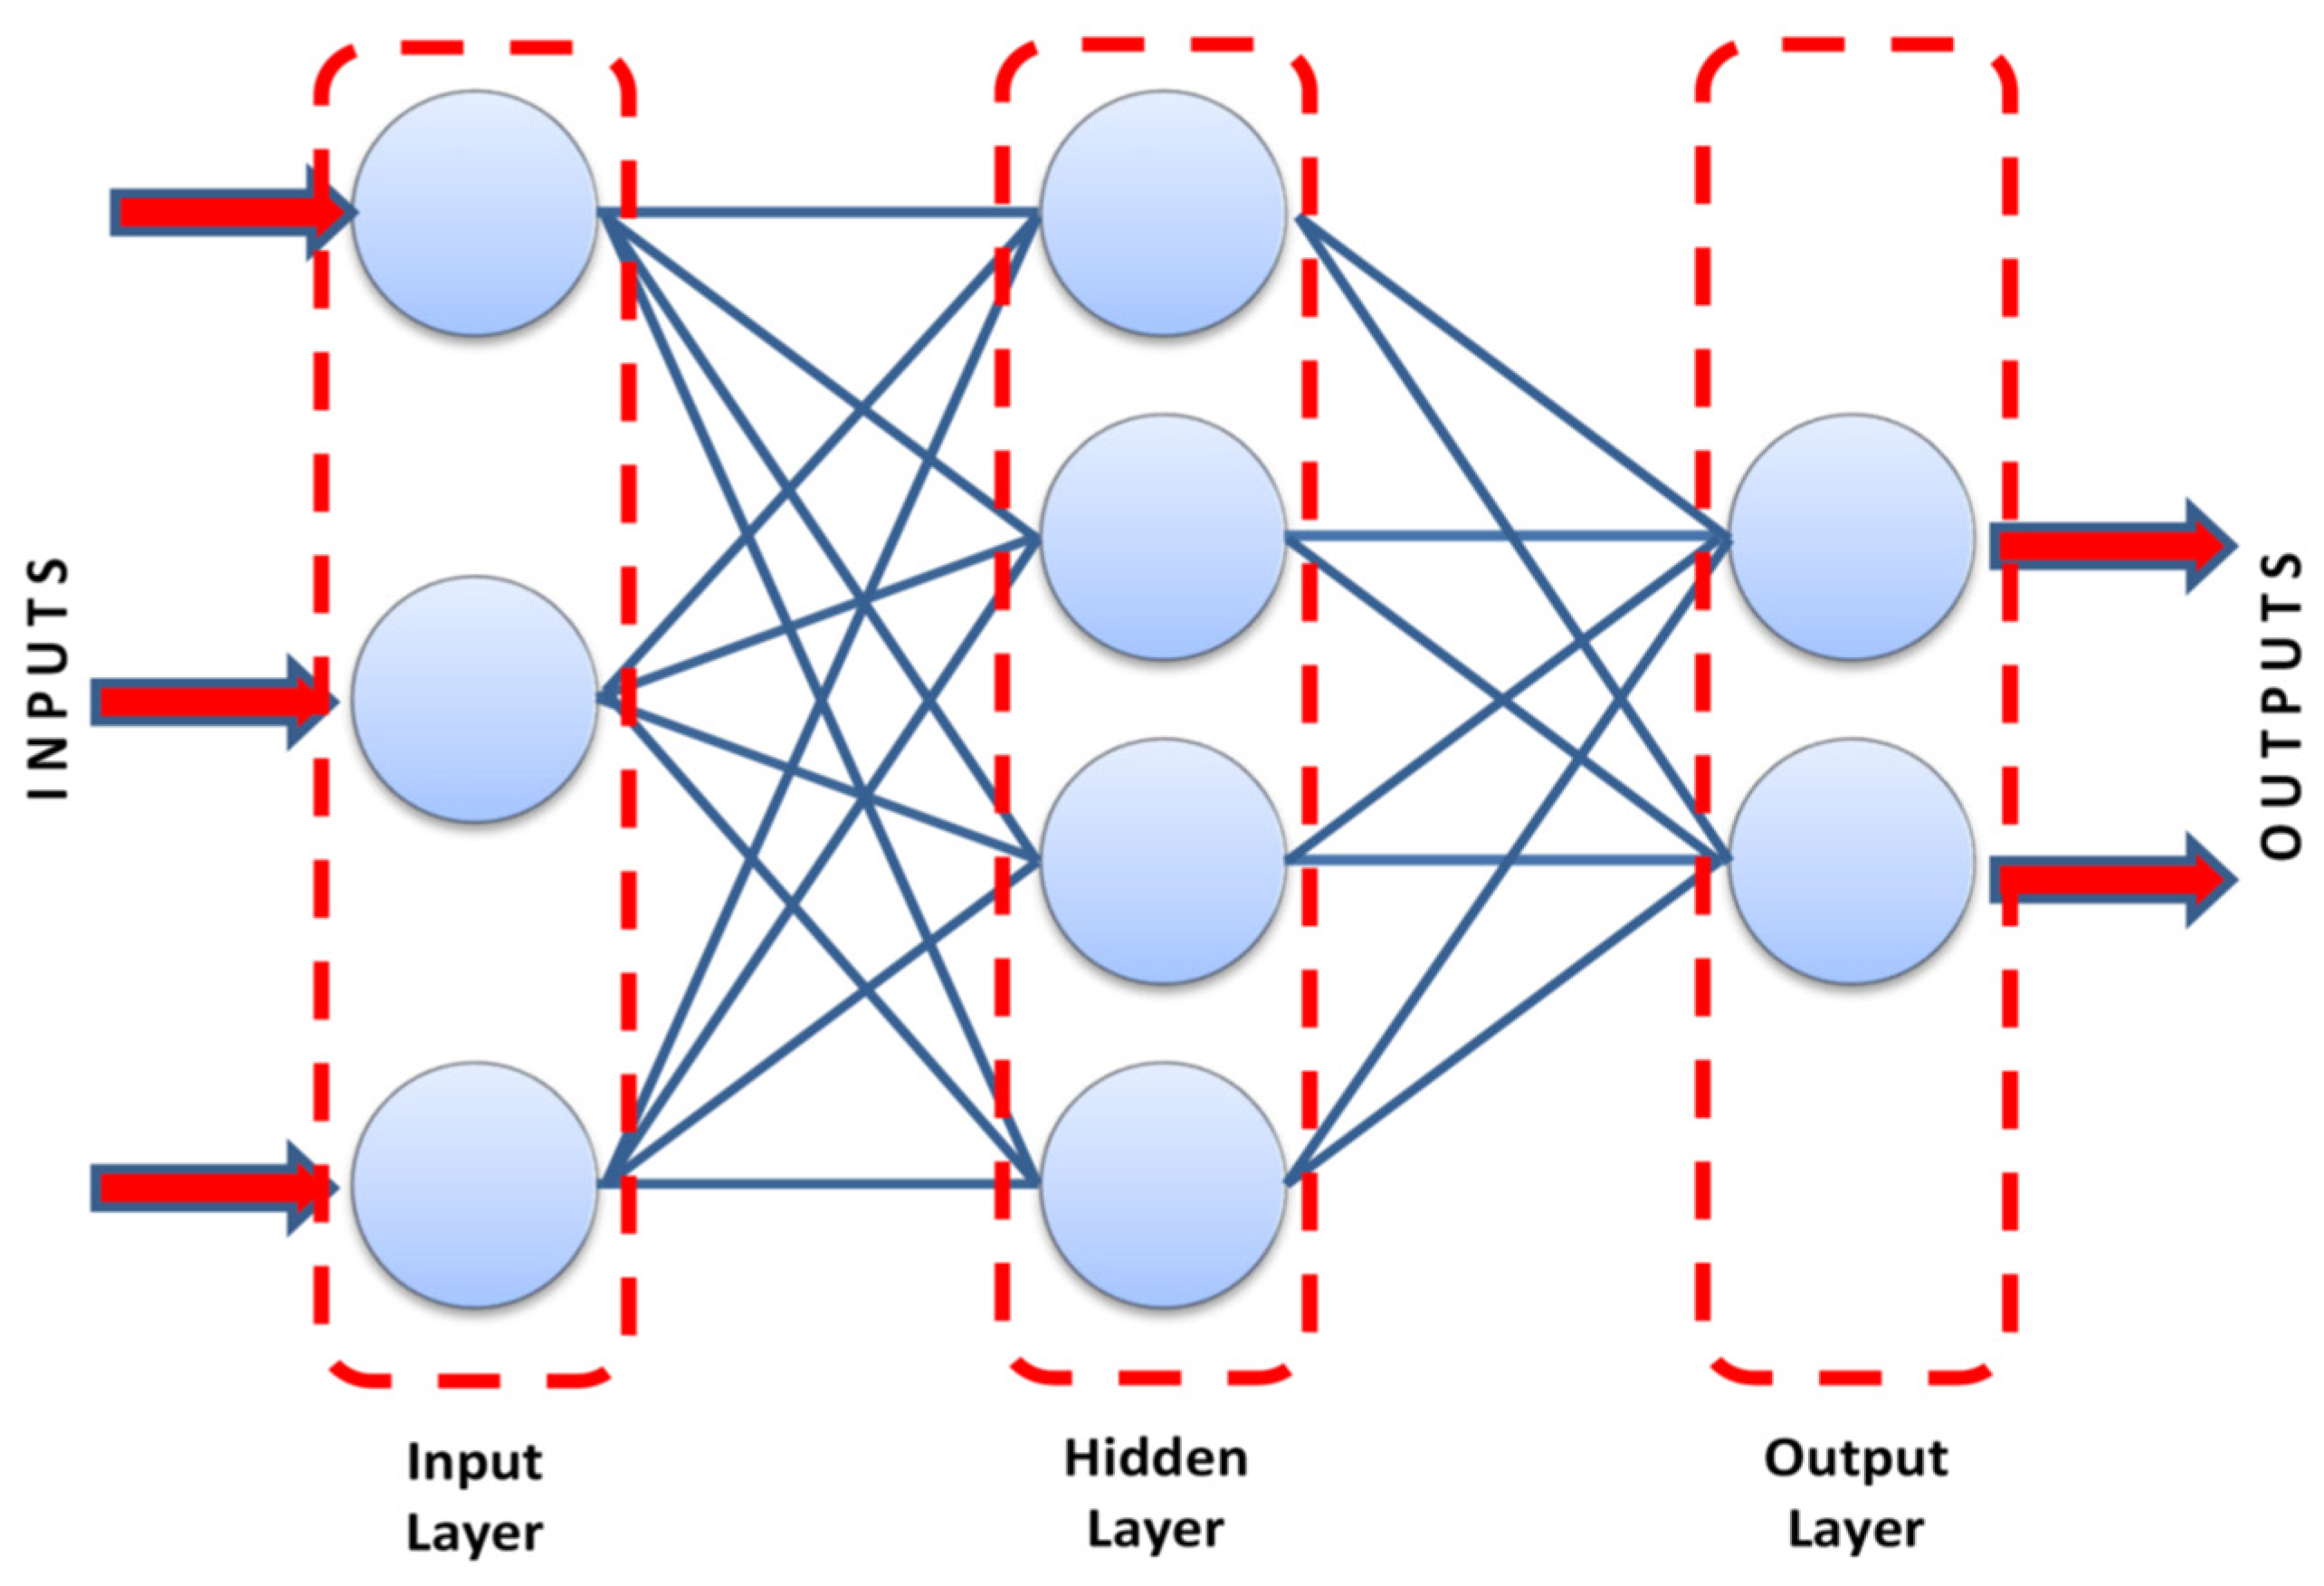
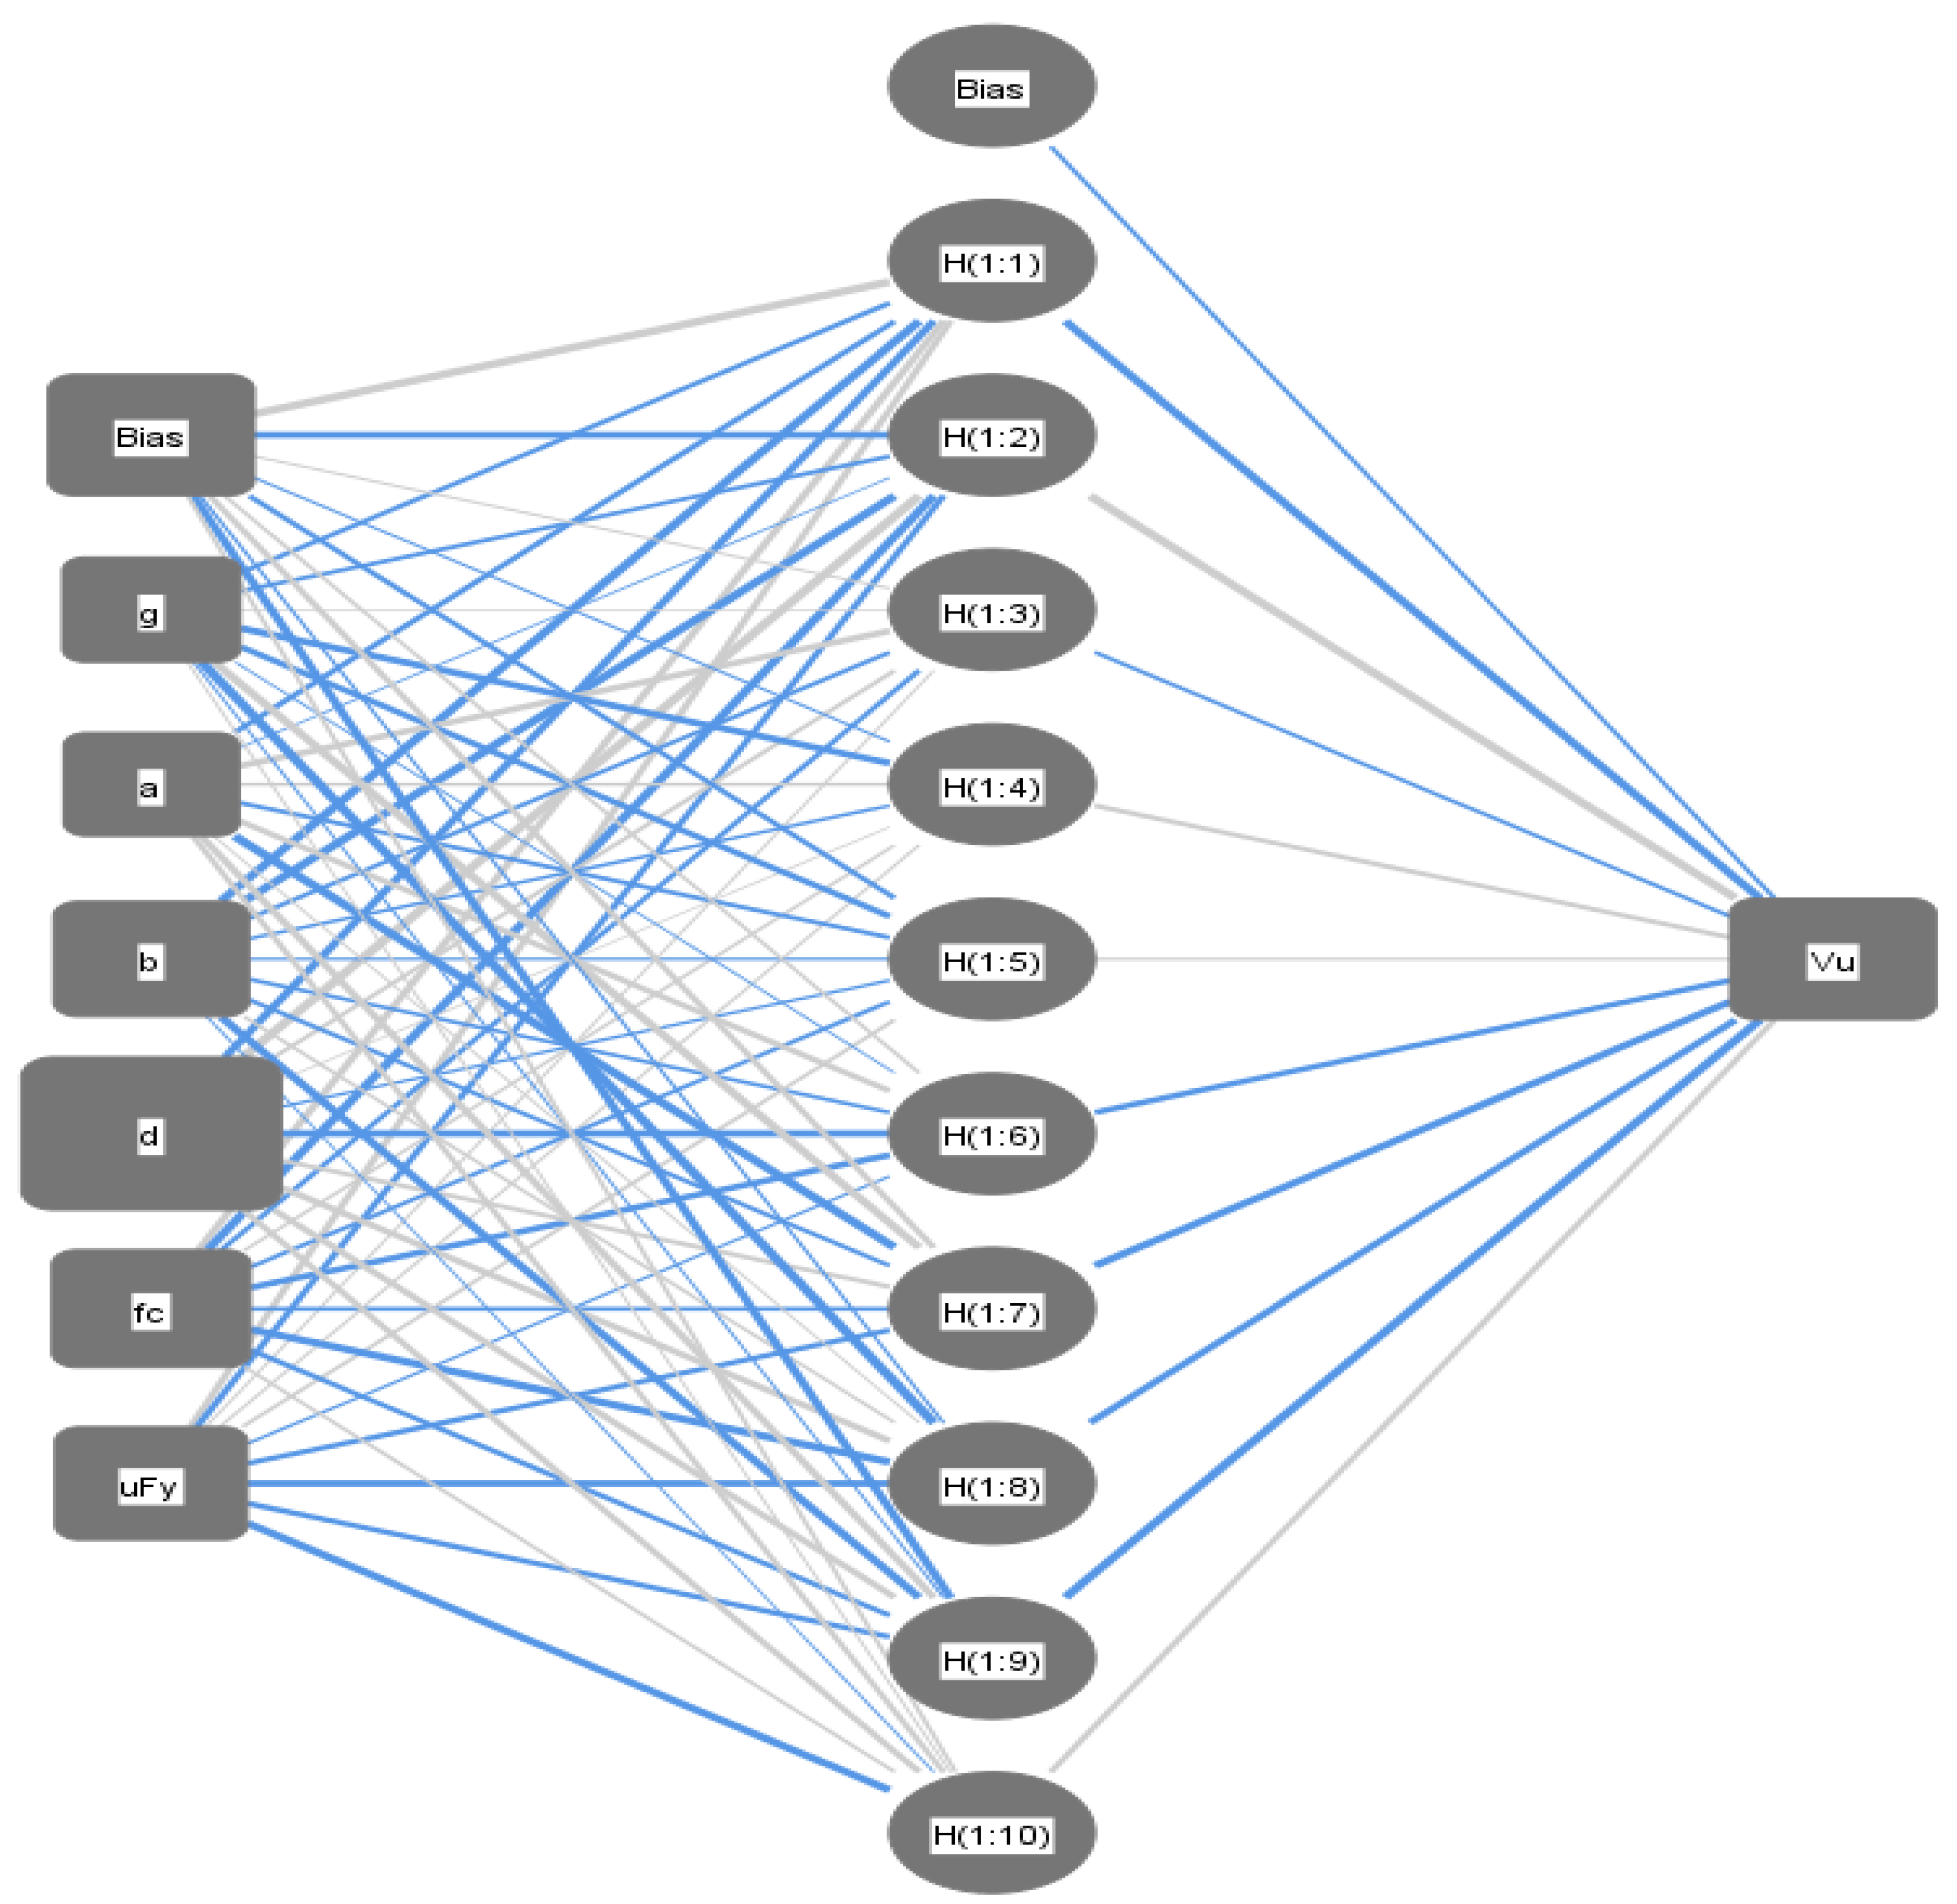
5.2. ANN Model
5.3. EPR Model
6. Safety of Proposed and Existing Models
6.1. Overall Safety of Various Models
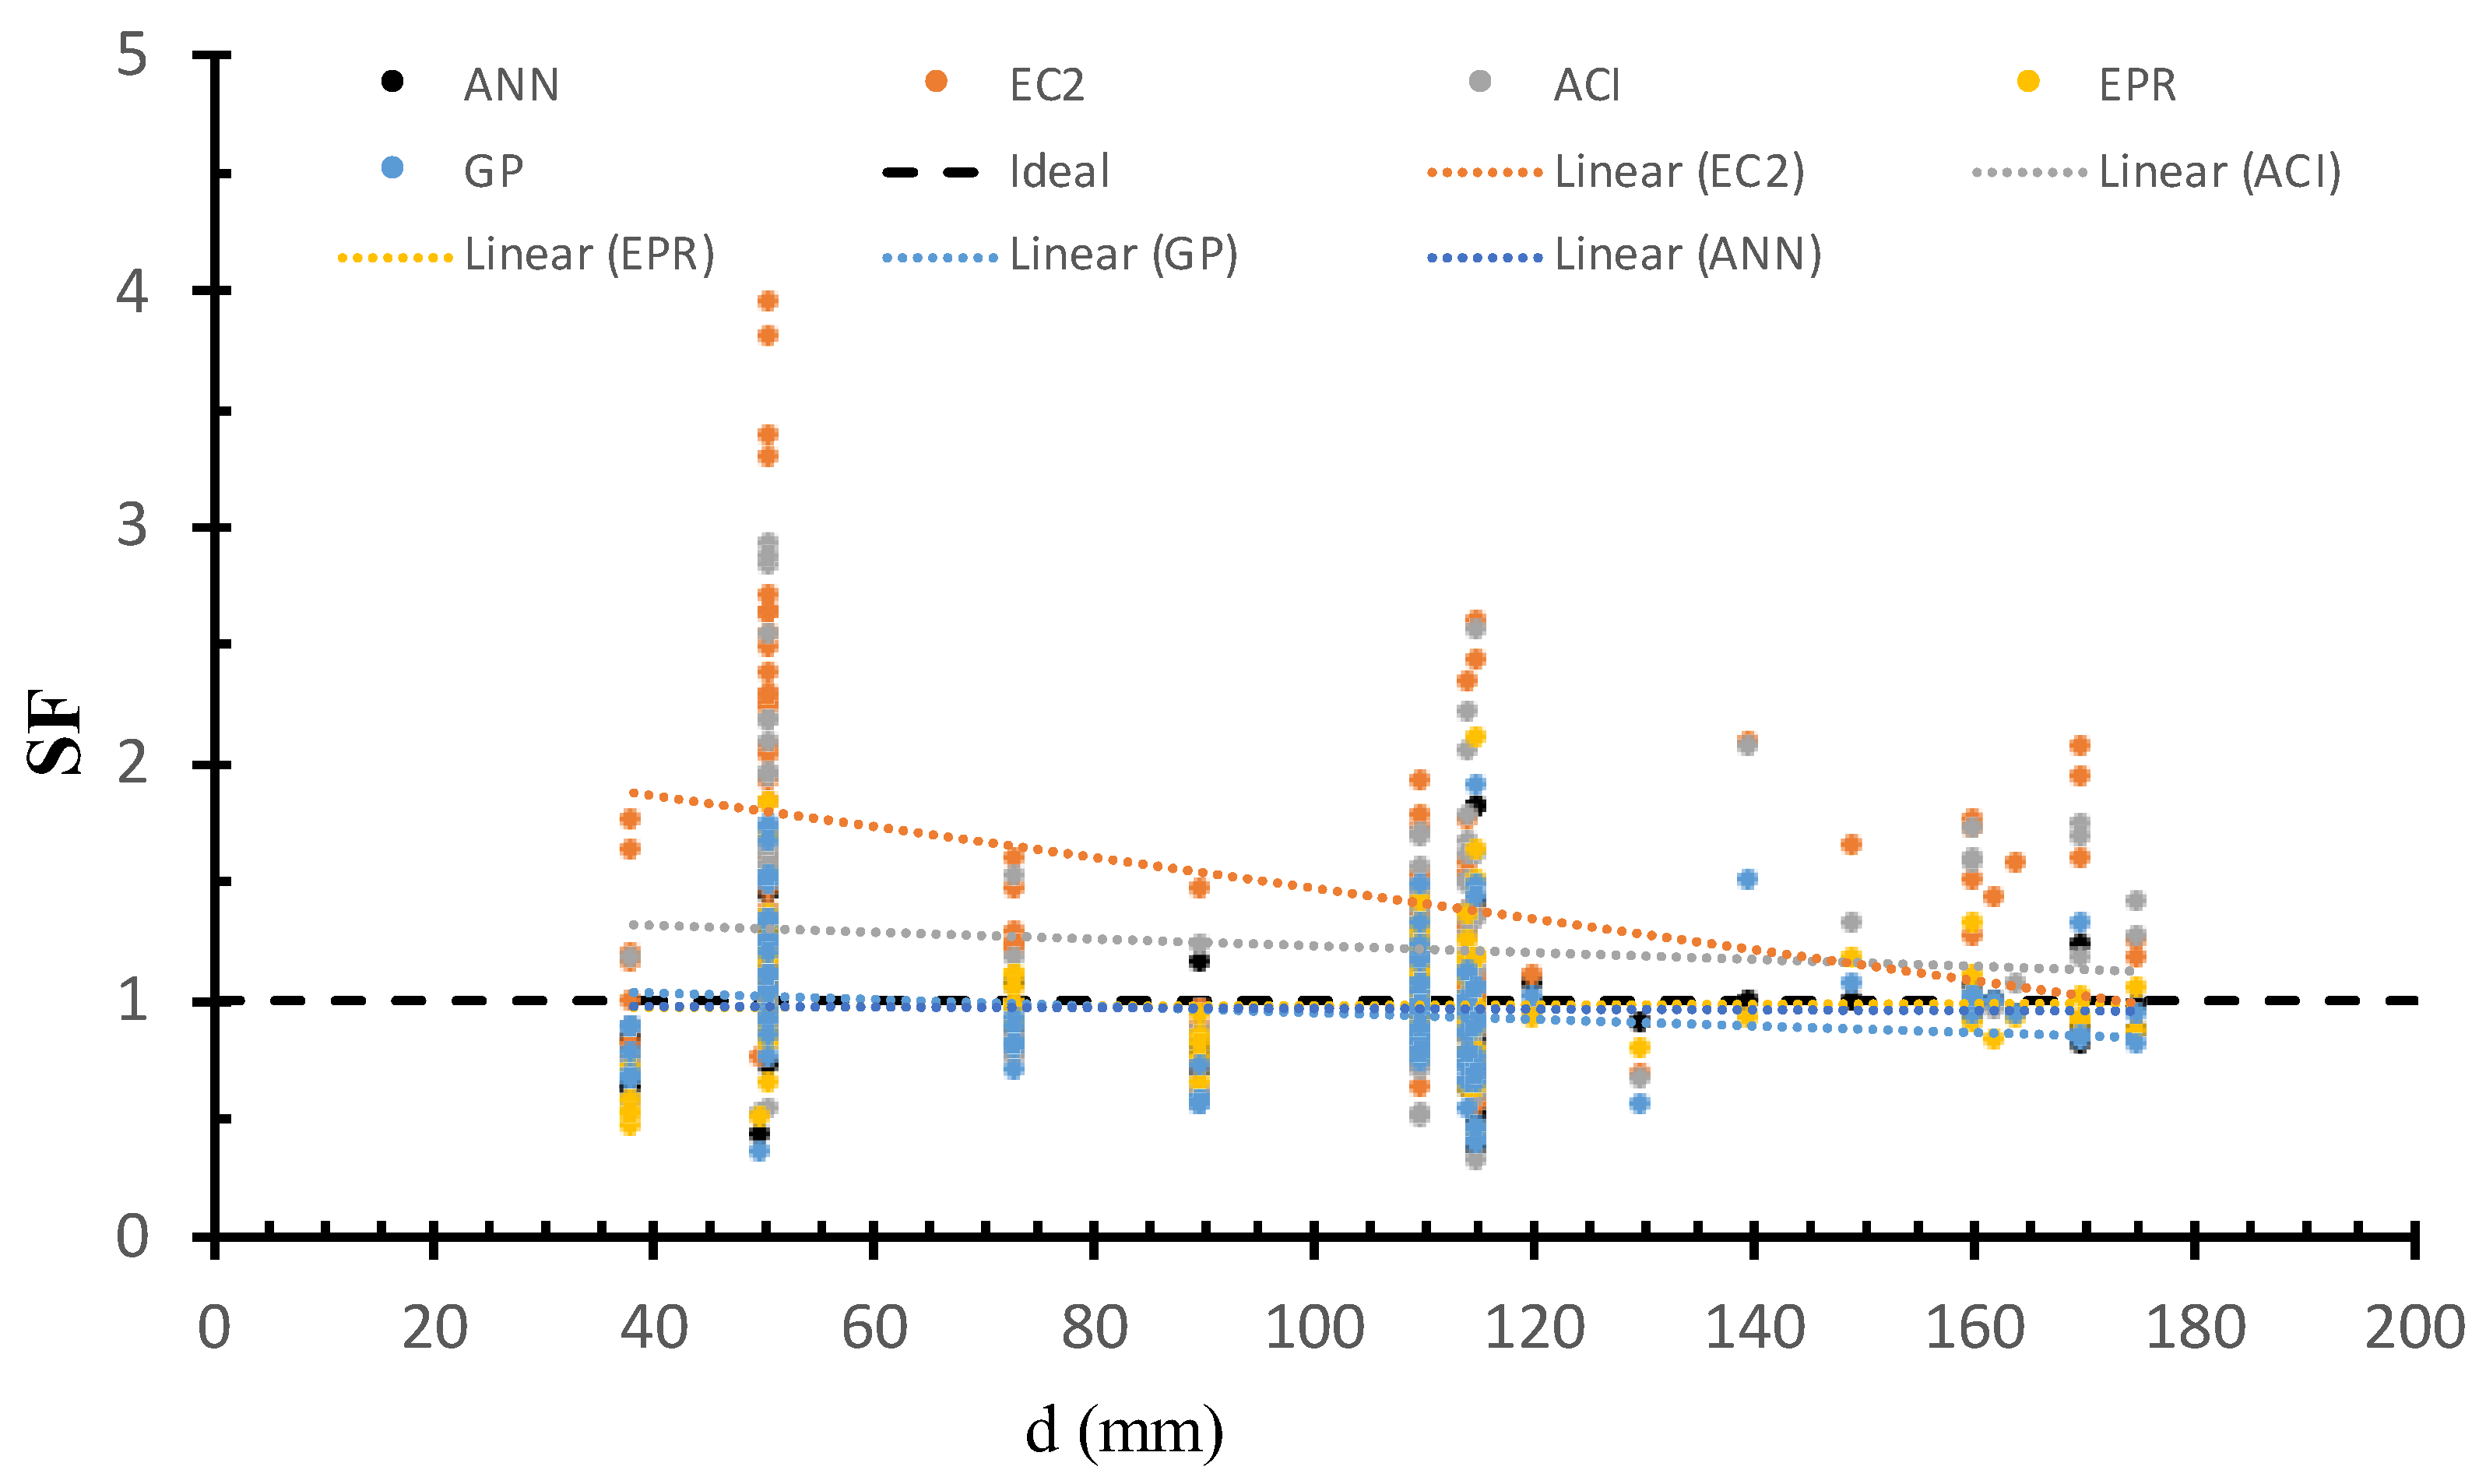
6.2. Safety of Various Models Versus Slab Size
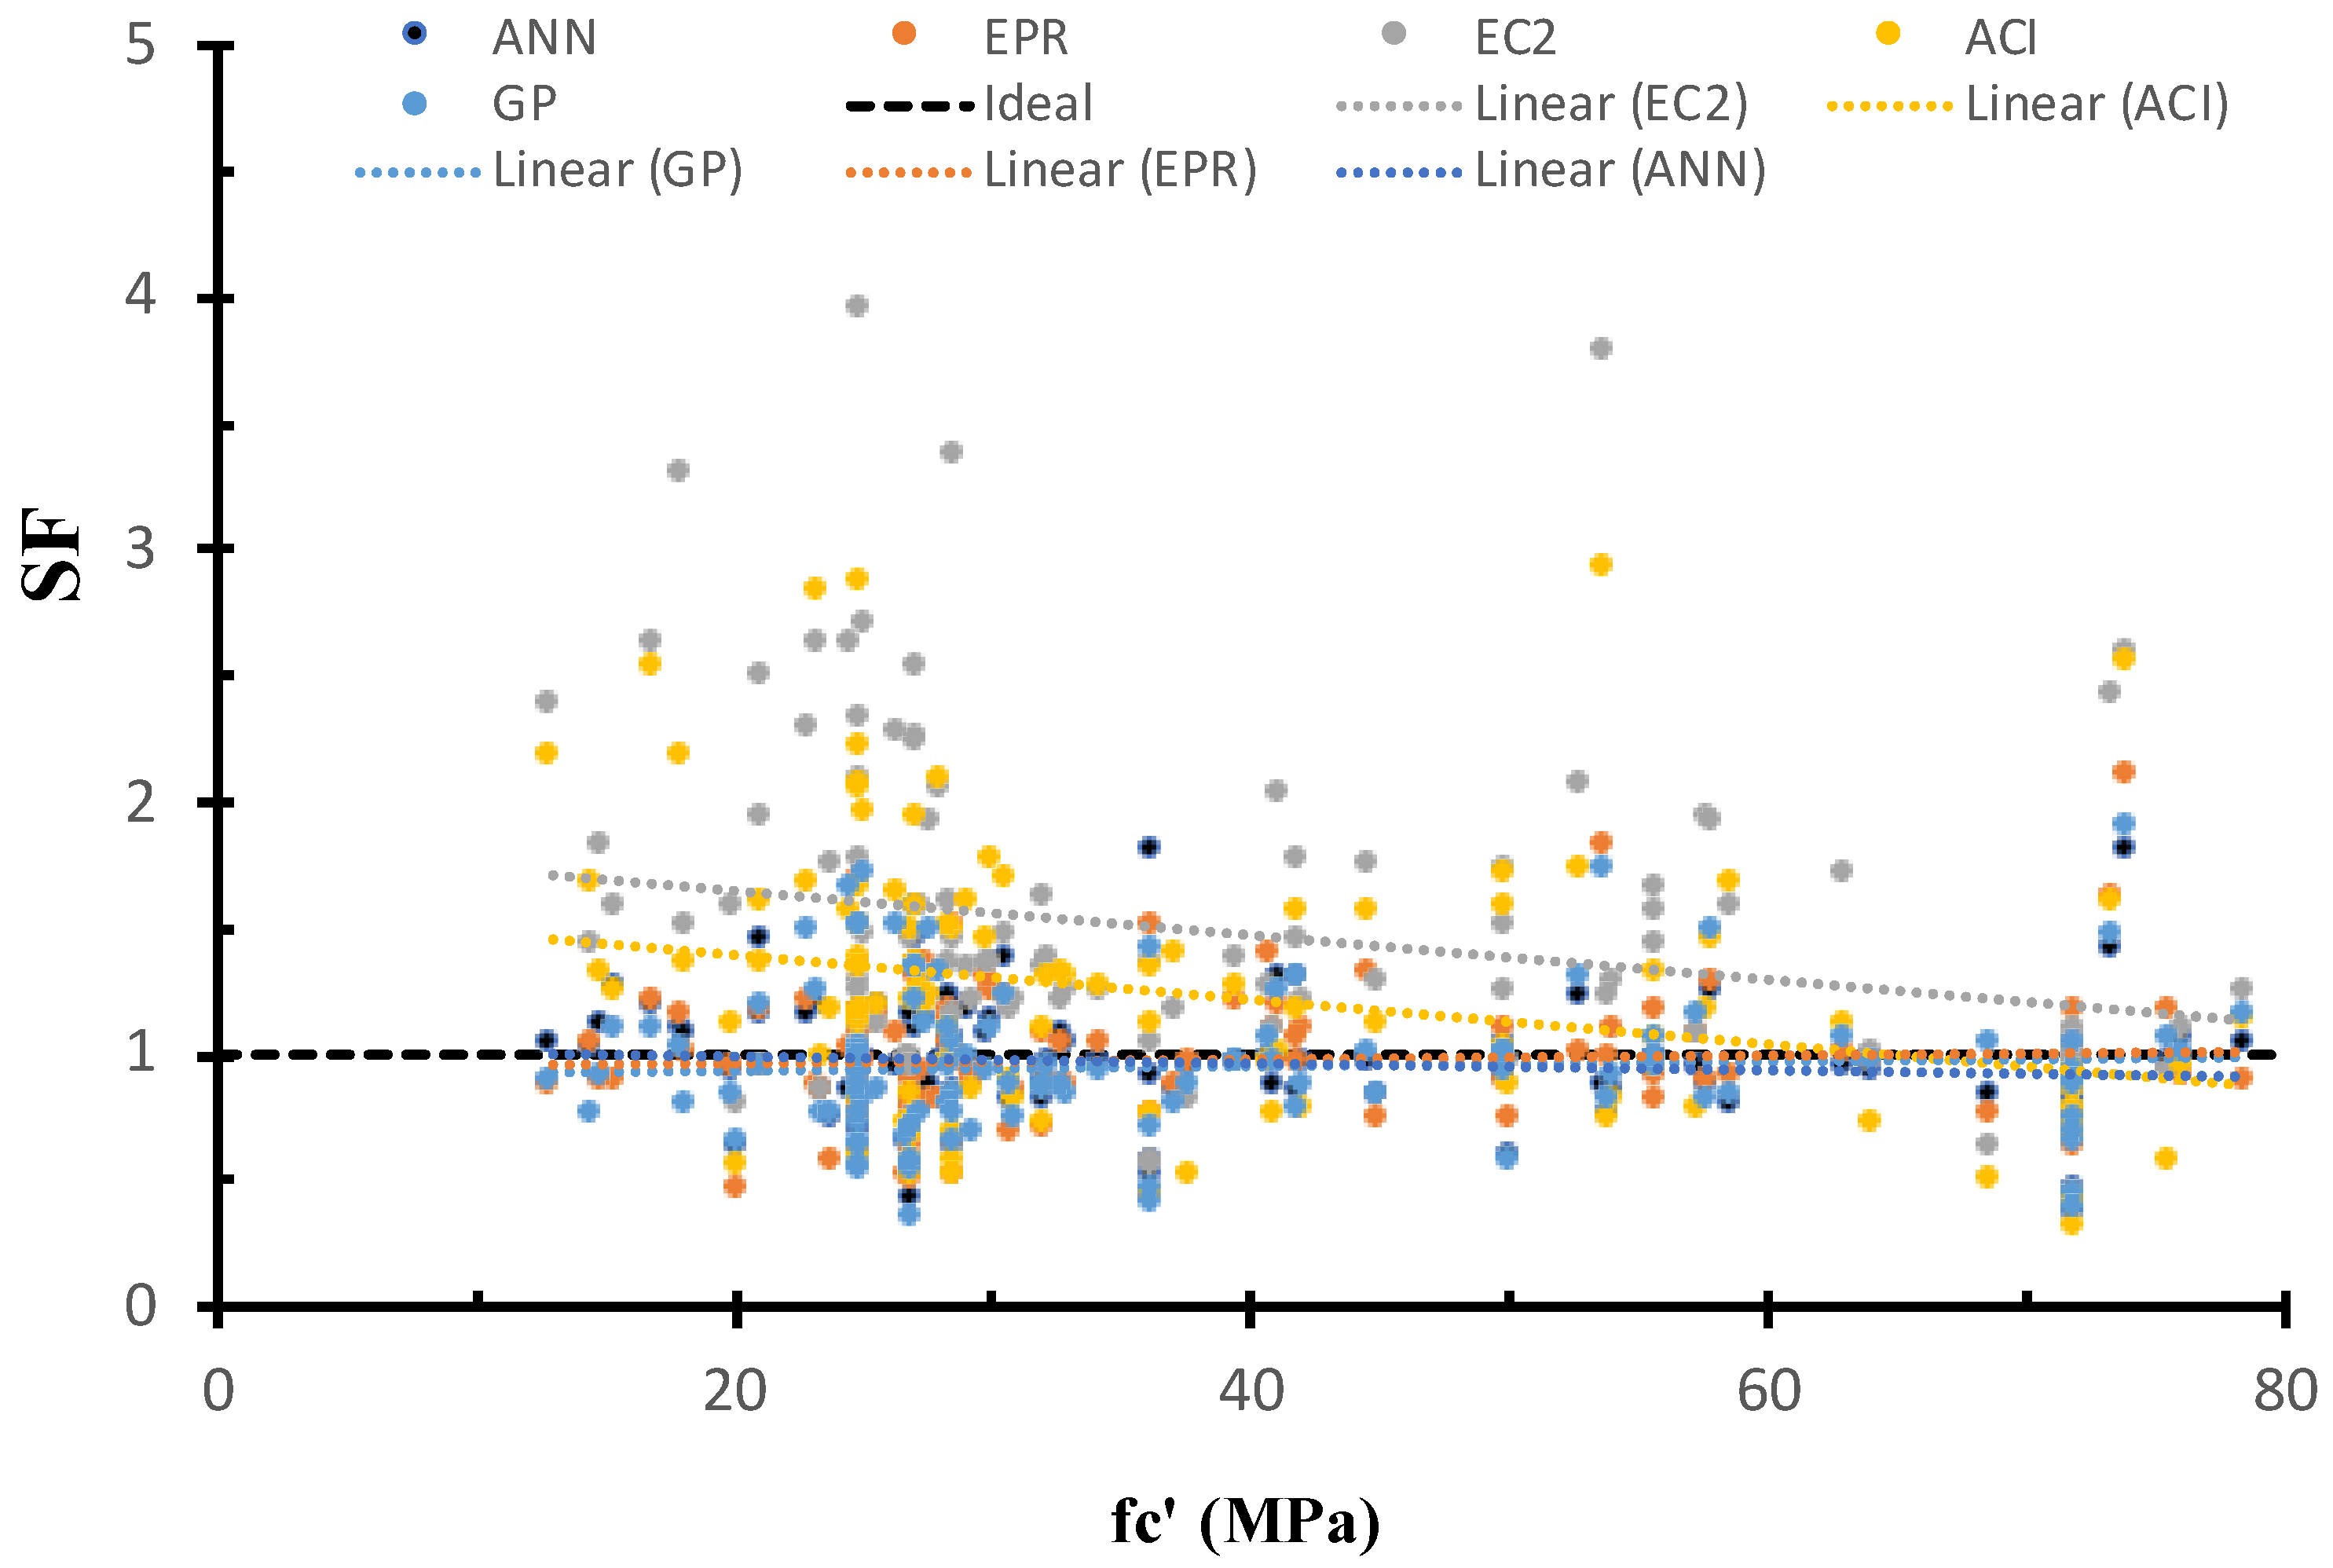
6.3. Safety of Various Models Versus Concrete Compressive Strength
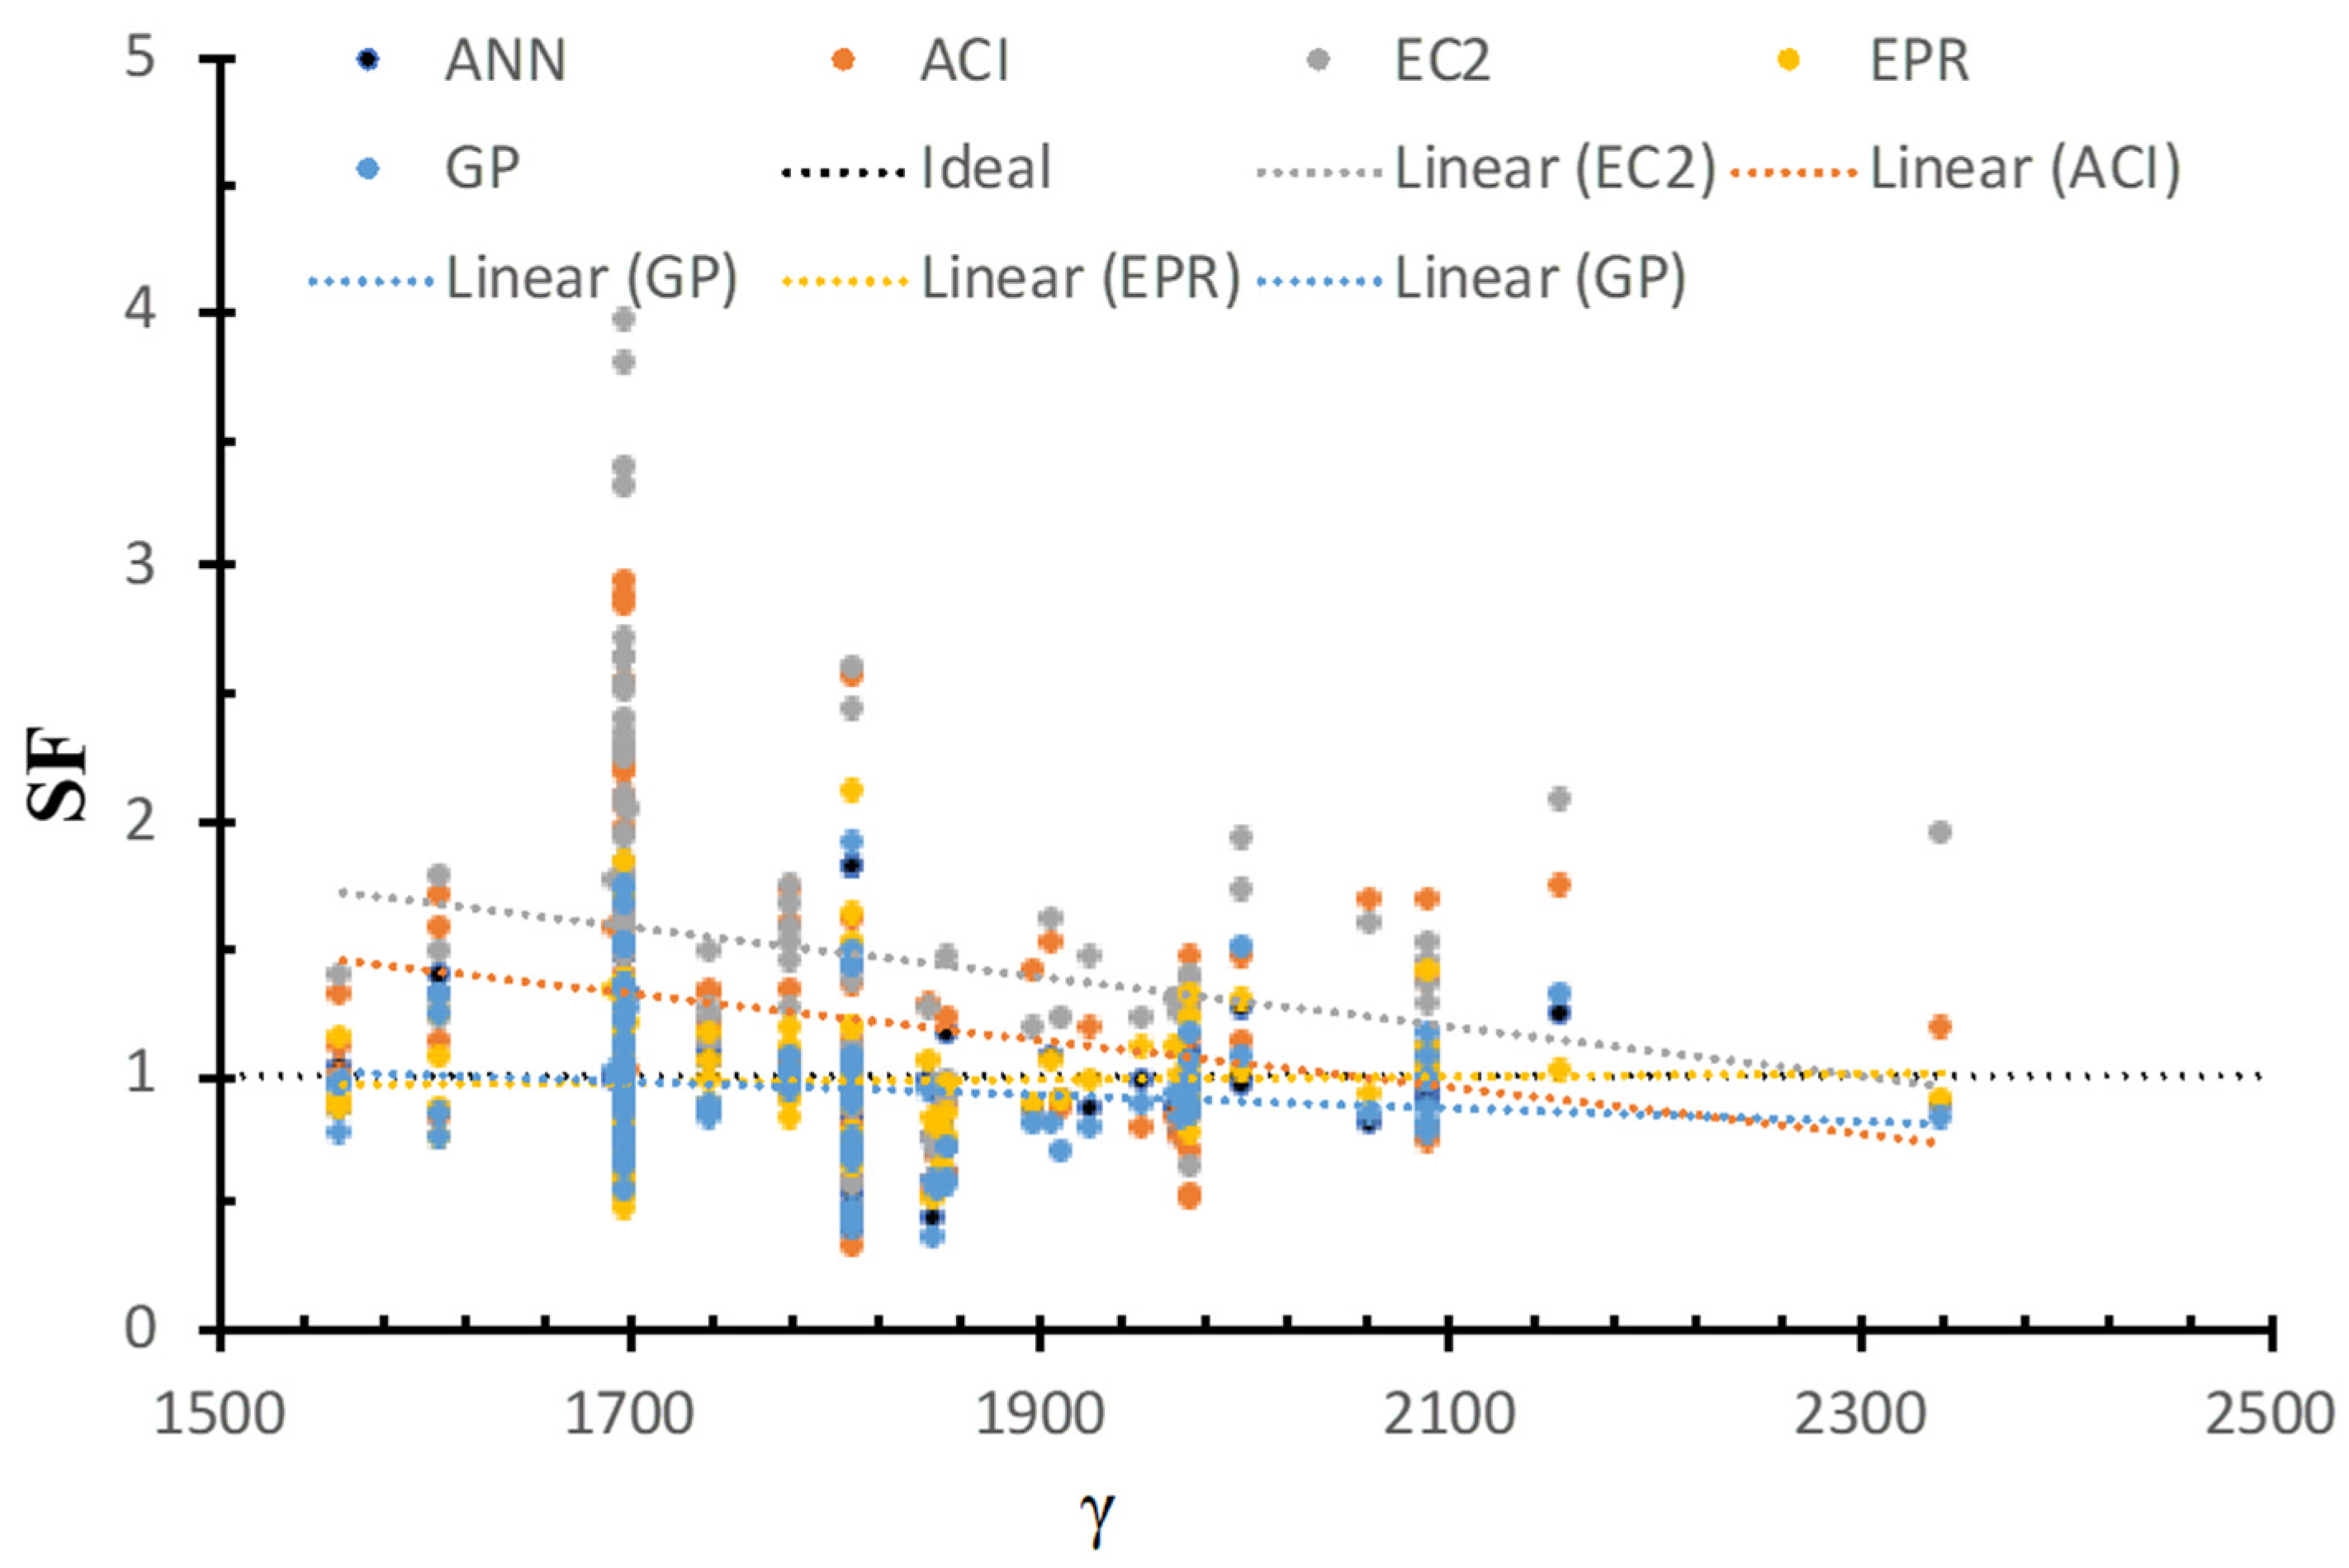
6.4. Safety of Various Models Versus Concrete Density
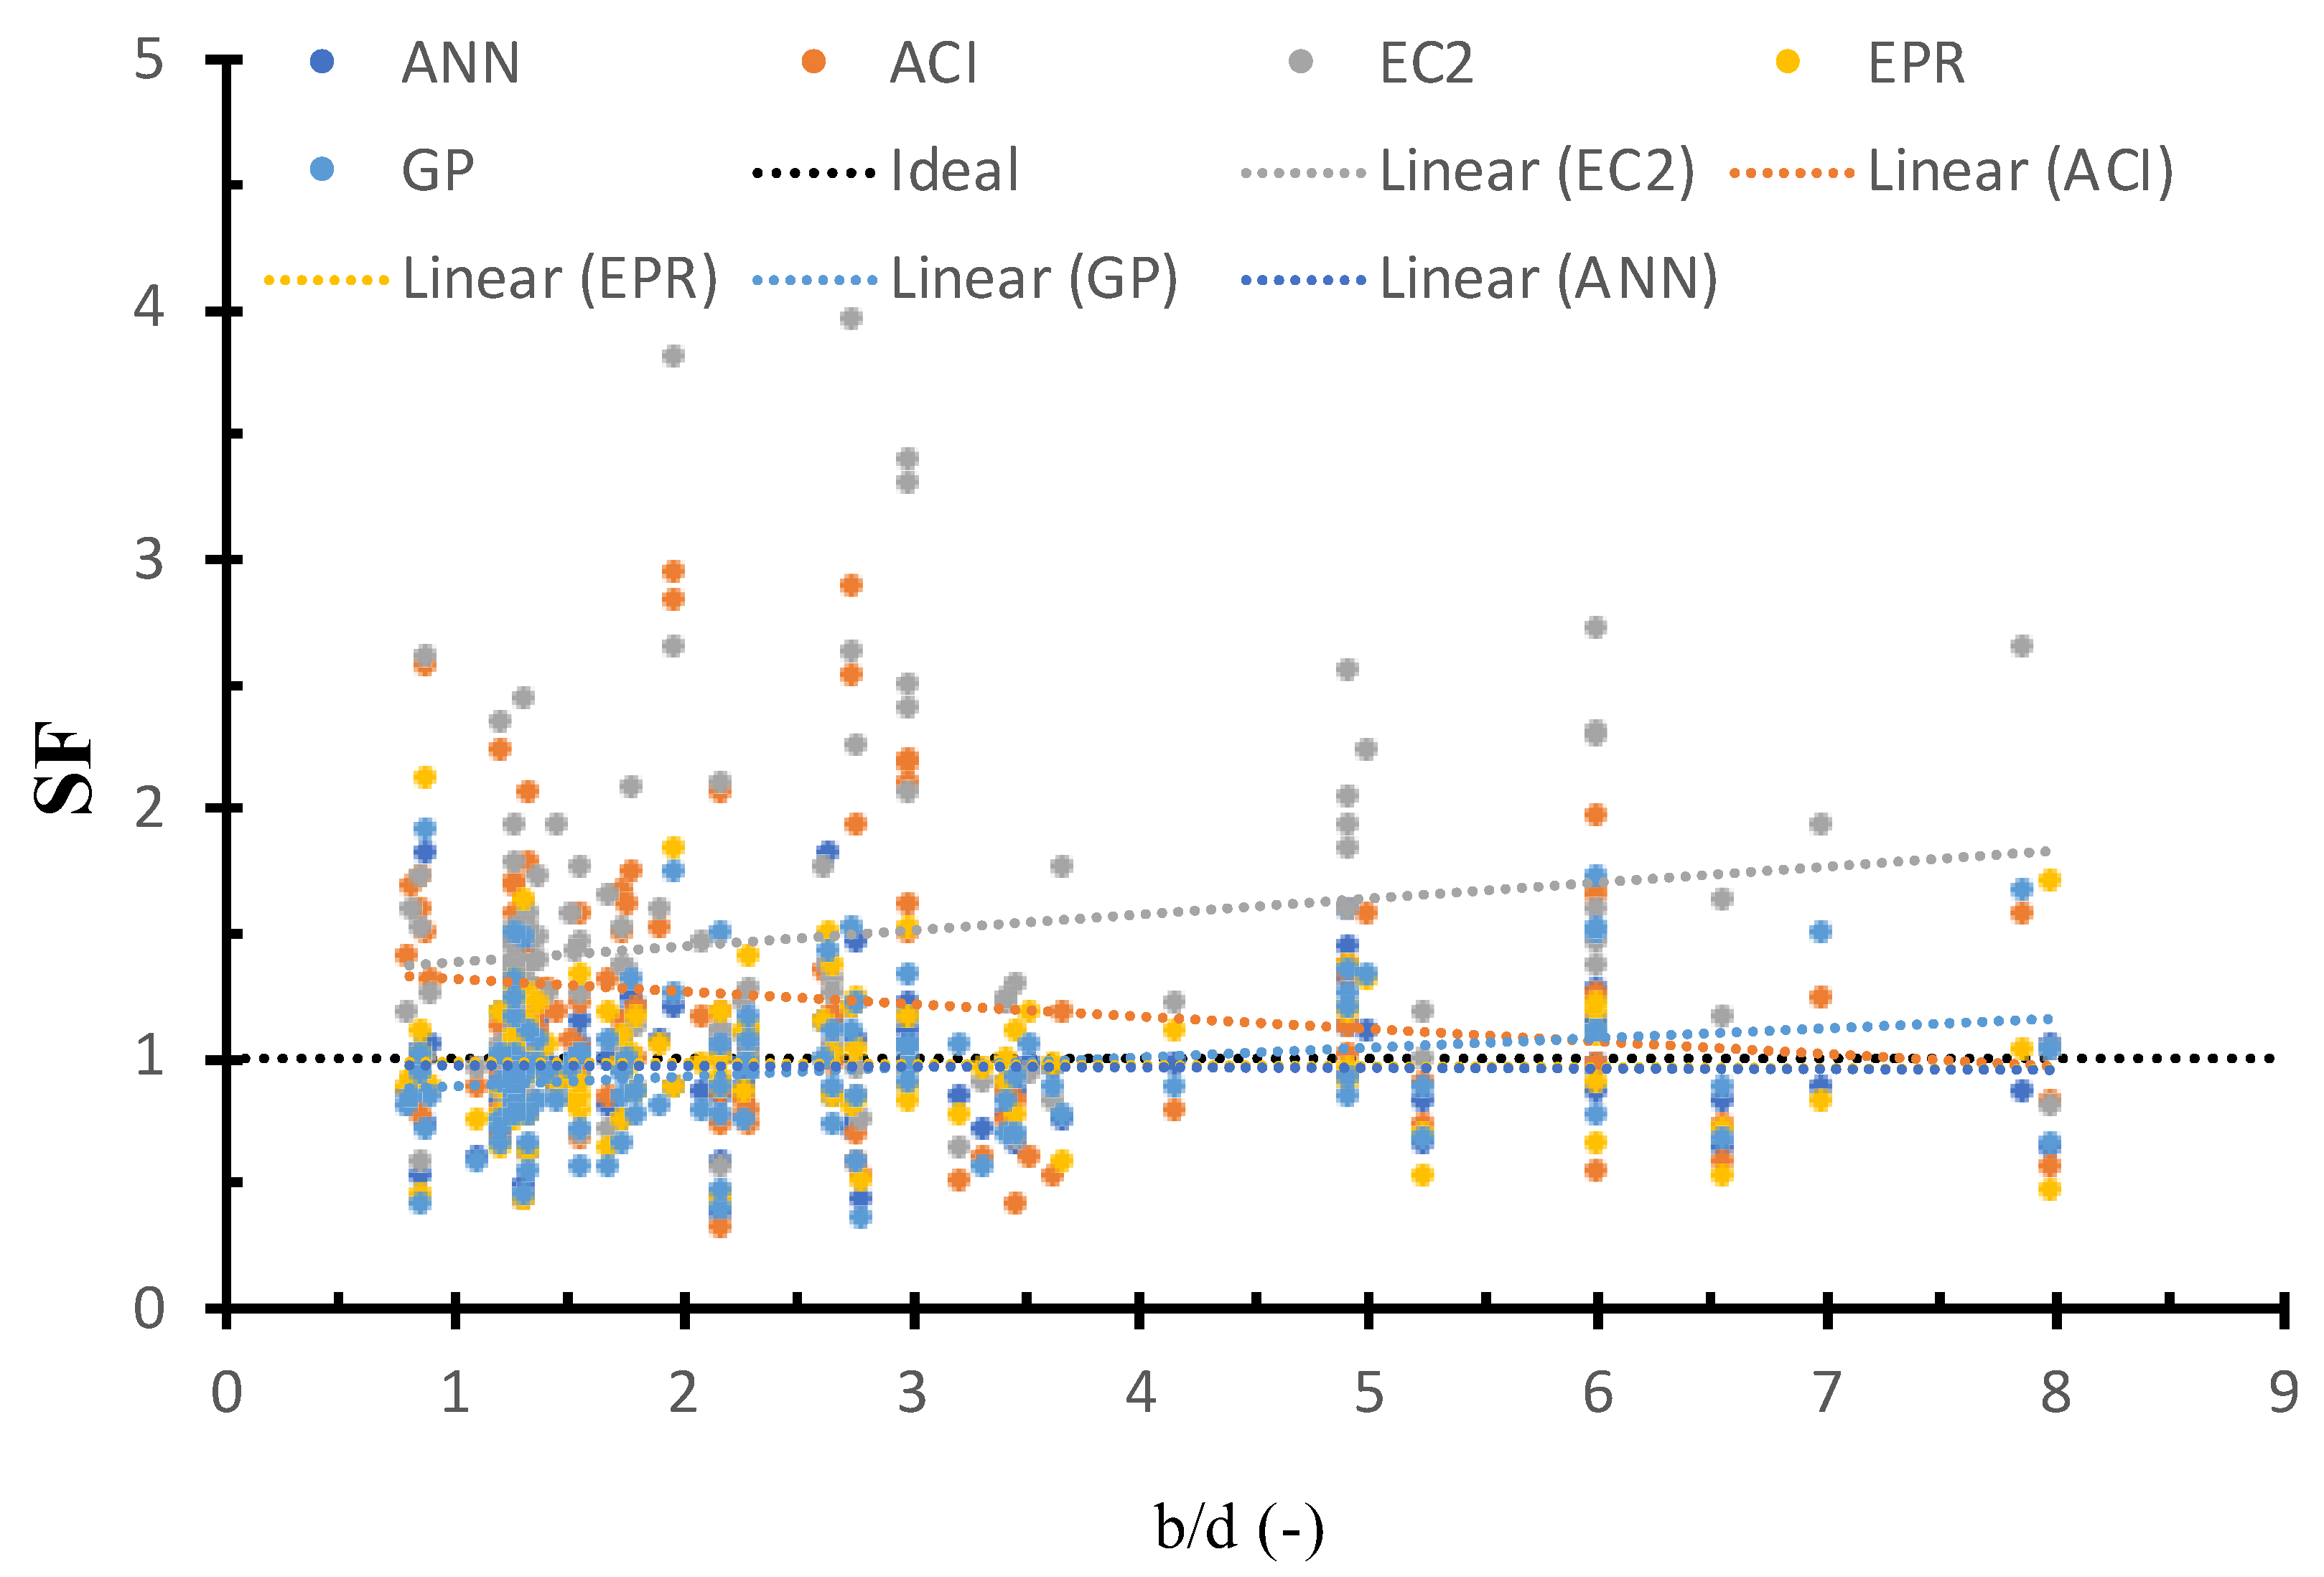
6.5. Safety of Various Models Versus Column Dimension to Depth Ratio
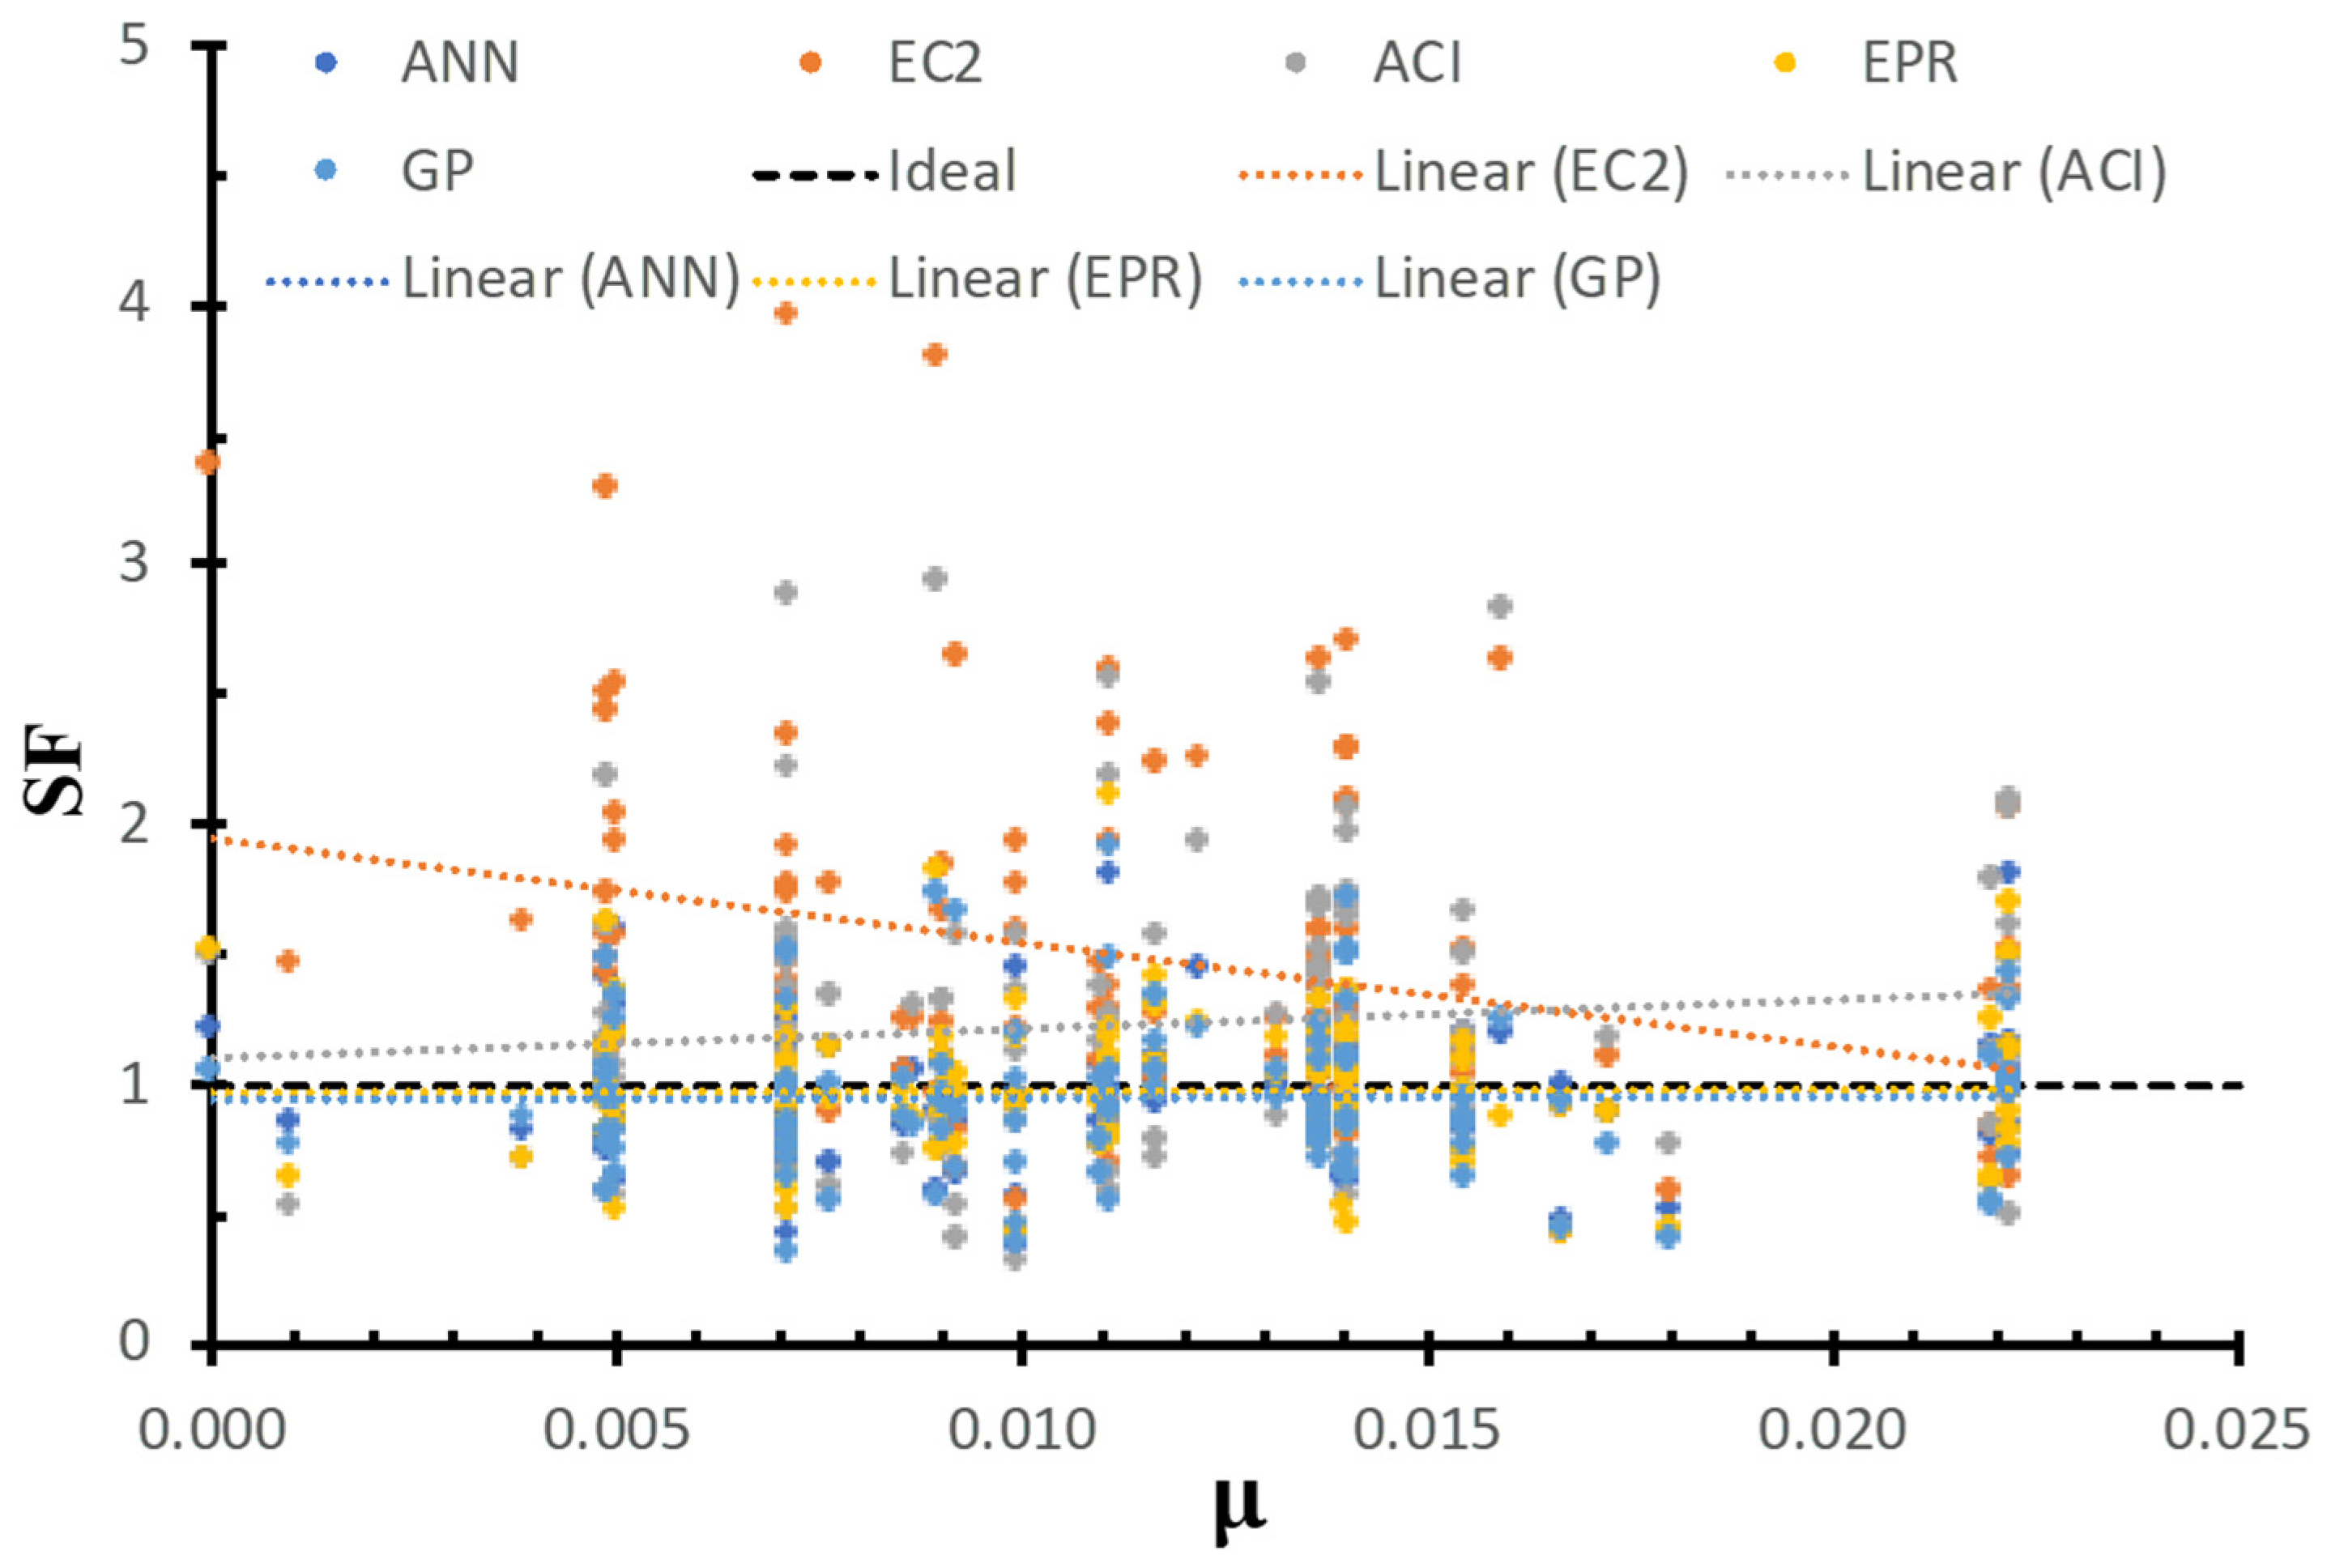
6.6. Safety of Various Models Versus Flexure Reinforcements
7. Future Studies
- Design code development for cases of tension forces [48].
- The behavior of full-scale slabs with thickness larger than 180 mm.
- The effect of using fibers in the concrete mix of lightweight concrete on the punching shear strength.
8. Conclusions
- Both (ANN) and (EPR) have the greatest prediction accuracy (73.9% and 73.6%, respectively), whereas the (GP) model has the lowest prediction accuracy (67.6%);
- (GP) and (EPR) have almost the same level of accuracy (65.3% and 68.1%, respectively);
- Although the error% of the (ANN) and (EPR) models are so close, the output of (EPR) is closed-form equations, which could be used manually or as software, unlike the (ANN) output, which cannot be used manually;
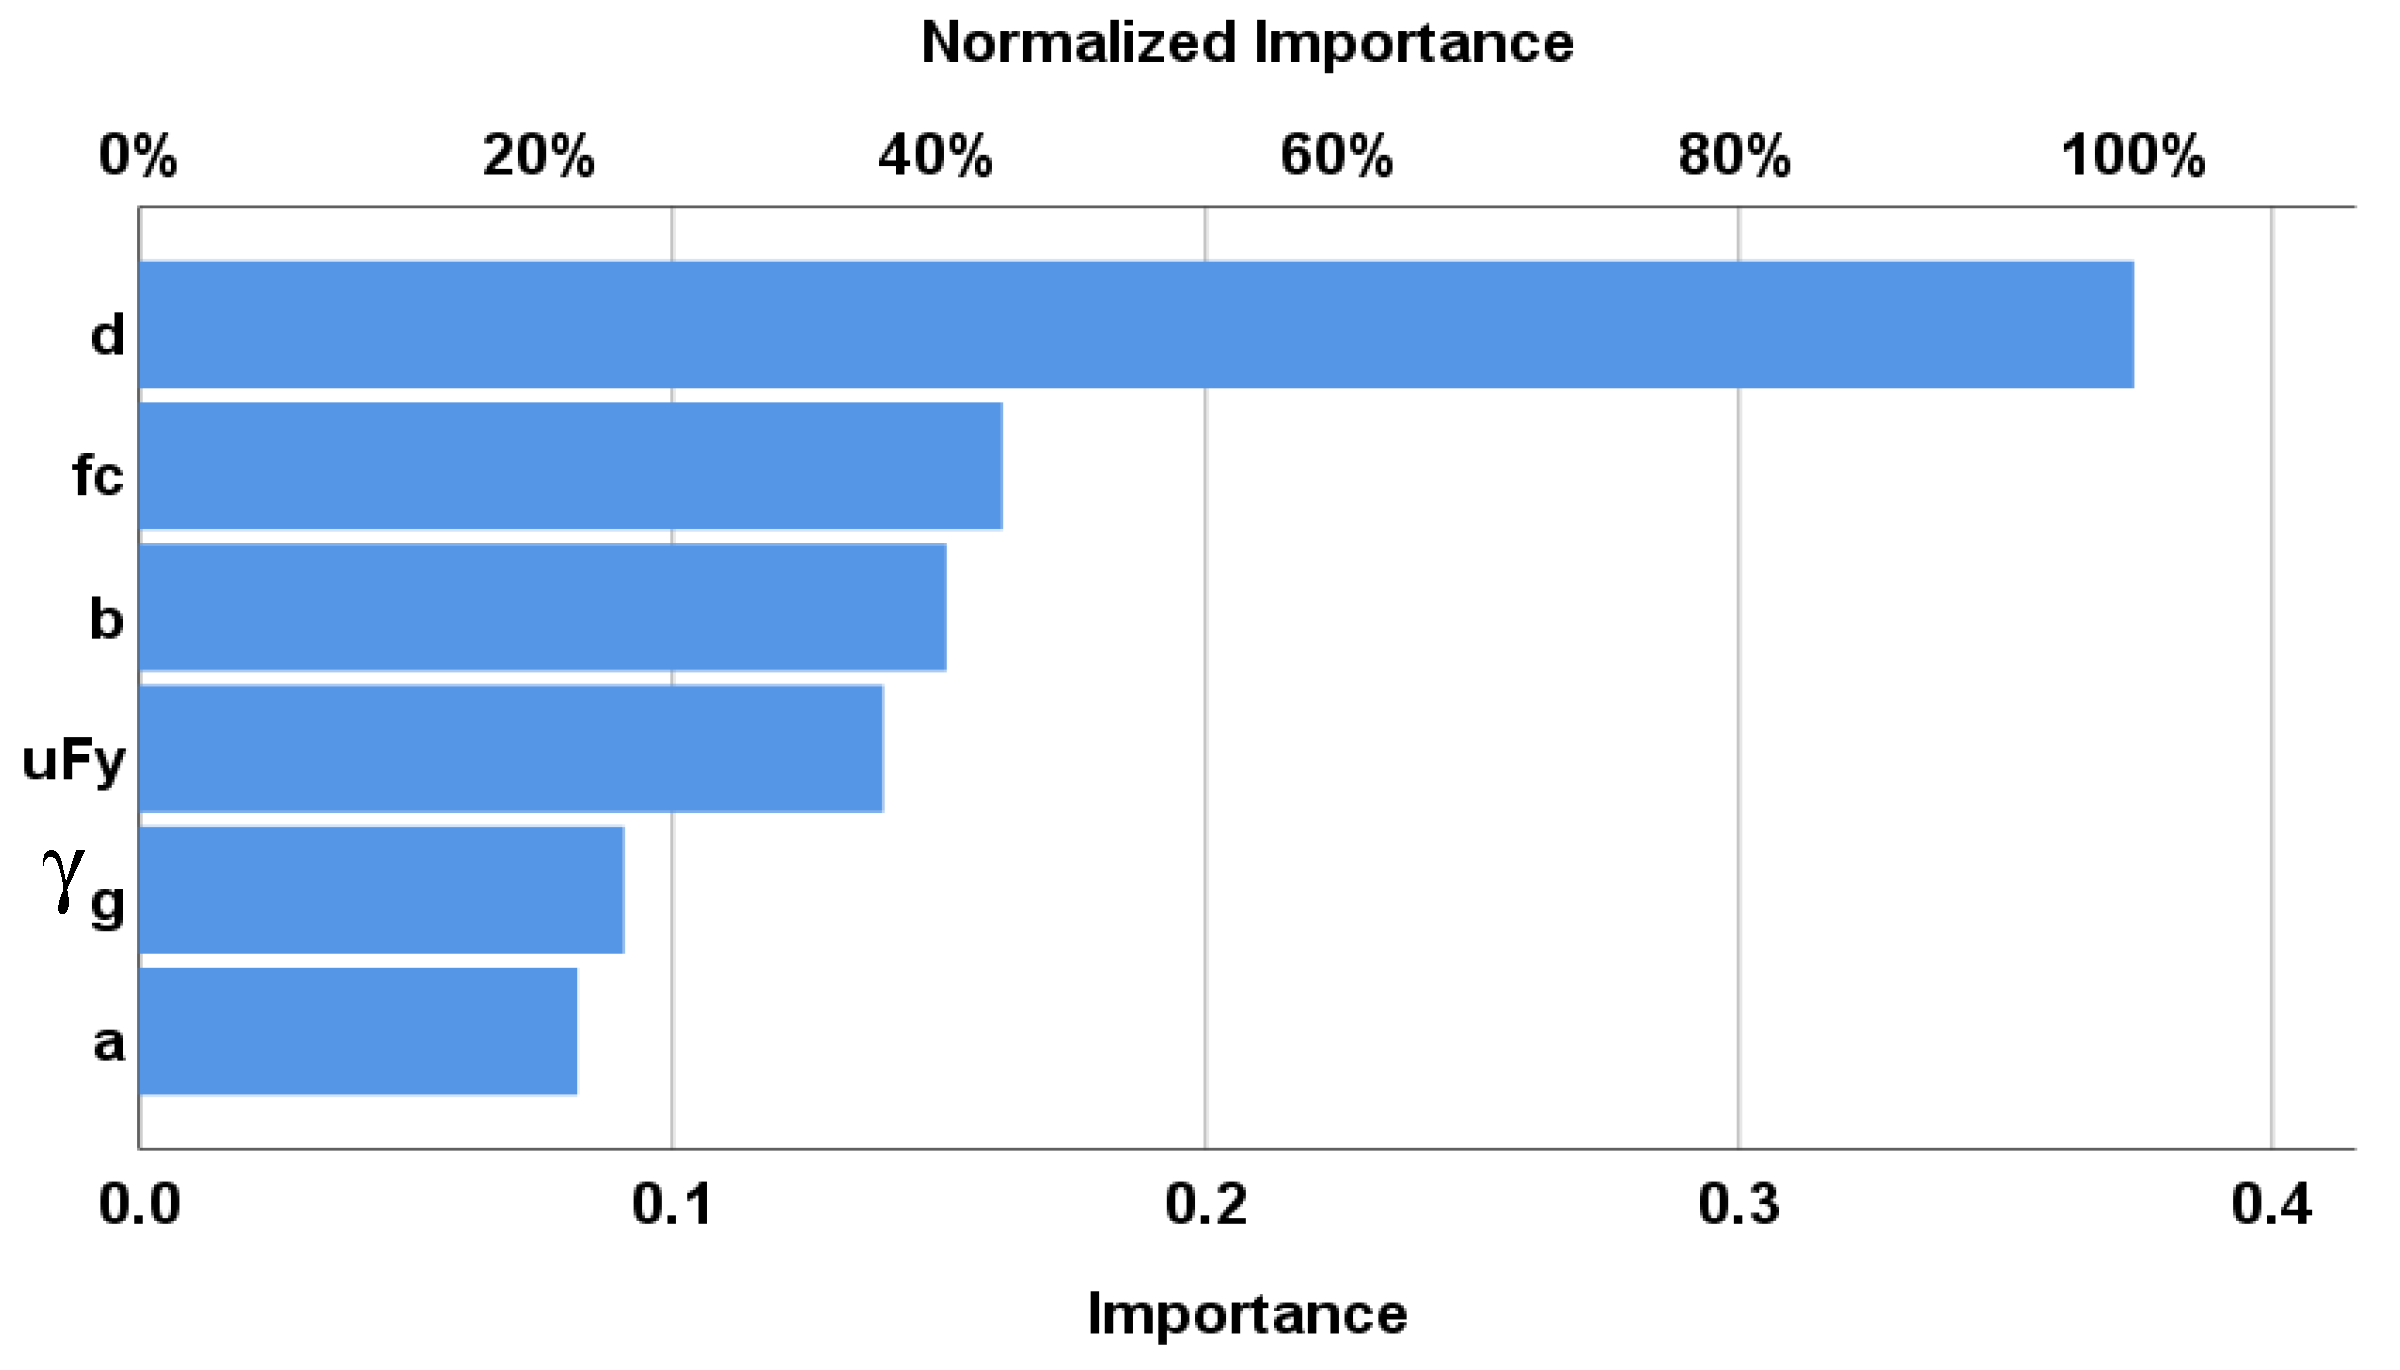
- The summation of the absolute weights of each neuron in the input layer of the developed (ANN) model indicates that the slab depth (d) has a major influence on the punching capacity; other parameters have a minor effect, especially the compressive strength of the concrete;
- The formula developed using (EPR) did not include the parameter (), which indicates its minor effect on the punching capacity.
- The GA technique successfully reduced the 210 terms of the conventional polynomial regression quadrilateral formula to only ten terms without significant impact on its accuracy.
- AI models captured the true behavior and overcame the variability of the traditional design codes concerning the effective parameters.
Author Contributions
Funding
Data Availability Statement
Conflicts of Interest
References
- Collins, M.P.; Vecchio, F.J.; Selby, R.G.; Gupta, P.R. The failure of an offshore platform. Concr. Int. 1997, 19, 28–34. [Google Scholar]
- New Civil Engineer. Shock Collapse Sparks Lift Slab Fears and safety Experts Urge Car Park Review. March 27–April 3; New Civil Engineer: London, UK, 1997; pp. 3–4. [Google Scholar]
- Aoude, H.; Cook, W.D.; Mitchell, D. Two-way slab parking structures in Canada. Concr. Int. 2013, 35, 47–54. [Google Scholar]
- Kotsovos, M.D. Reinforced Concrete Shear Design: Shortcomings and Remedy. ACI Struct. J. 2017, 114, 1055–1066. [Google Scholar] [CrossRef]
- Halvoník, J.; Kalická, J.; Majtánová, L.; Minárová, M. Reliability of models aimed at evaluating the punching resistance of flat slabs without transverse reinforcement. Eng. Struct. 2019, 188, 627–636. [Google Scholar] [CrossRef]
- EC2; Eurocode 2: Design of Concrete Structures—Part 1–1: General Rules and Rules for Buildings; Incl. Corrigendum 1: EN 1992-1-1:2004/AC:2008, incl. Corrigendum 2: EN 1992-1-1:2004/AC:2010, incl. Amendment 1: EN 1992-1–1:2004/A1. EN 1992-1-1:2004. British Standard Institution: London, UK, 2014.
- MC, Fédération Internationale Du Béton. Fib Model Code for Concrete Structures 2010; Fédération Internationale Du Béton: Lausanne, Switzerland, 2013. [Google Scholar]
- ACI-318-19, ACI Committee 318; Building Code Requirements for Structural Concrete (ACI 318–19) and Commentary on Building Code Requirements (ACI 318-19); American Concrete Institute: Farmington Hills, MI, USA, 2019.
- Deifalla, A. Punching shear strength and deformation for FRP-reinforced concrete slabs without shear reinforcements. Case Stud. Constr. Mater. 2022, 16, e00925. [Google Scholar] [CrossRef]
- Deifalla, A. A strength and deformation model for prestressed lightweight concrete slabs under two-way shear. Adv. Struct. Eng. 2021, 24, 3144–3155. [Google Scholar] [CrossRef]
- Deifalla, A. A comparative study and a simplified formula for punching shear design of concrete slabs with or without membrane tensile forces. Structures 2021, 33, 1936–1953. [Google Scholar] [CrossRef]
- Deifalla, A. A mechanical model for concrete slabs subjected to combined punching shear and in-plane tensile forces. Eng. Struct. 2021, 231, 111787. [Google Scholar] [CrossRef]
- Deifalla, A. Strength and ductility of lightweight reinforced concrete slabs under punching shear. Structures 2020, 27, 2329–2345. [Google Scholar] [CrossRef]
- Deifalla, A. Design of lightweight concrete slabs under two-way shear without shear reinforcements: A comparative study and a new formula. Eng. Struct. 2020, 222, 111076. [Google Scholar] [CrossRef]
- Deifalla, A.; Awad, A.; Seleem, H.; Abdelrahman, A. Experimental and numerical investigation of the behavior of LWFC L-girders under combined torsion. Structures 2020, 26, 362–377. [Google Scholar] [CrossRef]
- Deifalla, A.; Awad, A.; Seleem, H.; Abdelrahman, A. Investigating the behavior of lightweight foamed concrete T-beams under torsion, shear, and flexure. Eng. Struct. 2020, 219, 110741. [Google Scholar] [CrossRef]
- Deifalla, A. Torsion design of lightweight concrete beams without or with fibers: A comparative study and a refined cracking torque formula. Structures 2020, 28, 786–802. [Google Scholar] [CrossRef]
- Tavakoli, K.; Pour-Aboughadareh, A.; Kianersi, F.; Poczai, P.; Etminan, A.; Shooshtari, L. Applications of CRISPR-Cas9 as an advanced genome editing system in life sciences. BioTech 2021, 10, 14. [Google Scholar] [CrossRef]
- Deifalla, A. Refining the torsion design of fibered concrete beams reinforced with FRP using multi-variable non-linear regression analysis for experimental results. Eng. Struct. 2020, 226, 111394. [Google Scholar] [CrossRef]
- Saleh, A.; Fathy, A.; Farouk, A.; Nasser, M. Performance of Steel Fiber Reinforced Concrete Corbels. Int. Res. J. Innov. Eng. Technol. 2019, 3, 22–27. [Google Scholar]
- ACI 213R–03; Guide for Structural Lightweight-Aggregate Concrete. ACI Committee 213 2014; American Concrete Institute: Farmington Hills, MI, USA, 2014.
- Greene, G.; Graybeal, B. Lightweight Concrete: Mechanical Properties; Report No. FHWA-HRT-13-062; Federal Highway Administration: Washington, DC, USA, 2013; p. 12. [Google Scholar]
- Greene, G.; Graybeal, B. Lightweight Concrete: Shear Performance; Report No. FHWA-HRT-15-022; Federal Highway Administration: Washington, DC, USA, 2015; p. 20. [Google Scholar]
- Kuchma, D.A.; Wei, S.; Sanders, D.H.; Belarbi, A.; Novak, L.C. Development of One-Way Shear Design Provisions of ACI 318-19 for Reinforced Concrete. ACI Struct. J. 2019, 116, 285–295. [Google Scholar] [CrossRef]
- Muttoni, A.; Fernández Ruiz, M.; Bentz, E.; Foster, S.; Sigrist, V. Background to Fib Model Code 2010 Shear Provisions—Part II: Punching Shear. Struct. Concr. 2013, 14, 204–214. [Google Scholar] [CrossRef]
- Muttoni, A.; Ruiz, M.F. The levels-of-approximation approach in MC 2010: Application to punching shear provisions. Struct. Concr. 2012, 13, 32–41. [Google Scholar] [CrossRef] [Green Version]
- Muttoni, A.; Ruiz, M.F. The Critical Shear Crack Theory for Punching Design: From a Mechanical Model to Closed-Form Design Expressions; The International Federation for Structural Concrete: Lausanne, Switzerland, 2017; pp. 237–252. [Google Scholar]
- Muttoni, A.D. ACI-Fib International Symposium on Punching Shear of Structural Concrete Slabs 2016: Honoring Neil M. Hawkins; ACI Special Publication 315; Curran Associates Inc.: Red Hook, NY, USA, 2017; pp. 237–252. [Google Scholar]
- Muttoni, A.; Ruiz, M.F.; Simões, J.T. The theoretical principles of the critical shear crack theory for punching shear failures and derivation of consistent closed-form design expressions. Struct. Concr. 2017, 19, 174–190. [Google Scholar] [CrossRef]
- Moe, J. Shearing Strength of Reinforced Concrete Slabs and Footings under Concentrated Loads; Development Department Bulletin D47, Portland Cement, Association: Skokie, IL, USA, 1961; p. 130. [Google Scholar]
- Hognestad, E.; Elstner, R.C.; Hanson, J.A. Shear strength of reinforced structural lightweight aggregate concrete slabs. ACI Struct. J. 1964, 61, 643–656. [Google Scholar]
- Ivy, C.B.; Ivey, D.L.; Buth, E. Shear strength of LW aggregate reinforced concrete flat slabs. ACI Struct. J. 1969, 66, 490–493. [Google Scholar]
- Clarke, J.L.; Birjandi, F.K. punching resistance of LW aggregate concrete slabs. Mag. Concr. Res. 1990, 152, 171–176. [Google Scholar] [CrossRef]
- Muttoni, A.; Ruiz, M.F. MC2010: The Critical Shear Crack Theory as a mechanical model for punching shear design and its application to code provisions. Fib Bull. 2010, 57, 31–60. [Google Scholar] [CrossRef]
- Muttoni, A. Punching Shear Strength of Reinforced Concrete Slabs without Transverse Reinforcement. ACI Struct. J. 2008, 105, 440–450. [Google Scholar] [CrossRef] [Green Version]
- Youm, K.S.; Jeon, H.K.; Parkn, Y.S.; Lee, S.H.; Moon, J. Experimental study on punching shear of lightweight concrete slab. In Proceedings of the Thirteenth East Asia-Pacific Conference on Structural Engineering and Construction (EASEC-13), Sapporo, Japan, 11–13 September 2013; Available online: http://hdl.handle.net/2115/54369 (accessed on 12 October 2013).
- Carmo, R.N.F.; Costa, H.; Rodrigues, M. Experimental study of punching failure in LWAC slabs with different strengths. Mater. Struct. 2015, 49, 2611–2626. [Google Scholar] [CrossRef]
- Gołdyn, M.; Krawczyk, Ł.; Ryżyński, W.; Urban, T. Experimental Investigations on Punching Shear of Flat Slabs Made from Lightweight Aggregate Concrete. Arch. Civ. Eng. 2018, 64, 293–306. [Google Scholar] [CrossRef] [Green Version]
- Caratelli, A.; Imperatore, S.; Meda, A.; Rinaldi, Z. Punching shear behavior of lightweight fiber reinforced concrete slabs. Compos. Part B Eng. 2016, 99, 257–265. [Google Scholar] [CrossRef]
- Mowrer, R.D.; Vanderbilt, M.D. A Study of the Shear Strength of Lightweight Reinforced Concrete Flat Plates; Structural Research Report No. 1; Civil Engineering Department, Colorado State University: Fort Collins, CO, USA, 1966; p. 77. [Google Scholar]
- Osman, M.; Marzouk, H.; Helmy, S. Behavior of high-strength LW concrete slabs under punching loads. ACI Struct. J. 2000, 97, 492–498. [Google Scholar]
- Marzouk, H.; Osman, M.; Helmy, S. Behavior of high-strength lightweight aggregate concrete slabs under column load and unbalanced moment. ACI Struct. J. 2000, 97, 860–866. [Google Scholar]
- Marzouk, H.; Osman, M.; Hussein, A. Cyclic loading of high-strength lightweight concrete slabs. ACI Struct. J. 2001, 98, 207–214. [Google Scholar]
- Urban, T.; Gołdyn, M.; Krawczyk, Ł.; Sowa, Ł. Experimental investigations on punching shear of lightweight aggregate concrete flat slabs. Eng. Struct. 2019, 197, 109371. [Google Scholar] [CrossRef]
- Zaher, A.A.; Abdelrahman, A.A.; Eldeib, A.S.; Mohamed, A.A. Punching shear behavior of Lightweight foamed RC slabs. Int. J. Appl. Innov. Eng. Manag. 2015, 4, 2319–4847. [Google Scholar]
- Ebid, A.M. 35 Years of (AI) in Geotechnical Engineering: State of the Art. Geotech. Geol. Eng. 2021, 39, 637–690. [Google Scholar] [CrossRef]
- Ebid, A.M.; Deifalla, A. Prediction of shear strength of FRP reinforced beams with and without stirrups using (GP) technique. Ain Shams Eng. J. 2021, 12, 2493–2510. [Google Scholar] [CrossRef]
- Deifalla, A. Assessment of One-way Shear Design of RC Elements Subjected to Axial Tension. Case Stud. Constr. Mater. 2021, 15, e00620. [Google Scholar] [CrossRef]
- Ahmed, M.; Tran, V.-L.; Ci, J.; Yan, X.-F.; Wang, F. Computational analysis of axially loaded thin-walled rectangular concrete-filled stainless steel tubular short columns incorporating local buckling effects. Structures 2021, 34, 4652–4668. [Google Scholar] [CrossRef]
- Ci, J.; Ahmed, M.; Tran, V.-L.; Jia, H.; Chen, S. Axial compressive behavior of circular concrete-filled double steel tubular short columns. Adv. Struct. Eng. 2022, 25, 259–276. [Google Scholar] [CrossRef]
- Tran, V.-L.; Kim, S.-E. A practical ANN model for predicting the PSS of two-way reinforced concrete slabs. Eng. Comput. 2021, 37, 2303–2327. [Google Scholar] [CrossRef]
- Luo, C.; Keshtegar, B.; Peng, S.; Osman, Z.T.; Xiao-Peng, N. Hybrid enhanced Monte Carlo simulation coupled with advanced machine learning approach for accurate and efficient structural reliability analysis. Comput. Methods Appl. Mech. Eng. 2022, 388, 114218. [Google Scholar] [CrossRef]


| γ | |||||||
|---|---|---|---|---|---|---|---|
| kN/m3 | m | m | m | MPa | MPa | kN | |
| Training set | |||||||
| Min. | 15.60 | 0.10 | 0.10 | 0.04 | 12.96 | 1.05 | 29.00 |
| Max. | 23.40 | 0.40 | 0.46 | 0.18 | 78.40 | 9.48 | 914.00 |
| Avg. | 18.00 | 0.19 | 0.22 | 0.10 | 37.98 | 4.52 | 245.38 |
| SD | 1.38 | 0.07 | 0.11 | 0.04 | 18.43 | 2.13 | 181.90 |
| VAR | 0.08 | 0.39 | 0.49 | 0.37 | 0.49 | 0.47 | 0.74 |
| Validation set | |||||||
| Min. | 15.60 | 0.11 | 0.11 | 0.04 | 21.10 | 0.00 | 46.59 |
| Max. | 21.56 | 0.41 | 0.46 | 0.18 | 72.00 | 8.56 | 1354.00 |
| Avg. | 17.79 | 0.19 | 0.24 | 0.10 | 37.93 | 4.79 | 282.99 |
| SD | 1.51 | 0.09 | 0.13 | 0.04 | 14.08 | 2.11 | 256.77 |
| VAR | 0.08 | 0.49 | 0.56 | 0.39 | 0.37 | 0.44 | 0.91 |
| Mechanism | EC2 | ACI |
|---|---|---|
| Friction across crack in terms of . | √ | √ |
| Dowel action mechanism in terms of . | √ | × |
| Concrete type in terms of . | √ | √ |
| Column dimension in terms of a, b | × | × |
| Direct shear mechanism in terms of compression zone depth in the strength. | × | × |
| Size effect in terms of . | √ | √ |
| Aggregate interlock mechanism in terms of aggregate size and type. | × | × |
| Arch action mechanism in terms of shear span to depth ratio. | × | × |
| Flexure capacity of the slab cross section. | × | × |
| γ | |||||||
|---|---|---|---|---|---|---|---|
| Γ | 1.00 | ||||||
| 0.07 | 1.00 | ||||||
| −0.15 | 0.55 | 1.00 | |||||
| 0.34 | 0.21 | 0.30 | 1.00 | ||||
| 0.39 | 0.28 | −0.03 | 0.44 | 1.00 | |||
| −0.02 | 0.15 | 0.15 | −0.15 | −0.16 | 1.00 | ||
| 0.38 | 0.46 | 0.39 | 0.78 | 0.40 | 0.05 | 1.00 |
| Technique | Model | SSE | Avg. Error % | R2 |
|---|---|---|---|---|
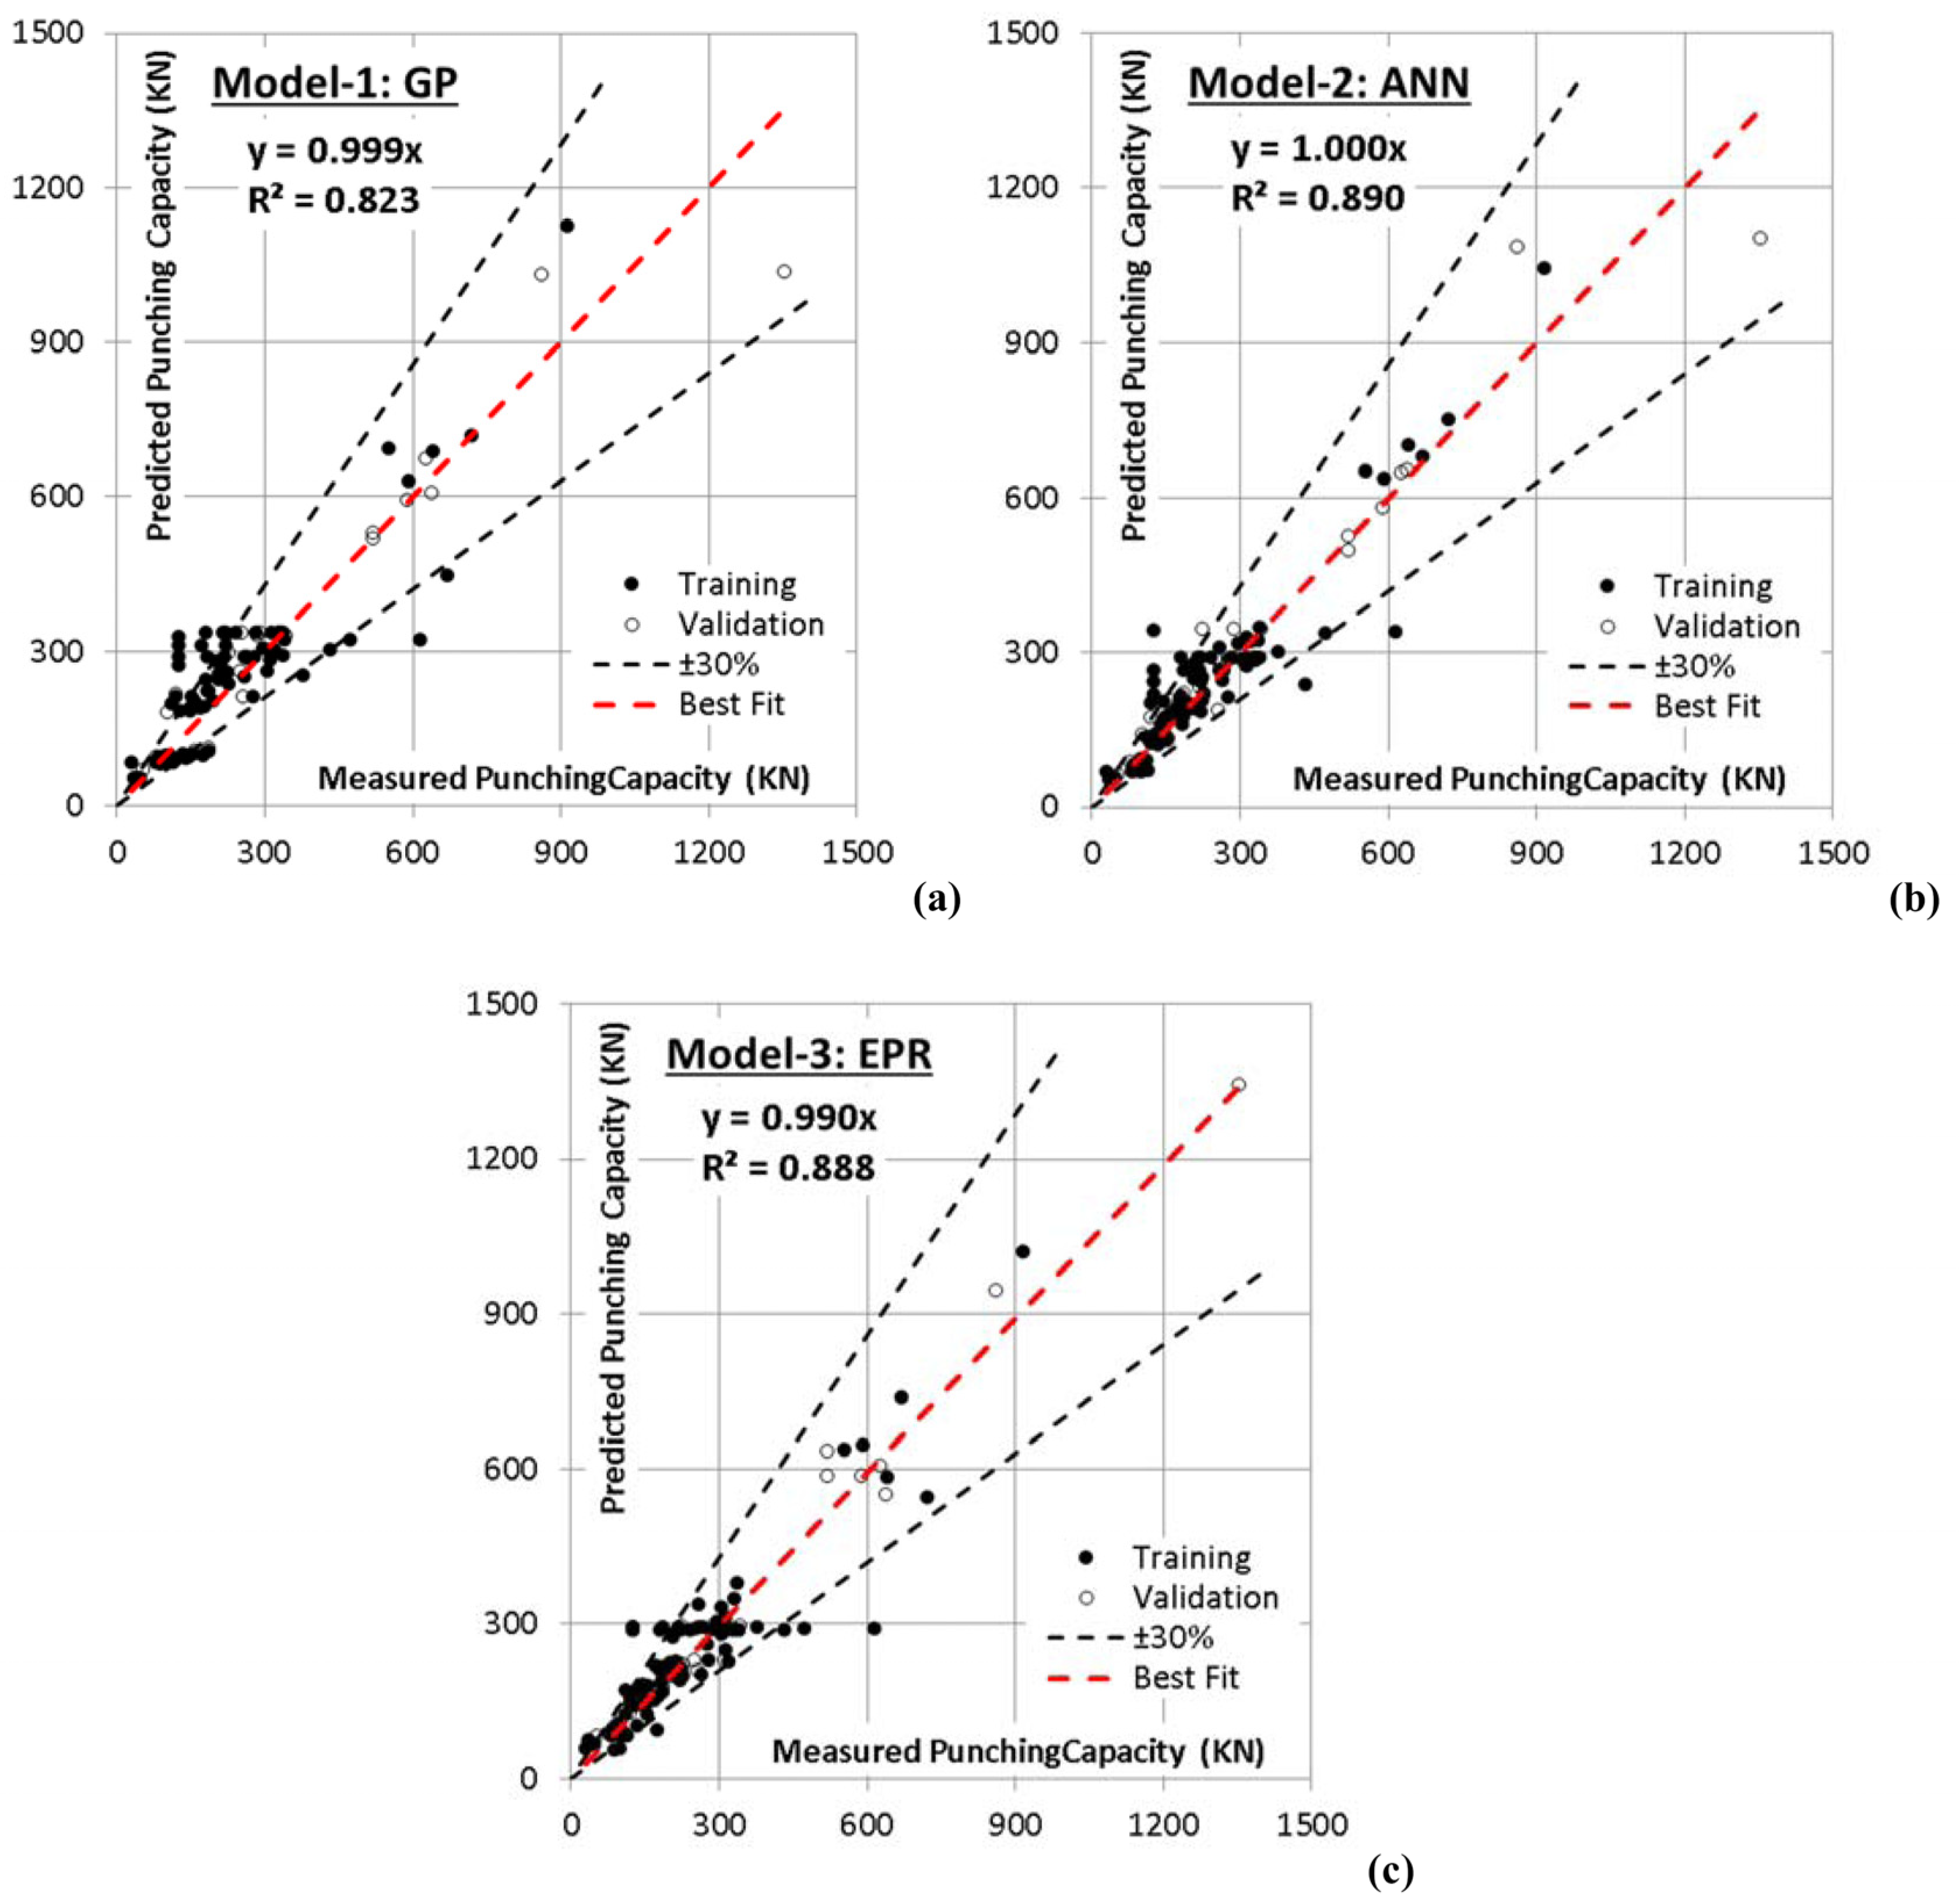
| GP | Equation (1) | 780,494 | 32.4 | 0.823 |
| ANN | Figure 2 | 506,732 | 26.1 | 0.890 |
| EPR | Equation (2) | 518,119 | 26.4 | 0.888 |
| Hidden Layer | ||||||||||||
| H (1:1) | H (1:2) | H (1:3) | H (1:4) | H (1:5) | H (1:6) | H (1:7) | H (1:8) | H (1:9) | H (1:10) | |||
| Input Layer | (Bias) | 1.10 | −0.50 | 0.07 | −0.09 | −0.23 | 0.14 | 0.26 | −0.12 | −0.53 | 0.15 | |
| γ | −0.22 | −0.19 | 0.02 | −0.51 | −0.38 | −0.04 | 0.68 | −1.42 | −0.06 | 0.05 | ||
| a | −0.24 | −0.03 | 0.47 | 0.14 | −0.19 | 0.35 | −0.84 | 0.05 | 0.43 | 0.23 | ||
| b | −0.79 | −0.81 | −0.18 | −0.14 | −0.13 | −0.16 | −0.19 | 0.13 | −0.67 | −0.03 | ||
| d | −0.51 | 1.57 | 0.16 | 0.01 | −0.13 | −0.52 | 0.22 | 0.43 | 0.38 | 0.33 | ||
| 0.40 | −0.73 | −0.19 | 0.13 | −0.16 | −0.47 | −0.16 | −0.75 | −0.24 | 0.14 | |||
| 0.33 | −0.30 | 0.07 | 0.09 | 0.15 | −0.11 | −0.29 | −0.59 | −0.32 | −0.71 | |||
| Hidden Layer | ||||||||||||
| Output layer | H (1:1) | H (1:2) | H (1:3) | H (1:4) | H (1:5) | H (1:6) | H (1:7) | H (1:8) | H (1:9) | H (1:10) | (Bias) | |
| −0.15 | −0.69 | 0.82 | −0.15 | 0.23 | 0.13 | −0.36 | −0.67 | −0.48 | −0.79 | 0.26 | ||
| GP | ANN | EPR | ACI | EC2 | |
| Maximum | 1.81 | 1.90 | 2.10 | 2.93 | 3.94 |
| Minimum | 0.36 | 0.35 | 0.42 | 0.31 | 0.43 |
| Average | 0.97 | 0.95 | 0.98 | 1.24 | 1.49 |
| C.O.V. | 25% | 31% | 29% | 43% | 44% |
| Lower 95% | 0.92 | 0.9 | 0.93 | 1.14 | 1.37 |
Publisher’s Note: MDPI stays neutral with regard to jurisdictional claims in published maps and institutional affiliations. |
© 2022 by the authors. Licensee MDPI, Basel, Switzerland. This article is an open access article distributed under the terms and conditions of the Creative Commons Attribution (CC BY) license (https://creativecommons.org/licenses/by/4.0/).
Share and Cite
Ebid, A.; Deifalla, A. Using Artificial Intelligence Techniques to Predict Punching Shear Capacity of Lightweight Concrete Slabs. Materials 2022, 15, 2732. https://doi.org/10.3390/ma15082732
Ebid A, Deifalla A. Using Artificial Intelligence Techniques to Predict Punching Shear Capacity of Lightweight Concrete Slabs. Materials. 2022; 15(8):2732. https://doi.org/10.3390/ma15082732
Chicago/Turabian StyleEbid, Ahmed, and Ahmed Deifalla. 2022. "Using Artificial Intelligence Techniques to Predict Punching Shear Capacity of Lightweight Concrete Slabs" Materials 15, no. 8: 2732. https://doi.org/10.3390/ma15082732
APA StyleEbid, A., & Deifalla, A. (2022). Using Artificial Intelligence Techniques to Predict Punching Shear Capacity of Lightweight Concrete Slabs. Materials, 15(8), 2732. https://doi.org/10.3390/ma15082732