1. Introduction
Filling an underground mining area can effectively reduce surface tailing volumes, which is a priority in the green development of mines. At present, most underground gold mines use classified tailings, which are usually classified coarse tailings, to fill empty underground areas while fine tailings are discharged to tailing depots. Fine tailing particles have small particle sizes and large specific surface area. These particles can easily affect the stability and impermeability of tailings in a dam, which may lead to the formation of hazardous dams [
1]. With the progress of solid waste utilization technology, coarse-grained tailings can be considered as a mineral in different applications [
2], such as building materials and roadbed construction [
3]. This development is a key measure to build tailless mines, reuse the resources of coarse-grained tailings after grading, fill underground empty areas with classified fine tailings, and achieve 100% comprehensive utilization of tailing resources [
4,
5,
6,
7]. In many metal mines, the tailings’ thickening and dewatering process is the premise of the paste filling process. In order to increase the settlement rate of tailings, it is convenient and operable to add a flocculation agent to the tailings slurry. Now flocculation settlement technology has been widely used in the thickening and dewatering of mine tailings [
8,
9,
10]. However, current studies on flocculation settlement characteristic are mainly based on unclassified tailings. It is generally known that classified fine tailings have a lower settlement rate, which seriously affects the efficiency and continuity of underground filling; thus, a flocculation agent should be added to speed up settlement.
Scholars have conducted a large number of indoor static experiments to examine the factors that affect tailing settlement. Du Jiafa [
11], Zhang Meidao [
12], Li Jinxin [
13], and Shi Caixing [
14] obtained the best flocculation agent consumption, and other parameters, by conducting a static flocculation settlement experiment on full tailings. In their flocculation settlement experiment, Gao Zhiyong [
15] optimized tailing concentration, flocculant solution, and dosage. Other scholars also studied the factors that affect tailing settlement by establishing mathematical models and equations. Wu Aixiang [
16,
17] obtained the best flocculation conditions and optimized the settling and flocculation parameters of tailings mortar based on super flocculation theory and the response surface method. Wen Zhenjiang [
18] studied the effect of multi-factor interaction on the settlement of whole tailings’ flocculation by establishing a regression model of the response surface. The evolution of the size of whole tailings under different flocculation conditions was explored by measuring the string length of the floc [
19]. However, few scholars characterized the micro-form and size of floc tailings from a microscopic perspective. Hou Hezi [
20] observed the flocculation samples of tailings through environmental scanning electron microscopy and studied the rate of flocculation settlement of tailings, which can be divided into five stages. Yang Zilong [
21] used magnetic resonance imaging to explore the distribution and porosity characteristics of floc apertures at different heights. The present paper focuses on exploring the factors that affect tailing flocculation through indoor static settlement experiments. The subjects are generally whole tailings or classified coarse tailings. Few studies with limited results were conducted on the subtle features of floc in classified fine tailings.
The present paper proposes to obtain samples of the best floc solution for classified fine tailings under single-consumption flocculant by means of an indoor static settlement experiment, including nuclear magnetic resonance observation and microscope scanning. The present paper also analyzes the porosity and aperture distribution characteristics of flocculation solution for tailings. The structural characteristics of floc under different flocculants are characterized at a microscopic perspective by analyzing the flocculation size, spatial distribution characteristics, particle size characteristics, and morphological characteristics of scanning electron microscope (SEM) images of floc. The results provide a scientific basis for selecting optimal flocculants.
2. Experimental Materials and Programs
2.1. Experimental Materials
2.1.1. Classified Fine Tailings
The experimental tailings used in the present paper were classified fine tailings from a gold mine.
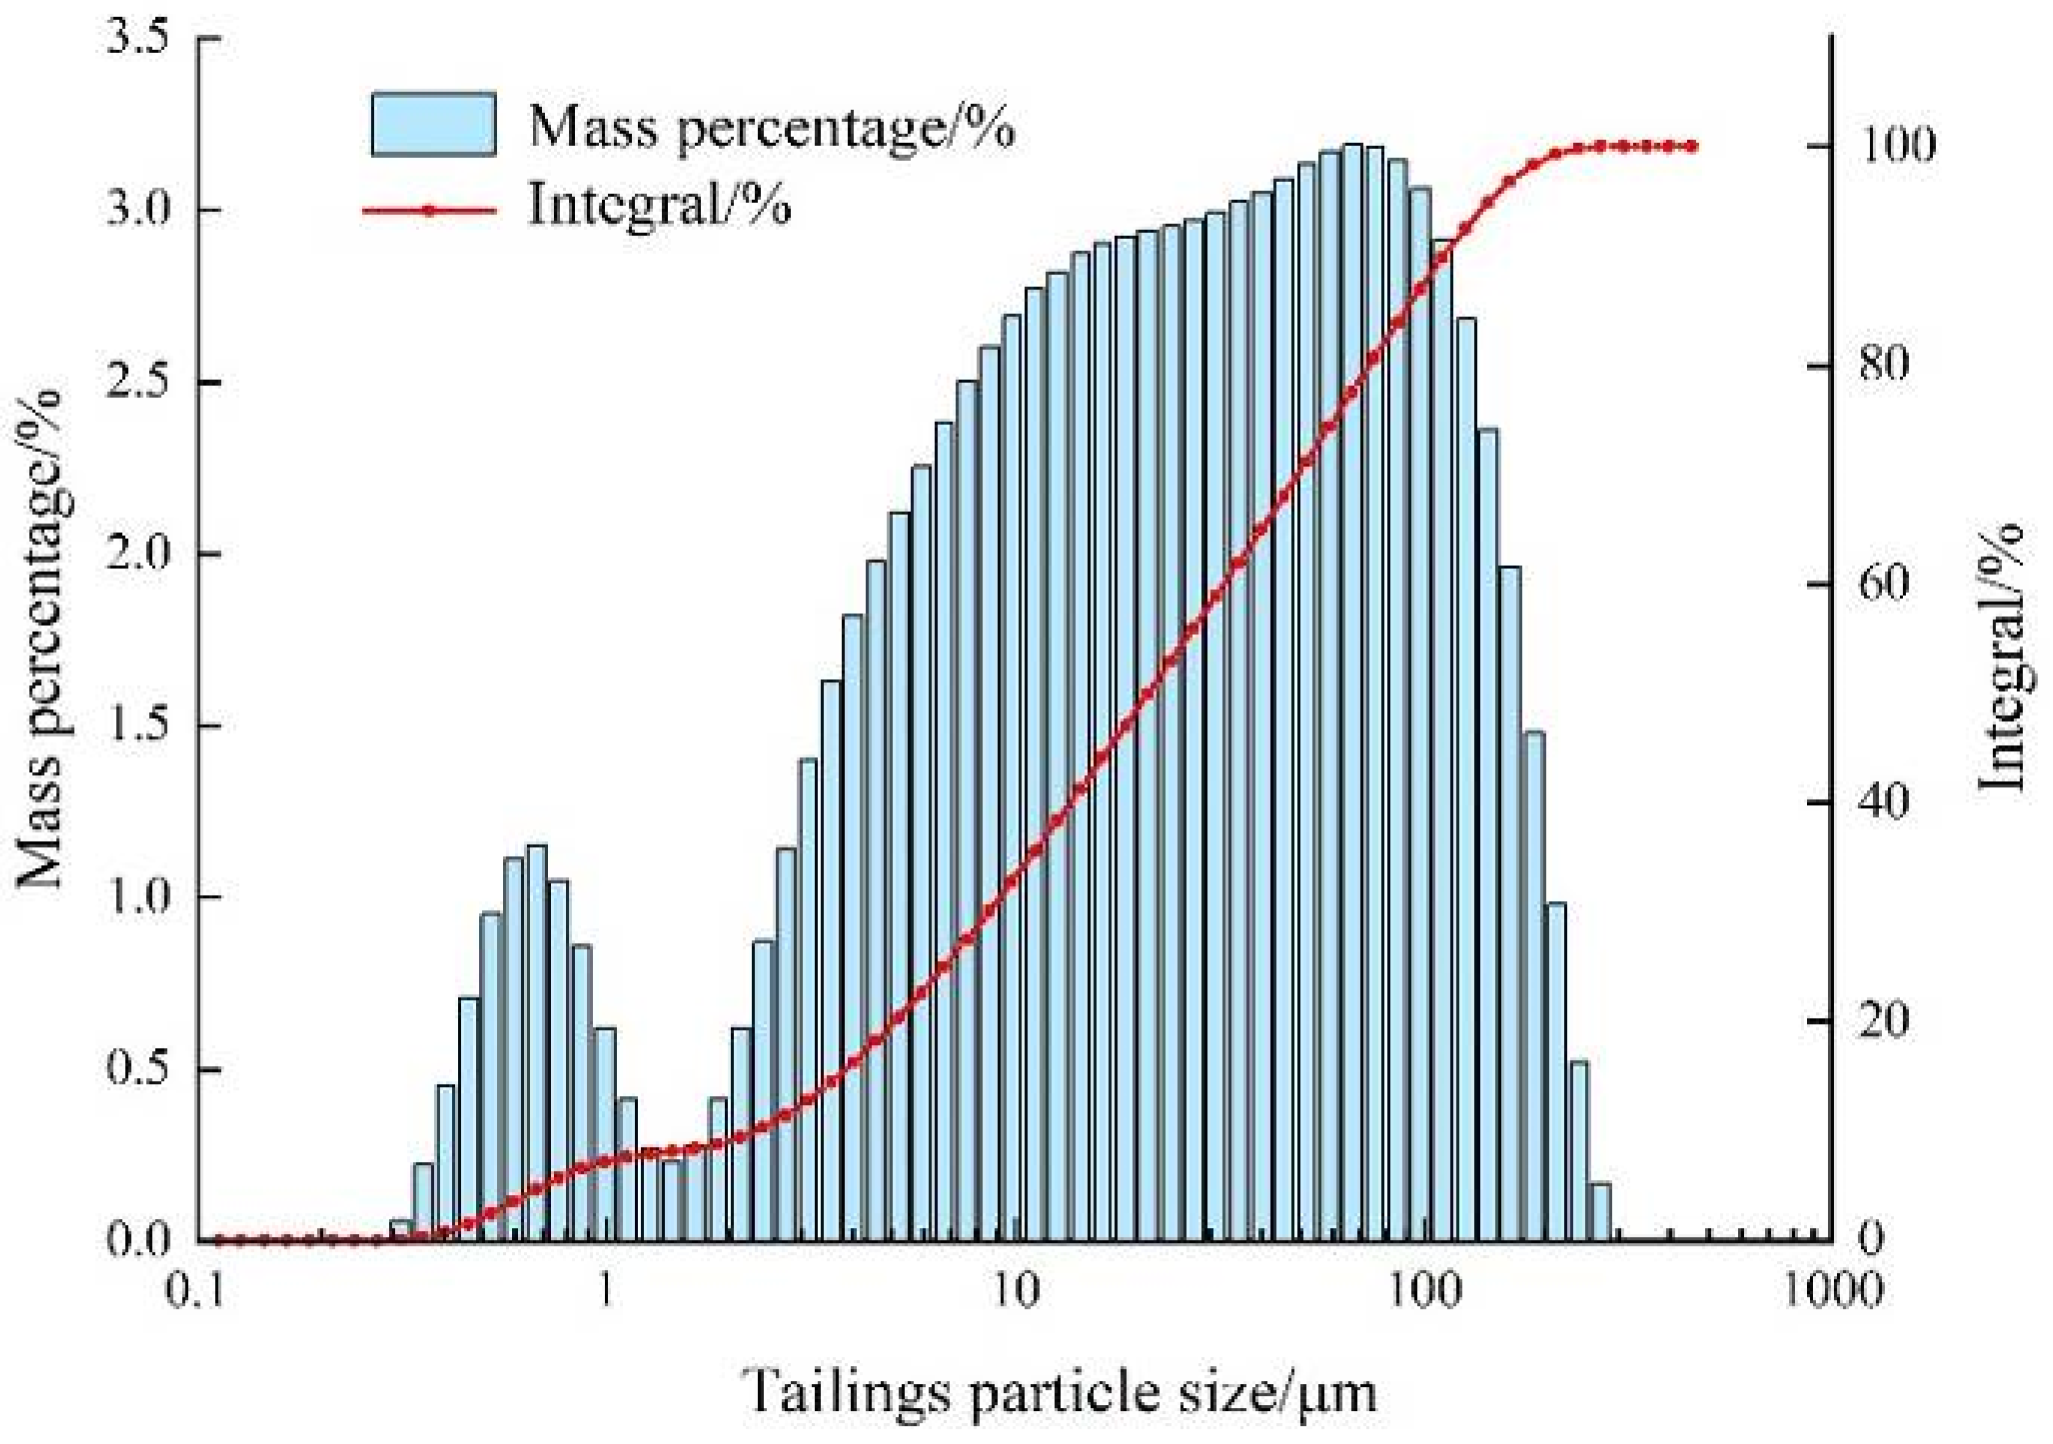
Figure 1 and
Table 1 show the particle size distribution and physical properties of the samples. The analysis shows that the particle size of tailings is mainly distributed between 5 μm and 160 μm, and about 98% of the tailings particles are less than 200 μm. The weighted average of the particle size is 43.88 μm and the median particle size is 24.10 μm. The main chemical composition of classified fine tailings is shown in
Table 2.
2.1.2. Flocculants
Four anion-type flocculants were selected according to the types of flocculants commonly used in the settlement of gold tailings. The flocculants are ZYZ, ZYD, JYC-1, and JYC-2, and their parameters are shown in
Table 3.
2.2. Experimental Programs and Equipment
2.2.1. Static Flocculation Settlement Experiment
The optimal single-consumption flocculation agent was first determined by a static flocculation settlement experiment to obtain quality tailings flocculation. The mass concentration of tailings solution and the unit consumption of flocculant are the two most important factors affecting tailings settlement. According to statistics, for the tailings of some mines, the optimum tailings solution concentration ranges from 5% to 25% [
22]. In order to simplify the experimental scheme and achieve the experimental purpose, a single consumption of flocculant was used as the only variable in this experiment. In this paper, a single consumption of flocculant was measured at 0 g/t, 10 g/t, 20 g/t, 30 g/t, and 40 g/t. The concentration of tailings solution was 20%, and the concentration of flocculant solution was 0.3%.
Table 4 shows the experimental grouping. The height of the mud layer at different times during the experiment was recorded.
2.2.2. Nuclear Magnetic Resonance Observation Experiment
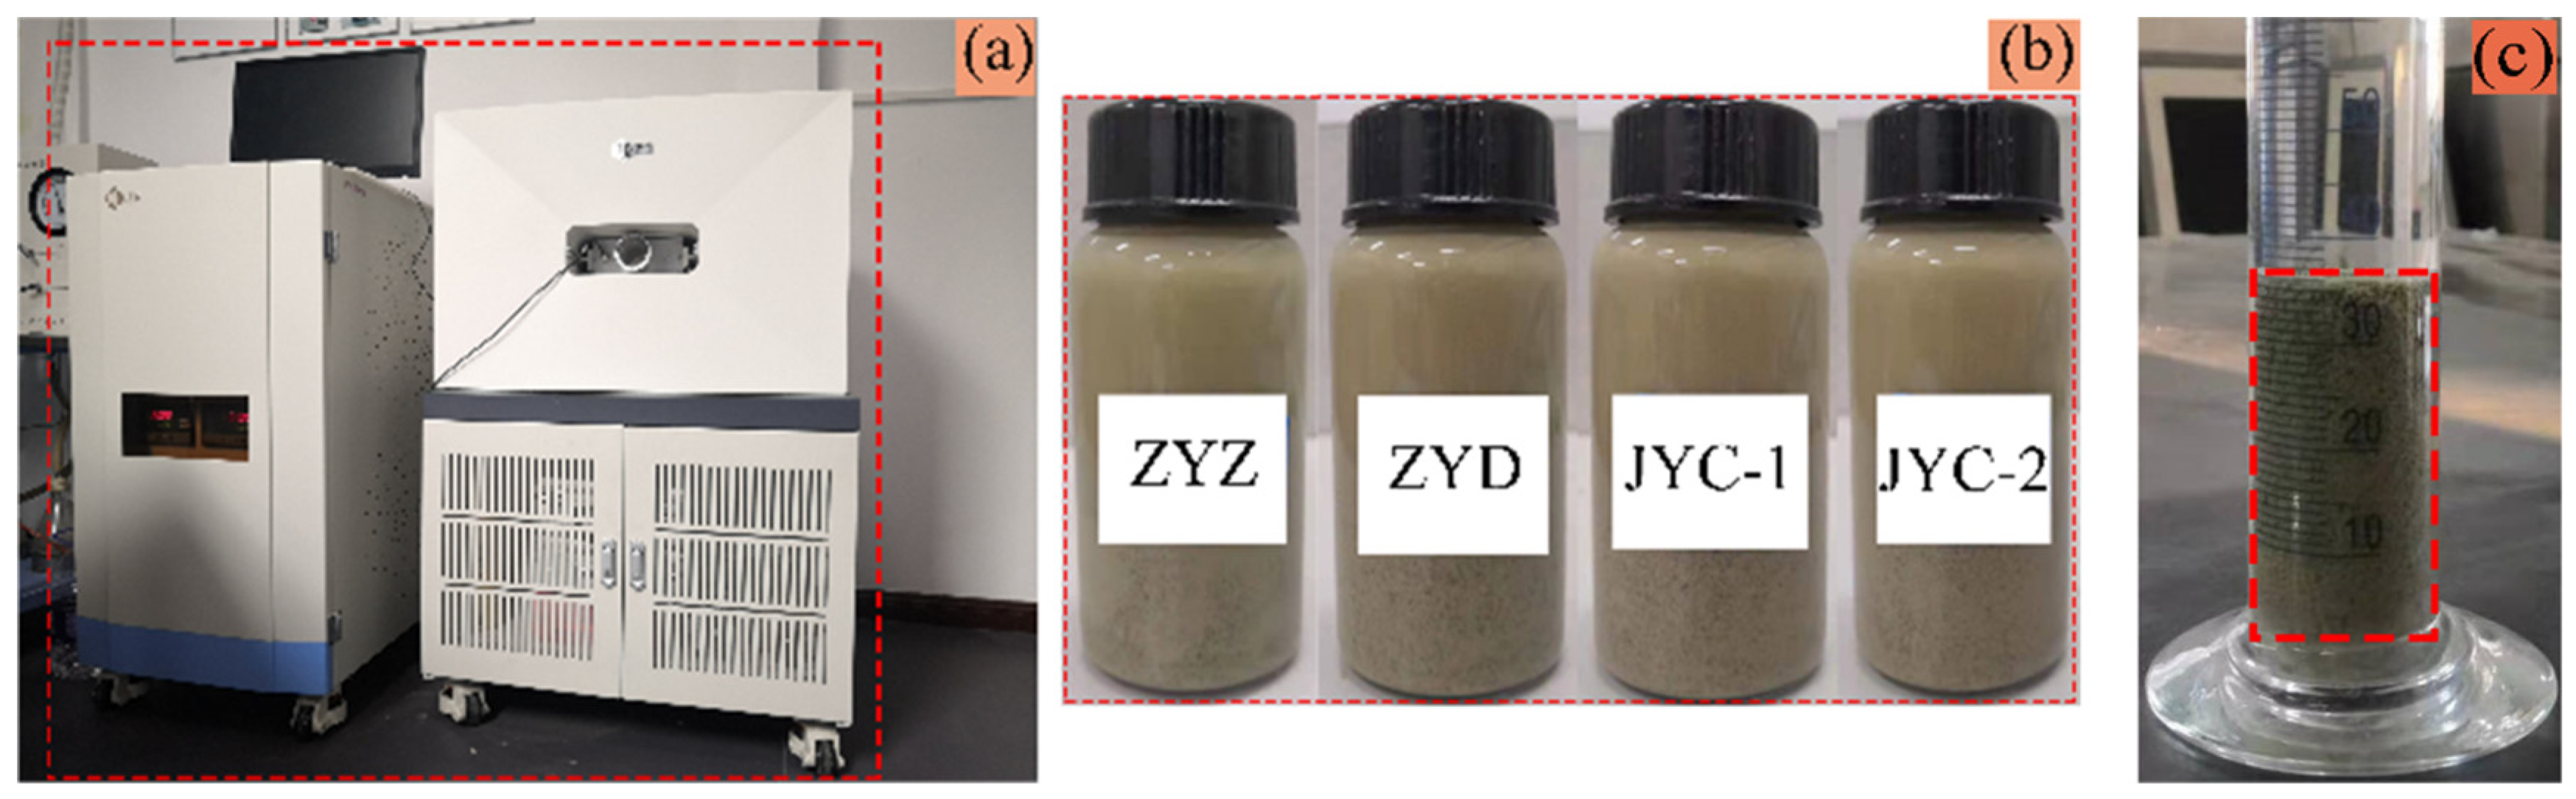
Four classified fine tailings solutions with concentration of 20% were configured. ZYZ, ZYD, JYC-1, and JYC-2 flocculants were added to the solutions using the best single-consumption flocculant and flocculant solution at 0.3% concentration. After stirring, the solutions were transferred to different acrylic bottles. The porosity and aperture distribution of the floc solutions of classified fine tailings were observed by a magnetic resonance imaging analyzer, as shown in
Figure 2.
A magnetic resonance imaging analyzer was used, with 23 MHz resonance frequency, magnet temperature ranging from 25 °C to 35 °C, and a Spiral-Sprite imaging sequence.
2.2.3. Scanning Electron Microscopy Experiment
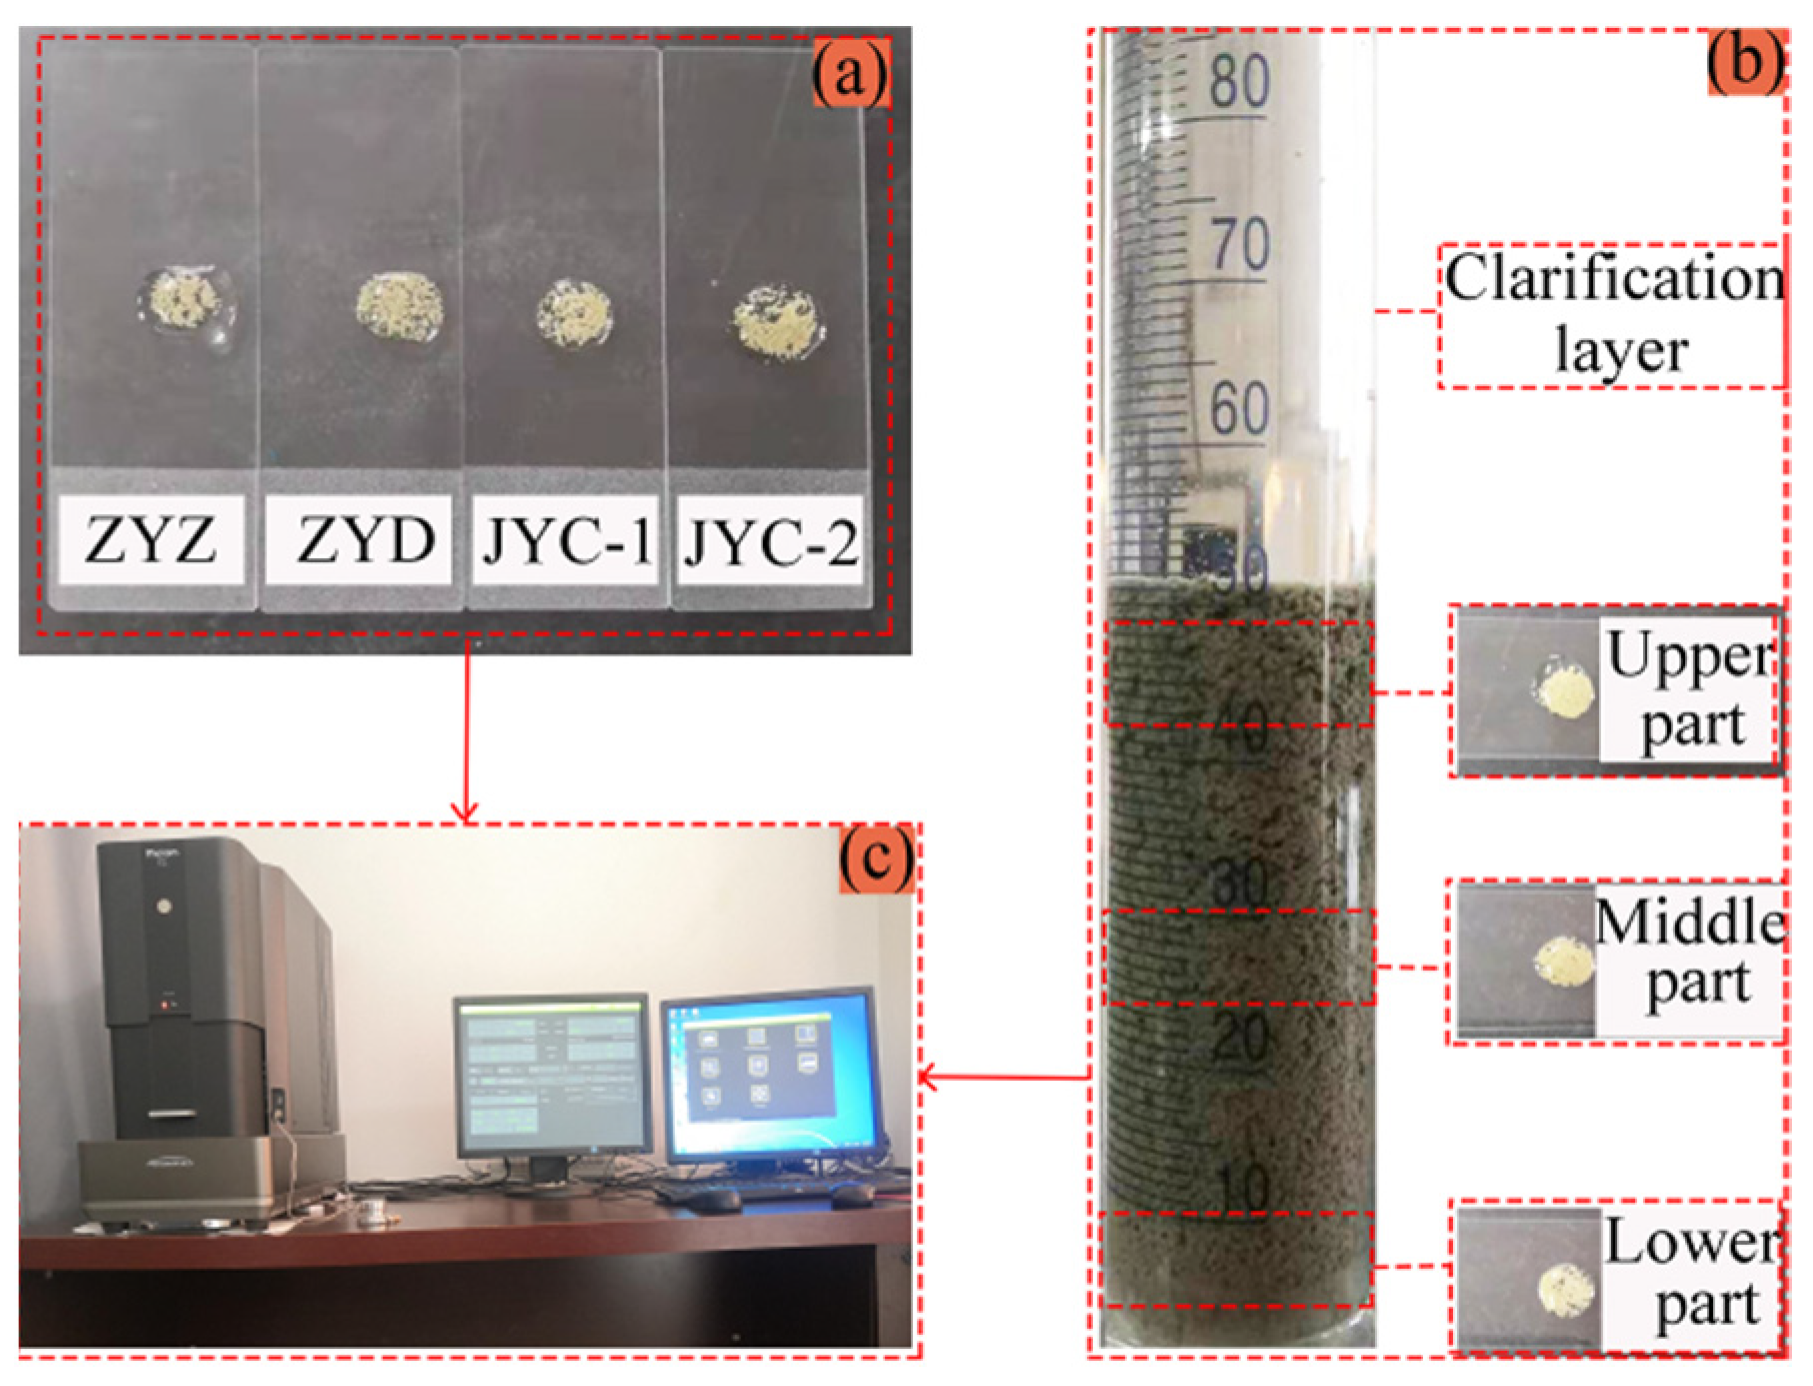
First, the four samples of floc solutions of classified fine tailings obtained from the MRI observation experiment were converted into microscope scanning samples, as shown in
Figure 3a. The production process was as follows. The floc solution of tailings was placed on a slide and hung naturally for 24 h until dry. The solution was fixed with K-300 shadowless glue. The gold spray process was conducted before scanning observation. The SEM images of the floc tailings were magnified 5000 times by microscope scanning.
The optimal flocculation agent was selected to configure the floc solution of classified fine tailings. The tailings solution had a concentration of 20%, and the concentration of the flocculant solution was 0.3%. The best flocculation agent was consumed in a static flocculation settlement experiment. Due to the increasing height of the tail sand bed layer formed by the deposition of floc to the bottom, the pressure of the bed layer gradually increased from top to bottom, and the gap between floc decreased continuously [
23]. Therefore, floc in the upper, middle, and lower parts of the bed layer were taken separately. The microscope scanning samples were selected, as shown in
Figure 3b, to obtain the best SEM images of floc with different settling heights.
Phenom XL benchtop SEM is used, with high brightness CeB6 filament, resolution of less than 10 nm, and operating voltage of 15 kV, as shown in
Figure 3c.
3. Experimental Results and Analysis
3.1. Analysis of Best Single-Consumption Flocculant
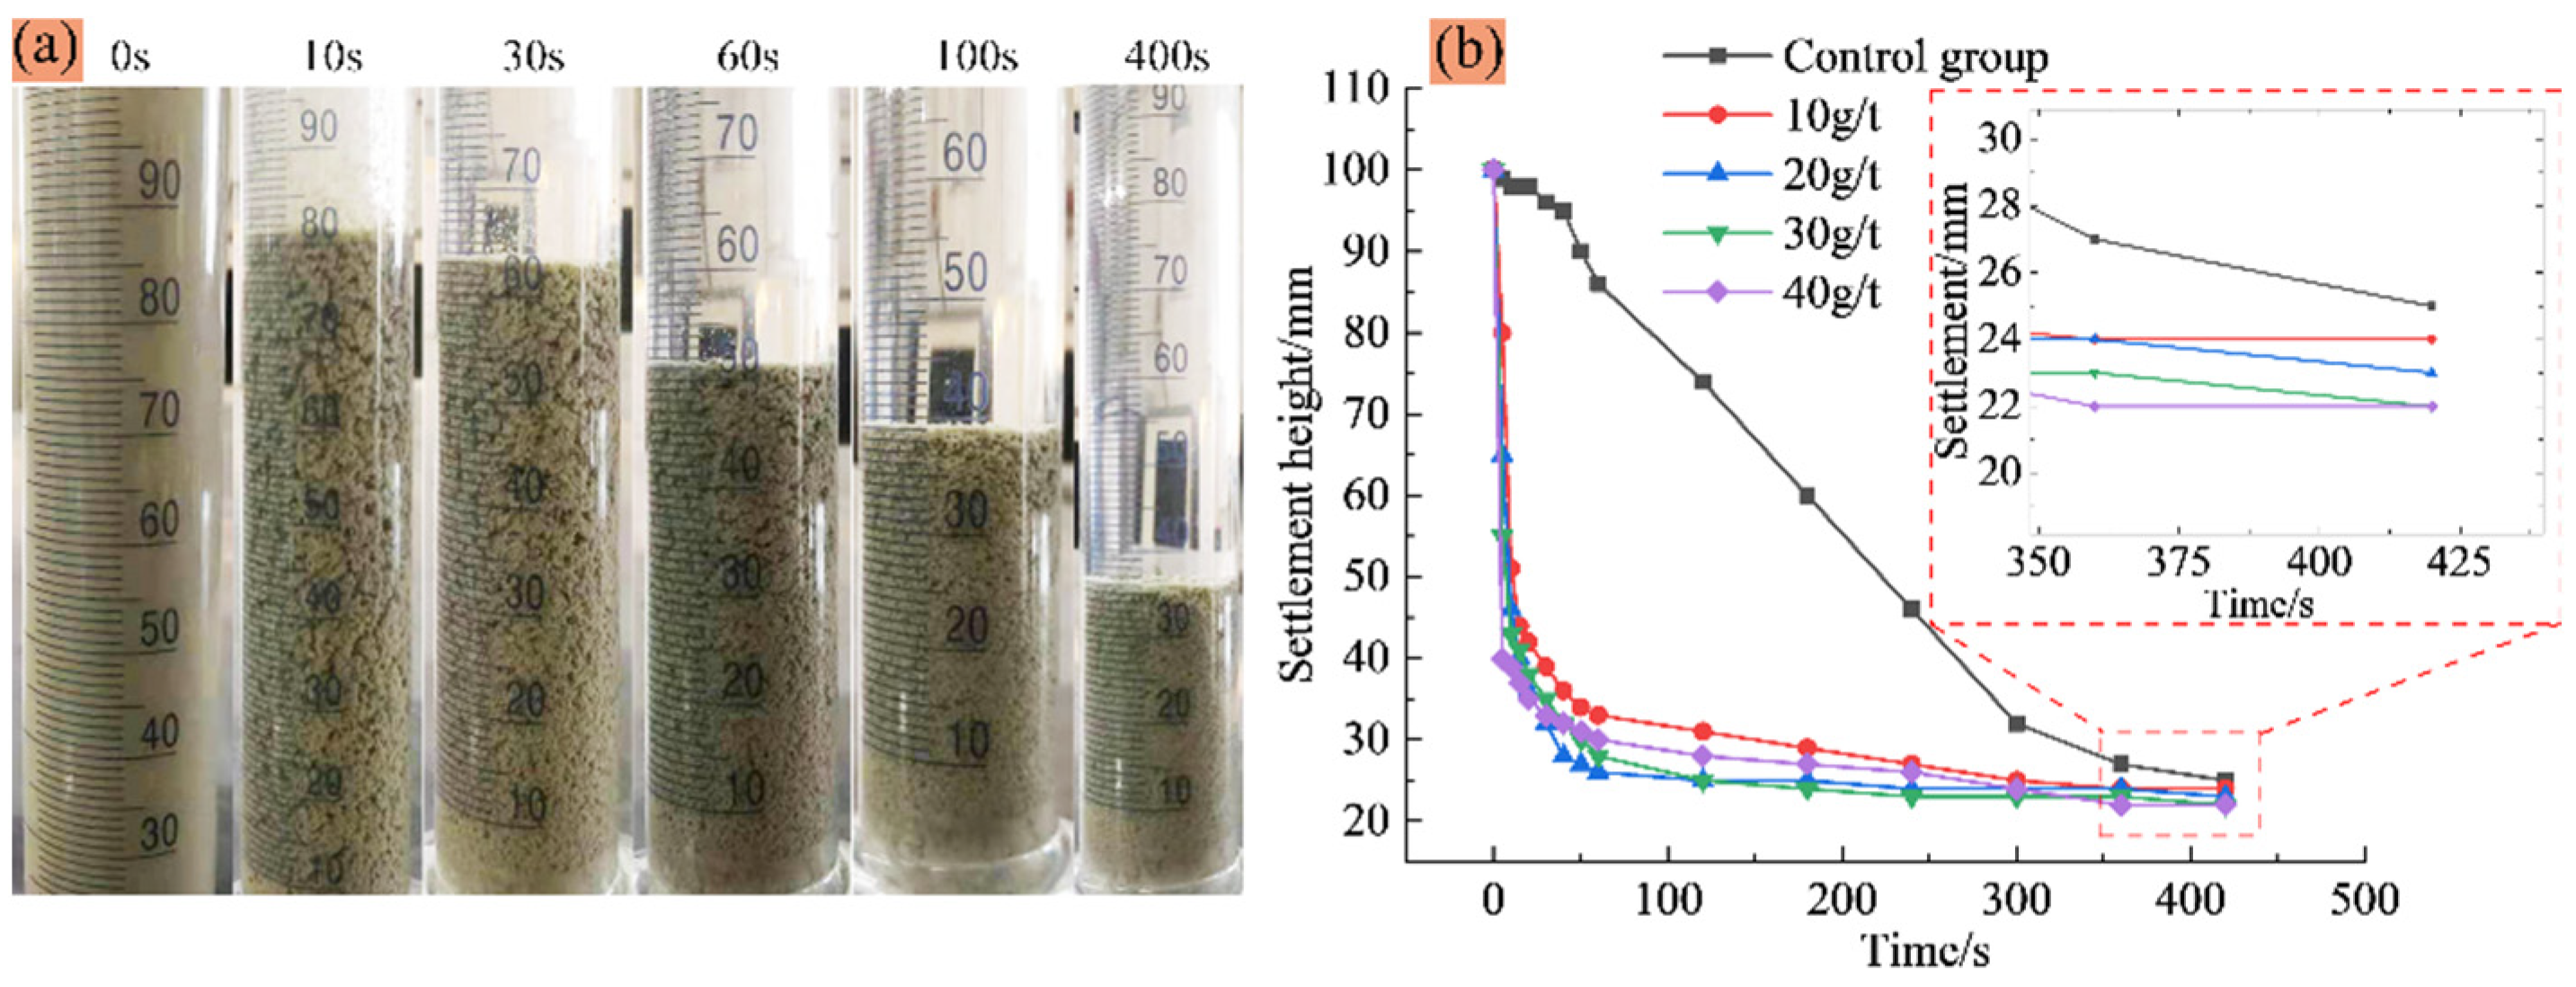
Figure 4 shows the settlement process of floc and the variation curve of the single-consumption settlement height of flocculant ZYZ over time obtained through a static flocculation settlement experiment. Analysis shows that the addition of flocculant significantly accelerated the pre-settling speed of classified fine tailings. Four groups of classified fine tailings of floc solution occurred at 0 s to 60 s rapid settlement process. The five groups of experiments were completed at about 400 s. The final settling heights were 24 mm, 23 mm, 22 mm, 22 mm, and 25 mm, respectively. The lower the final settling height, the more compact the floc were, which resulted in an ideal flocculation settlement effect. The final settlement height decreased with the increase in flocculant consumption at a certain range of flocculant consumption. The final settling height did not change when the single consumption of flocculant increased from 30 g/t to 40 g/t. The result shows that flocculant consumption of 30 g/t is the threshold for enhancing the flocculation settling effect, which can be used as the best value for single-consumption flocculant.
3.2. Analysis of Aperture Distribution Characteristics and Porosity of Floc Solution
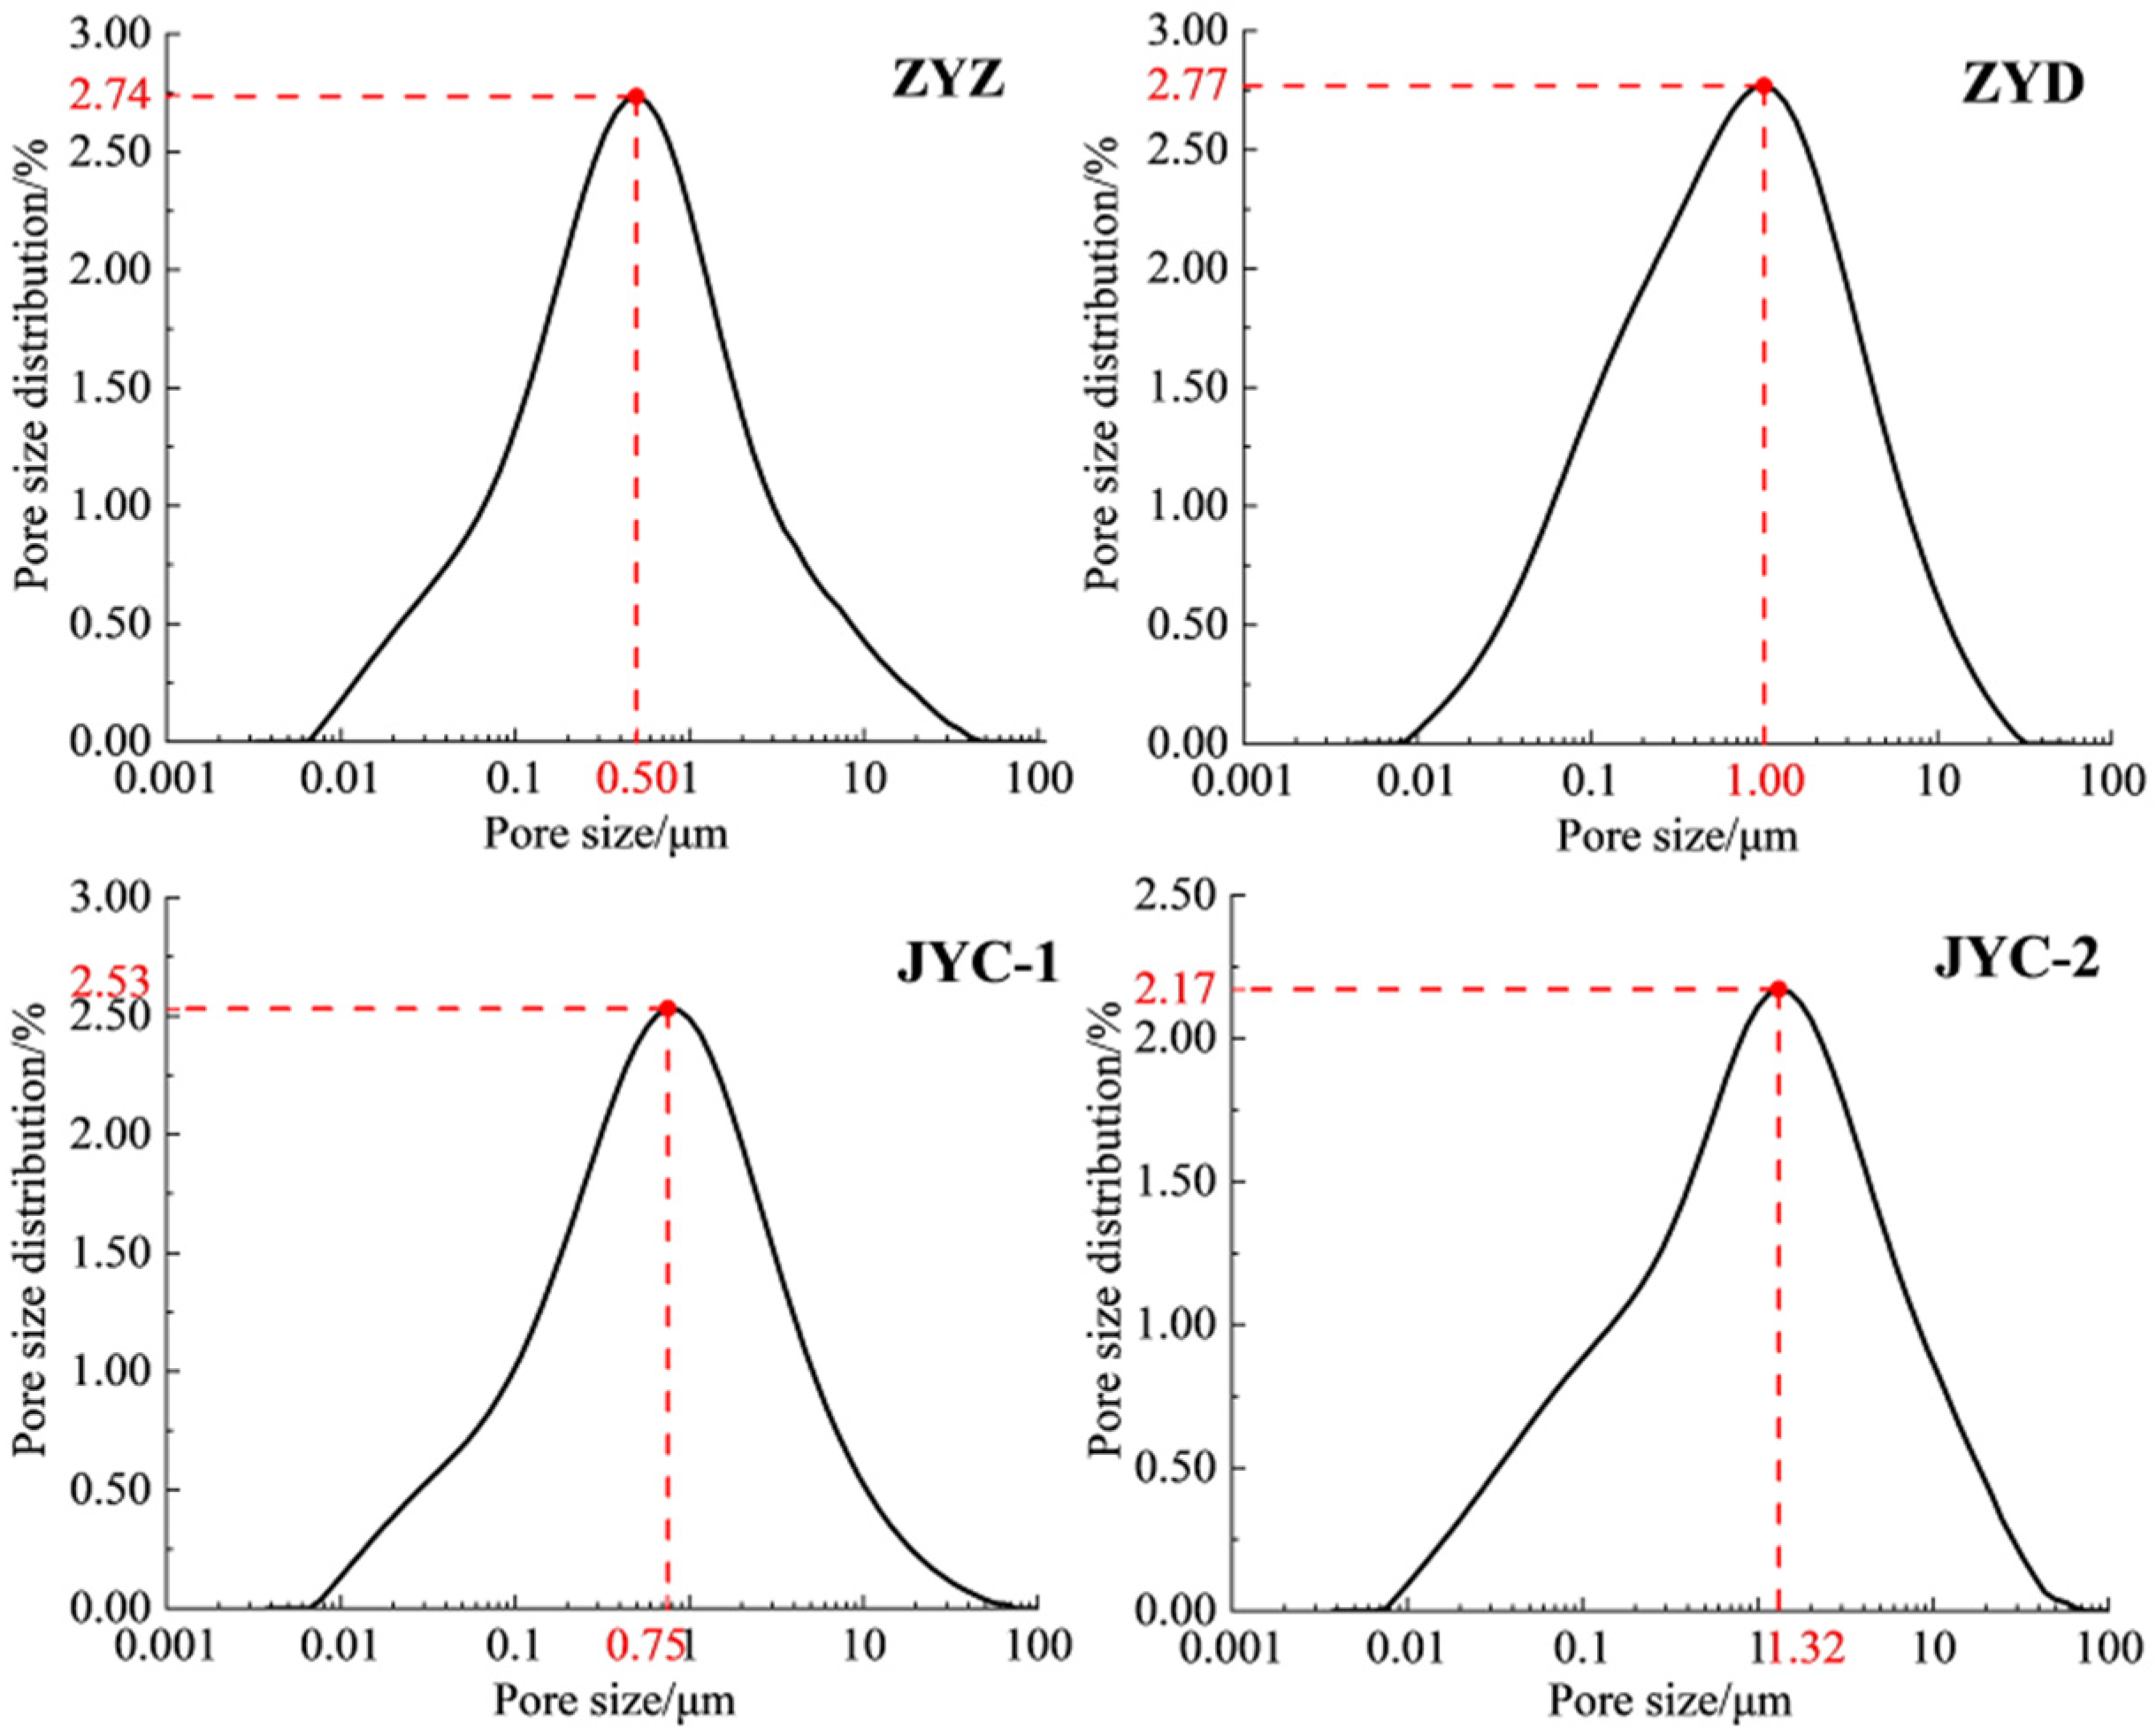
Figure 5 shows the aperture size that corresponds to the maximum percentage of aperture distribution of floc solutions under the four flocculants, which is sorted in the following order: ZYZ < JYC-1 < ZYD < JYC-2. The maximum aperture ratio of floc solution for the classified fine tailings under ZYZ and JYC-1 is 2.74% and 2.53%, respectively. The corresponding aperture sizes are 0.50 μm and 0.75 μm, respectively, which are both less than 1.00 μm. The maximum aperture ratio of floc solution of the classified fine tailings under ZYD and JYC-2 is 2.77% and 2.17%, respectively. The corresponding aperture sizes are 1.00 μm and 1.32 μm, which are higher or equal to 1.00 μm.
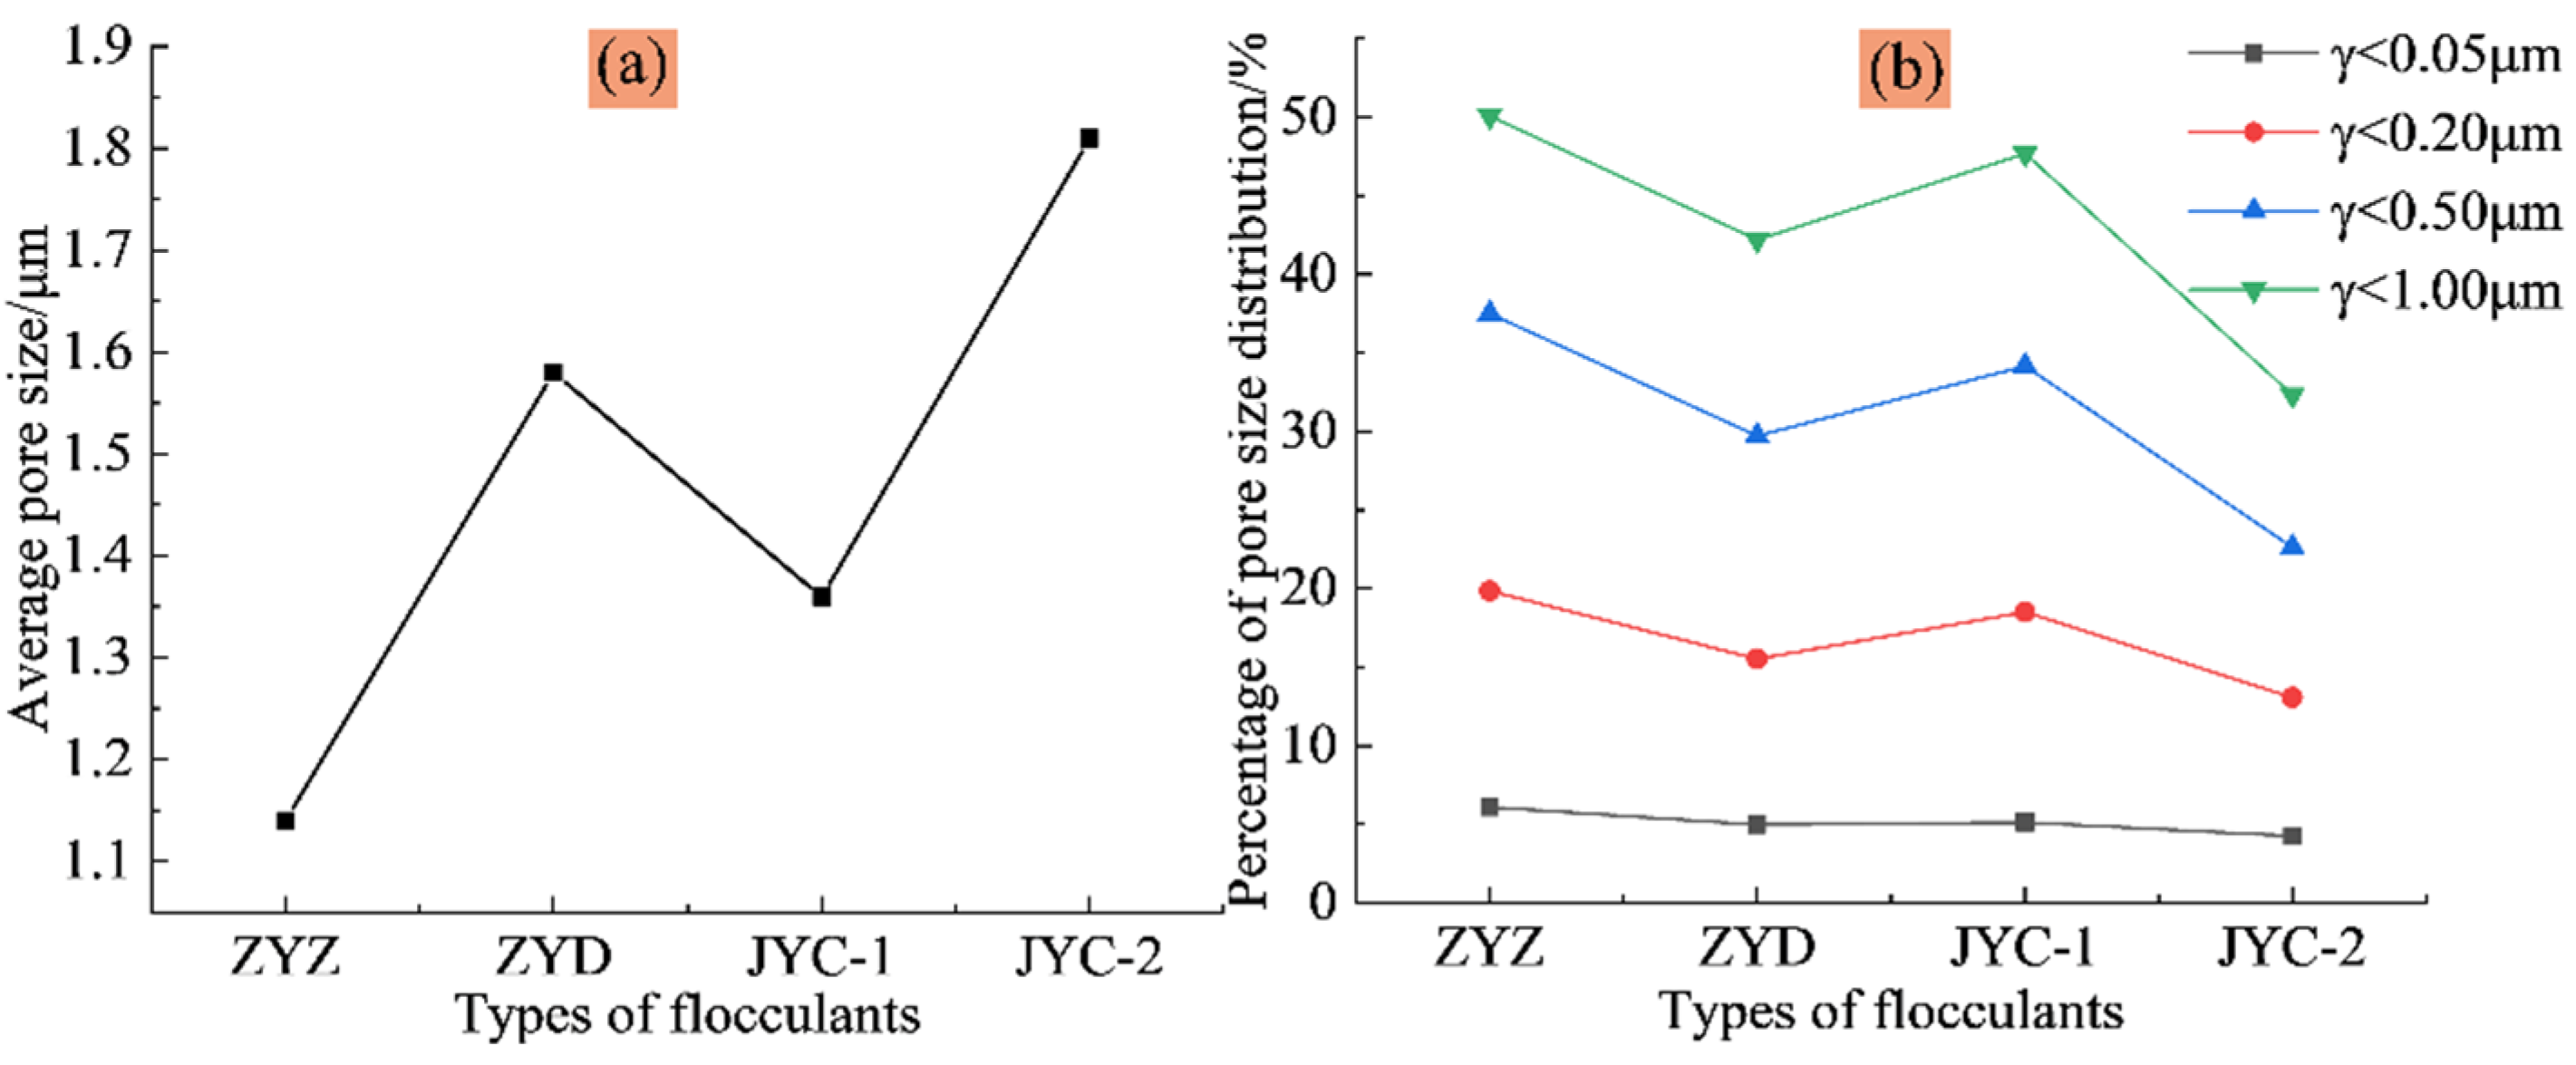
As shown in
Figure 6a, the overall average aperture of the solution and the distribution percentage of the four intervals of solution aperture sizes of 0 to 0.05 μm, 0 to 0.20 μm, 0 to 0.50 μm, and 0 to 1.00 μm are counted to determine the distribution of small and medium-sized apertures in the floc solution of classified fine tailings. The average aperture size of floc solution of classified fine tailings is sorted as follows: ZYZ < JYC-1 < ZYD < JYC-2.
Figure 6b shows the percentage of aperture distribution, which is sorted as: ZYZ > JYC-1 > ZYD > JYC-2. The highest distribution percentage of small size aperture and the lowest distribution of average aperture of classified fine tailings solution were observed under the ZYZ-type flocculation solution. This finding indicates that the smallest spacing between floc was found under this flocculant, which demonstrated the densest floc structure.
In terms of porosity, ZYZ, ZYD, JYC-1, and JYC-2 flocculation solution have porosity percentages of 67.23%, 70.72%, 68.35%, and 78.40%, respectively. The lowest porosity was observed under the ZYZ flocculant, which indicates that the largest average size of floc was observed in this flocculant.
3.3. Analysis of Floc Size and Spatial Distribution Characteristics
3.3.1. Analysis of Floc Size Characteristics Based on Gray Scale Measurement
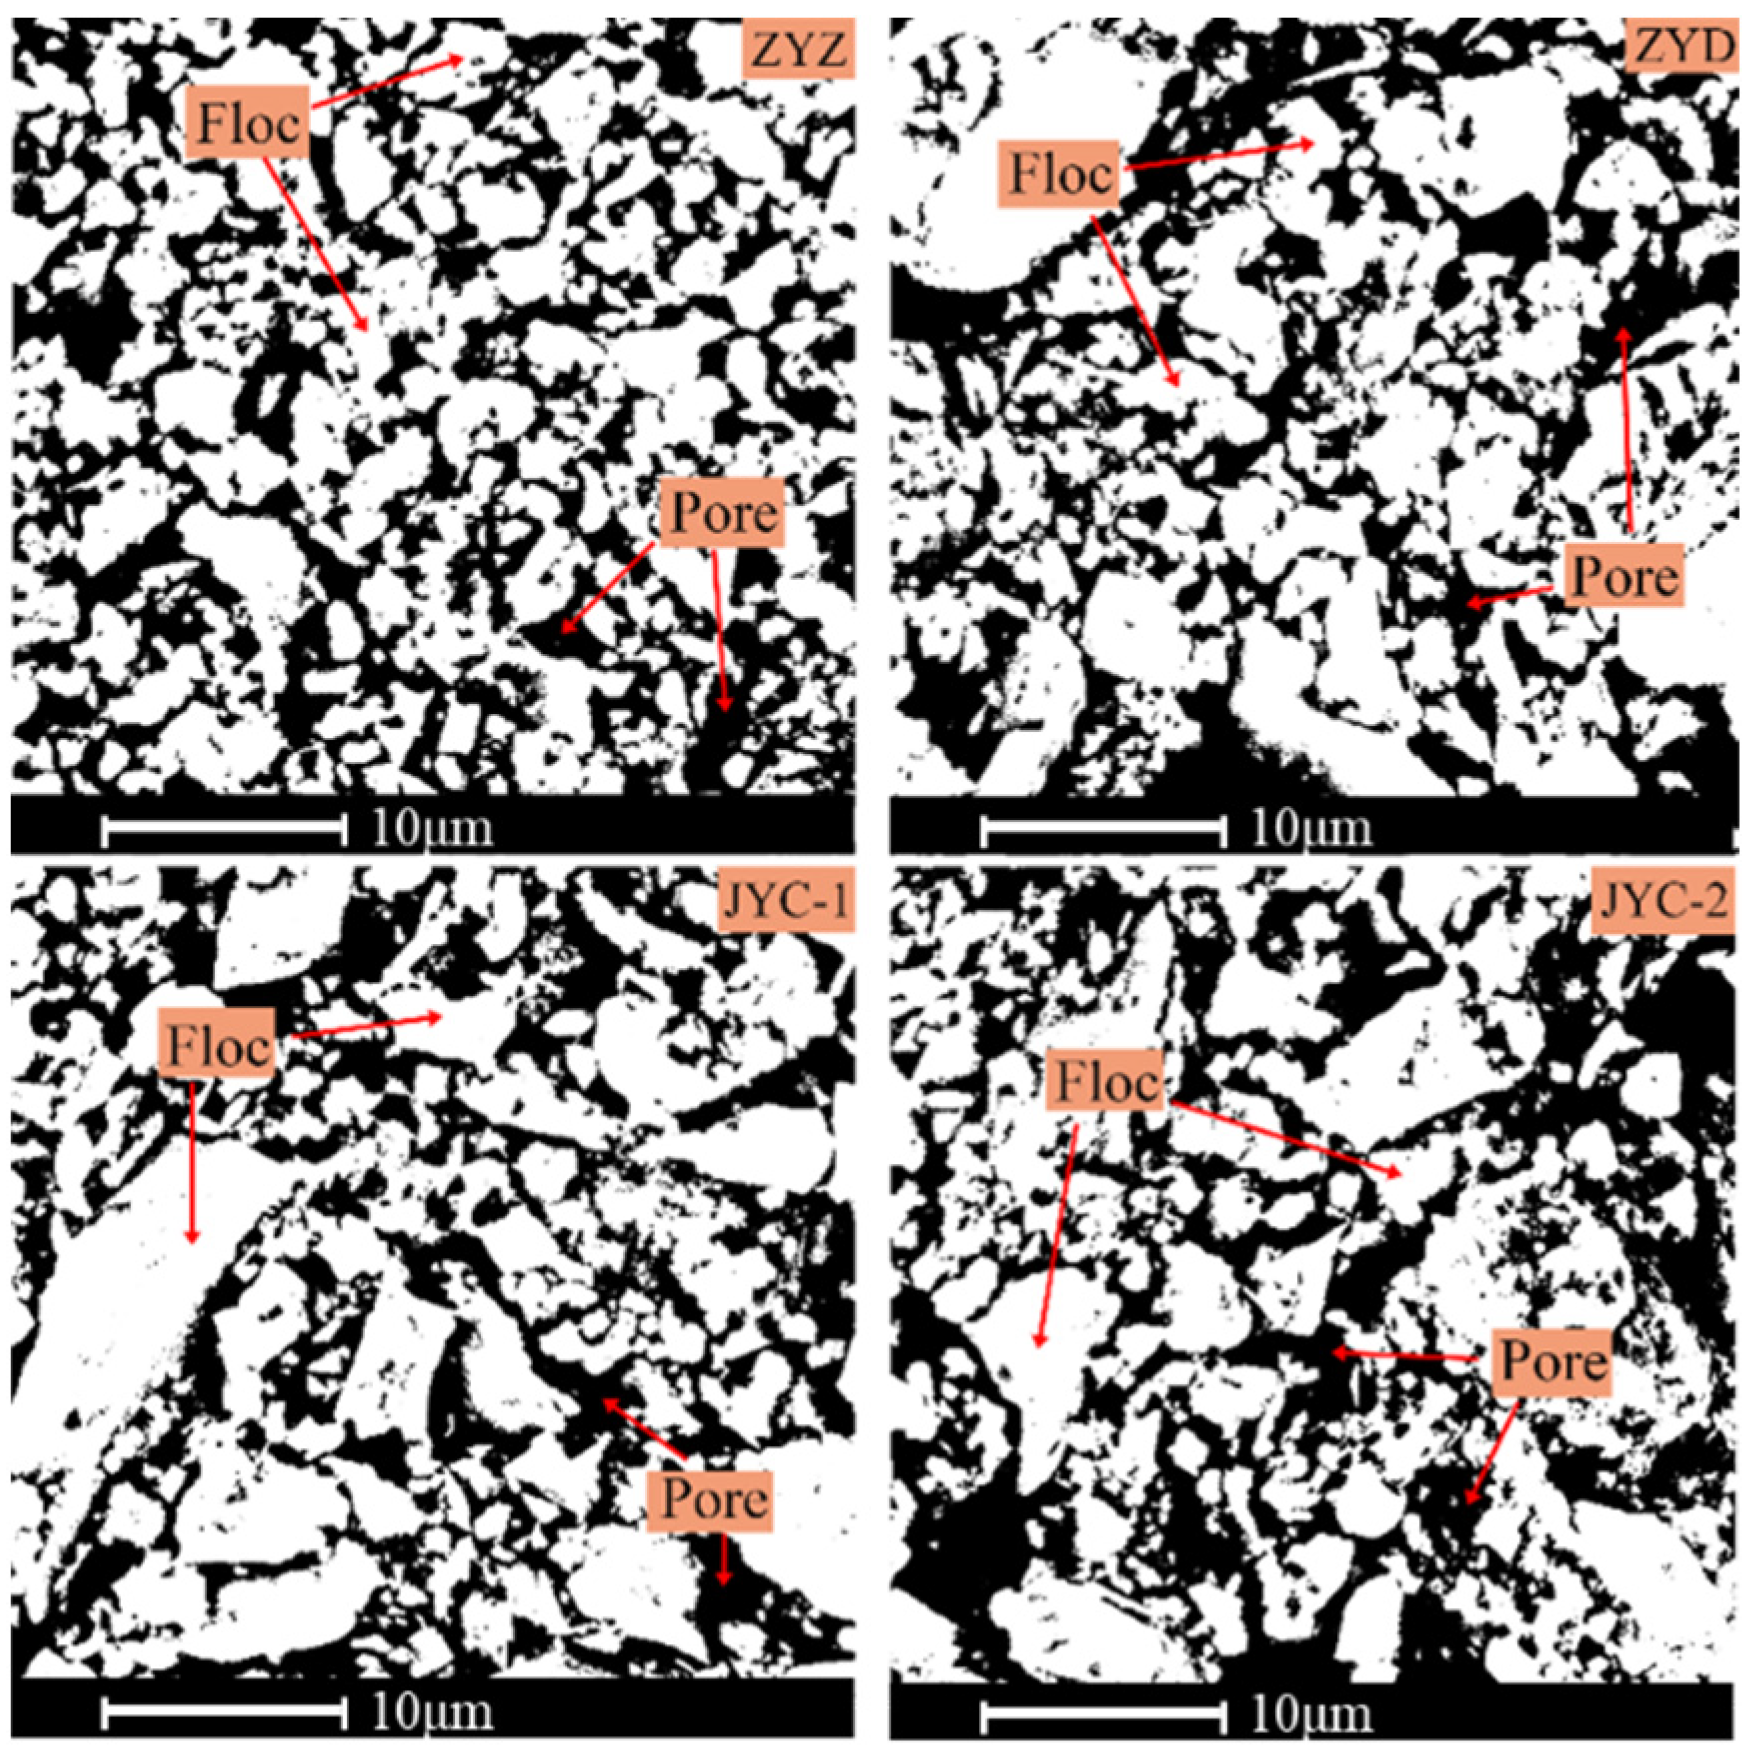
According to the grayscale measurement principle, the grayscale value of floc in SEM images is high, and the grayscale value of pores is low, which means that grayscale value can be used to distinguish between floc tailings and pores [
24].
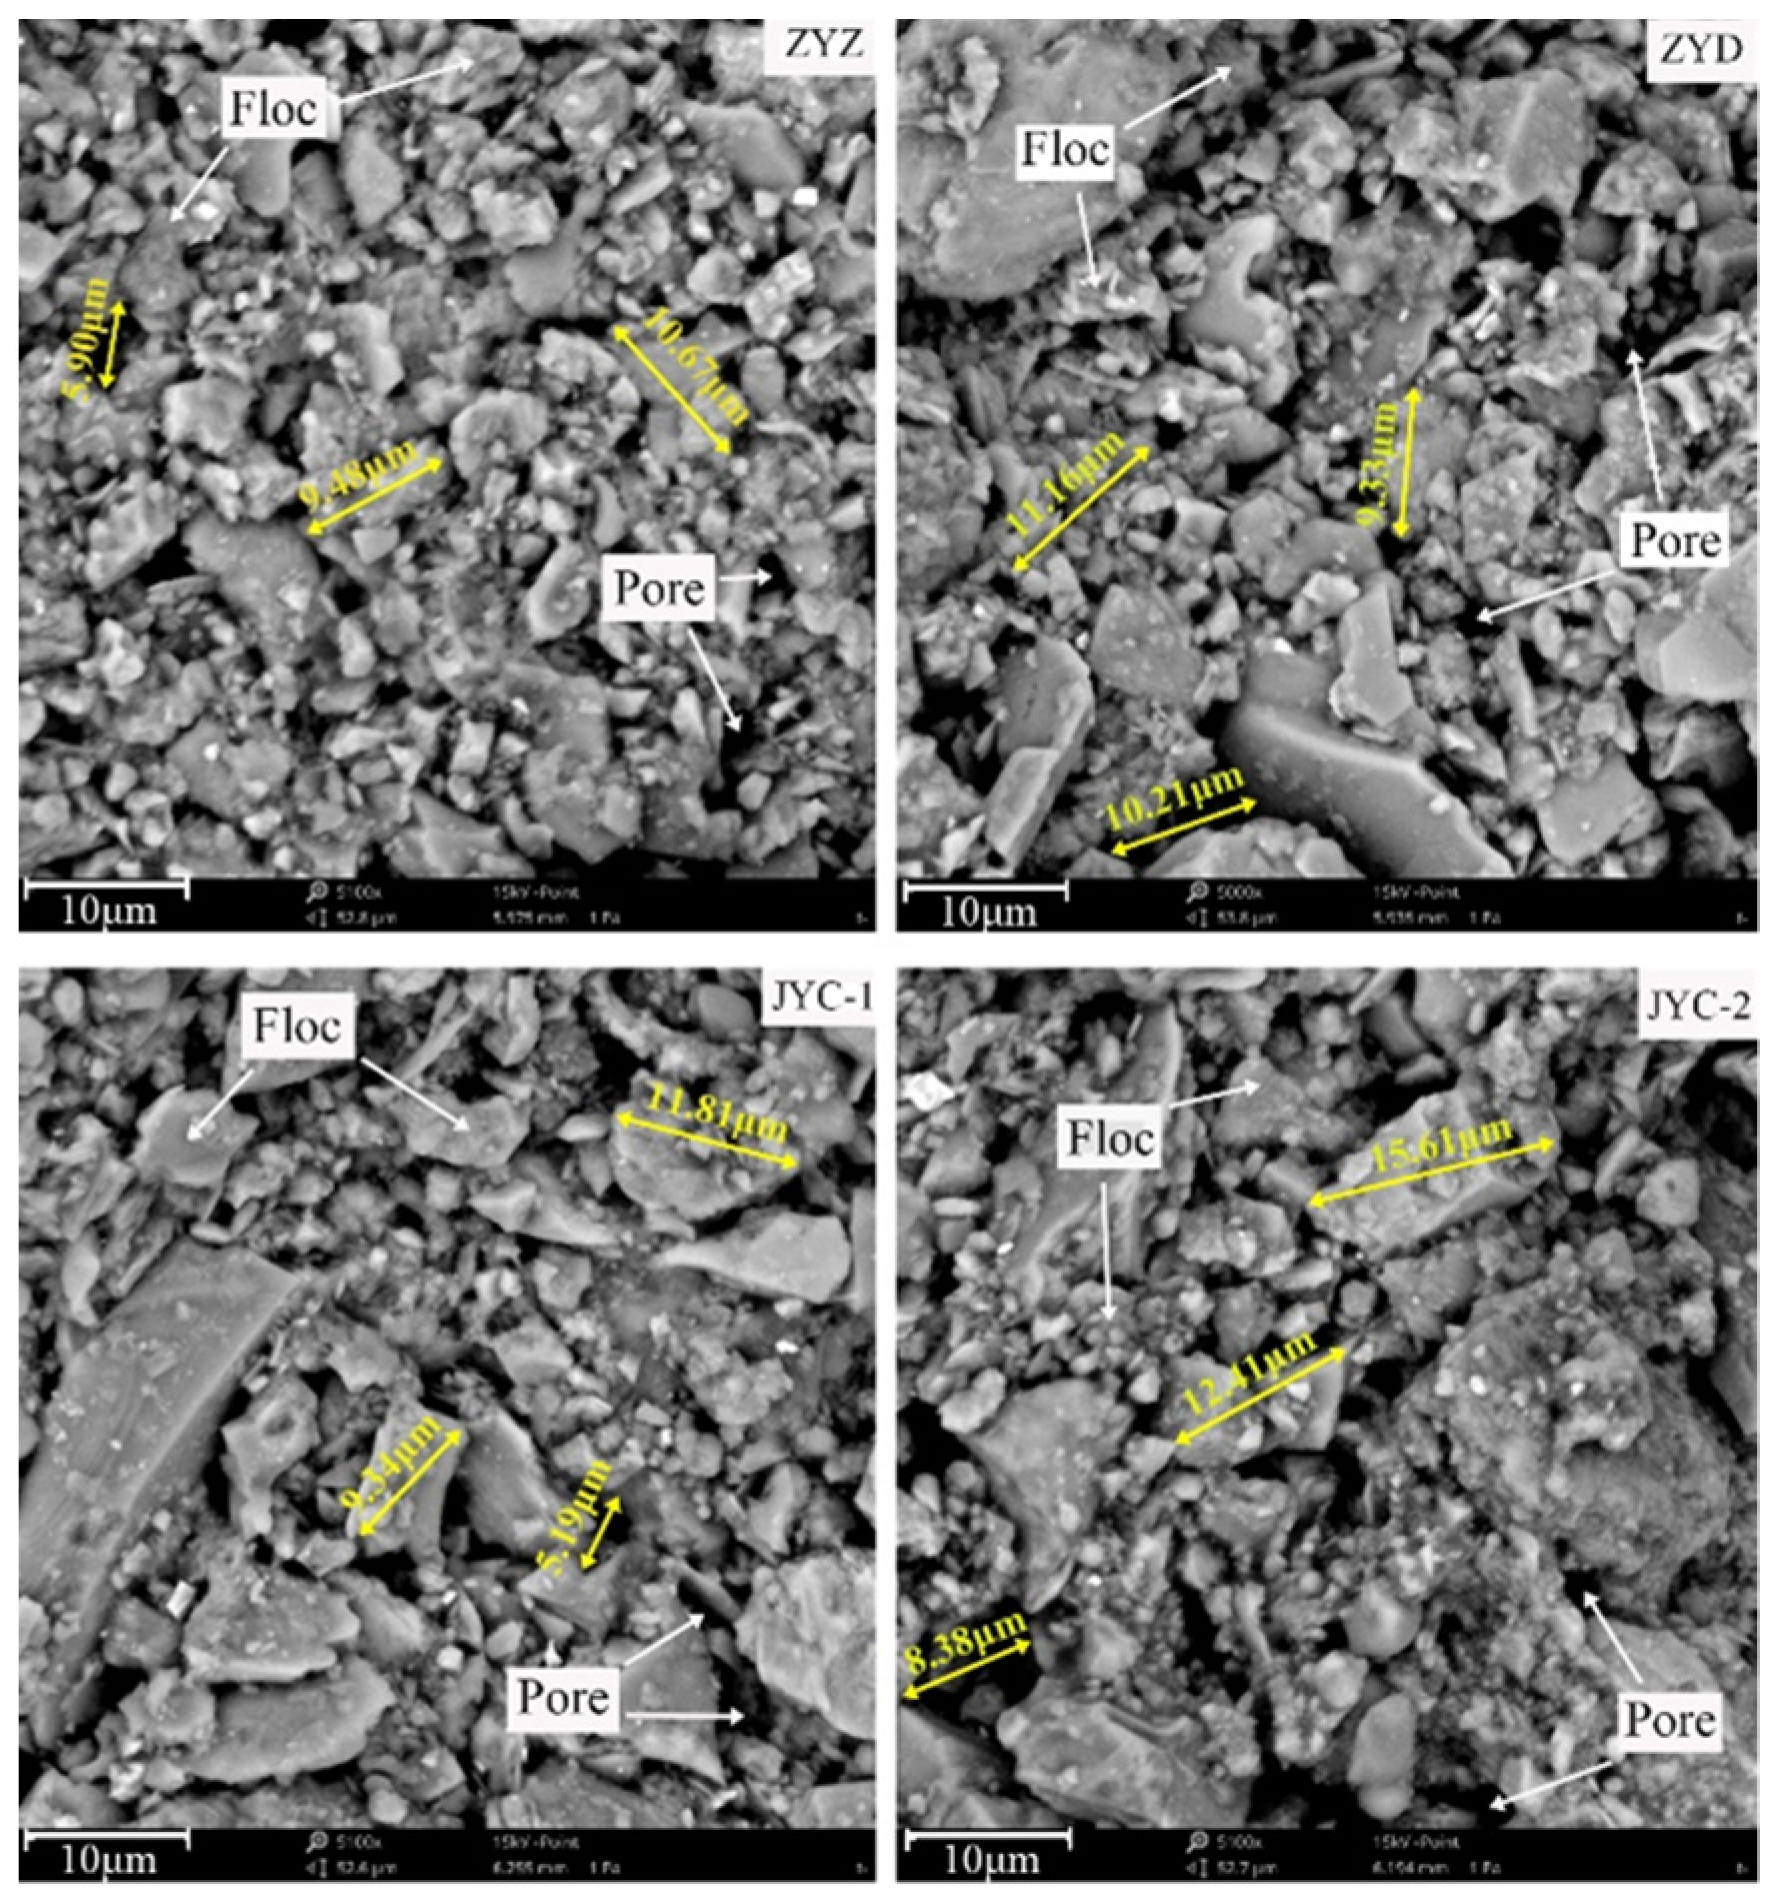
Figure 7 shows the SEM images of floc samples magnified about 5000 times. The floc is gray and the pores are black. The contours of floc and the pores between floc are clearly visible.
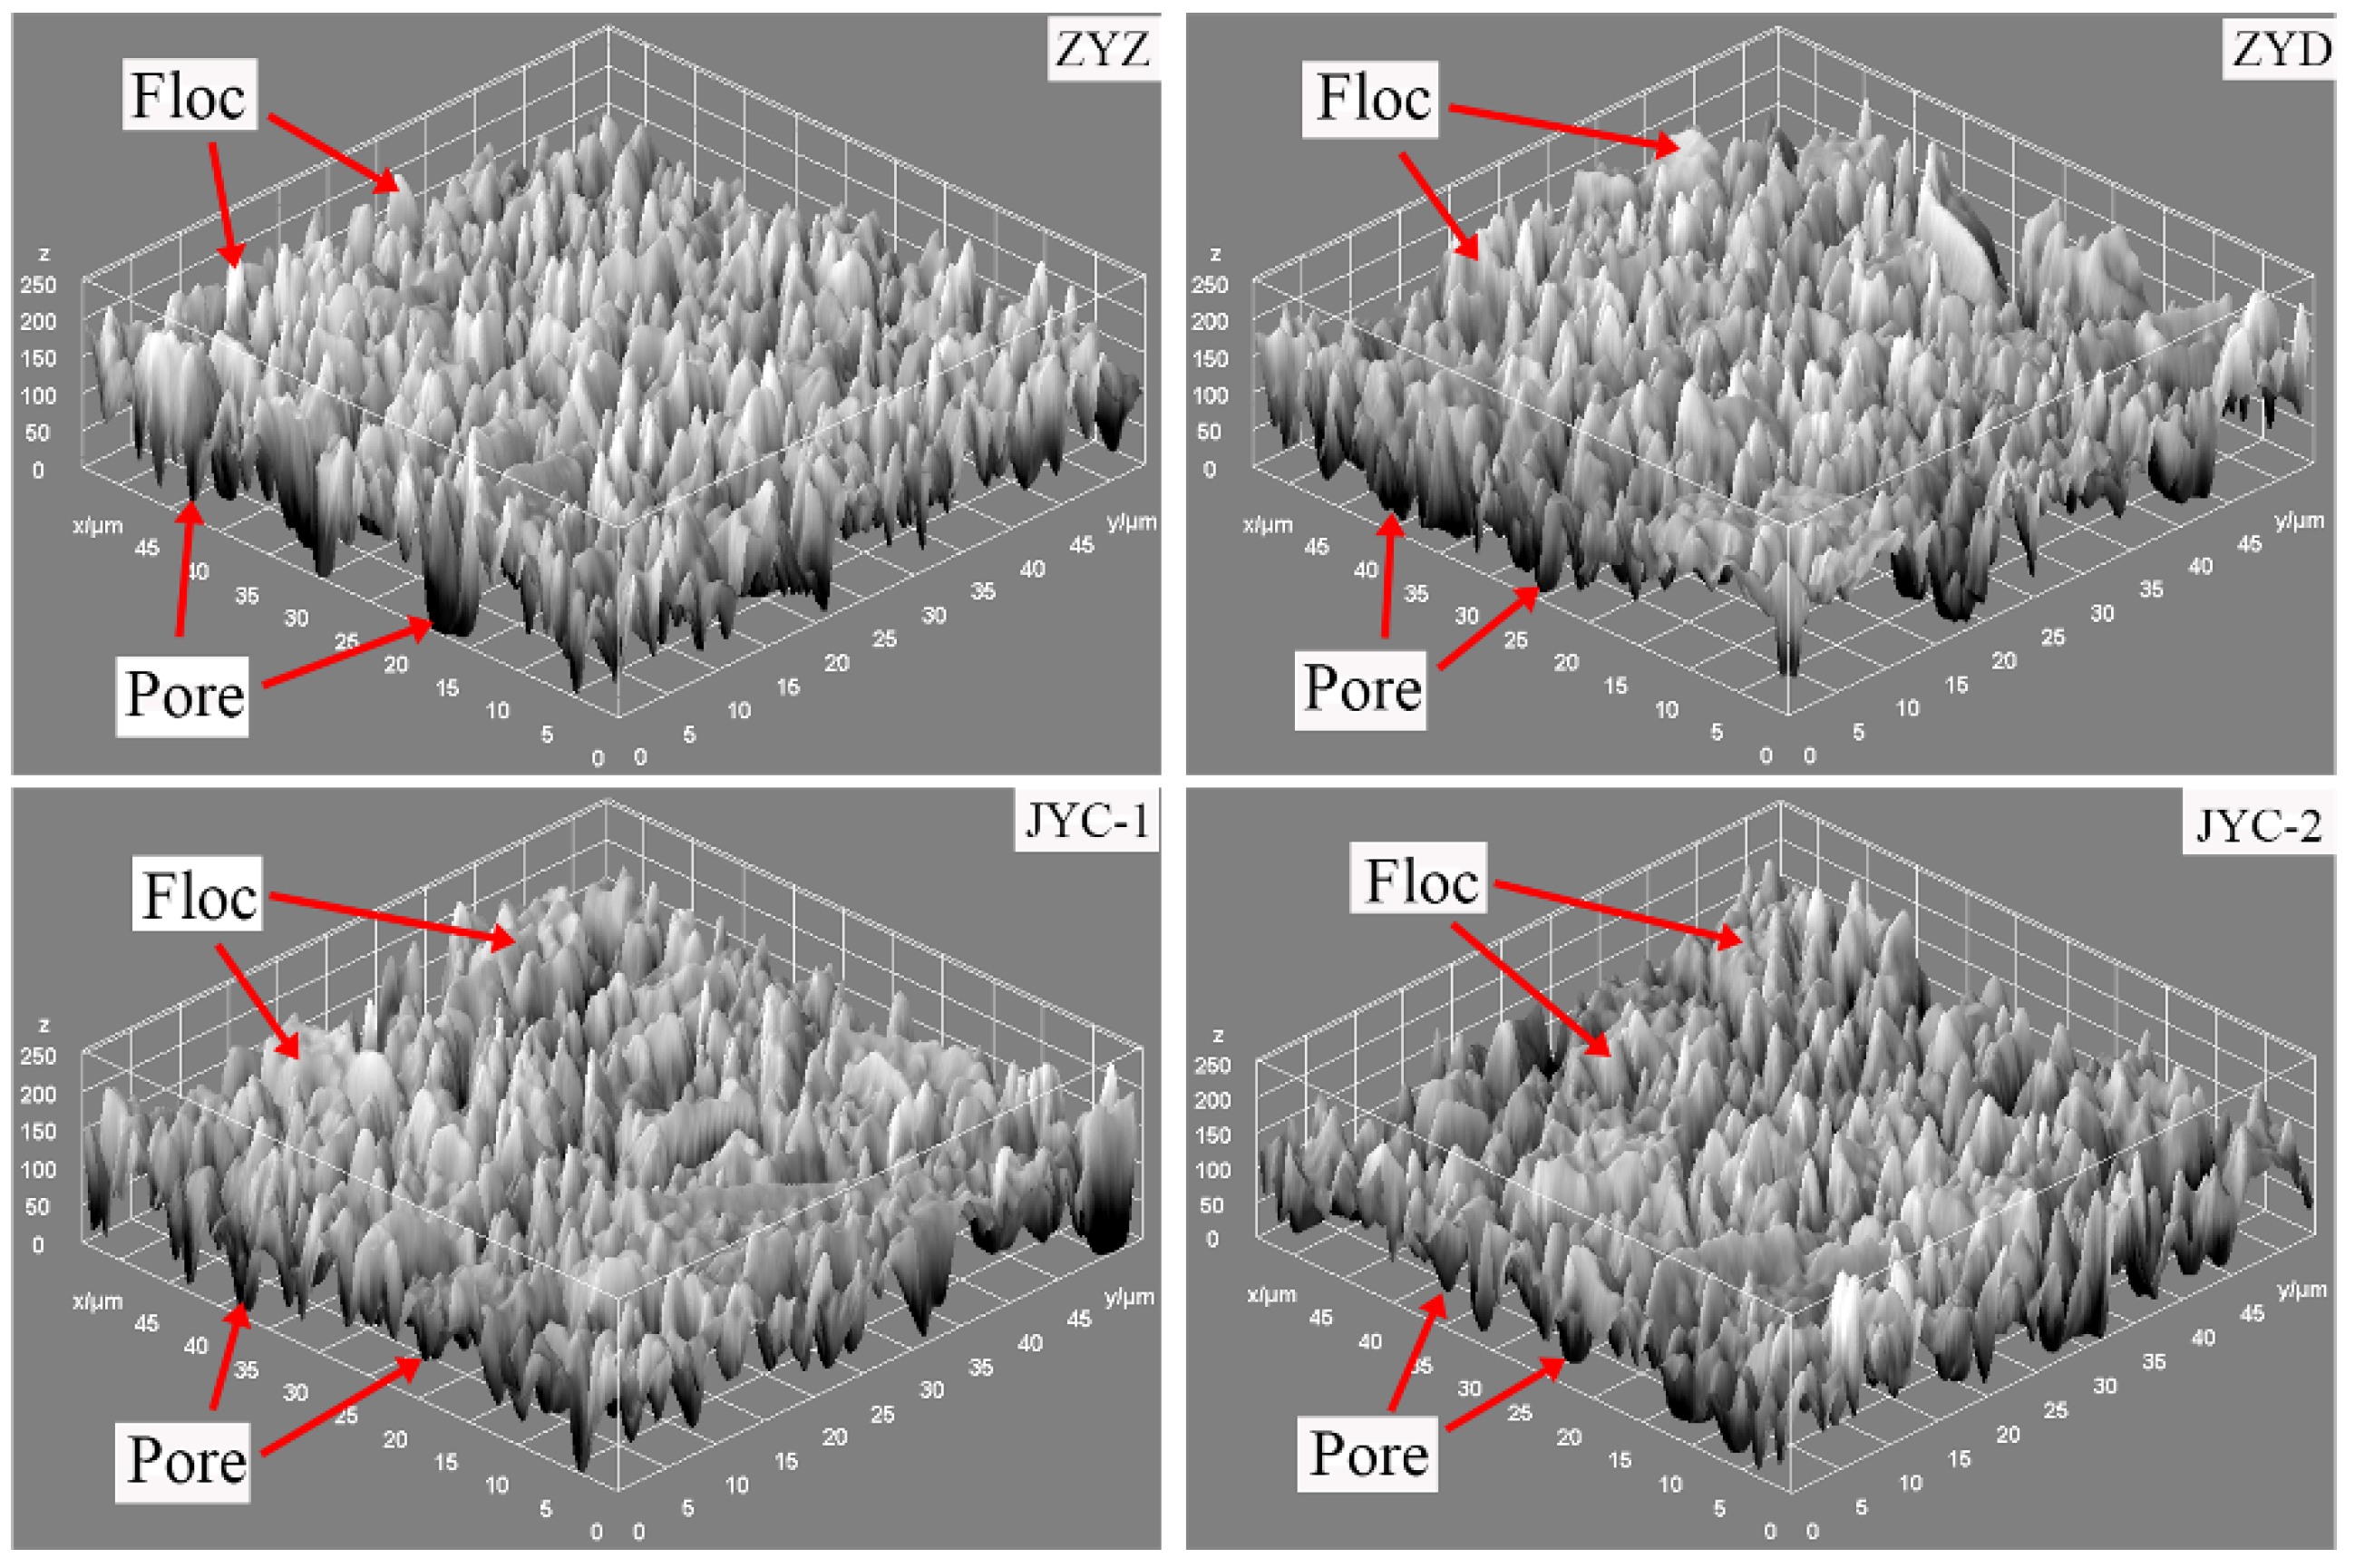
In order to preliminarily judge the relative proportion of floc and pores, the overall grayscale measurement of the floc was carried out and grayscale three-dimensional images were obtained, as shown in
Figure 8. It can be seen from the measurement results that the average gray values of floc under the four flocculants ZYZ, ZYD, JYC-1, and JYC-2 are 122, 116, 119, and 107, respectively. The larger the average gray value is, the wider the distribution range of floc is, and the less the number of pores. Based on this, it is preliminarily determined that the percentage of pore distribution in tailings floc is sorted as follows: ZYZ < JYC-1 < ZYD < JYC-2; then the overall size of floc is sorted as: ZYZ > JYC-1 > ZYD > JYC-2.
3.3.2. Analysis of the Spatial Distribution Characteristics of Flocs Based on Binarized Images
A reasonable segmentation threshold is selected to binarize the SEM images in
Figure 7 to obtain the proportion of floc in SEM images. The binary images of floc are shown in
Figure 9, wherein the white area indicates the floc and the black area is the pores between floc.
The grayscale values of processed SEM image are only 0 and 256. The following models are established based on mathematical statistics [
25,
26]. If
X ~
N(0, 1) and
P(
X = 0) =
p and
P(
p1 <
p <
p2) ≈ 1 −
, then an approximate confidence interval of
X is (
p1,
p2) when the confidence level of
p is 1 −
.
Figure 8 shows grayscale values of only 0 and 256, which obey the 0–1 distribution model in mathematical statistics. Thus, the overall grayscale value of the images can be estimated by the grayscale value of the selected sample points. As shown in
Table 5, a number of sample points are selected in the images, and the numbers of points with grayscale values of 0 or 255 are counted. The confidence intervals of points with grayscale value of 255 are calculated using Equations (1)–(3). The confidence level is 0.95, which represents the percentage range of floc in the binary images.
Table 6 shows the floc percentage range of ZYZ, ZYD, JYC-1, JYC-2 at (58.7%, 64.7%), (55.5%, 61.5%), (56.6%, 62.7%), and (52.9%, 59.0%), respectively, when the confidence level is 0.95. The result is ZYZ > JYC-1 > ZYD > JYC-2 when the lower and upper confidence interval values are sorted separately. Results show that the grayscale value of the tail sand flocculation group under ZYZ flocculant is the highest number at 255 points. This result indicates the largest area occupied by floc, which has the lowest pore percentage content and the tightest overall flocculation structure. The results of the analysis further confirm the results of previous analysis that the ZYZ flocculant is suitable for the classified fine tailings of the optimal flocculant model.
3.3.3. Fractal Characteristics of Floc Structure of Classified Fine Tailings
The fractal theory is a discipline that studies a kind of irregular and chaotic object with similarity of its part and whole. Fractal dimension constitutes the main tool to test for fractal patterns in Euclidean contexts. The (lower/upper) box dimension for any subset
F ⊆ Rd is given by the following (lower/upper) limit:
where
Nδ (
F) is the number of
δ-cubes that intersect
F [
27].
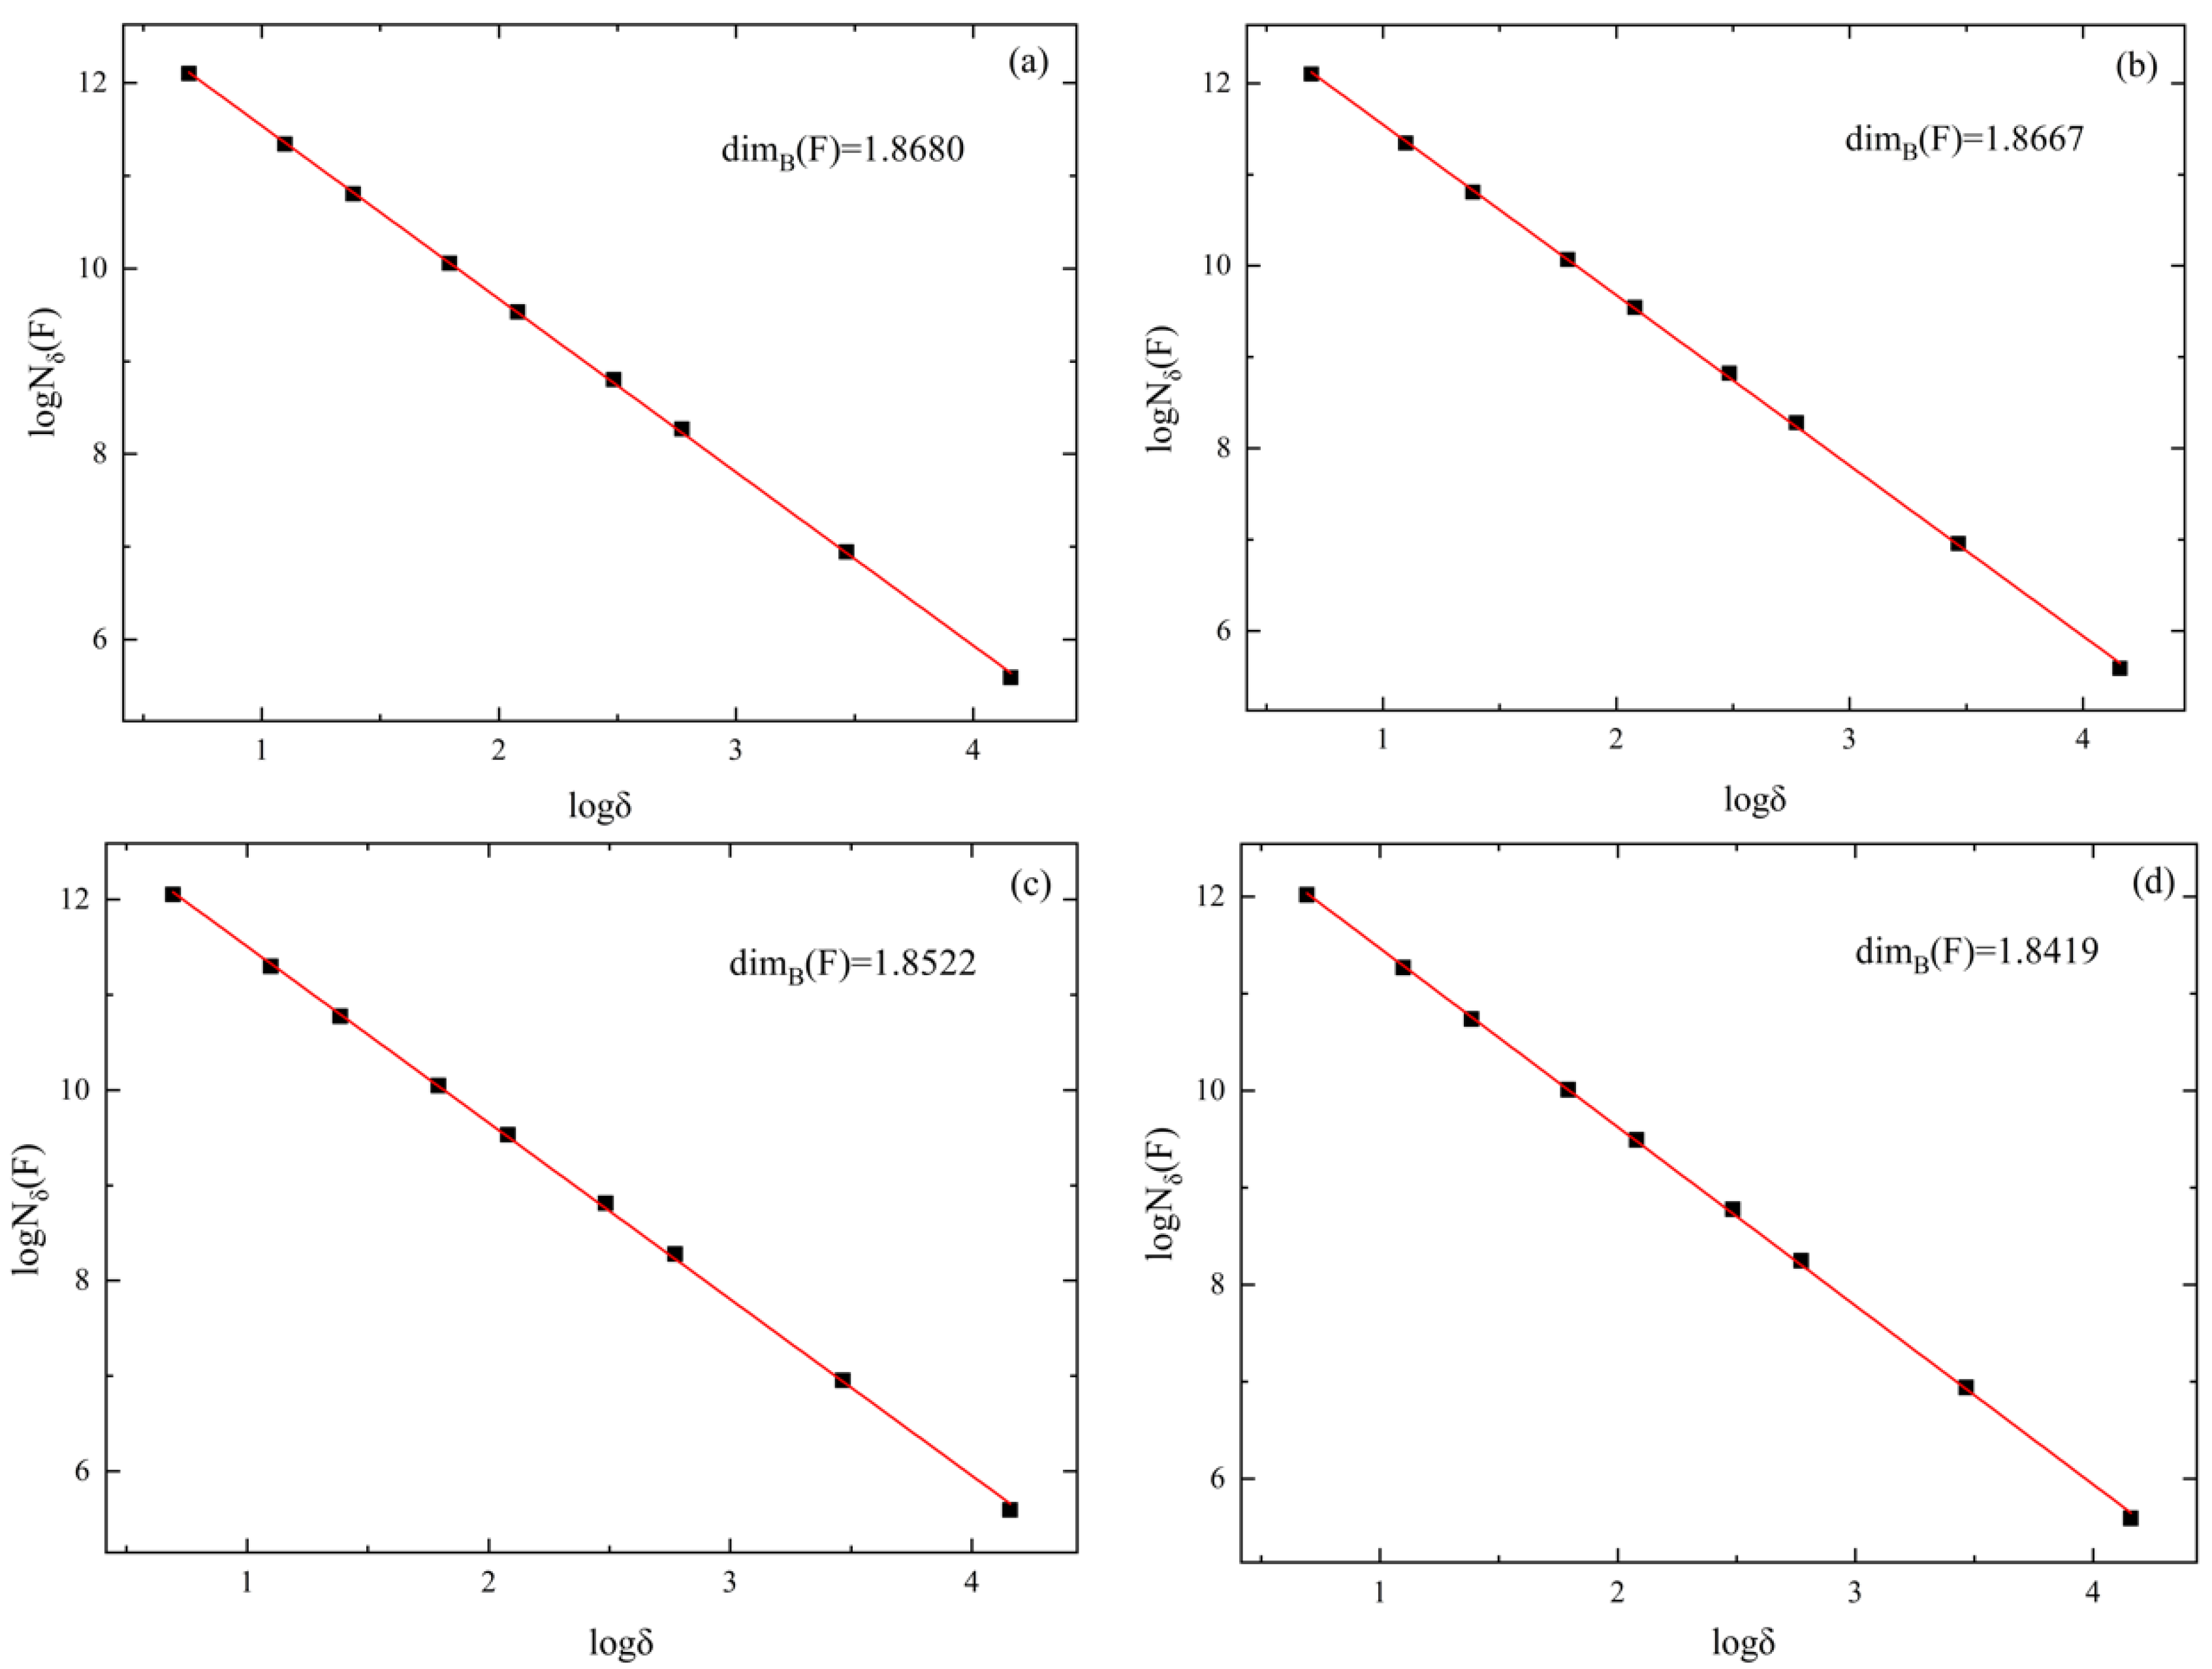
Classified fine tailings floc is an irregular mass formed by the collision and combination of tailings particles and flocculants under the action of Brownian motion and turbulence. The formation process of floc shows that the floc has fractal characteristics, so the fractal dimension can be used as a quantitative control parameter and the flocculation effect of the flocculant can be compared by comparing the size of the fractal dimension. As shown in
Figure 10, fractal dimensions of classified fine tailings under the four flocculants are 1.8680, 1.8667, 1.8522, and 1.8419, respectively. It can be seen that the fractal dimension of the floc structure under ZYZ flocculant is the largest, which means the floc is the most compact, the particle spacing inside the floc is the smallest, the difference between the floc density and the liquid density is the largest, and the settling velocity is the largest, so the flocculation effect most. According to the fractal theory, the order of the flocculation effect of the four flocculants on the classified fine tailings is ZYZ > JYC-1 > ZYD > JYC-2.
3.4. Analysis of the Morphology and Spatial Structure Characteristics of Floc
The optimal flocculant was selected to configure the floc solution of classified fine tailings. As shown in
Figure 11, the upper, middle, and lower parts of the sedimentary mud layer (
Figure 3) were taken to produce microscope scanning samples and obtain SEM images of floc at different settlement heights.
3.4.1. Analysis of the Granularity and Morphological Characteristics of Floc
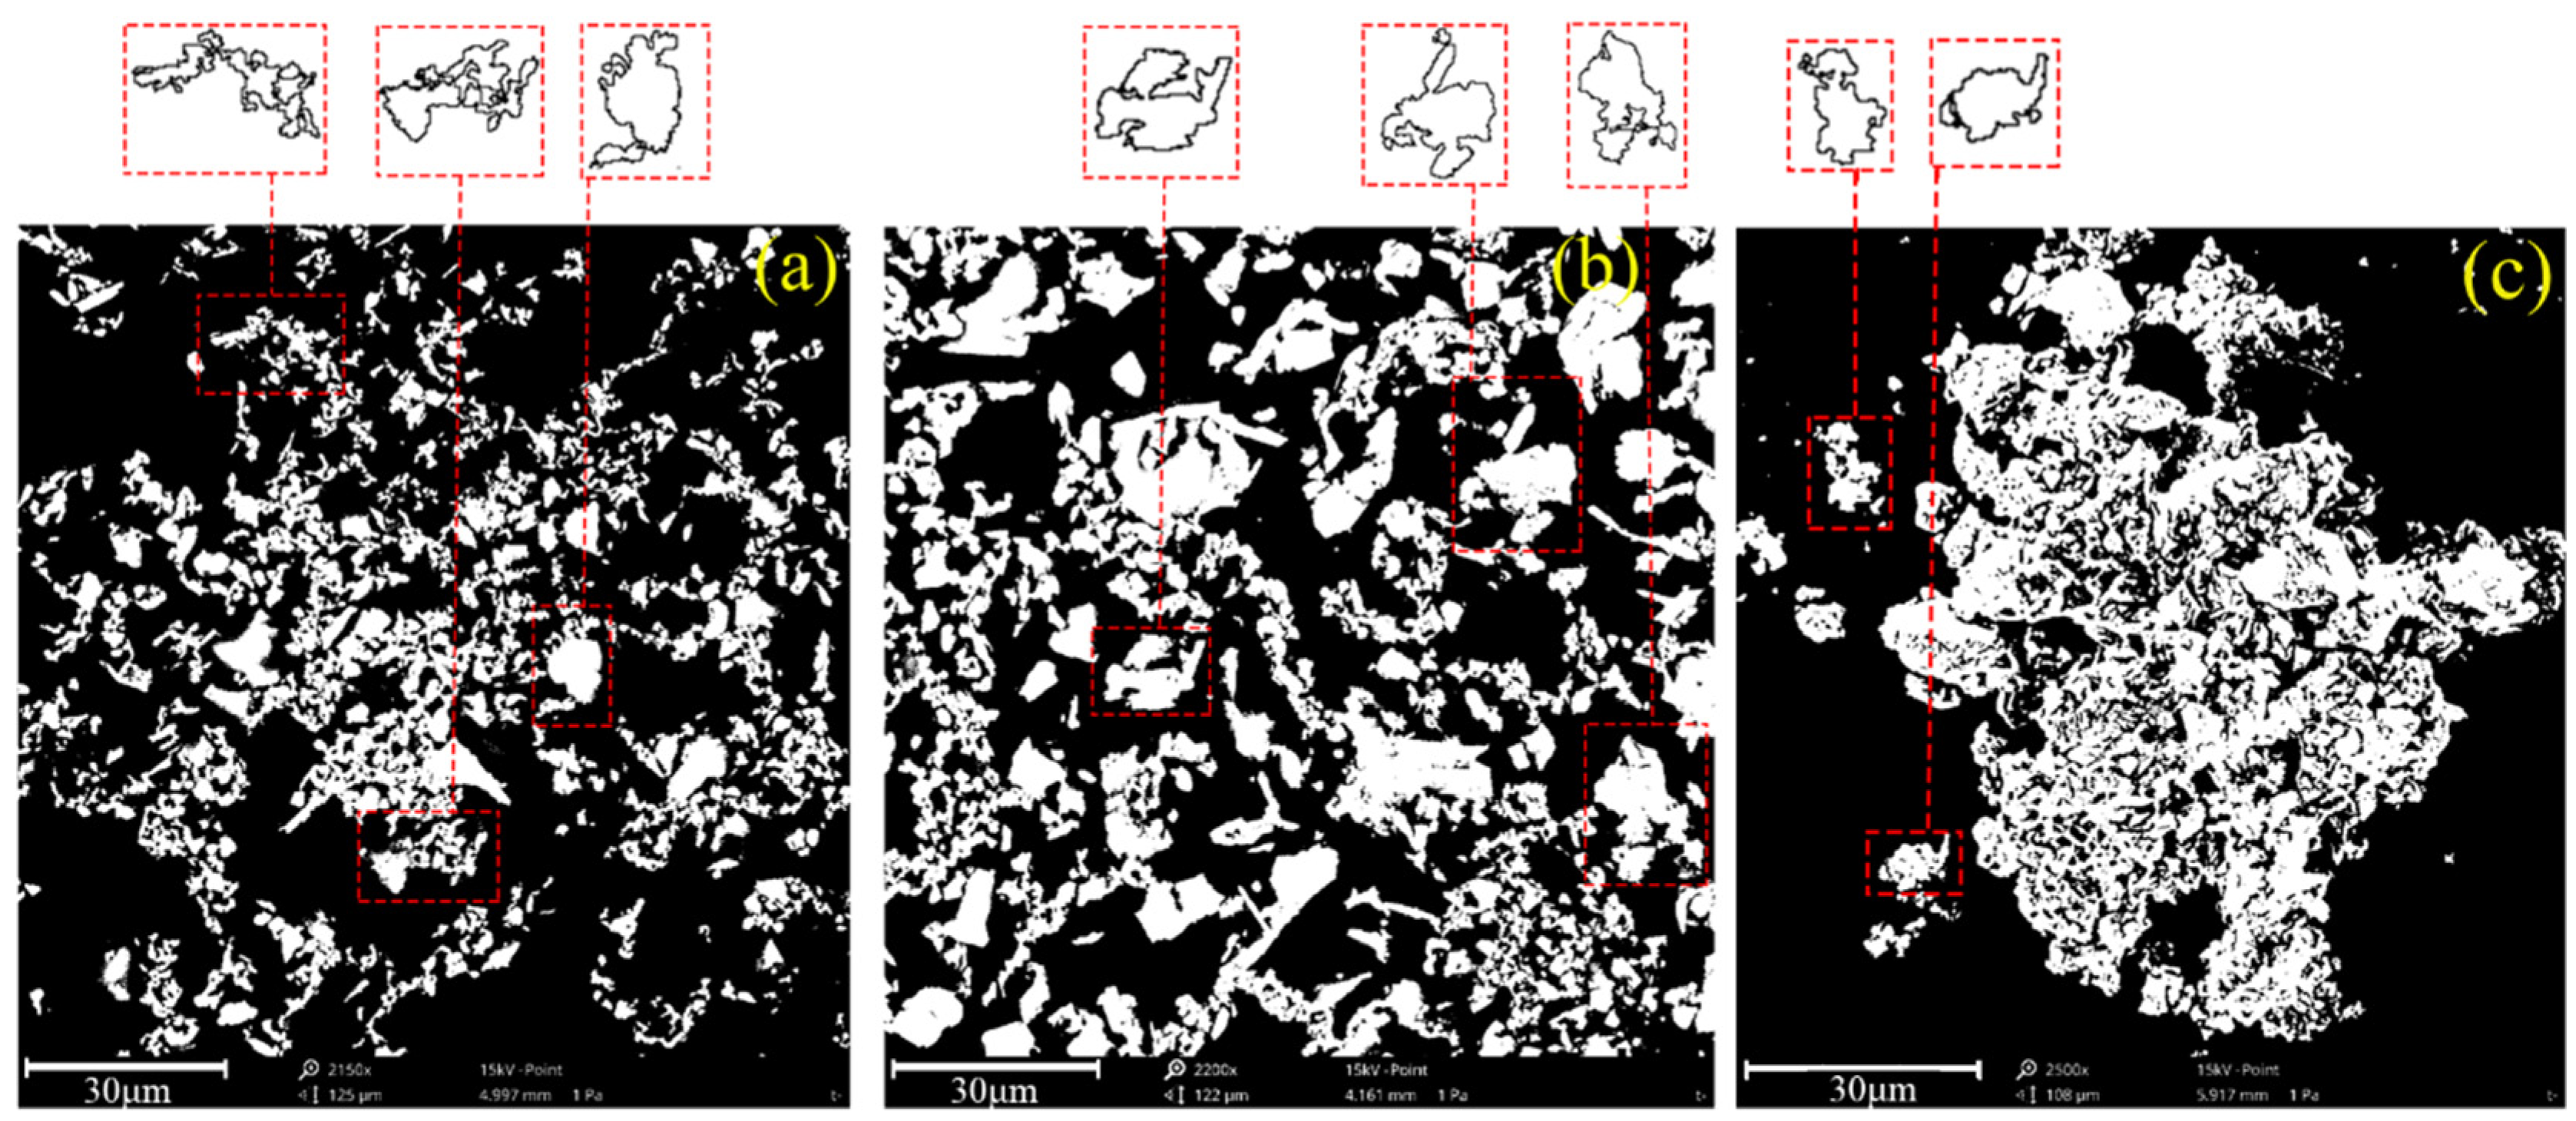
The SEM images of the floc at different settlement heights were binarized. To obtain the perfect image profile, edge detection was performed, and the boundary discrete points were connected to a closed curve [
28,
29,
30,
31]. The area of the closed floc tailings block is shown in
Figure 12, and the white part of the figure is the floc. The profile of the floc is clear, and the particles at different settlement heights show distinct characteristics. The upper floc are more dispersed, the middle floc are larger in size, and the lower floc are denser.
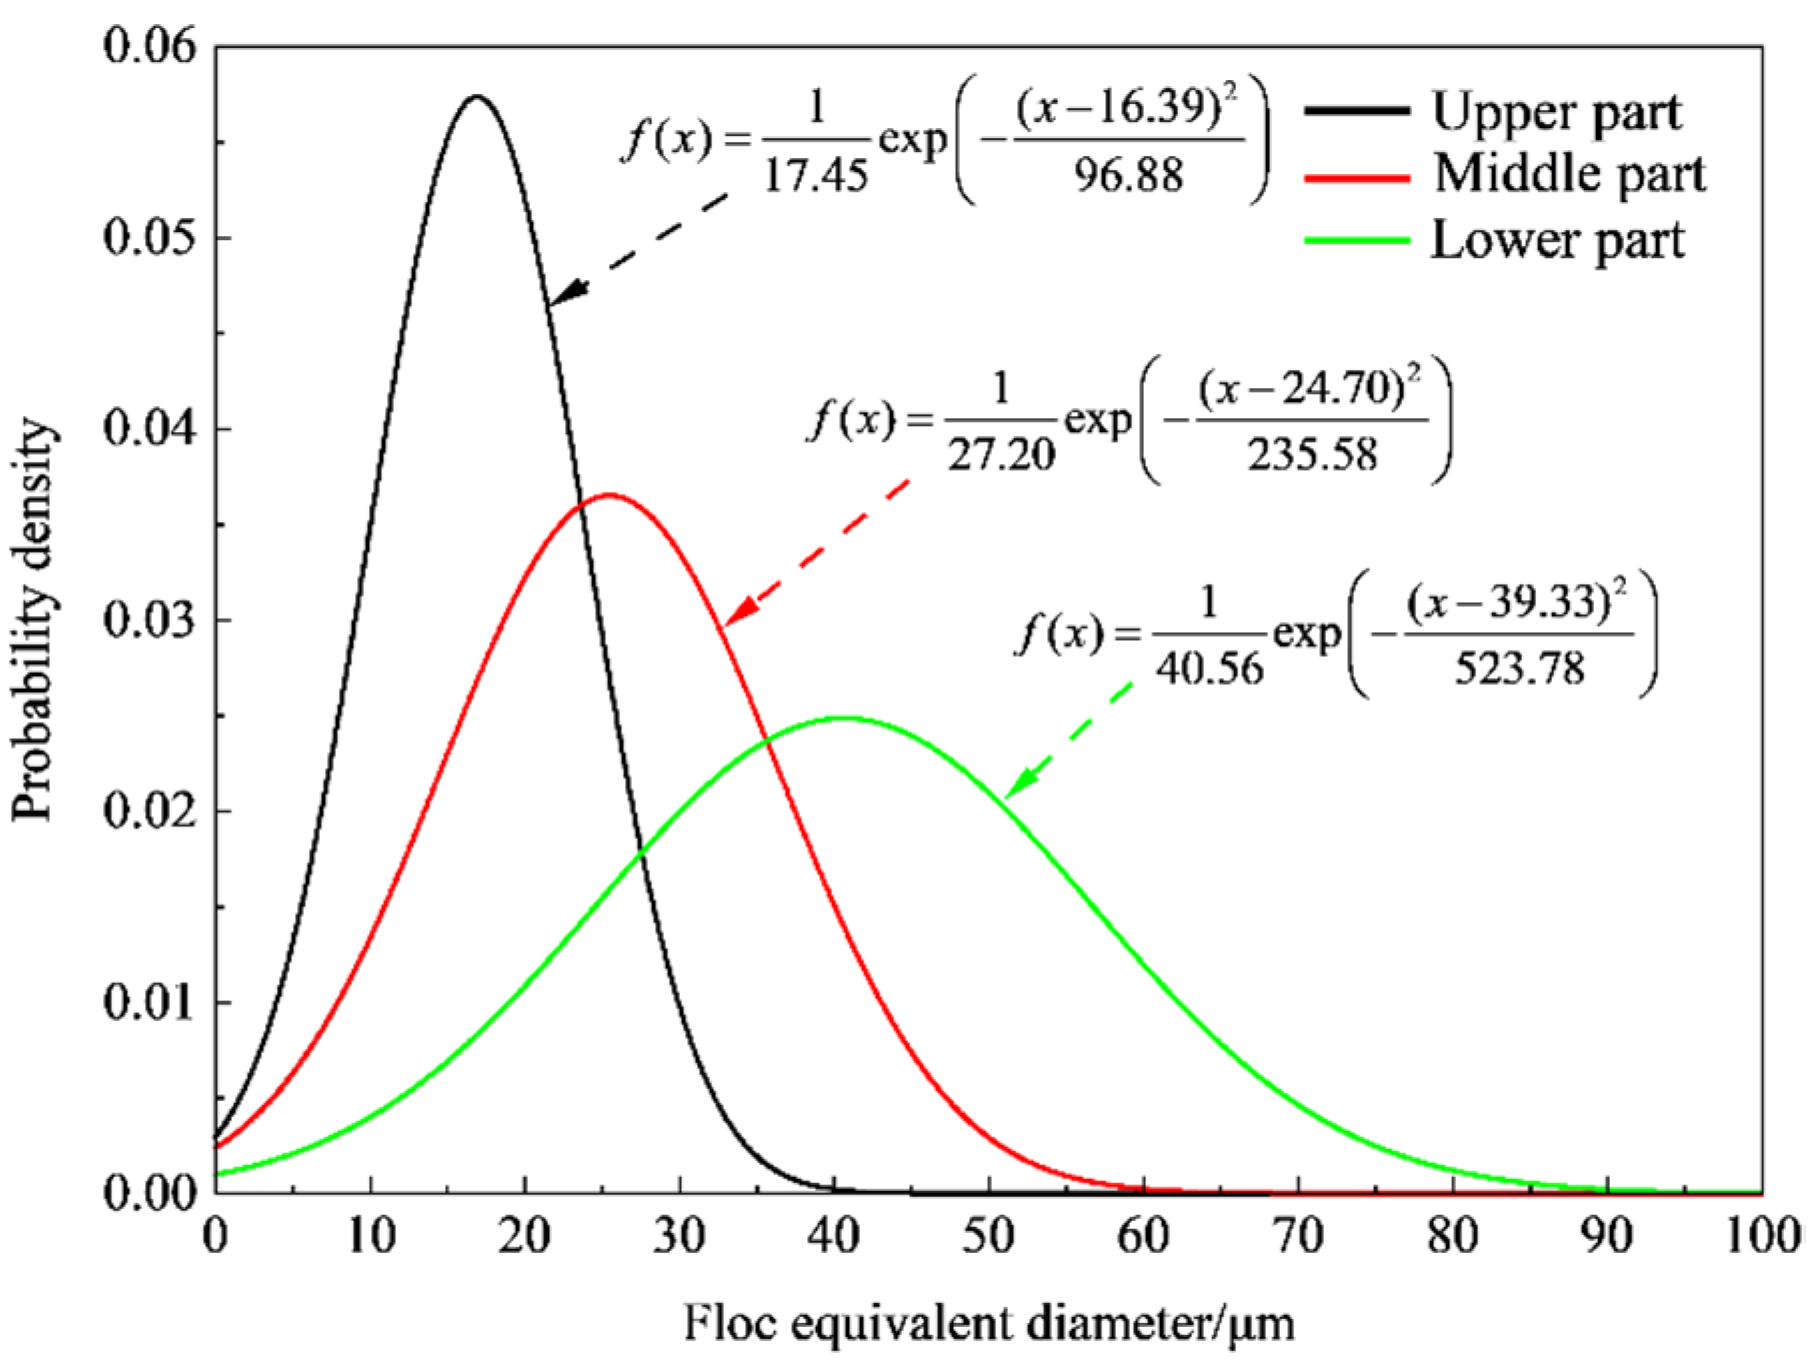
The equivalent diameter of the floc was obtained according to the closed area of the selected floc contour. The normal distribution curve of the tail-sand floc size was obtained through fitting, as shown in
Figure 13. Small-size floc account for a large proportion in the upper part, which range from 5 to 30 μm. The size of the middle floc has increased and is concentrated between 10 and 40 μm. The lower large-size floc account for a large proportion and are concentrated at 20 to 60 μm. The average equivalent diameters of the upper, middle, and lower floc are 16.39 μm, 24.70 μm, and 39.33 μm, which indicate that the diameter of the floc is negatively correlated with settlement height.
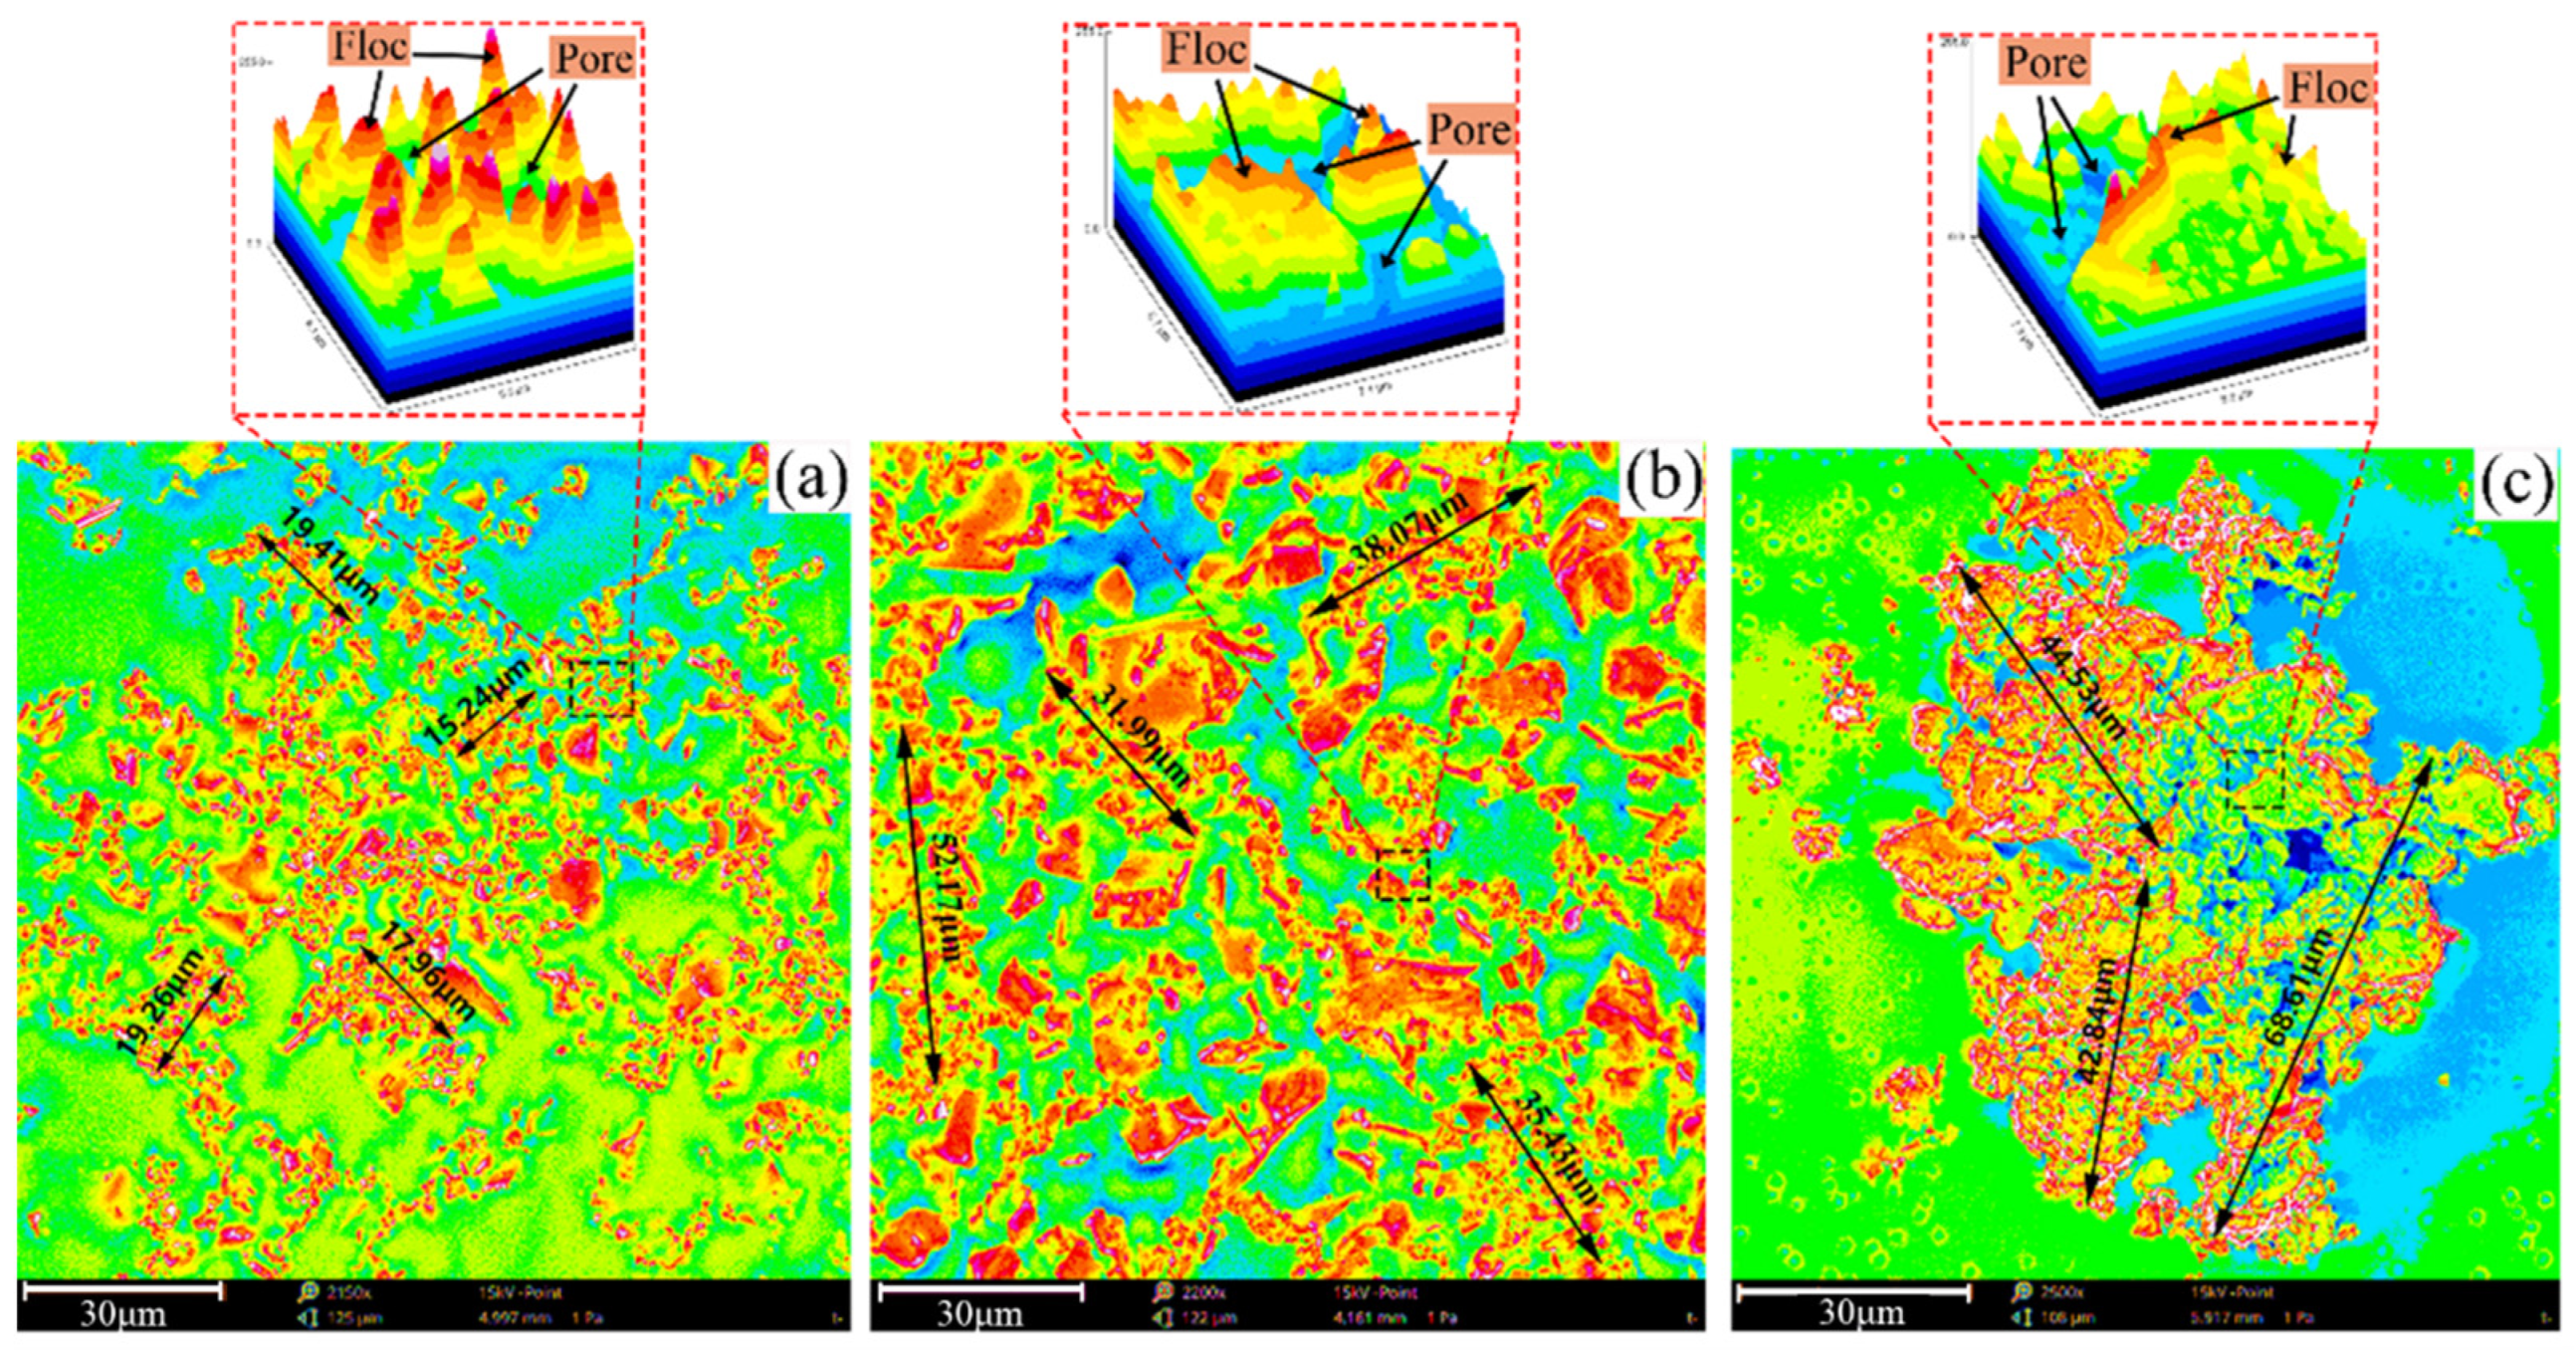
3.4.2. Analysis of the Spatial Structure Characteristics of Floc
The SEM images are colored, as shown in
Figure 14, to analyze the spatial and morphological characteristic of floc at different settling heights. The sizes of the floc in the upper sample are small, which range from 15.24 μm to 19.41 μm. The overall structure of floc is loose. The size of the middle floc increased, some of which are between 31.99 μm and 52.17 μm. The mass structure of the floc is denser than that of the upper floc. The overall size of the lower floc is the largest, and range between 42.84 μm and 68.61 μm. Floc structure is densest in the lower floc.
The size of the floc increases with the decrease in settlement height of the bed layer because a gap exists between the floc after the end of the flocculation phase. Thus, floc could continue to settle under gravity, and gap moisture is squeezed out because of floc pressure. The floc that are originally separated by gap water can then touch each other, which results in a corresponding reduction in the pores of the floc and an increase in floc size. The lower the settlement height of the mud layer, the stronger the pressure on the gap moisture, and the higher the amount of discharge. Therefore, the size of floc increases from top to bottom, and the overall structure of the floc gradually transitions from loose to dense.
4. Conclusions
The porosity and aperture distribution characteristics of floc solution of the classified fine tailings were analyzed through indoor static subsidence, MRI observation, and micro-electric scanning. The microstructure of floc were characterized by analyzing the size and spatial distribution characteristics of floc under different flocculants and the granularity and spatial morphological characteristics of floc at different heights of mud layers. The analysis provides a scientific basis for the selection of optimal flocculation agent from the microscopic angle. The main conclusions are as follows.
(1) The addition of flocculant significantly accelerates the pre-settling speed of classified fine tailings. The tailings flocculation solution basically occurs in the rapid settlement process from 0 s to 60 s. The final settlement height decreases with the increase in flocculant consumption at a certain range of flocculant consumption. Flocculant consumption of 30 g/t is the critical value for enhancing the effect of flocculation settling. This value is selected as the best single-consumption value of flocculant.
(2) The analysis of MRI observations showed that the largest percentage of small aperture distribution, the smallest average aperture, and the lowest porosity of floc solution were observed under the ZYZ flocculant. This result shows that floc spacing in the tailings solution was smallest under the ZYZ flocculant. The largest average size of floc and the densest floc structure were also found under the ZYZ flocculant.
(3) The binary analysis of SEM image shows the largest area of classified floc was found under the ZYZ flocculant. The lowest pore percentage content, the largest average size of floc, the densest floc structure, and the optimal flocculation effect were also observed under the ZYZ flocculant.
(4) The particle granularity and spatial morphology characteristics of floc were analyzed at different settling heights under the ZYZ flocculant. Results show that the average equivalent diameters of the sedimentary mud layer of the upper, middle, and lower floc are 16.39 µm, 24.70 µm, and 39.33 µm, respectively. These results indicate that the equivalent diameter of floc is negatively correlated with settlement height. The size of the floc increases with the decrease in settlement height of the mud layer. The overall structure of the flocculation from top to bottom gradually transitions from loose to dense.
Author Contributions
Conceptualization, X.M. and Y.T.; Methodology, X.M. and Y.T.; Software, X.M. and Z.J.; Validation, X.M. and Y.T.; Formal Analysis, X.M. and Y.T.; Investigation, X.M.; Resources, Y.T., C.H. and M.G.; Data Curation, X.M. and Y.T.; Writing—Original Draft Preparation, X.M.; Writing—Review and Editing, Y.T.; Visualization, X.M.; Supervision, Y.T.; Project Administration, Y.T.; Funding Acquisition, Y.T. All authors have read and agreed to the published version of the manuscript.
Funding
This work was financially supported by the National Natural Science Foundation of China (No. 52004019) and the National Key Research and Development Program of China (2018YFC0604602).
Institutional Review Board Statement
Not applicable.
Informed Consent Statement
Not applicable.
Conflicts of Interest
The authors declare no conflict of interest.
References
- Yang, Y.; Zhou, X.; Chen, X.; Xie, C. Numerical Simulation of Tailings Flow from Dam Failure over Complex Terrain. Materials 2022, 15, 2288. [Google Scholar] [CrossRef] [PubMed]
- Menéndez-Agudo, L.D.; Sánchez, M.M.; Rodríguez, M.A.; Coello Velázquez, A.L.; Menéndez-Agudo, J.M. Recycled Mineral Raw Materials from Quarry Waste Using Hydrocyclones. Materials 2019, 12, 2047. [Google Scholar]
- Ou, X.; Chen, S.; Jiang, J.; Qin, J.; Tan, Z. Analysis of Engineering Characteristics and Microscopic Mechanism of Red Mud–Bauxite Tailings Mud Foam Light Soil. Materials 2022, 15, 1782. [Google Scholar] [CrossRef]
- Wu, A.X.; Yang, Y.; Cheng, H.Y.; Shun, S.M.; Han, Y. Status and Prospects of Paste Technology in China. Chin. J. Eng. 2018, 40, 517–525. [Google Scholar]
- Gan, D.Q.; Han, L.; Liu, Z.Y.; Zhao, H.X.; Cai, X.S. Study on the Flocculation Settlement Characteristics of Fine-grained Tailings. Min. Res. Dev. 2017, 37, 31–35. [Google Scholar]
- Wang, L.H.; Bao, A.H.; Luo, Y.Y. Development and Outlook on the Filling Method in China. Min. Res. Dev. 2017, 37, 1–7. [Google Scholar]
- Lv, X.D.; Liu, Z.A.; Zhu, Z.G.; Li, B.X. Study of the Progress of Tailings Comprehensive Utilization of Raw Materials in Cement and Concrete. Mater. Rep. 2018, 32, 452–456. [Google Scholar]
- Yang, L.H.; Wang, H.J.; Wu, A.X.; Li, H.; Chen, H.; Huo, C. Effect of flocculation settling on rheological characteristics of full tailing slurry. J. Cent. S. Univ. Sci. Technol. 2016, 47, 3523–3529. [Google Scholar]
- Wu, A.X.; Zhou, L.; Yin, S.H.; Wang, L.M. Influence factors on flocculation sedimentation of unclassified tailings. Chin. J. Nonferrous Met. 2016, 26, 439–446. [Google Scholar]
- Rulyov, N.N.; Laskowski, J.S.; Concha, F. The use of ultra-flocculation in optimization of the experimental flocculation procedures. Physicochem. Probl. Miner. Processing 2011, 47, 5–16. [Google Scholar]
- Du, J.F.; Hou, C.; Zhu, Z.W.; Liu, H.L.; Liu, X.G.; Wang, J.S. Flocculating Sedimentation Test of Unclassified Tailings and Its Engineering Application. Met. Mine 2020, 55, 95–100. [Google Scholar]
- Zhang, M.D.; Rao, Y.Z.; Xu, W.F.; Wang, W.T.; Li, J.H. Experimental Study on Static Flocculation and Settlement of Full Tailing Mortar in a Mine. Met. Mine 2020, 12, 50–54. [Google Scholar]
- Li, J.X.; Sun, W.; Zhang, S.Y.; Liu, W.D. Factors Influencing Flocculation and Sedimentation of Full Tailings. J. Kunming Univ. Sci. Technol. (Nat. Sci.) 2021, 46, 45–53. [Google Scholar]
- Shi, C.X.; Guo, L.J.; Chen, X. Static and dynamic flocculation sedimentation characteristics of unclassified tailings. Chin. J. Nonferrous Met. 2021, 31, 194–202. [Google Scholar]
- Gao, Z.Y.; Wu, A.X.; Peng, N.B.; Jiao, H.Z.; Cheng, G.C. Research on the Flocculation Settlement Rules and Parameters Optimization of Filling Tailings. Met. Mine 2017, 52, 186–191. [Google Scholar]
- Wu, A.X.; Ruan, Z.E.; Wang, J.D.; Yin, S.H.; Ai, C.M. Optimizing the flocculation behavior of ultrafine tailings by ultra-flocculation. Chin. J. Eng. 2019, 41, 981–986. [Google Scholar]
- Wu, A.X.; Ruan, Z.E.; Bürger, R. Optimization of Flocculation and Settling Parameters of Tailings Slurry by Response Surface Methodology. Miner. Eng. 2020, 156, 106488. [Google Scholar] [CrossRef]
- Wen, Z.J.; Yang, X.B.; Li, L.T.; Gao, Q.; Wang, H.Z. Selection and Optimization of Flocculation Sedimentation Parameters of Unclassified Tailings Slurry Based on RSM-BBD. Chin. J. Nonferrous Met. 2020, 30, 1437–1445. [Google Scholar]
- Ruan, Z.E.; Wu, A.X.; Wang, J.D.; Yin, S.H.; Wang, Y. Flocculation and Setting Behavior of Unclassified Tailings Based on Measurement of Floc Chord Length. Chin. J. Eng. 2020, 42, 980–987. [Google Scholar]
- Hou, H.Z.; Li, C.P.; Wang, S.Y.; Yan, B.H. Settling Velocity Variation of Mud Layer and Particle Settling Characteristics in Thickening of Tailings. J. Cent. S. Univ. Sci. Technol. 2019, 50, 1428–1436. [Google Scholar]
- Yang, Z.L.; Tan, Y.Y.; Fu, J.X.; Zheng, D.; Wang, Y. Optimal Selection of Flocculant for Full Tailings and Floc NMR Analysis. Min. Res. Dev. 2021, 41, 136–140. [Google Scholar]
- Ruan, Z.E.; Wu, A.X.; Jiao, H.Z.; Li, C.P.; Li, G.C.; Mo, Y.; Wang, H.J. Advances and Trends on Thickening of Full-tailings Slurry in China. Chin. J. Nonferrous Met. 2022, 32, 286–301. [Google Scholar]
- Li, C.P.; Chen, G.Z.; Hou, H.Z.; Yan, B.H. Summary of Research Progress on Floc Structure of Tailings Thickening for Paste Backfill. Met. Mine 2021, 50, 14–23. [Google Scholar]
- Zheng, D.; Song, W.D.; Fu, J.X.; Cao, S.; Yang, Z.L.; Sun, L.J. Research on Mechanical Characteristics, Fractal Dimension and Internal Structure of Fiber Reinforced Concrete under Uniaxial Compression. Constr. Build. Mater. 2020, 258, 120351. [Google Scholar] [CrossRef]
- Li, H. Research on Estimation of Parameter in Binomial Distribution. Acta Math. Appl. Sin. 2010, 33, 385–394. [Google Scholar]
- Fu, H.M.; Liang, C.H. Confidence test methods for binomial distribution. J. Mech. Strength 2003, 29, 513–518. [Google Scholar]
- Fernández-Martínez, M.; Nowak, M.; Sánchez-Granero, M.A. Counterexamples in theory of fractal dimension for fractal structures. Chaos Solitons Fractals 2016, 210–223. [Google Scholar] [CrossRef] [Green Version]
- Hu, W.W.; Zhou, R.G.; Fan, P.; Li, X.C. Quantum Image Edge Detection Based on Canny Algorithm. J. Zhengzhou Univ. (Nat. Sci. Ed.) 2020, 52, 37–52. [Google Scholar]
- Li, J.; Chen, G.F.; Ding, X.Q. Research on Image Edge Detection Method Based on Improved Canny Algorithm. Comput. Simul. 2021, 38, 371–375. [Google Scholar]
- Li, J.; Li, G.Y.; Yao, R.J.; Wu, L. Check of MR image edge information of lumber intervertebral disc using an improved Canny algorithm. J. Jilin Univ. (Eng. Technol. Ed.) 2016, 46, 1704–1709. [Google Scholar]
- Cai, G.P.; Wang, L.; Luo, X.Y.; Jiang, Z.H. Multi-threshold Binary Algorithm for Ore Image Based on Block Processing. Min. Res. Dev. 2020, 40, 153–157. [Google Scholar]
Figure 1.
Particle size distribution diagram of classified fine tailings.
Figure 1.
Particle size distribution diagram of classified fine tailings.
Figure 2.
Nuclear magnetic resonance observation experiment: (a) MRI analyzer; (b) samples of floc solution; (c) floc extraction location.
Figure 2.
Nuclear magnetic resonance observation experiment: (a) MRI analyzer; (b) samples of floc solution; (c) floc extraction location.
Figure 3.
Electron microscope scanning experiment: (a) floc samples under four flocculants; (b) sampling positions at different height in a volumetric flask; (c) Phenom XL desktop SEM.
Figure 3.
Electron microscope scanning experiment: (a) floc samples under four flocculants; (b) sampling positions at different height in a volumetric flask; (c) Phenom XL desktop SEM.
Figure 4.
Settlement process of floc (a) and change curve of height with time under different flocculant consumption (b).
Figure 4.
Settlement process of floc (a) and change curve of height with time under different flocculant consumption (b).
Figure 5.
Curve of pore size distribution percentage of floc under different flocculants.
Figure 5.
Curve of pore size distribution percentage of floc under different flocculants.
Figure 6.
Pore size distribution characteristics of floc solution under different flocculants: (a) average pore size; (b) pore size distribution percentage.
Figure 6.
Pore size distribution characteristics of floc solution under different flocculants: (a) average pore size; (b) pore size distribution percentage.
Figure 7.
SEM images of floc under different flocculants.
Figure 7.
SEM images of floc under different flocculants.
Figure 8.
Grayscale measurement images of floc.
Figure 8.
Grayscale measurement images of floc.
Figure 9.
Binarized images of floc under different flocculants.
Figure 9.
Binarized images of floc under different flocculants.
Figure 10.
Fractal characteristic curve of floc structure: (a) ZYZ; (b) JYC-1; (c) ZYD; (d) JYC-2.
Figure 10.
Fractal characteristic curve of floc structure: (a) ZYZ; (b) JYC-1; (c) ZYD; (d) JYC-2.
Figure 11.
SEM images of floc with different settlement heights under ZYZ type flocculant: (a) upper part; (b) middle part; (c) lower part.
Figure 11.
SEM images of floc with different settlement heights under ZYZ type flocculant: (a) upper part; (b) middle part; (c) lower part.
Figure 12.
Particle size and morphological characteristics of floc with different settlement heights under ZYZ type flocculant: (a) upper part; (b) middle part; (c) lower part.
Figure 12.
Particle size and morphological characteristics of floc with different settlement heights under ZYZ type flocculant: (a) upper part; (b) middle part; (c) lower part.
Figure 13.
Distribution curve of equivalent diameters of floc at different heights under ZYZ type flocculant.
Figure 13.
Distribution curve of equivalent diameters of floc at different heights under ZYZ type flocculant.
Figure 14.
Spatial morphology of floc with different settlement heights under ZYZ type flocculant: (a) upper part; (b) middle part; (c) lower part.
Figure 14.
Spatial morphology of floc with different settlement heights under ZYZ type flocculant: (a) upper part; (b) middle part; (c) lower part.
Table 1.
Physical properties of classified fine tailings.
Table 1.
Physical properties of classified fine tailings.
| Material Name | Specific Gravity | Loose Density/(g·cm−1) | Average Particle Size/μm | Porosity/% |
|---|
| Classified fine tailings | 2.55 | 0.86 | 13.20 | 57.36 |
Table 2.
Main chemical composition of classified fine tailings.
Table 2.
Main chemical composition of classified fine tailings.
| Chemical Composition | SiO2 | Al2O3 | CaO | Fe2O3 | K2O | MgO | Na2O | TiO2 |
|---|
| Percentage/% | 61.754 | 12.689 | 9.182 | 5.953 | 4.437 | 3.305 | 1.244 | 0.650 |
Table 3.
Parameters of different types of flocculants.
Table 3.
Parameters of different types of flocculants.
| Types of Flocculants | ZYZ | ZYD | JYC-1 | JYC-2 |
|---|
| Molecular weight | 16–18 million | 16–18 million | 16 million | 18 million |
| State | White solid particles |
Table 4.
Grouping table of static flocculation and settlement experiment.
Table 4.
Grouping table of static flocculation and settlement experiment.
| Experiment Group Number | 1 | 2 | 3 | 4 | 5 (Control Group) |
|---|
| Unit consumption of flocculant/(g·t−1) | 10 | 20 | 30 | 40 | 0 |
Table 5.
Numer of counted points with grayscale value of 0 or 255.
Table 5.
Numer of counted points with grayscale value of 0 or 255.
| Flocculants | Number of Sample Points | Number of Points with Grayscale Value of 255 | Number of Points with Grayscale Value of 0 |
|---|
| ZYZ | 1020 | 630 | 390 |
| ZYD | 1022 | 598 | 424 |
| JYC-1 | 1022 | 610 | 412 |
| JYC-2 | 1022 | 572 | 450 |
Table 6.
Confidence interval of floc percentage content.
Table 6.
Confidence interval of floc percentage content.
| Flocculant | Number of Samples | Number of Points (Gray Value Is 255) | Number of Points (Gray Value Is 0) | Confidence Level ( | Confidence Interval |
|---|
| ZYZ | 1020 | 630 | 390 | 0.95 | (58.7%, 64.7%) |
| ZYD | 1022 | 598 | 424 | 0.95 | (55.5%, 61.5%) |
| JYC-1 | 1022 | 610 | 412 | 0.95 | (56.6%, 62.6%) |
| JYC-2 | 1022 | 572 | 450 | 0.95 | (52.9%, 59.0%) |
| Publisher’s Note: MDPI stays neutral with regard to jurisdictional claims in published maps and institutional affiliations. |
© 2022 by the authors. Licensee MDPI, Basel, Switzerland. This article is an open access article distributed under the terms and conditions of the Creative Commons Attribution (CC BY) license (https://creativecommons.org/licenses/by/4.0/).


