Article

Molybdenum Oxide Nanoparticle Aggregates Grown by Chemical Vapor Transport

School of Advanced Materials and Chemical Engineering, Daegu Catholic University, Gyeongsan 38430, Korea
Materials 2022, 15(6), 2182; https://doi.org/10.3390/ma15062182
Submission received: 10 February 2022 / Revised: 9 March 2022 / Accepted: 15 March 2022 / Published: 16 March 2022

Abstract

:
In this study, the advanced chemical vapor transport (CVT) method in combination with the quenching effect is introduced for creating molybdenum oxide nanoparticle arrays, composed of the hierarchical structure of fine nanoparticles (NPs), which are vertically grown with a homogeneous coverage on the individual carbon fibers of carbon fiber paper (CFP) substrates. The obtained molybdenum oxide NPs hold a metastable high-temperature γ-Mo4O11 phase along with a stable α-MoO3 phase by the quenching effect. Furthermore, such a quenching effect forms thinner and smaller nanoparticle aggregates by suppressing the growth and coalescence of primary particles. The molybdenum oxide nanoparticle aggregates are prepared using two different types of precursors: MoO3 and a 1:1 (mol/mol) mixture of MoO3 and activated carbon. The results characterized using X-ray diffraction, Raman spectroscopy, X-ray photoelectron spectroscopy, and Fourier-transform infrared spectroscopy show that the relative amount of α-MoO3 to γ-Mo4O11 within the prepared NPs is dependent on the precursor type; a lower amount of α-MoO3 to γ-Mo4O11 is obtained in the NPs prepared using the mixed precursor of MoO3 and carbon. This processing–structure landscape study can serve as the groundwork for the development of high-performance nanomaterials in various electronic and catalytic applications.

1. Introduction

Nanoscale materials have attracted intensive attention owing to their high surface area and chemical activities different from their bulk counterparts, relevant to electronics, catalysis, sensors, and energy storage applications [1,2,3,4,5,6,7,8]. Among various synthesis methods for those materials, the chemical vapor deposition (CVD) technique chemical vapor transport has been extensively used for the large-scale synthesis of uniform-sized nanomaterials [4,9,10,11]. However, in most cases, the obtained nanomaterials often suffered from poor size and shape homogeneity, with sparse substrate coverage, which are attributed to several concurrent reactions [10,11]. Particularly in the case of growth of two-dimensional (2D) nanosheets, the dominant growth of basal planes with low chemical and catalytic activities was revealed as major drawbacks of the conventional CVD technique for applications. In previous work, the novel stepwise CVD process which enabled the large-scale synthesis of the homogeneously sized and well-distributed nanoparticles (NPs) was proposed as a solution to the problems mentioned above [9]. However, the slow rate of natural furnace cooling process from the high processing temperature of 850 °C in the synthesis protocol produced somewhat thick and large-sized NPs.
Therefore, in this work, we modify the cooling time to be extremely short in the CVD process (hereafter referred to as chemical vapor transport) in order to obtain thinner and smaller nanoparticle aggregates (secondary particles) by suppressing the growth and coalescence of primary particles. Such a quenching effect from high temperature to room temperature for the nanoparticle deposition is achieved by placing the position of the substrate outside the tube furnace. Interestingly, the obtained nanoparticle aggregates hold a metastable high-temperature phase together with a stable phase within their microstructure. Their morphology exhibits the hierarchical structure composed of fine primary NPs. In addition, we deposited the molybdenum oxide nanoparticle aggregates onto conductive carbon fiber papers (CFPs) with high surface area by considering various electronic and catalytic applications such as gas sensors, supercapacitors, photocatalysts, environmental catalysts, and electrocatalysts.
Molybdenum oxide, chosen as a case material in this work, is a transition metal oxide with a versatile oxidation state and crystal structure, which has been widely used for various applications in electronics, catalysis, sensors, and electrochromic and energy storage systems [12,13,14,15,16]. In particular, molybdenum oxide possesses a wide range of non-stoichiometries from full stoichiometric MoO3 (Mo6+ ions) to reduced MoO3−x (2 < x < 3) (mainly Mo5+ ions and mixed valence) and finally to semi-metallic MoO2 (Mo4+ ions) with varying oxygen vacancies [12]. The stoichiometric MoO3 reveals diverse crystal structures: orthorhombic α-MoO3 (space group Pnma) as the thermodynamically most stable phase and monoclinic β-MoO3 (P21/c), ε-MoO3 (high-pressure phase, MoO3-II, P21/m), and hexagonal h-MoO3 (P63/m) as the metastable polymorphs [12,14]. The non-stoichiometric MoOx displays more diverse sub-oxide structures with average valences between Mo6+ and Mo4+ (Mo18O52, Mo17O47, Mo9O26, Mo8O23, Mo5O14, and Mo4O11) [12]. Among them, the metastable Magnéli phase Mo4O11 is one of the most commonly observed structures and is found either as low-temperature monoclinic η-phase or high-temperature orthorhombic γ-phase (or called α-phase) [12,15,17,18]. It is known that the reduction process of MoO3 involves the formation of Mo4O11 as the intermediate product [12,17]. In this regard, herein, we investigate structure and phase of molybdenum oxide NPs in terms of the processing–structure relationship.
Recently, various methods such as hydrothermal, sol–gel, spray pyrolysis, thermal evaporation, chemical bath deposition, and templated processes have been applied to the preparation of molybdenum oxides (mainly MoO3) [19,20,21,22,23,24]. Furthermore, the conventional CVD processes of MoO3 have been reported [25,26,27,28]. Through such CVD processes, it was easy to obtain complete amorphous or single-phased polycrystalline/single-crystalline molybdenum oxides. Otherwise, molybdenum oxides with randomly mixed stable and metastable phases were obtained by such processes, in which it was very difficult to control the phases. In contrast to thermodynamic processing, the CVD method developed in this work involves a more kinetic component. The novelty of this study can be found in the provision of an idea that can intentionally control the material phase through the facile operation of the processing.

2. Experimental

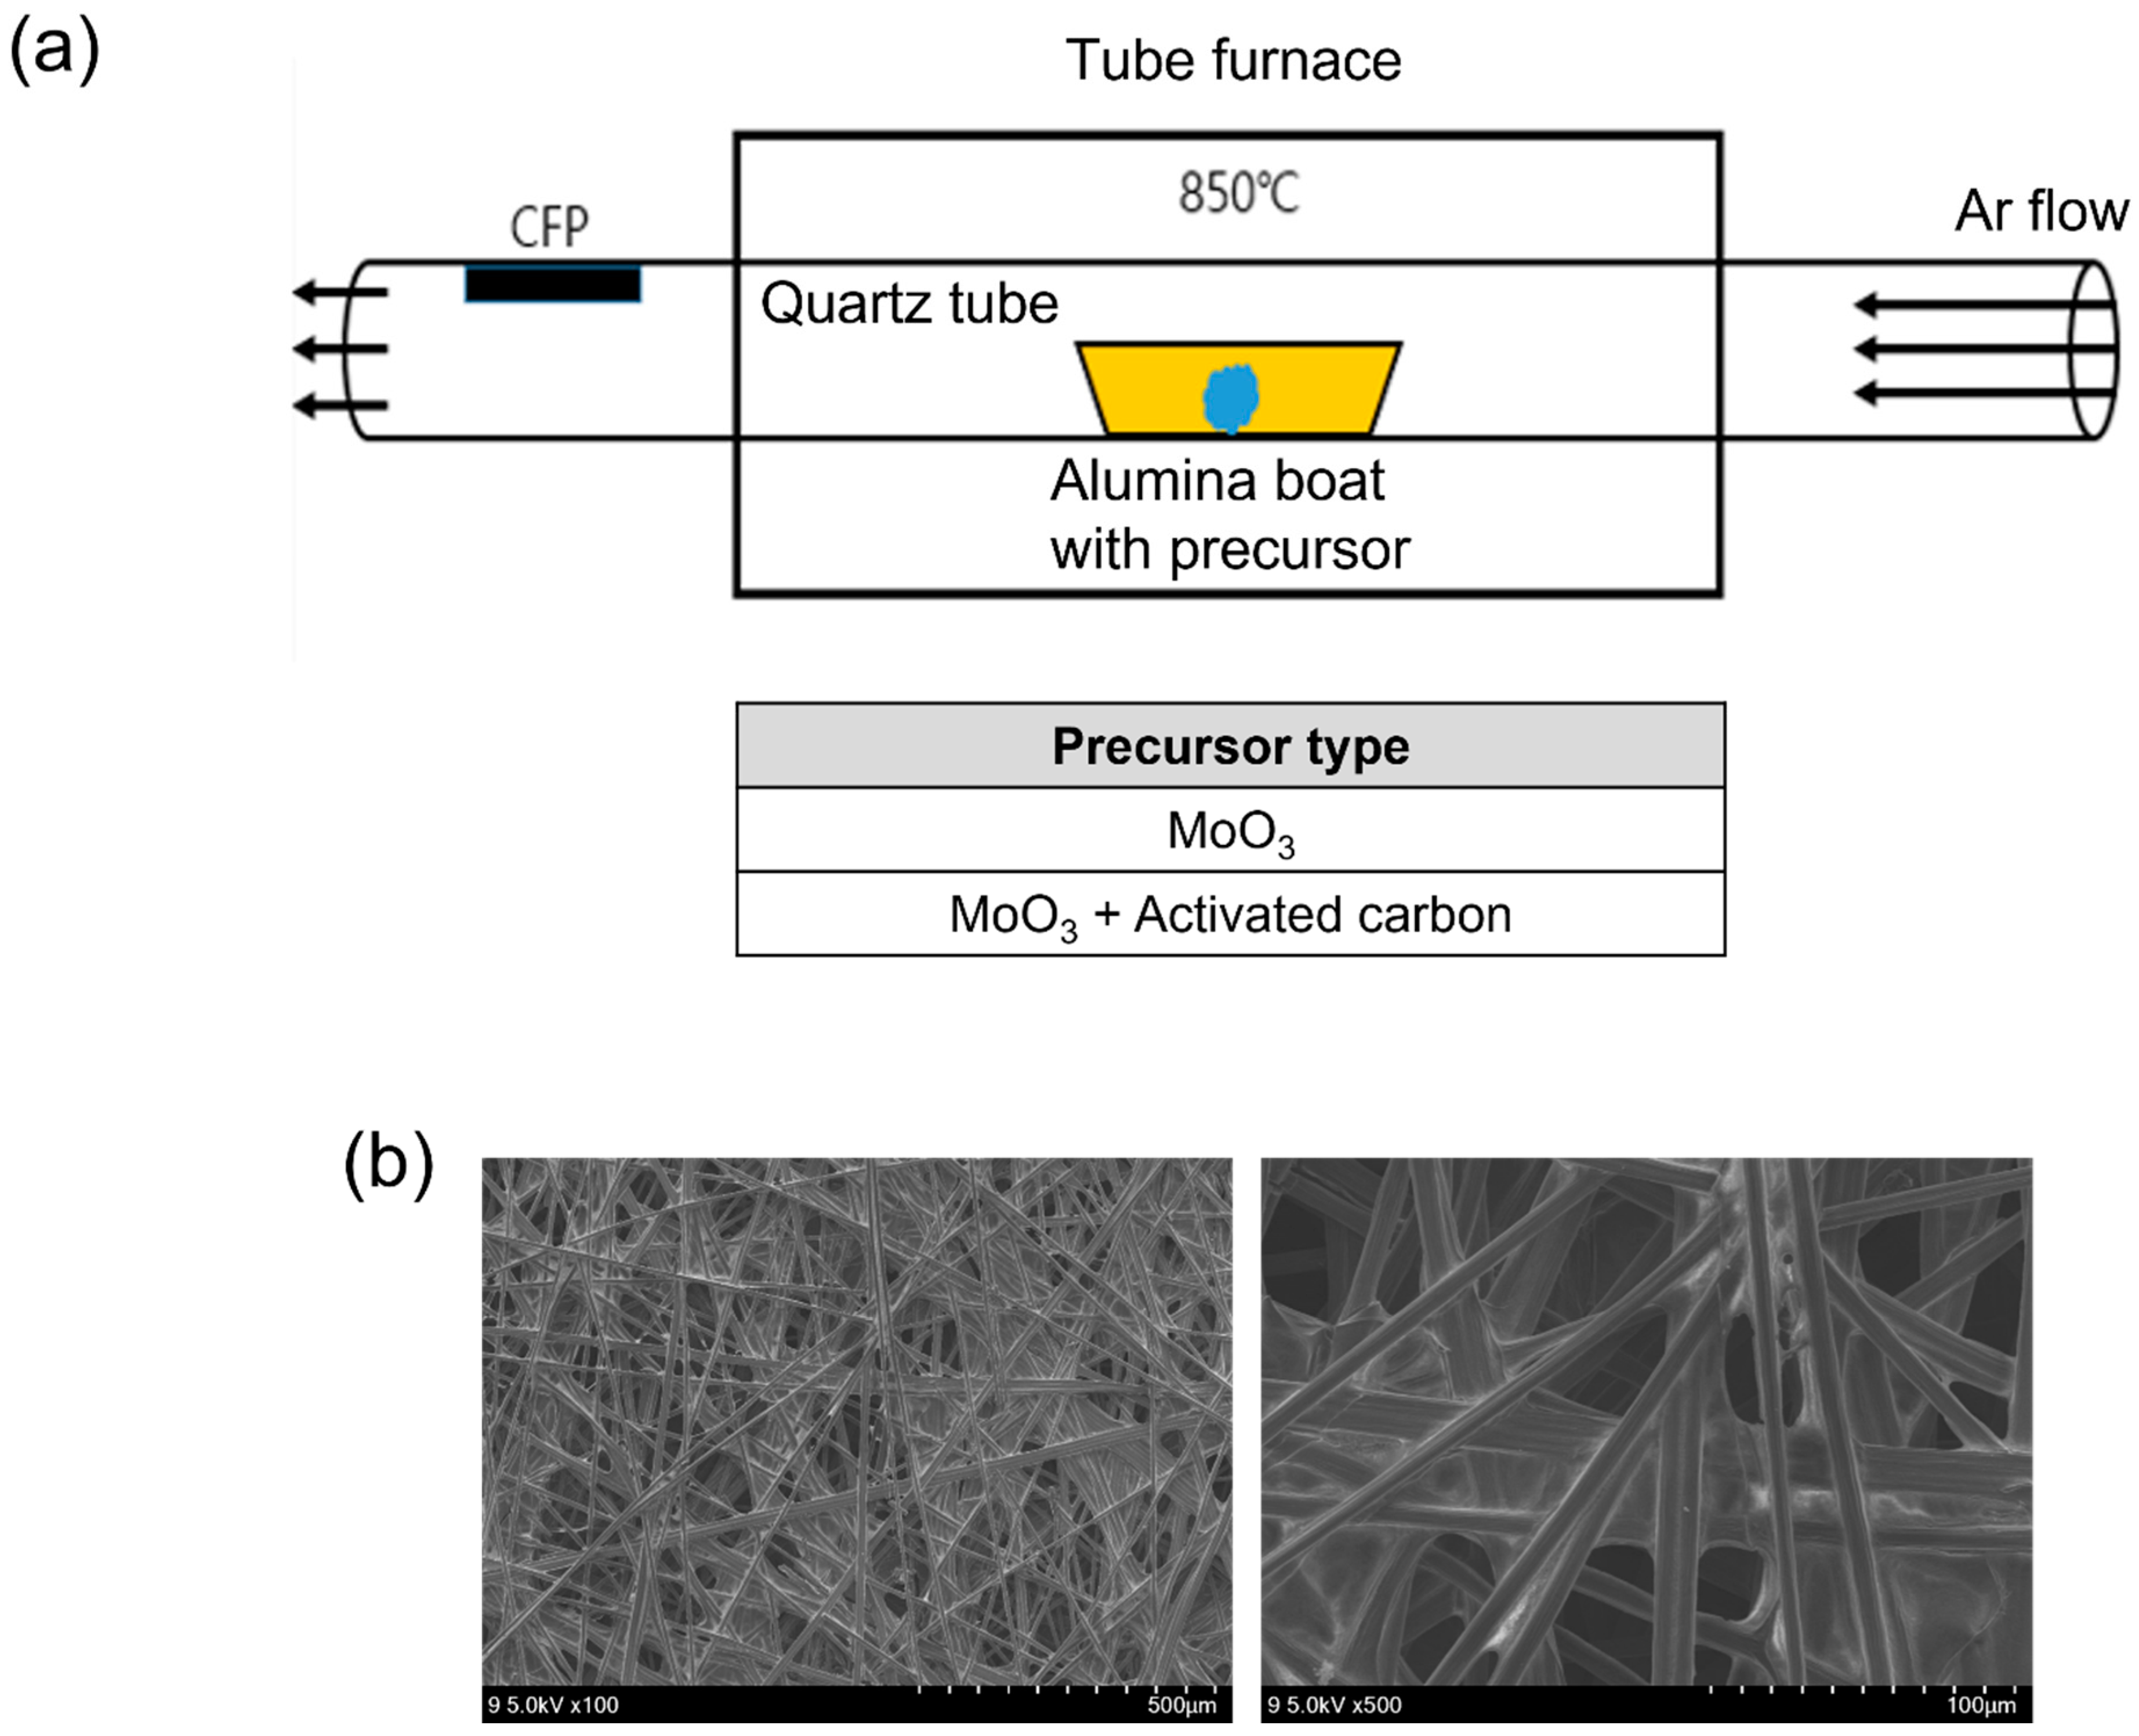
2.1. Deposition of Molybdenum Oxide Nanoparticle Aggregates

The chemical vapor transport (CVT) processes were performed using a horizontal cold-wall quartz tube (32 mm in diameter and 600 mm in length) furnace, equipped with gas flow controls. The furnace length was 400 mm, and both ends of the quartz tube were projected to the furnace outside each 100 mm. To deposit molybdenum oxide NPs, two different powder precursors, MoO3 powder (Sigma-Aldrich, St. Louis, MI, USA, ≥99.5% purity) and a 1:1 (mol/mol) mixture of MoO3 powder and activated carbon, were attempted. Each powder precursor was placed with the same amount of 15.0 mg within an alumina boat, which was located at the center of the tube. A bare carbon fiber paper (CFP, Toray paper 120) substrate with dimensions of 2 cm × 1 cm adhered using a 3M double-sided thermal tape to the top of the wall inside the quartz tube was placed downstream from the precursor source and located 50 mm outside of the furnace in order to induce the quenching effect. After an initial Ar purge for 20 min, the precursor powder was heated to 850 °C at a ramp rate of 20 °C/min and transported under a 30 cc/min Ar flow at 1 atm. After the temperature was held at 850 °C for 10 min, the furnace cooled naturally to room temperature.

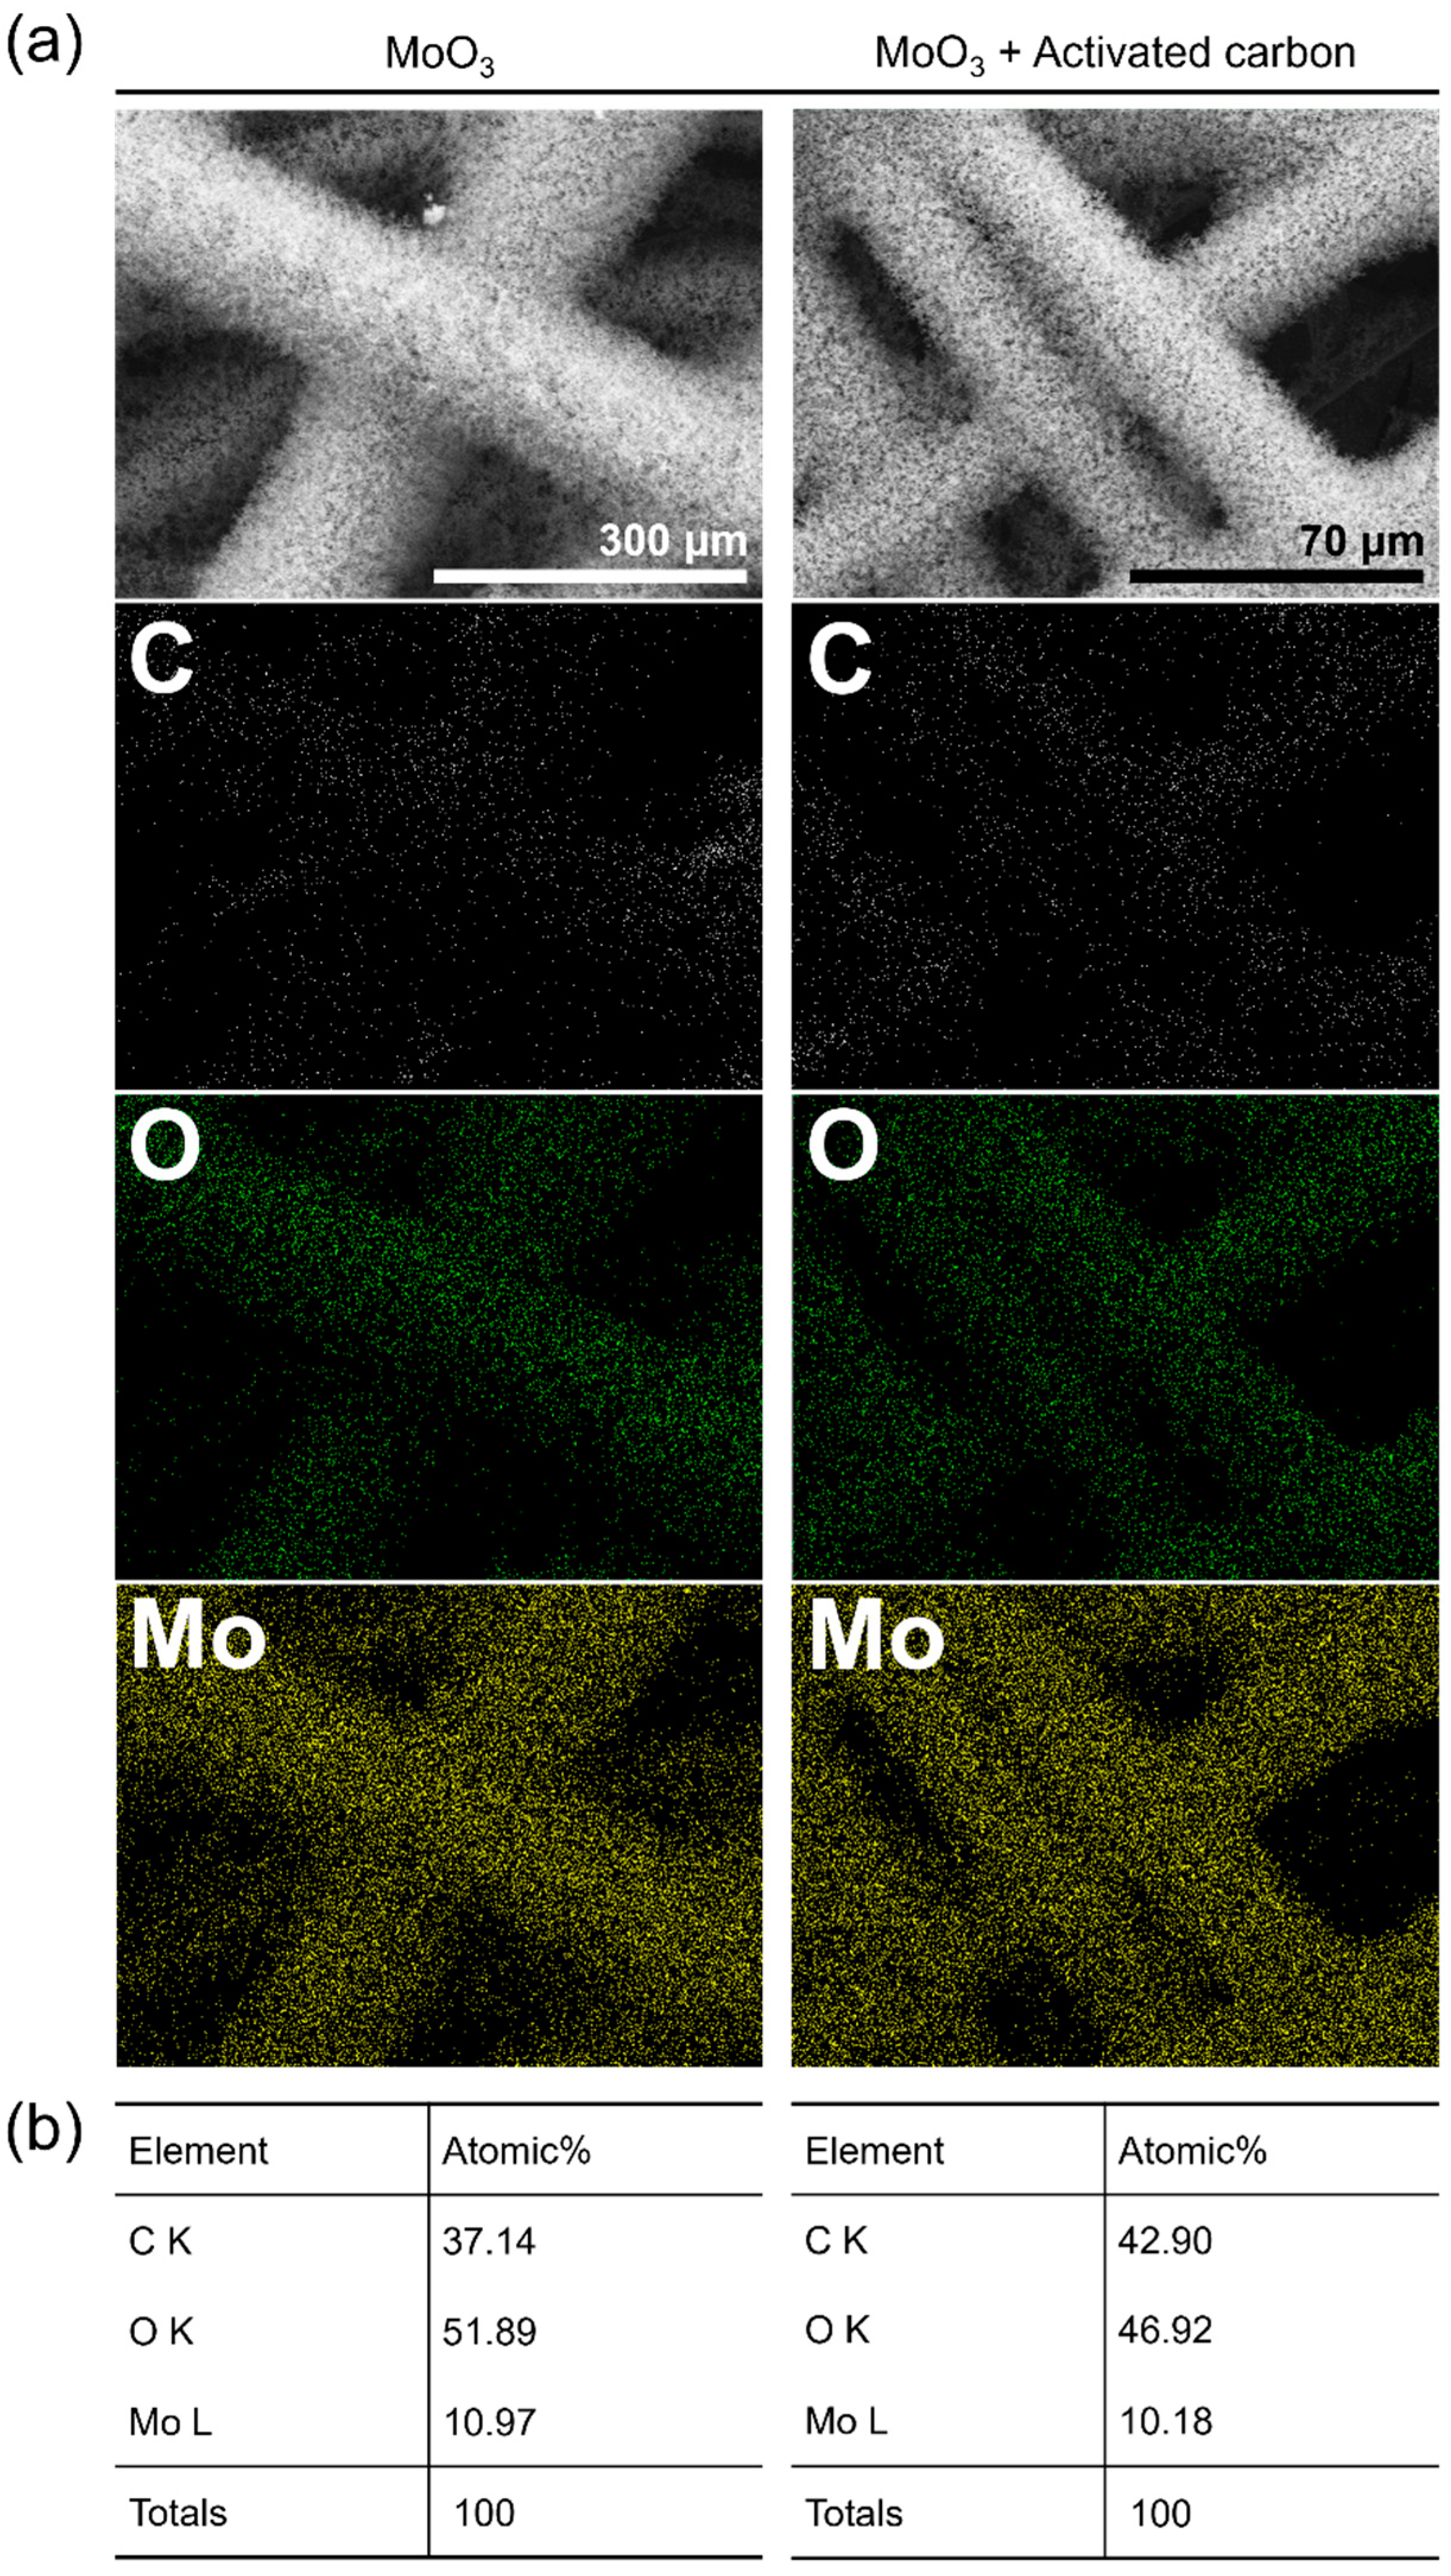
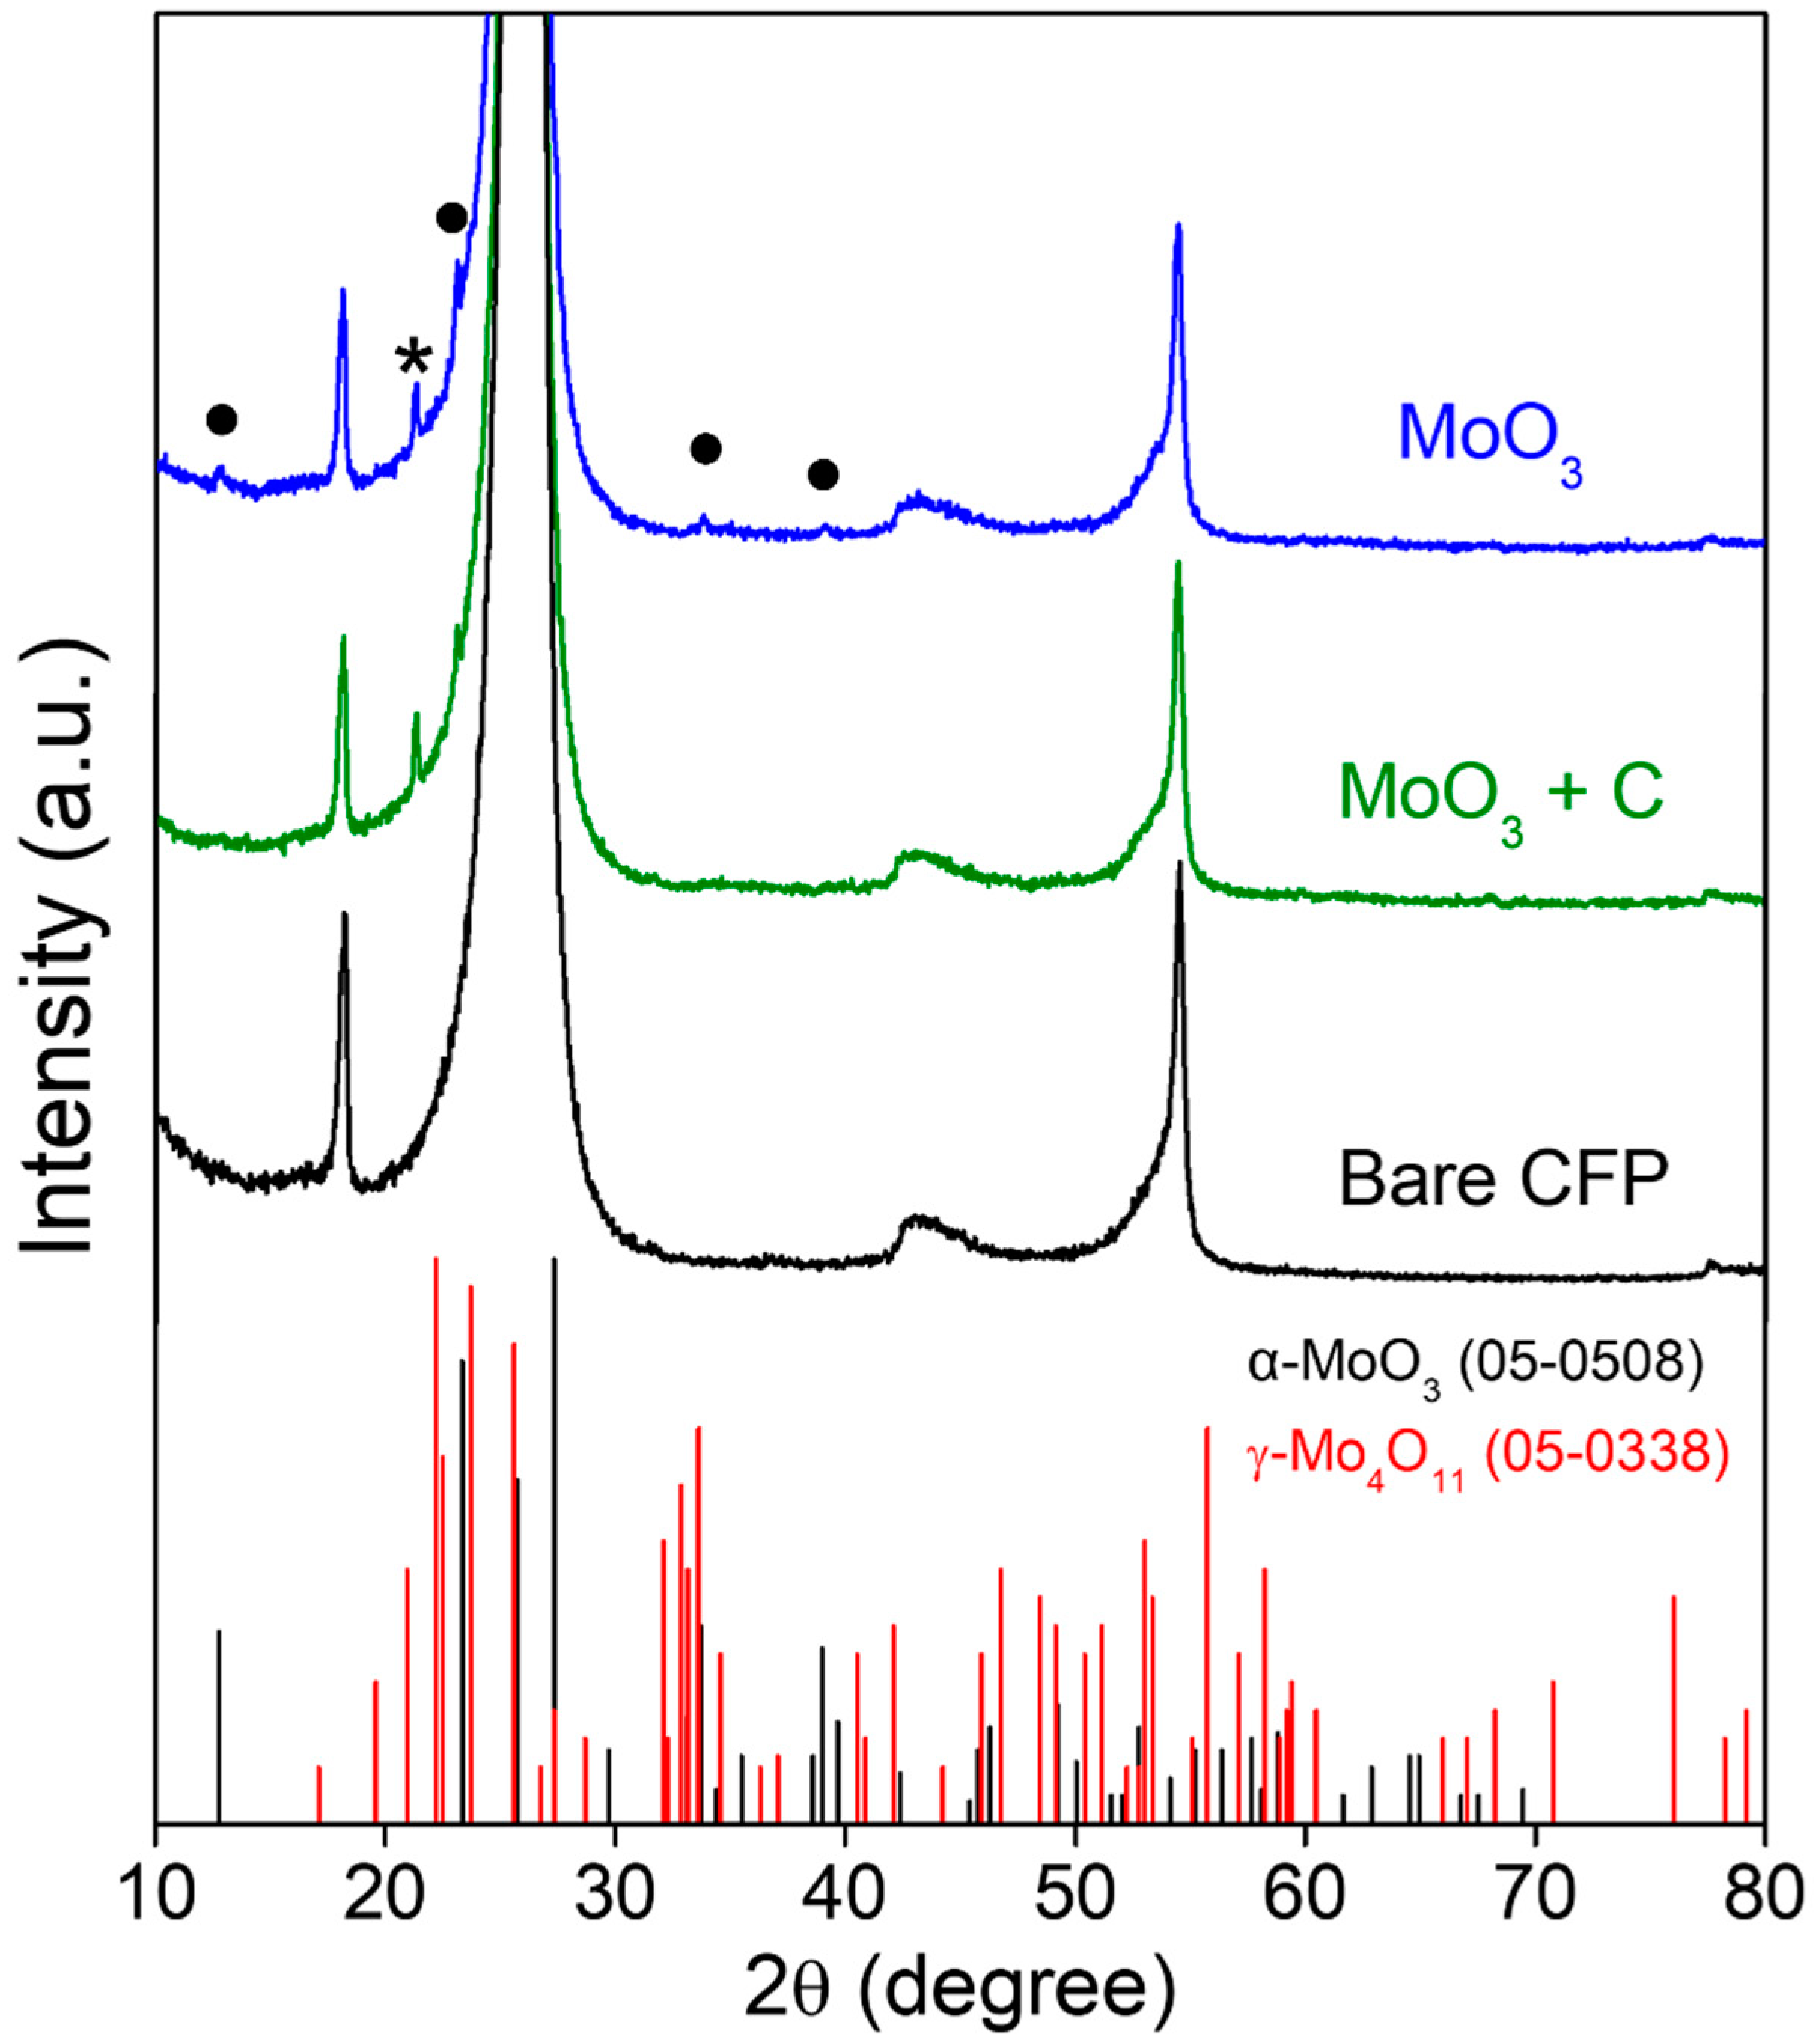
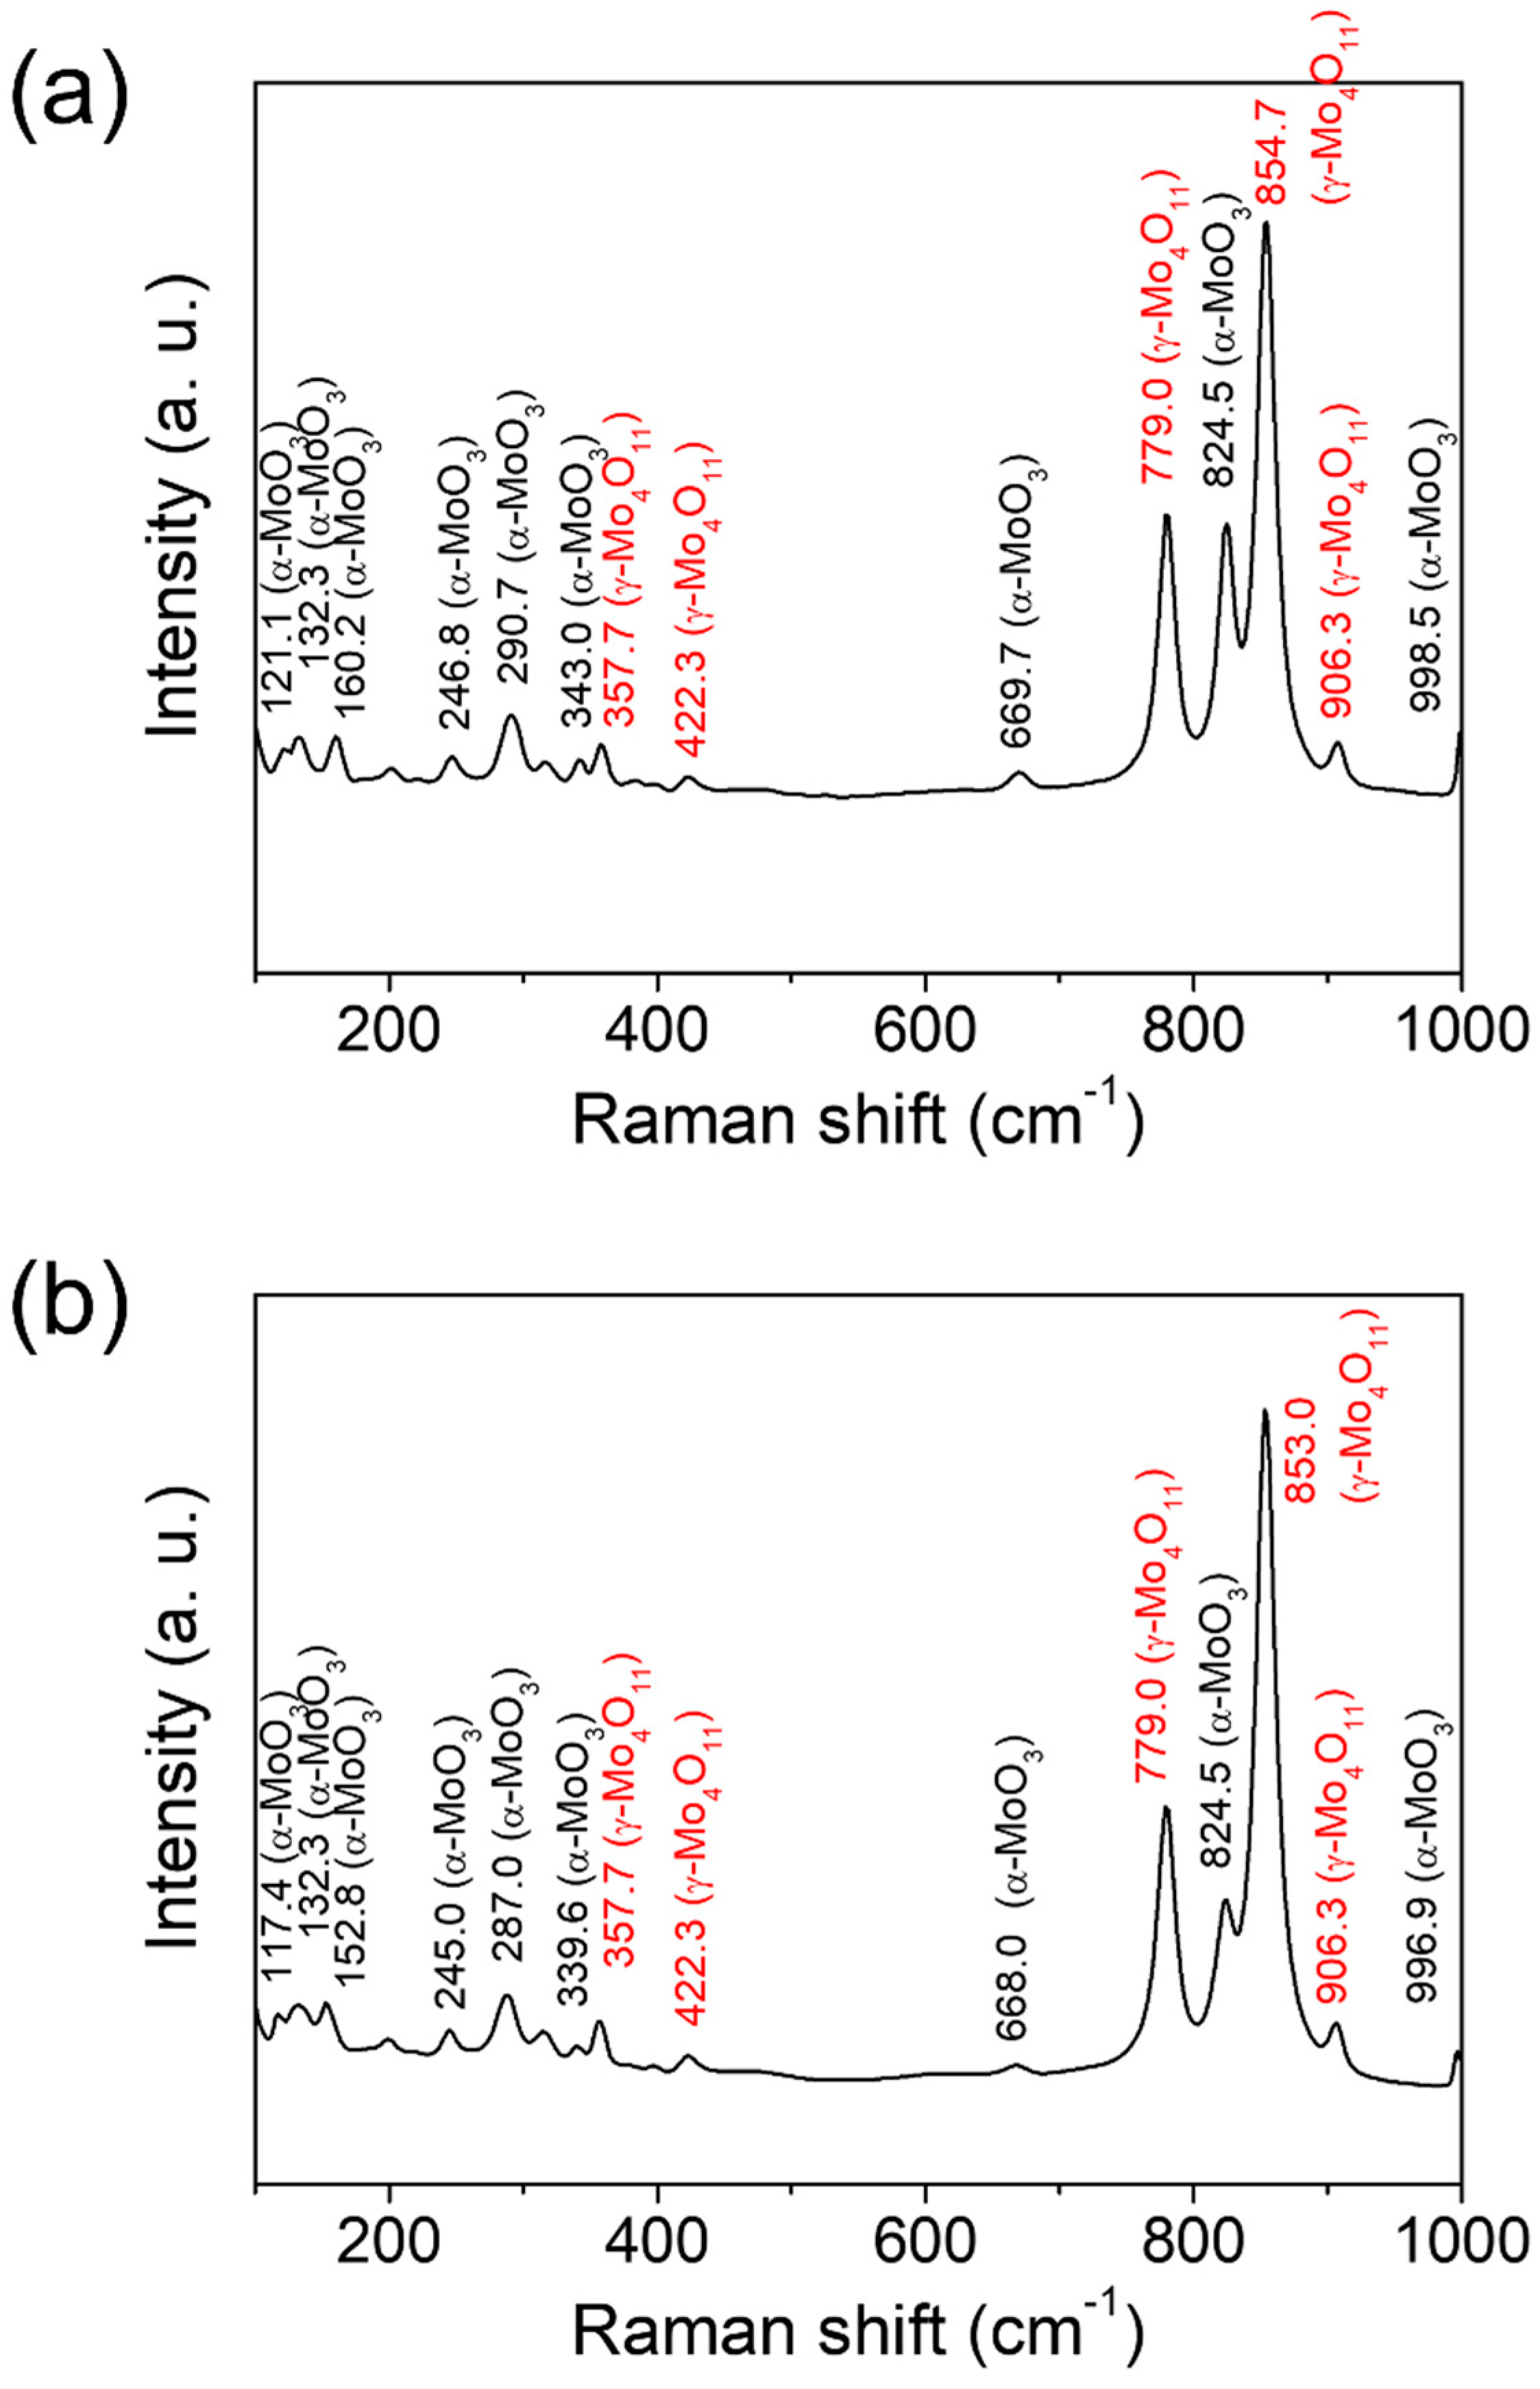
2.2. Structural Characterization

The morphology of the samples was examined by field-emission scanning electron microscopy (FE-SEM, Tokyo, Japan) using a Hitachi S-4800 instrument. The elemental composition of the samples was examined by energy-dispersive X-ray spectroscopy (EDS) coupled to the FE-SEM system. Phase assignment was carried out with the help of X-ray diffraction (XRD) using a Rigaku D/Max-2500 equipped with a Cu Kα source (λ = 1.5406 Å), as well as confocal Raman microprobe analysis using a Horiba XploRA instrument (Kyoto, Japan). Raman spectra were collected with excitation from the 532 nm line of an air-cooled solid laser. The chemical composition and oxidation state of the samples were investigated by X-ray photoelectron spectroscopy (XPS, K-Alpha, Thermo Scientific, Waltham, MA, USA) with micro-focused monochromatized Al Kα radiation (1486.6 eV). The energy calibration was achieved by setting the hydrocarbon C 1s line at 284.80 eV. The surface states of the samples were analyzed by Fourier-transform infrared spectroscopy (FTIR, Bruker ALPHA 2, Billerica, MA, USA). The morphology and crystal structure of the samples were further observed by high-resolution transmission electron microscopy (TEM, Titan G2 ChemiSTEM Cs Probe, FEI Company, Hillsboro, OR, USA) operated at an accelerating voltage of 200 kV.

3. Results and Discussion

The CVT processes were performed to prepare the molybdenum oxide nanoparticle aggregates on CFP, as illustrated in Figure 1a. The molybdenum oxide nanoparticle aggregates were deposited onto CFP adhered to the top of the quartz tube inside by the vapor transport of precursor heated to 850 °C. The deposition was attempted using two different powder precursors, MoO3 and a 1:1 (mol/mol) mixture of MoO3 and activated carbon, referred to as ‘M’ and ‘MC’, respectively. The use of the mixed precursor of MoO3 and activated carbon was expected to induce the reduction effect (defect or non-stoichiometry) by carbon species for the deposition of molybdenum oxide. Since the melting and boiling points of α-MoO3 are known to be 795 and 1155 °C, respectively, the processing temperature for the vapor transport of precursors was set to 850 °C. The FE-SEM images in Figure 2 show the homogeneous coverage and vertical growth orientation of molybdenum oxide NPs on the individual carbon fibers of CFP, similarly with respect to the products obtained using two different precursors. The morphology of bare CFP, shown in Figure 1b, is contrasted. All the prepared nanoparticle aggregates revealed a fluffy and hierarchical structure composed of fine primary NPs, which were vertically aligned from the supporting carbon fibers of CFP. The primary NPs composing aggregates came in different sizes depending on the type of precursor: 100 nm for ‘M’ and 250 nm for ‘MC’ in diameter. Interestingly, when ‘MC’ was used as a precursor, only carbon powder was found to remain in an alumina boat with no transport after processing.
Figure 3a exhibits EDS elemental maps of C, O, and Mo acquired for the samples. It once again verifies the homogeneous coverage of molybdenum oxide NPs on the individual carbon fibers of CFP for both samples. The measured atomic ratios are presented in Figure 3b. The molybdenum oxide nanoparticle aggregates prepared on CFP using ‘M’ exhibited a slightly higher O/Mo ratio compared with those prepared using ‘MC’.
The XRD analysis was performed for all samples, and the acquired diffraction patterns are shown in Figure 4. The peaks corresponding to α-MoO3 and γ-Mo4O11 are revealed for the molybdenum oxide nanoparticle aggregates formed on CFP using ‘M’ according to the Joint Committee on Powder Diffraction Standards (JCPDS) no. 05-0508 and 05-0338, respectively. For the sample prepared using ‘MC’, the peaks arising from α-MoO3 weakened, while the main peak arising from γ-Mo4O11 was slightly strengthened compared with the sample prepared using ‘M’. However, the peaks arising from molybdenum oxide were hard to observe because of the strong peaks arising from CFP substrate. Hence, we used Raman spectroscopy to investigate the crystal phase of molybdenum oxide nanoparticle aggregates more clearly.
Figure 5 shows the Raman spectra of the molybdenum oxide nanoparticle aggregates prepared using two different types of precursors. Noticeably, the spectra arising from orthorhombic α-MoO3 and γ-Mo4O11 were acquired for both samples, which correspond to the reported Raman bands [9,29,30,31]. The main bands of Raman spectra arising from the two phases of molybdenum oxide were observed at 669.7 cm−1 (B2g, B3g), 824.5 cm−1 (Ag, B1g), and 998.5 cm−1 (Ag, B1g) for α-MoO3 and at 779.0, 854.7, and 906.3 cm−1 for γ-Mo4O11. The relative amounts of α-MoO3 and γ-Mo4O11 within the NPs can be identified by comparing the relative peak intensities (I(α-MoO3)/I(γ-Mo4O11)) for both samples. The I(α-MoO3)/I(γ-Mo4O11) ratio was obtained by Gaussian fitting of the intensity (integrated area) ratio between the two primary peaks of 824.5 cm−1 (Ag, B1g) for α-MoO3 and 854.7 cm−1 for γ-Mo4O11. As a result, it can be found that the amount of γ-Mo4O11 was relatively more than that of α-MoO3 with an I(α-MoO3)/I(γ-Mo4O11) ratio of 0.45 for the molybdenum oxide NPs prepared using ‘M’ (Figure 5a). For the sample prepared using ‘MC’, the amount of α-MoO3 decreased further compared to that of γ-Mo4O11, with an I(α-MoO3)/I(γ-Mo4O11) ratio of 0.28 (Figure 5b). These results correspond to the aforementioned changing trend in atomic ratio measured by EDS elemental analysis (the O/Mo ratio of α-MoO3 is slightly higher than that of γ-Mo4O11) and phase variation identified by XRD analysis between both samples. The lowest amount of α-MoO3 phase, with the higher O/Mo ratio compared with that of γ-Mo4O11, for the sample prepared using ‘MC’ is believed to have been due to the reduction effect by the activated carbon of precursor. While the orthorhombic α-MoO3 is the major stable phase of molybdenum oxide, the crystal structure of the metastable Magnéli phase Mo4O11 can be found either as a low-temperature monoclinic η-phase or high-temperature orthorhombic γ-phase (also called α-phase) [12,15,17,18]. In our case, the quenching effect from the high temperature of 850 °C to room temperature for deposition onto the substrate located outside of the tube furnace was considered to lead to the formation of high-temperature γ-Mo4O11 phase along with the stable α-MoO3 phase within the NPs.
The surface chemical states of the molybdenum oxide nanoparticle aggregates prepared using two different types of precursors were investigated by XPS. As shown in Figure 6a,c, similar Mo 3d spectra for both samples were acquired, revealing the Mo 3d3/2 peak at 235.40–235.50 eV, Mo 3d5/2 peak at 232.25–232.30 eV, and Mo 3d3/2–Mo 3d5/2 separation of 3.15–3.20 eV. Those spectral characteristics indicate that the molybdenum oxide NPs consisted mainly of Mo6+ [15,18,32,33]. In other words, they reflected Mo6+ of the γ-Mo4O11 phase and α-MoO3 phase, although the γ-Mo4O11 phase contained a small dose of the Mo5+ component, along with a large amount of Mo6+ component [15,18]. The O 1s spectra provide more interesting findings. The peaks were observed at 531.60 and 530.20 eV for the O 1s spectra of both samples, originating from the lattice oxygens of α-MoO3 and γ-Mo4O11, respectively (Figure 6b,d) [9,24]. Noticeably, the relative intensity of the peak at 531.60 eV to the peak at 530.20 eV decreased according to the type of precursor: ‘M’ (Figure 6b) → ‘MC’ (Figure 6d). This indicates that the relative amount of α-MoO3 to γ-Mo4O11 within the NPs decreased according to the change in precursor type. This corresponds well to the preceding results characterized using various tools including Raman spectroscopy.
The surface states of the molybdenum oxide nanoparticle aggregates prepared using two different types of precursors were further examined by FTIR. Figure 7 shows the FTIR transmittance spectra acquired for the two samples. The peaks corresponding to C–H stretching (2671.5 cm−1), C–O stretching (1205.0 cm−1 and 1147.3 cm−1), and C–H bending (636.5 cm−1) were obtained for both samples. In particular, it is worth noting that the small peaks corresponding to C–H bending at 891.9 cm−1 and 770.4 cm−1 were observed only for the sample prepared using ‘MC’. This indicates that the molybdenum oxide nanoparticle aggregates prepared using ‘MC’ contained more carbon species on their surface compared with those prepared using ‘M’.
Figure 8 and Figure 9 show low-magnification and high-resolution TEM images, selected-area electron diffraction (SAED) patterns, high-angle annular dark-field (HAADF) scanning transmission electron microscopy (STEM) images, and energy-dispersive spectroscopy (EDS) mapping images of Mo, O, and C, acquired for both samples,. The NPs were harvested from the CFP substrates by ultrasonication in toluene for characterization. In Figure 8a and Figure 9a, the spherical NPs observed for both samples exhibit size differences depending on the type of precursor, which coincides with the FE-SEM results in Figure 2 (100 nm for ‘M’ and 250 nm for ‘MC’ in diameter). The TEM lattice fringe image of the molybdenum oxide nanoparticle prepared by the CVT method using ‘M’ in Figure 8b reveals dominant (021) planes of the α-MoO3 phase, whereas those of the γ-Mo4O11 phase are hard to observe. The corresponding SAED pattern shows a highly ordered orthorhombic crystal lattice structure of the nanoparticle (Figure 8c). Meanwhile, the TEM lattice fringe image of the molybdenum oxide nanoparticle prepared by the CVT method using ‘MC’ in Figure 9b represents (211) planes of the γ-Mo4O11 phase, as well as (021) planes of the α-MoO3 phase, probably owing to relatively higher content of the γ-Mo4O11 phase within the nanoparticle as verified earlier. Its SAED pattern also exhibits a highly ordered orthorhombic structure in Figure 9c. The HAADF STEM and EDS mapping images of both NPs reveal the homogeneous distribution of Mo and O elements throughout the NPs (Figure 8d–g and Figure 9d–g).
This work addressed the advanced preparation method of molybdenum oxide nanoparticle aggregates, modulating their structure and phase. These results can serve as the groundwork for the development of high-performance nanomaterials in various electronic and catalytic applications such as gas sensors, supercapacitors, photocatalysts, environmental catalysts, and electrocatalysts [19,20,21,22,23,24,25,26,27].

4. Conclusions

The thin and small-sized molybdenum oxide nanoparticle aggregates were uniformly deposited on CFP substrates by the CVT method, combined with a quenching effect achieved by placing the position of the substrate outside the tube furnace. The obtained molyndenum oxide nanoparticle arrays revealed the hierarchical structure of fine NPs, which were vertically grown with a homogeneous coverage on the individual carbon fibers of CFP substrates. Furthermore, their phase held a metastable high-temperature γ-Mo4O11 phase along with a stable α-MoO3 phase. The influence of precursor type on the formation of molybdenum oxide nanoparticle aggregates by the advanced CVT technique was investigated using two different types of precursors: MoO3 (‘M’) and a 1:1(mol/mol) mixture of MoO3 and activated carbon (‘MC’). The results characterized using XRD, Raman spectroscopy, XPS, and FTIR showed that the relative amount of α-MoO3 to γ-Mo4O11 within the NPs decreased according to the type of precursor as follows: ‘M’ → ‘MC’.

Funding

This work was supported by research grants from Daegu Catholic University in 2021 (No. 20211039).

Institutional Review Board Statement

Not applicable.

Informed Consent Statement

Not applicable.

Data Availability Statement

Not applicable.

Conflicts of Interest

The author declares no conflict of interest.

References

  1. Novoselov, K.S.; Geim, A.K.; Morozov, S.V.; Jiang, D.; Zhang, Y.; Dubonos, S.V.; Grigorieva, I.V.; Firsov, A.A. Electric field effect in atomically thin carbon films. Science 2004, 306, 666–669. [Google Scholar] [CrossRef] [PubMed] [Green Version]
  2. Novoselov, K.S.; Mishchenko, A.; Carvalho, A.; Neto, A.H.C. 2D materials and van der Waals heterostructures. Science 2016, 353, aac9439. [Google Scholar] [CrossRef] [PubMed] [Green Version]
  3. Mas-Ballesté, R.; Gómez-Navarro, C.; Gómez-Herrero, J.; Zamora, F. 2D materials: To graphene and beyond. Nanoscale 2011, 3, 20–30. [Google Scholar] [CrossRef] [PubMed]
  4. Gupta, A.; Sakthivel, T.; Seal, S. Recent development in 2D materials beyond graphene. Prog. Mater. Sci. 2015, 73, 44–126. [Google Scholar] [CrossRef]
  5. Miró, P.; Audiffred, M.; Heine, T. An atlas of two-dimensional materials. Chem. Soc. Rev. 2014, 43, 6537–6554. [Google Scholar] [CrossRef] [PubMed]
  6. Schaibley, J.R.; Yu, H.; Clark, G.; Rivera, P.; Ross, J.S.; Seyler, K.L.; Yao, W.; Xu, X. Valleytronics in 2D materials. Nat. Rev. Mater. 2016, 1, 16055. [Google Scholar] [CrossRef]
  7. Jin, H.; Guo, C.; Liu, X.; Liu, J.; Vasileff, A.; Jiao, Y.; Zheng, Y.; Qiao, S.-Z. Emerging two-dimensional nanomaterials for electrocatalysis. Chem. Rev. 2018, 118, 6337–6408. [Google Scholar] [CrossRef] [PubMed]
  8. Yang, S.; Jiang, C.; Wei, S.-H. Gas sensing in 2D materials. Appl. Phys. Rev. 2017, 4, 021304. [Google Scholar] [CrossRef]
  9. Choi, Y.-H.; Lee, J.; Parija, A.; Cho, J.; Verkhoturov, S.V.; Al-Hashimi, M.; Fang, L.; Banerjee, S. An in Situ Sulfidation Approach for the Integration of MoS2 Nanosheets on Carbon Fiber Paper and the Modulation of Its Electrocatalytic Activity by Interfacing with nC60. ACS Catal. 2016, 6, 6246–6254. [Google Scholar] [CrossRef]
  10. Wang, X.; Feng, H.; Wu, Y.; Jiao, L. Controlled Synthesis of Highly Crystalline MoS2 Flakes by Chemical Vapor Deposition. J. Am. Chem. Soc. 2013, 135, 5304–5307. [Google Scholar] [CrossRef]
  11. Wang, S.; Rong, Y.; Fan, Y.; Pacios, M.; Bhaskaran, H.; He, K.; Warner, J.H. Shape Evolution of Monolayer MoS2 Crystals Grown by Chemical Vapor Deposition. Chem. Mater. 2014, 26, 6371–6379. [Google Scholar] [CrossRef]
  12. de Castro, I.A.; Datta, R.S.; Ou, J.Z.; Castellanos-Gomez, A.; Sriram, S.; Daeneke, T.; Kalantar-Zadeh, K. Molybdenum Oxides—From Fundamentals to Functionality. Adv. Mater. 2017, 29, 1701619. [Google Scholar] [CrossRef] [PubMed]
  13. Balendhran, S.; Deng, J.; Ou, J.Z.; Walia, S.; Scott, J.; Tang, J.; Wang, K.L.; Field, M.R.; Russo, S.; Zhuiykov, S.; et al. Enhanced charge carrier mobility in two-dimensional high dielectric molybdenum oxide. Adv. Mater. 2013, 25, 109–114. [Google Scholar] [CrossRef] [PubMed]
  14. Mai, L.; Yang, F.; Zhao, Y.; Xu, X.; Xu, L.; Hu, B.; Luo, Y.; Liu, H. Molybdenum oxide nanowires: Synthesis & properties. Mater. Today 2011, 14, 346–353. [Google Scholar]
  15. Van Pham, D.; Patil, R.; Yang, C.-C.; Yeh, W.-C.; Liou, Y.; Ma, Y.-R. Impact of the crystal phase and 3d-valence conversion on the capacitive performance of one-dimensional MoO2, MoO3, and Magnéli-phase Mo4O11 nanorod-based pseudocapacitors. Nano Energy 2018, 47, 105–114. [Google Scholar] [CrossRef]
  16. Zhou, L.; Yang, L.; Yuan, P.; Zou, J.; Wu, Y.; Yu, C. α-MoO3 nanobelts: A high performance cathode material for lithium ion batteries. J. Phys. Chem. C 2010, 114, 21868–21872. [Google Scholar] [CrossRef]
  17. Lalik, E.; David, W.I.F.; Barnes, P.; Turner, J.F.C. Mechanisms of reduction of MoO3 to MoO2 reconciled? J. Phys. Chem. B 2001, 105, 9153–9156. [Google Scholar] [CrossRef]
  18. Van Pham, D.; Patil, R.A.; Lin, J.-H.; Lai, C.-C.; Liou, Y.; Ma, Y.-R. Doping-free bandgap tuning in one-dimensional Magnéli-phase nanorods of Mo4O11. Nanoscale 2016, 8, 5559–5566. [Google Scholar] [CrossRef] [PubMed]
  19. Hussain, M.K.; Khalid, N. Surfactant-assisted synthesis of MoO3 nanorods and its application in photocatalytic degradation of different dyes in aqueous environment. J. Mol. Liq. 2021, 346, 117871. [Google Scholar] [CrossRef]
  20. Niu, Y.; Su, H.; Li, X.; Li, J.; Qi, Y. Synthesis of porous α-MoO3 microspheres as electrode materials for supercapacitors. J. Alloys Compd. 2022, 898, 162863. [Google Scholar] [CrossRef]
  21. Nagyné-Kovács, T.; Studnicka, L.; Lukács, I.E.; László, K.; Pasierb, P.; Szilágyi, I.M.; Pokol, G. Hydrothermal Synthesis and Gas Sensing of Monoclinic MoO3 Nanosheets. Nanomaterials 2020, 10, 891. [Google Scholar] [CrossRef] [PubMed]
  22. Shaheen, I.; Ahmad, K.S. Modified sol gel synthesis of MoO3 NPs using organic template: Synthesis, characterization and electrochemical investigations. J. Sol-Gel Sci. Technol. 2021, 97, 178–190. [Google Scholar] [CrossRef]
  23. Patil, D.; Patil, V.; Patil, S.; Dongale, T.; Desai, N.; Patil, P.; Mane, R.; Bhosale, P.; Kadam, P.; Khot, K.V. Facile synthesis of MoO3 nanoplates based NO2 gas sensor: Ultra-selective and sensitive. Chem. Phys. Lett. 2021, 782, 139025. [Google Scholar] [CrossRef]
  24. Yang, G.; Feng, F.; Luo, Y.; Qin, J.; Yuan, F.; Wang, S.; Luo, S.; Ma, J. Facile synthesis of MoO3 nanodots self-assembled into hollow mesoporous silica: Enhancing efficient oxidative desulfurization and investigating reaction mechanism. J. Environ. Chem. Eng. 2021, 9, 106309. [Google Scholar] [CrossRef]
  25. Arya, N.; Avasthi, P.; Halder, A.; Balakrishnan, V. Nickel decorated MoO3 single crystal microflakes with multi-site functionality for enhanced hydrogen evolution reaction. Int. J. Hydrog. Energy 2021, 46, 1945–1954. [Google Scholar] [CrossRef]
  26. Guo, Y.; Kang, L.; Song, P.; Zeng, Q.; Tang, B.; Yang, J.; Wu, Y.; Tian, D.; Xu, M.; Zhao, W.; et al. MoO3–MoS2 vertical heterostructures synthesized via one-step CVD process for optoelectronics. 2D Mater. 2021, 8, 035036. [Google Scholar] [CrossRef]
  27. Chot, C.Y.; Chong, M.N.; Soh, A.K.; Tan, K.W.; Ocon, J.D.; Saint, C. Facile synthesis and characterisation of functional MoO3 photoanode with self-photorechargeability. J. Alloys Compd. 2020, 838, 155624. [Google Scholar] [CrossRef]
  28. Choi, M.; Kang, S.K.; Kim, S.; Kim, S.J.; An, G.H.; Shin, S.J.; Kim, D.; Rahman, I.N.; Bang, J.; Kim, K.; et al. Mo nitrides and carbonitrides via metallic phase transition of MoO3 films using ammonium salt precursors in chemical vapor deposition. Curr. Appl. Phys. 2021, 34, 1–6. [Google Scholar] [CrossRef]
  29. Cuando-Espitia, N.; Redenius, J.; Mensink, K.; Camacho-López, M.; Camacho-López, S.; Aguilar, G. Influence of oxygen pressure on the fs laser-induced oxidation of molybdenum thin films. Opt. Mater. Express 2018, 8, 581–596. [Google Scholar] [CrossRef]
  30. Windom, B.C.; Sawyer, W.G.; Hahn, D. A Raman Spectroscopic Study of MoS2 and MoO3: Applications to Tribological Systems. Tribol. Lett. 2011, 42, 301–310. [Google Scholar] [CrossRef]
  31. Mihalev, M.; Hardalov, C.; Christov, C.; Michailov, M.; Ranguelov, B.; Leiste, H. Structural and adhesional properties of thin MoO3 films prepared by laser coating. J. Physics Conf. Ser. 2014, 514, 0120222. [Google Scholar] [CrossRef] [Green Version]
  32. Morales-Luna, M.; Tomás, S.A.; Arvizu, M.; Pérez-González, M.; Campos-Gonzalez, E. The evolution of the Mo5+ oxidation state in the thermochromic effect of MoO3 thin films deposited by rf magnetron sputtering. J. Alloys Compd. 2017, 722, 938–945. [Google Scholar] [CrossRef]
  33. National Institute of Standards and Technology (NIST). NIST X-ray Photoelectron Spectroscopy Database. Available online: http://srdata.nist.gov/xps (accessed on 1 February 2022).
Figure 1. (a) Illustration of the chemical vapor transport (CVT) process combined with the quenching effect achieved by placing the position of the substrate outside the tube furnace, used to grow molybdenum oxide nanoparticle aggregates on carbon fiber paper (CFP) substrates using two different types of precursors. (b) FE-SEM images of bare CFP.
Materials 15 02182 g001
Figure 2. FE-SEM images of the molybdenum oxide nanoparticle aggregates prepared on CFP substrates by the CVT method using two different types of precursors: (a,c) MoO3 and (b,d) 1:1 (mol/mol) mixture of MoO3 and activated carbon. (c,d) High-magnification FE-SEM images.
Materials 15 02182 g002
Figure 3. (a) EDS elemental maps and (b) atomic ratios of C, O, and Mo acquired for the molybdenum oxide nanoparticle aggregates prepared on CFP substrates by the CVT method using two different types of precursors: MoO3 and 1:1 (mol/mol) mixture of MoO3 and activated carbon.
Materials 15 02182 g003
Figure 4. XRD patterns of the molybdenum oxide nanoparticle aggregates prepared on CFP substrates by the CVT method using two different types of precursors: MoO3 and 1:1 (mol/mol) mixture of MoO3 and activated carbon and that of bare CFP (“•” and “*”represent the peaks arising from α-MoO3 and γ-Mo4O11 phases, respectively). The bottom bars are JCPDS standards for orthorhombic α-MoO3 (no. 05-0508) and γ-Mo4O11 (no. 05-0338).
Materials 15 02182 g004
Figure 5. Raman spectra of the molybdenum oxide nanoparticle aggregates prepared on CFP substrates by the CVT method using two different types of precursors: (a) MoO3 and (b) 1:1 (mol/mol) mixture of MoO3 and activated carbon.
Materials 15 02182 g005
Figure 6. XPS spectra of Mo 3d and O 1s acquired for the molybdenum oxide nanoparticle aggregates prepared on CFP substrates by the CVT method using two different types of precursors: (a,b) MoO3 and (c,d) 1:1 (mol/mol) mixture of MoO3 and activated carbon.
Materials 15 02182 g006
Figure 7. FTIR transmittance spectra of the molybdenum oxide nanoparticle aggregates prepared on CFP substrates by the CVT method using two different types of precursors: MoO3 and 1:1 (mol/mol) mixture of MoO3 and activated carbon.
Materials 15 02182 g007
Figure 8. (a) Low-magnification and (b) high-resolution TEM images, (c) SAED pattern, (d) HAADF STEM image, and EDS mapping images of (e) Mo, (f) O, and (g) C, acquired for the molybdenum oxide nanoparticles (NPs) prepared by the CVT method using MoO3 precursor. The NPs were harvested from the CFP substrates for the characterization.
Materials 15 02182 g008
Figure 9. (a) Low-magnification and (b) high-resolution TEM images, (c) SAED pattern, (d) HAADF STEM image, and EDS mapping images of (e) Mo, (f) O, and (g) C, acquired for the molybdenum oxide NPs prepared by the CVT method using 1:1 (mol/mol) mixed precursor of MoO3 and activated carbon. The NPs were harvested from the CFP substrates for the characterization.
Materials 15 02182 g009
Publisher’s Note: MDPI stays neutral with regard to jurisdictional claims in published maps and institutional affiliations.

