Article

Structure and Photoluminescence Properties of Dy3+ Doped Phosphor with Whitlockite Structure

1
School of Gemmology, China University of Geosciences, Beijing 100083, China
2
Beijing Key Laboratory of Materials Utilization of Nonmetallic Minerals and Solid Wastes, National Laboratory of Mineral Materials, School of Materials Sciences and Technology, China University of Geosciences, Beijing 100083, China
3
School of Chemical Engineering and Energy Technology, Dongguan University of Technology, Dongguan 523808, China
4
Science and Technology Innovation Institute, Faculty of Science, Dongguan University of Technology, Dongguan 523808, China
*
Authors to whom correspondence should be addressed.
Materials 2022, 15(6), 2177; https://doi.org/10.3390/ma15062177
Submission received: 6 February 2022 / Revised: 4 March 2022 / Accepted: 11 March 2022 / Published: 15 March 2022

Abstract

:
Whitlockite has the advantages of a low sintering temperature, high stability, and a low fabrication cost, and it is widely used as the host for luminescent material. In this study, Ca1.8Li0.6La0.6−x(PO4)2:xDy3+ phosphor was prepared by the high-temperature solid-state method, and its structure, composition, and luminescence properties were systematically studied. The results showed that a new whitlockite type matrix was prepared by replacing Ca2+ in whitlockite with monovalent and trivalent cations. The prepared phosphors belonged to a hexagonal crystal system with a particle size in the range of 5–20 μm. Under the excitation of 350 nm UV light, the samples emitted white light, and there were mainly two stronger emission peaks at 481 nm in the blue band and 573 nm in the yellow band, which correspond to the electron transitions at 4F9/26H15/2 and 4F9/26H13/2 of Dy3+, respectively. The optimal doping concentration of Dy3+ in Ca1.8Li0.6La0.6(PO4)2 matrix was 0.03 (mol%). The main mechanism of concentration quenching in the sample was dipole–dipole energy transfer. When the temperature was 130 °C, the luminescence intensity of the samples was 78.7% of that at 30 °C, and their thermal quenching activation energy was 0.25 eV. The CIE coordinates of the sample at 30 °C were (0.2750, 0.3006), and their luminescent colors do not change with temperature. All the results indicate that Ca1.8Li0.6La0.6−x(PO4)2:xDy3+ phosphor is a luminescent material with good luminescence performance and thermal stability, which shows a promising application in the field of LED display.

1. Introduction

Rare earth materials are essential materials for many highly sophisticated industries today, and they have their own unique advantages in many aspects. There has been extensive research on rare earths in permanent magnetic materials [1], luminescent materials [2,3], catalytic materials [4,5,6], and hydrogen storage materials [7]. With the development of science and technology, rare-earth luminescent materials often appear in the research of luminescent materials for third-generation lamps. Rare-earth luminescent materials have a high luminescence efficiency, a strong emission ability in the visible region, resistance to ultraviolet radiation, good thermal stability, and can adapt to the requirements of high-load fluorescent lamps. Therefore, rare-earth luminescent materials are widely used in fluorescent lamps, white diode fluorescents, display imaging, X-ray enhancement screens, and other fields.
Host and activator make up the majority of rare-earth luminous materials. As a host, the most basic needs are stability and ease of preparation. Whitlockite (β-Ca3(PO4)2) has the advantages of a low sintering temperature, a low manufacturing cost, and strong physical and chemical stability [8,9]. On the other hand, there are five non-equivalent cation lattice sites that exist for rare-earth ions in the whitlockite structure. Therefore, whitlockite is an outstanding host. Isomorphism can open up new possibilities for luminous materials and is crucial for the discovery of new luminescent materials. Lithium is an alkaline earth metal with a solubilization function that can boost the luminescence of rare-earth ions significantly. La3+ is commonly employed in the fabrication of luminous matrix materials doped with rare-earth ions because it has a stable structure with nearly negligible light absorption and emission. As a result, Li+ and La3+ have frequently been utilized to micro-modify the structure of the luminous matrix, such as Li7La3Zr2O12:xTb [10], Li7La3−xZr2O12:xEu3+ [11], Li5La3Nb2O12 [12], and La2LiMO6:Eu3+ [13]. Scholars at home and abroad have been paying close attention to the design and development of luminous materials using whitlockite materials as matrices in recent years [2,14,15]. The introduction of Li+ and La3+ in whitlockite structure may bring some new opportunities to generate novel excellent whitlockite host for luminescent materials. In conclusion, luminous materials with the matrix Ca1.8Li0.6La0.6(PO4)2 were created in this article.
Activators in luminous materials activate the host by forming luminescent centers. To generate prepared luminous materials with good luminescent characteristics, rare-earth ions are frequently doped in the host as activators. Dy3+ is a rare-earth ion that is commonly employed to make luminous materials [16,17,18,19]. 4F9/26H13/2 transitions are found in the yellow zone of Dy3+ ions, while 4F9/26H15/2 transitions are found in the blue region. When the Dy3+ ion is at the center of symmetry, multilevel interactions are the main cause of luminescence, and the luminescent material emits standard white light when the transitions intensity is comparable in both places [20,21].
Currently, most commercial white LEDs are manufactured by using blue diode chips to excite the yellow phosphor Y3Al5O12:Ce3+ [22]. Due to the absence of the red spectral component, white light from this combination exhibits poor color rendering index and high color temperature, and the white light emitted is unstable. Single-component white phosphor has better color stability, it produces less energy loss during energy transfer, and the pure white color is also more favorable for phosphor color improvement. Therefore, the development of new single-component white phosphor has obvious practical application value.
In this study, single-component phosphors, Ca1.8Li0.6La0.6−x(PO4)2:xDy3+, were prepared by the high-temperature solid state method. Their composition, structure, and luminescent properties were systematically investigated using a combination of X-ray diffractometer, scanning electron microscope, transmission electron microscope, and fluorescence spectrometer testing techniques. The findings reveal that the luminous material is a white phosphor with good luminescence performance and thermal stability, indicating that it has significant research potential.

2. Materials and Methods

Ca1.8Li0.6La0.6−x(PO4)2:xDy3+ phosphors (x = 0, 0.01, 0.03, 0.06, 0.09, 0.12, 0.15, 0.18, and 0.21) were synthesized using a high-temperature solid-phase technique in this study. The raw ingredients, Li2CO3 (Macklin, Shanghai, China, 99.9%), La2O3 (Aladdin, Shanghai, China, 99.9%), NH4H2PO4 (Macklin, Shanghai, China, 99.9%), CaCO3 (Aladdin, Shanghai, China, 99.9%), and Dy2O3 (Aladdin, Shanghai, China, 99.999%) were correctly weighed according to the structural stoichiometric ratios. The quality of raw materials is shown in Table 1. The weighed samples were pulverized for around 15 min in an agate mortar before being poured into an alumina crucible after they were entirely ground and combined. The samples were placed in a muffle furnace (Kejing Material Technology Co., Ltd., Hefei, China), ramped up to 650 °C at a rate of 5 °C/min, and placed at 650 °C for 1 h in an air atmosphere. After the samples were cooled to room temperature, they were removed and ground to a powder. Then, it was placed in a tube furnace (GXL-1700X, Kejing Material Technology Co., Ltd., Hefei, China) and heated up to 1250 °C at 10 °C/min and left at 1250 °C for 4 h in an air atmosphere. After the temperature of the tube furnace was reduced to room temperature, the sample was transferred to a mortar for fine grinding to obtain the test sample.
XRD patterns were obtained on a BRUKER D8 ADVANCE powder diffractometer (Bruker, Karlsruhe, Baden-Württemberg, Germany) with Cu Kα radiation (λ = 0.15418 nm), continuous scanning mode, 40 mA and 40 kV, and a 2θ range of 10–70°. EDAX TEAM spectrometers (EDAX, Pleasanton, California, USA) of the Octane Pro, Plus, Super, and Ultra versions were used to measure the phosphors’ SEM spectra. A transmission electron microscope model JEM-2100F (JEOL, Tokyo, Japan) was used to measure the TEM of the samples. A fluorescence spectrometer, FL4600 (HITACHI, Tokyo, Japan), with a 150 V xenon excitation source and a photomultiplier voltage of 400 V, was used to measure the phosphors’ excitation (PLE) and emission (PL) spectra. Variable temperature emission spectra of the samples were obtained using a spectrometer with a digital temperature controller and a 600 V photomultiplier voltage.

3. Results

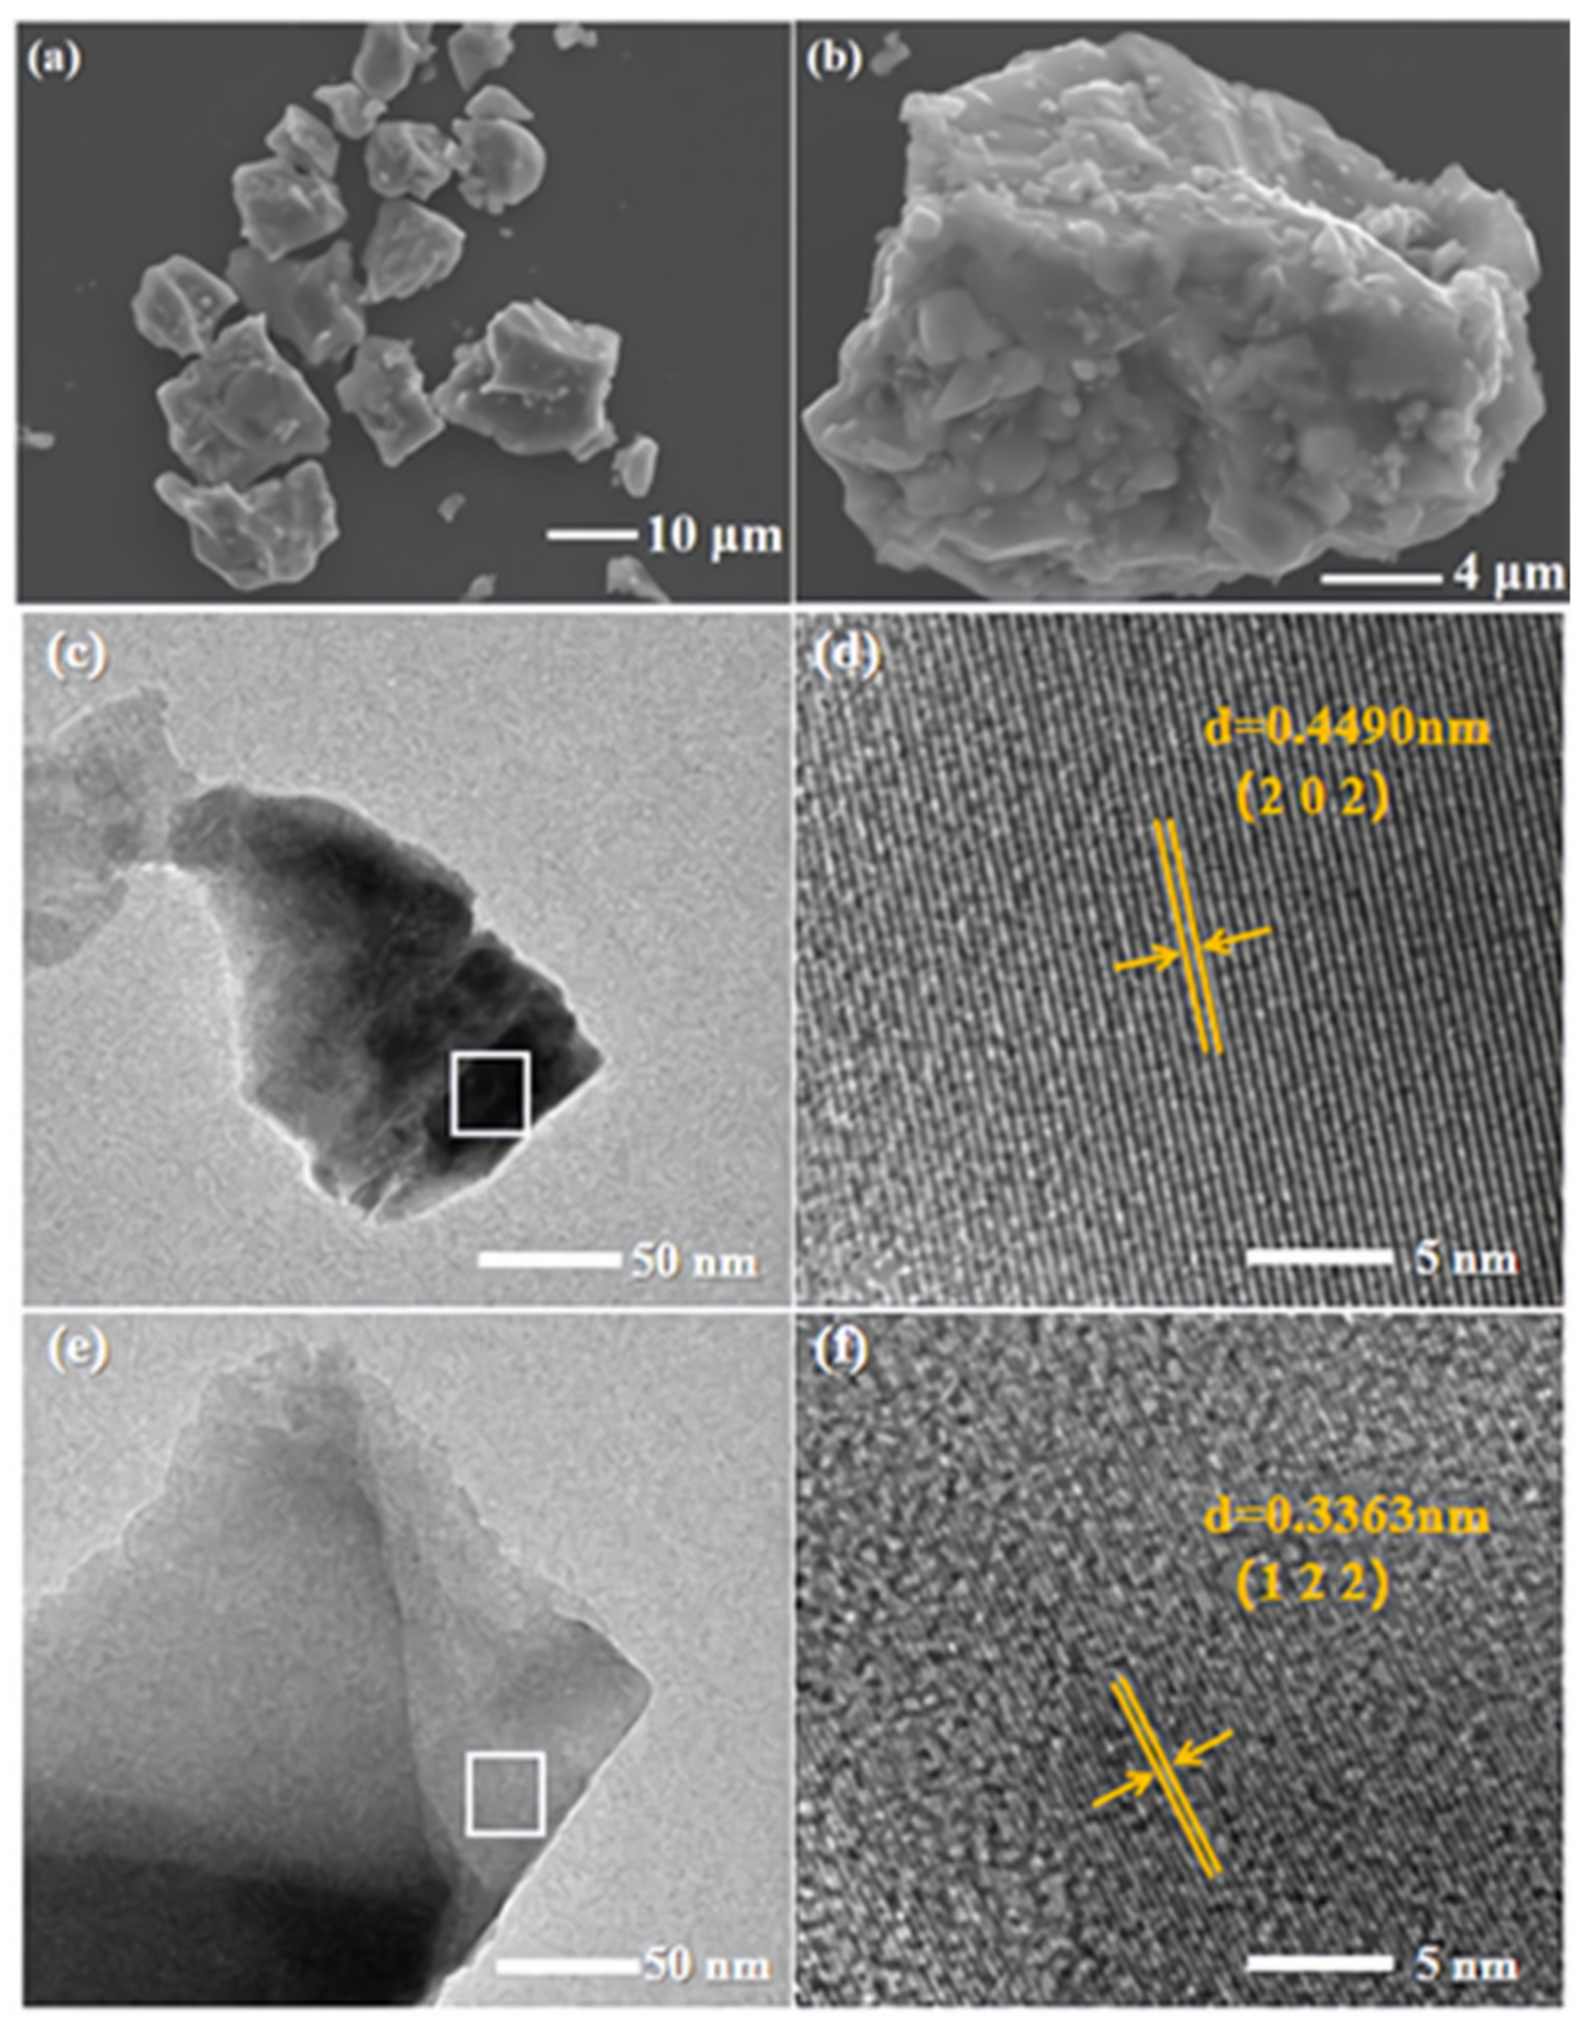
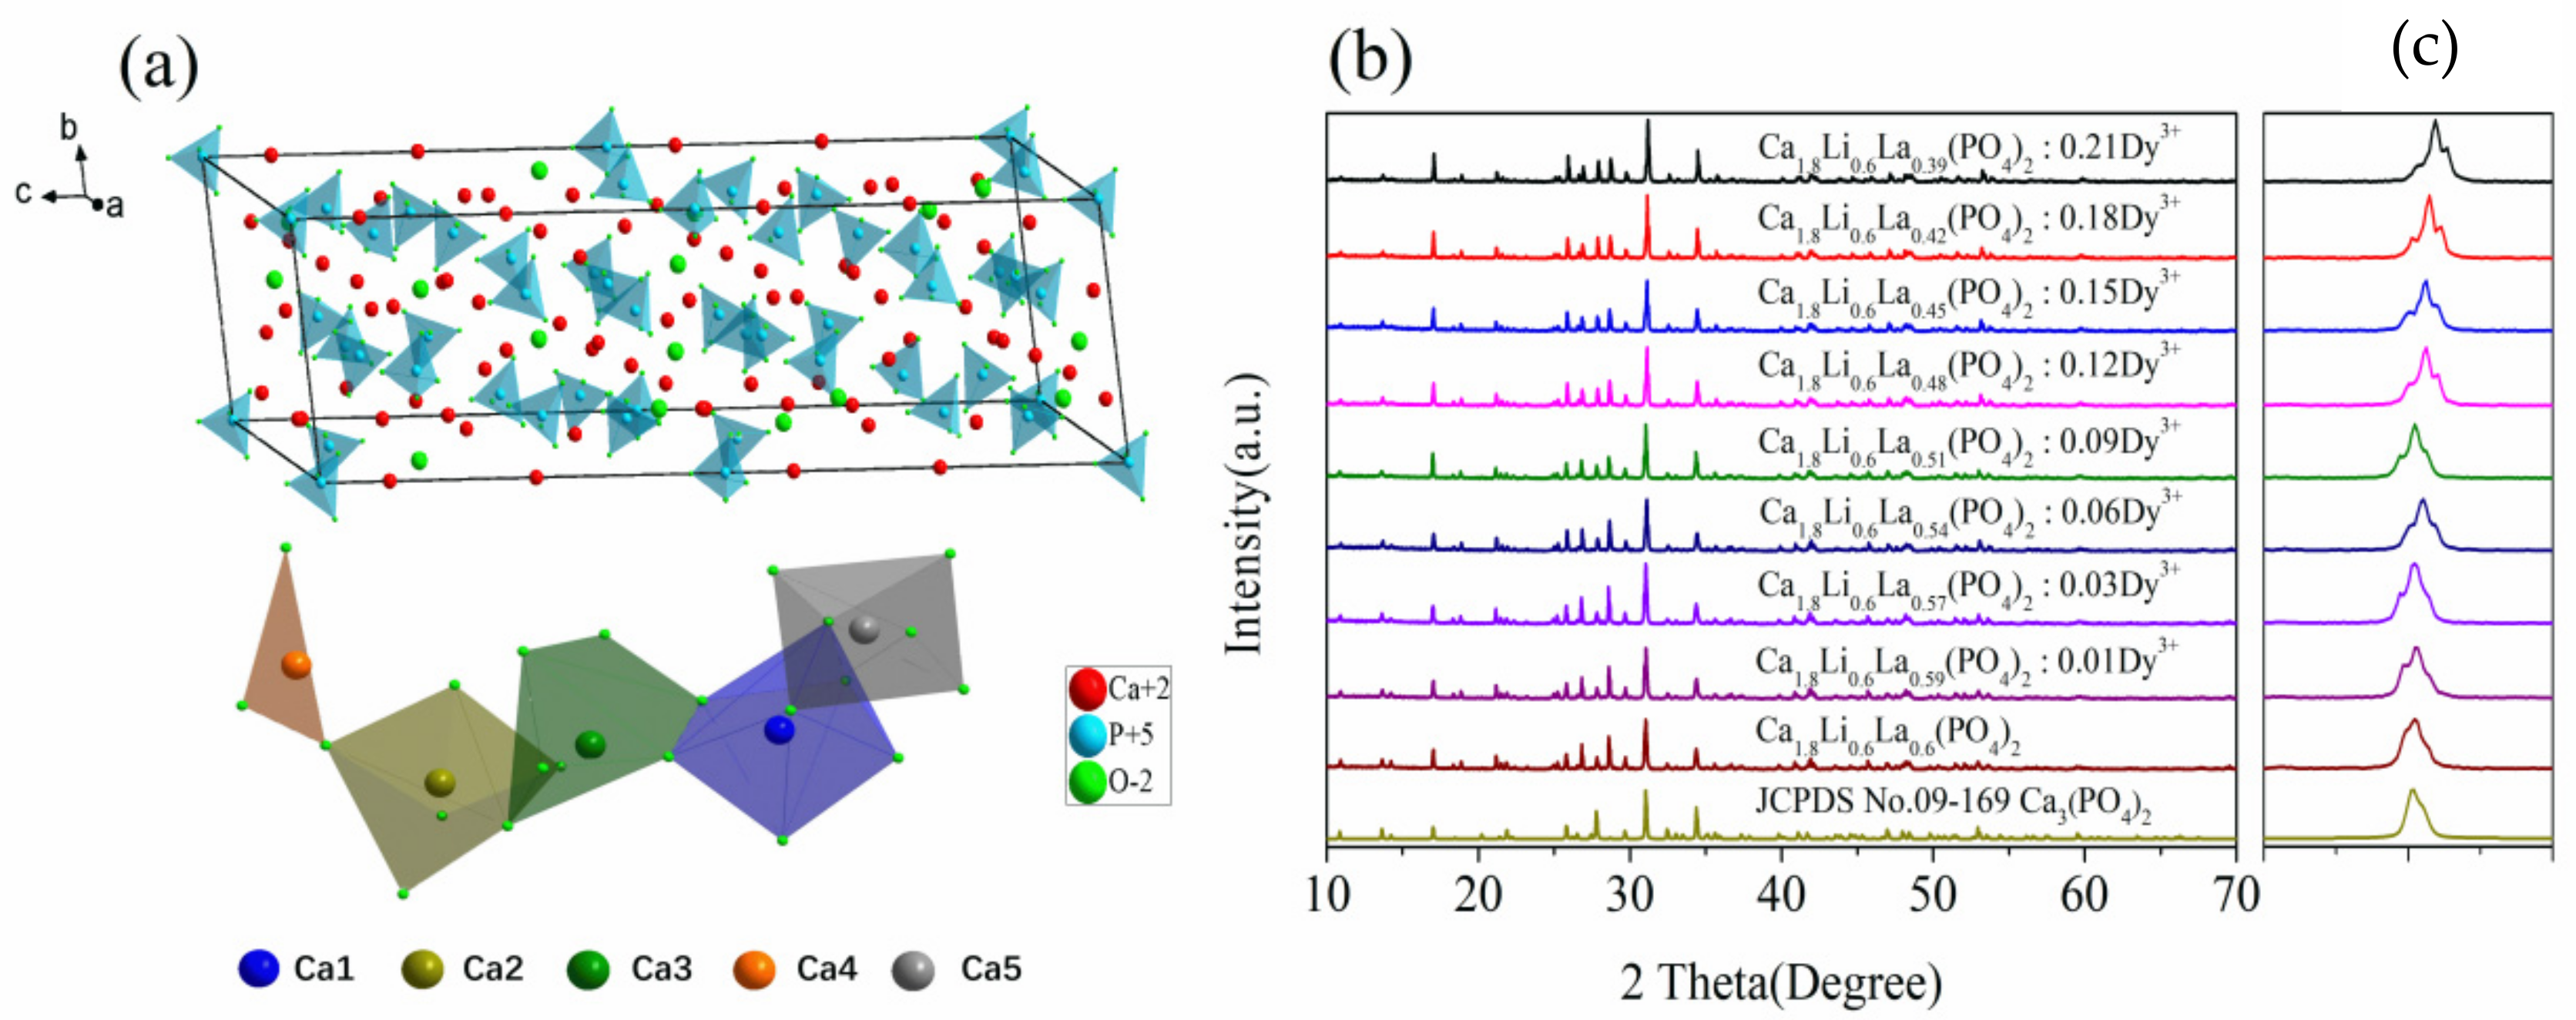
3.1. Crystal Structure

Ca3(PO4)2 (JCPDS No. 09-0169) is a hexagonal crystal system that belongs to the R3c (167) space group, and its crystal structure is depicted in Figure 1a, drawn by Diamond software (University of Bonn, Bonn, North Rhine-Westphalia, Germany). As shown in Figure 1a, whitlockite has five cationic sites Ca1–Ca5, with Ca1, Ca2, and Ca3 occupying general positions, while Ca4 and Ca5 occupy positions 6a and 6b on the triple rotation axis, respectively. By substituting Ca2+, different whitlockite compounds can be made.
X-ray diffractograms (XRD) of the sample Ca1.8Li0.6La0.6−x(PO4)2:xDy3+ (x = 0, 0.01, 0.03, 0.06, 0.09, 0.12, 0.15, 0.18, and 0.21) and the standard card JCPDS No. 09-169 are shown in Figure 1b. The diffraction peaks of the samples match well with that of the standard card for Ca3(PO4)2 (JCPDS No. 09-0169). The resulting sample is still pure phase despite replacing the portion of the Ca2+ by Li+ and La3+. The sample Ca1.8Li0.6La0.6−x(PO4)2:xDy3+ has roughly the same structure as the Ca3(PO4)2 and belongs to the hexagonal crystal system with the R3c (167) space group. The local magnification of the sample from 30° to 32° is shown in Figure 1c, and it is clear that the strongest diffraction peaks shifted to a higher angle when the Dy3+ doping concentration increases, due to the fact that the smaller radius Dy3+ (CN = 6, RDy3+ = 0.908 Å) occupies the crystal lattice of the larger radius La3+ (CN = 6, RLa3+ = 1.061 Å).
To learn more about the structure of the samples, we analyzed the XRD results and obtained the lattice parameters, which we compared to the standard card JCPDS No. 09-169, and the results are displayed in Table 2. In the hexagonal crystal structure, a = b = 90°, and c = 120°. The c-axis of the sample gradually shortens with the increase in the Dy3+ doping concentration, and the cell volume steadily reduces, as shown in Table 2. This also means that Dy3+ was successfully absorbed into the crystal structure.
To further understand the crystalline nature of the samples, their average crystallite size was calculated using the Scherrer equation:
D = k λ β cos θ
where k is the Scherrer constant (k = 0.89), λ is the wavelength of radiation (λ = 0.15418), and β is the full width at half maximum parameter of the measured sample. We calculated the XRD data of Ca1.8Li0.6La0.57(PO4)2:0.03Dy3+ and obtained its average crystallite size as 63.92 nm.
Transmission electron micrographs (TEM) of Ca1.8Li0.6La0.6(PO4)2 and Ca1.8Li0.6La0.57(PO4)2:0.03Dy3+, as well as high-resolution transmission electron micrographs (HRTEM) of the designated regions, are shown in Figure 2c–f. According to HRTEM measurements, the crystalline surface spacing of the matrix was 0.4490 nm, which is consistent with the (202) crystalline surface of Ca3(PO4)2 (JCPDS No. 09-0169), and the crystalline surface spacing of the Dy3+-doped sample was 0.3363 nm, which is consistent with the (122) crystalline surface of Ca3(PO4)2, indicating that the samples are well crystallized. Scanning electron microscopy (SEM) images of Ca1.8Li0.6La0.6(PO4)2 are shown in Figure 2a,b. The prepared matrix samples were irregular, well crystallized, without agglomerates, and with good dispersion. The surface of the samples was not flat, and their particle size was not uniform, ranging from 5 to 20 microns, which met the requirements of practical application.

3.2. CIE

Figure 3 and Table 3 show the CIE coordinates of Ca1.8Li0.6La0.57(PO4)2:0.03Dy3+ at various temperatures. The samples emit white light when the excitation wavelength is 350 nm, and their luminescence color does not change with temperature. Compared with the previous results of CaSr2(PO4)2:Dy3+,Li+ with CIE coordinates of (0.3450, 0.3787) [2], the present experimental sample emits a more standard white light.

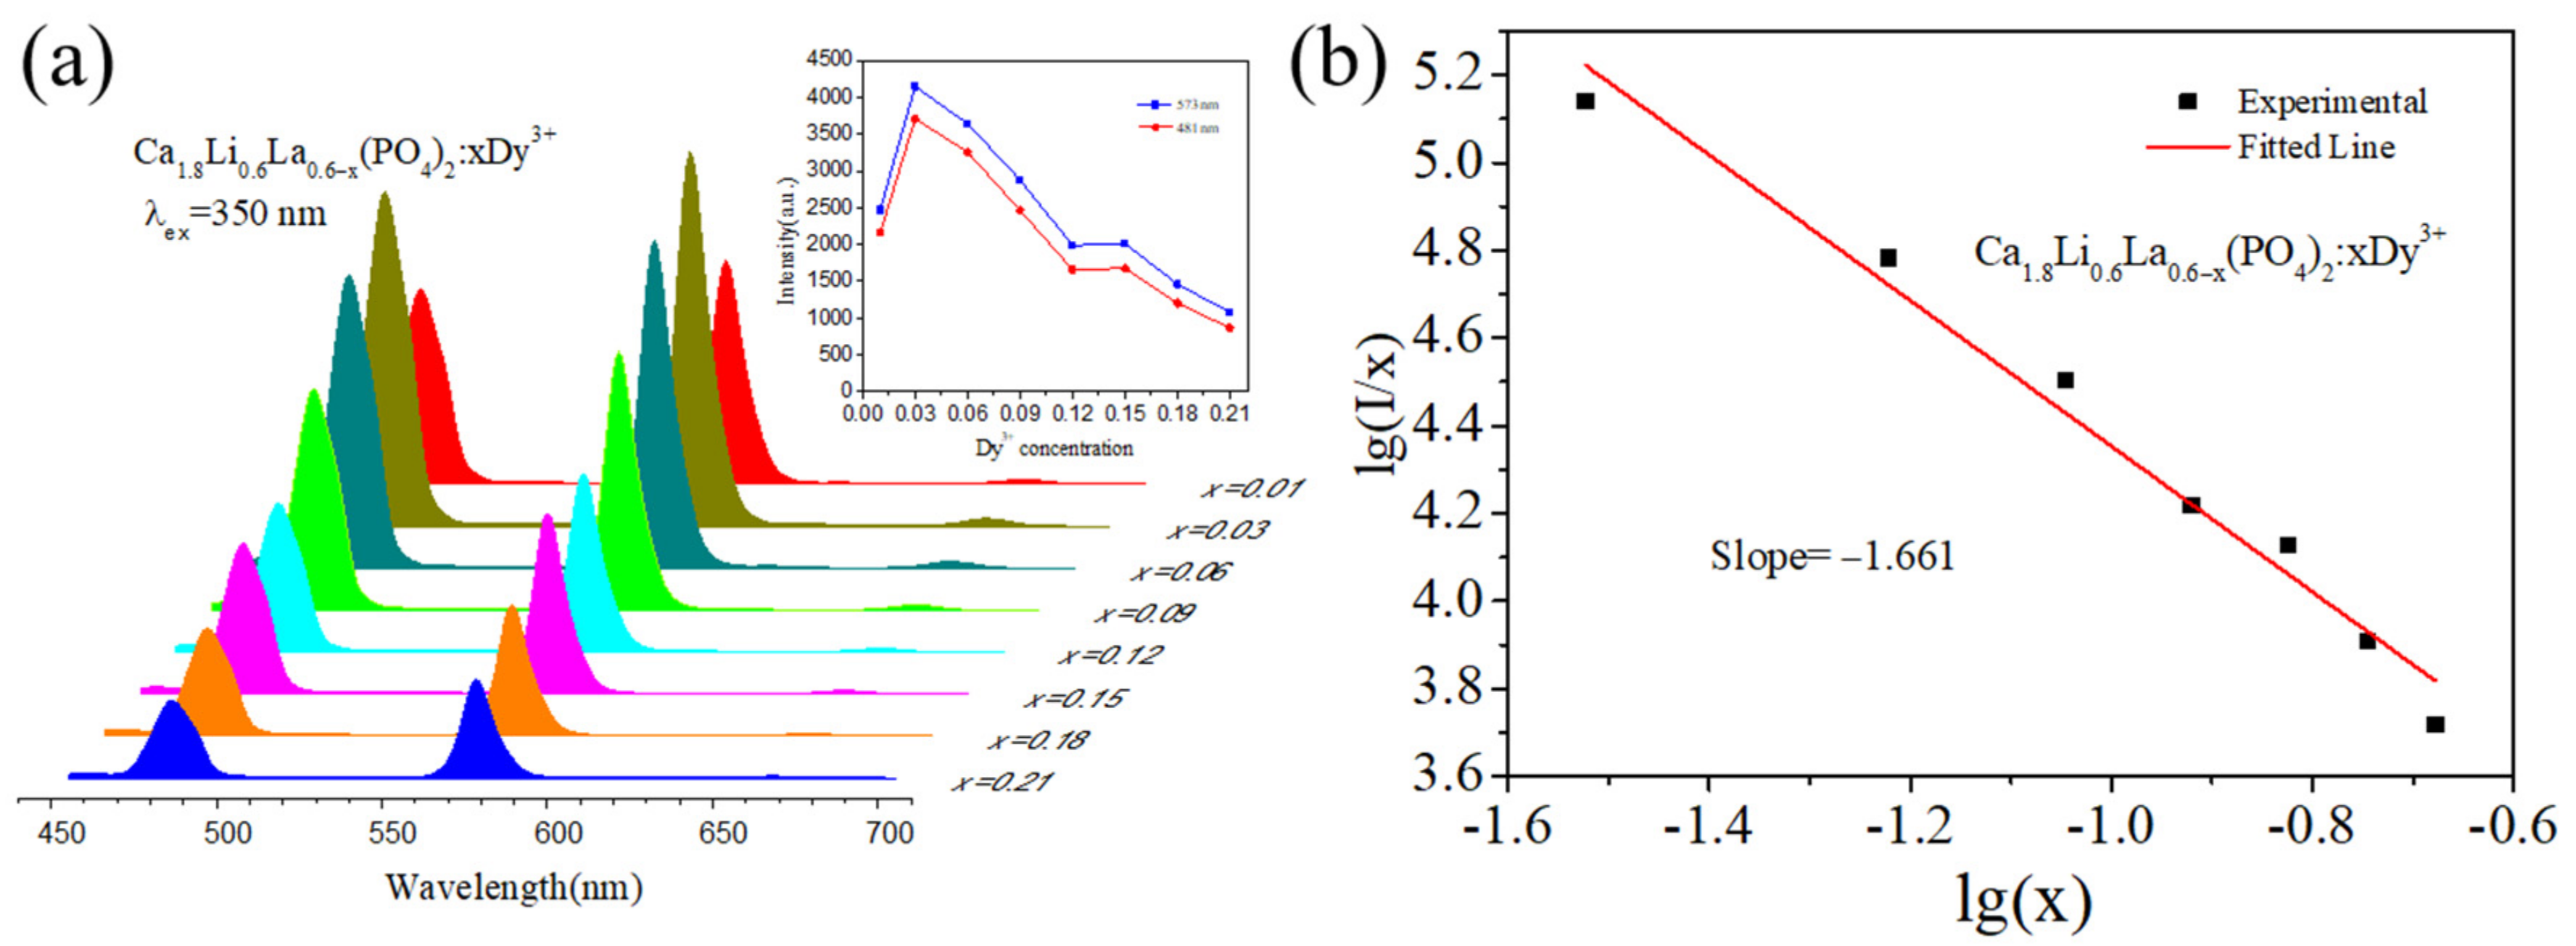
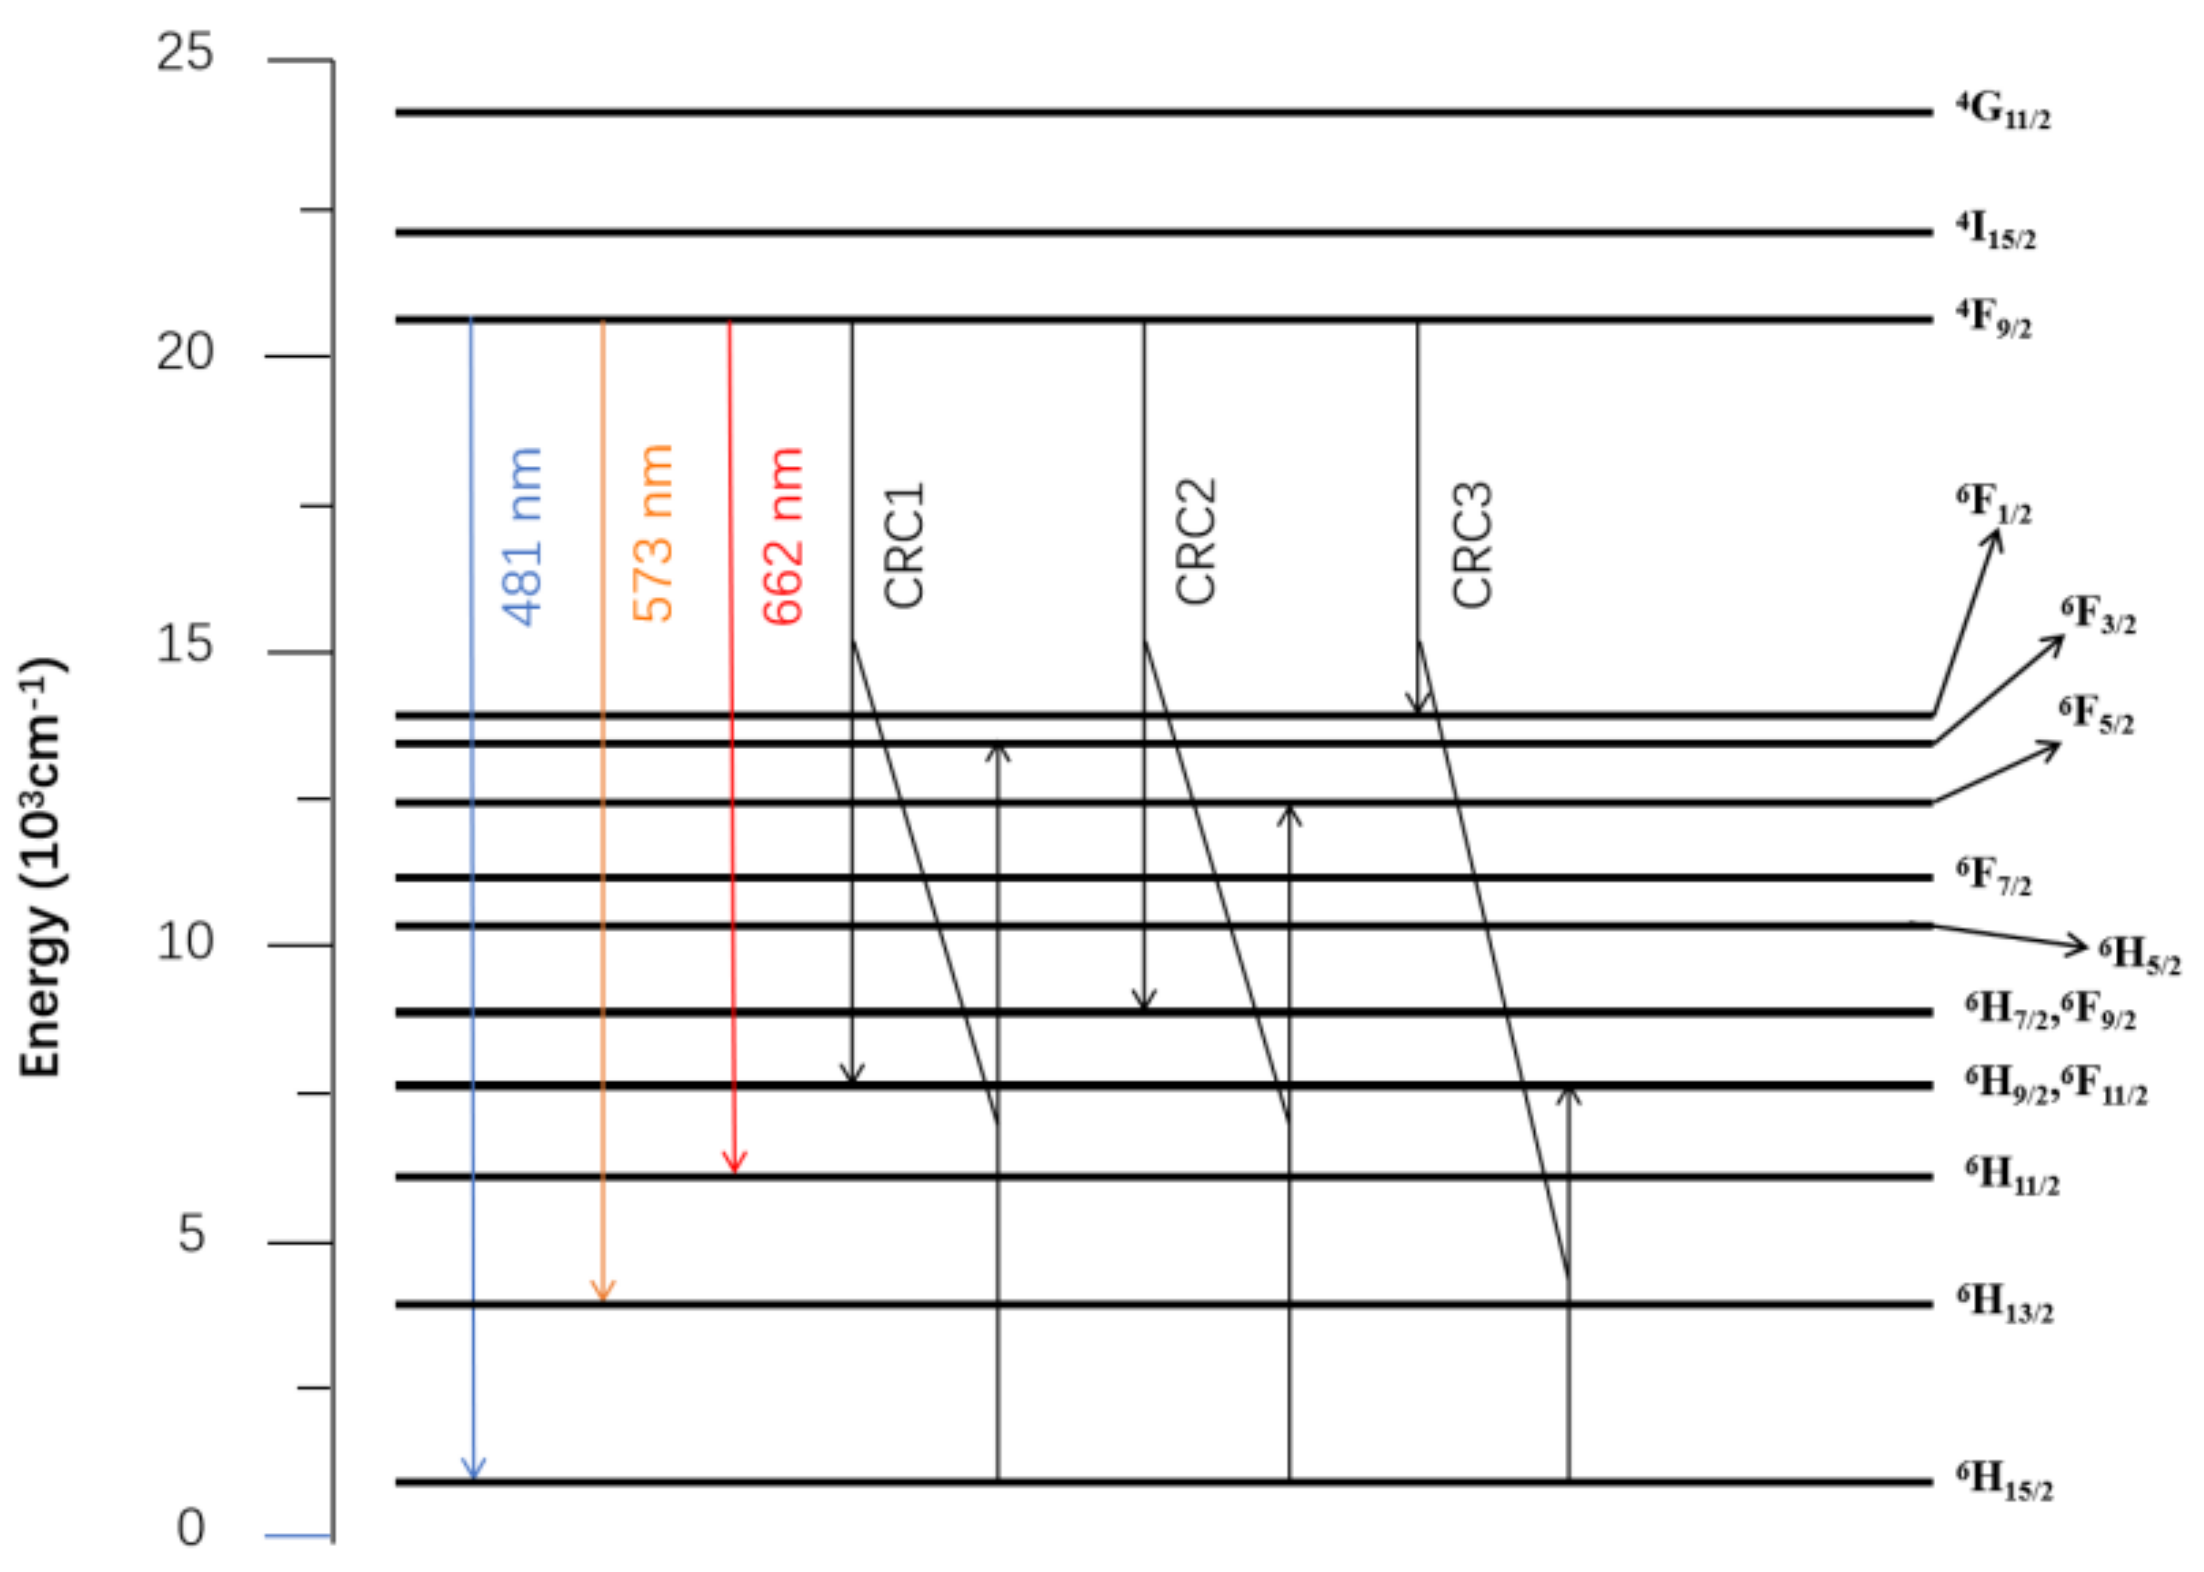
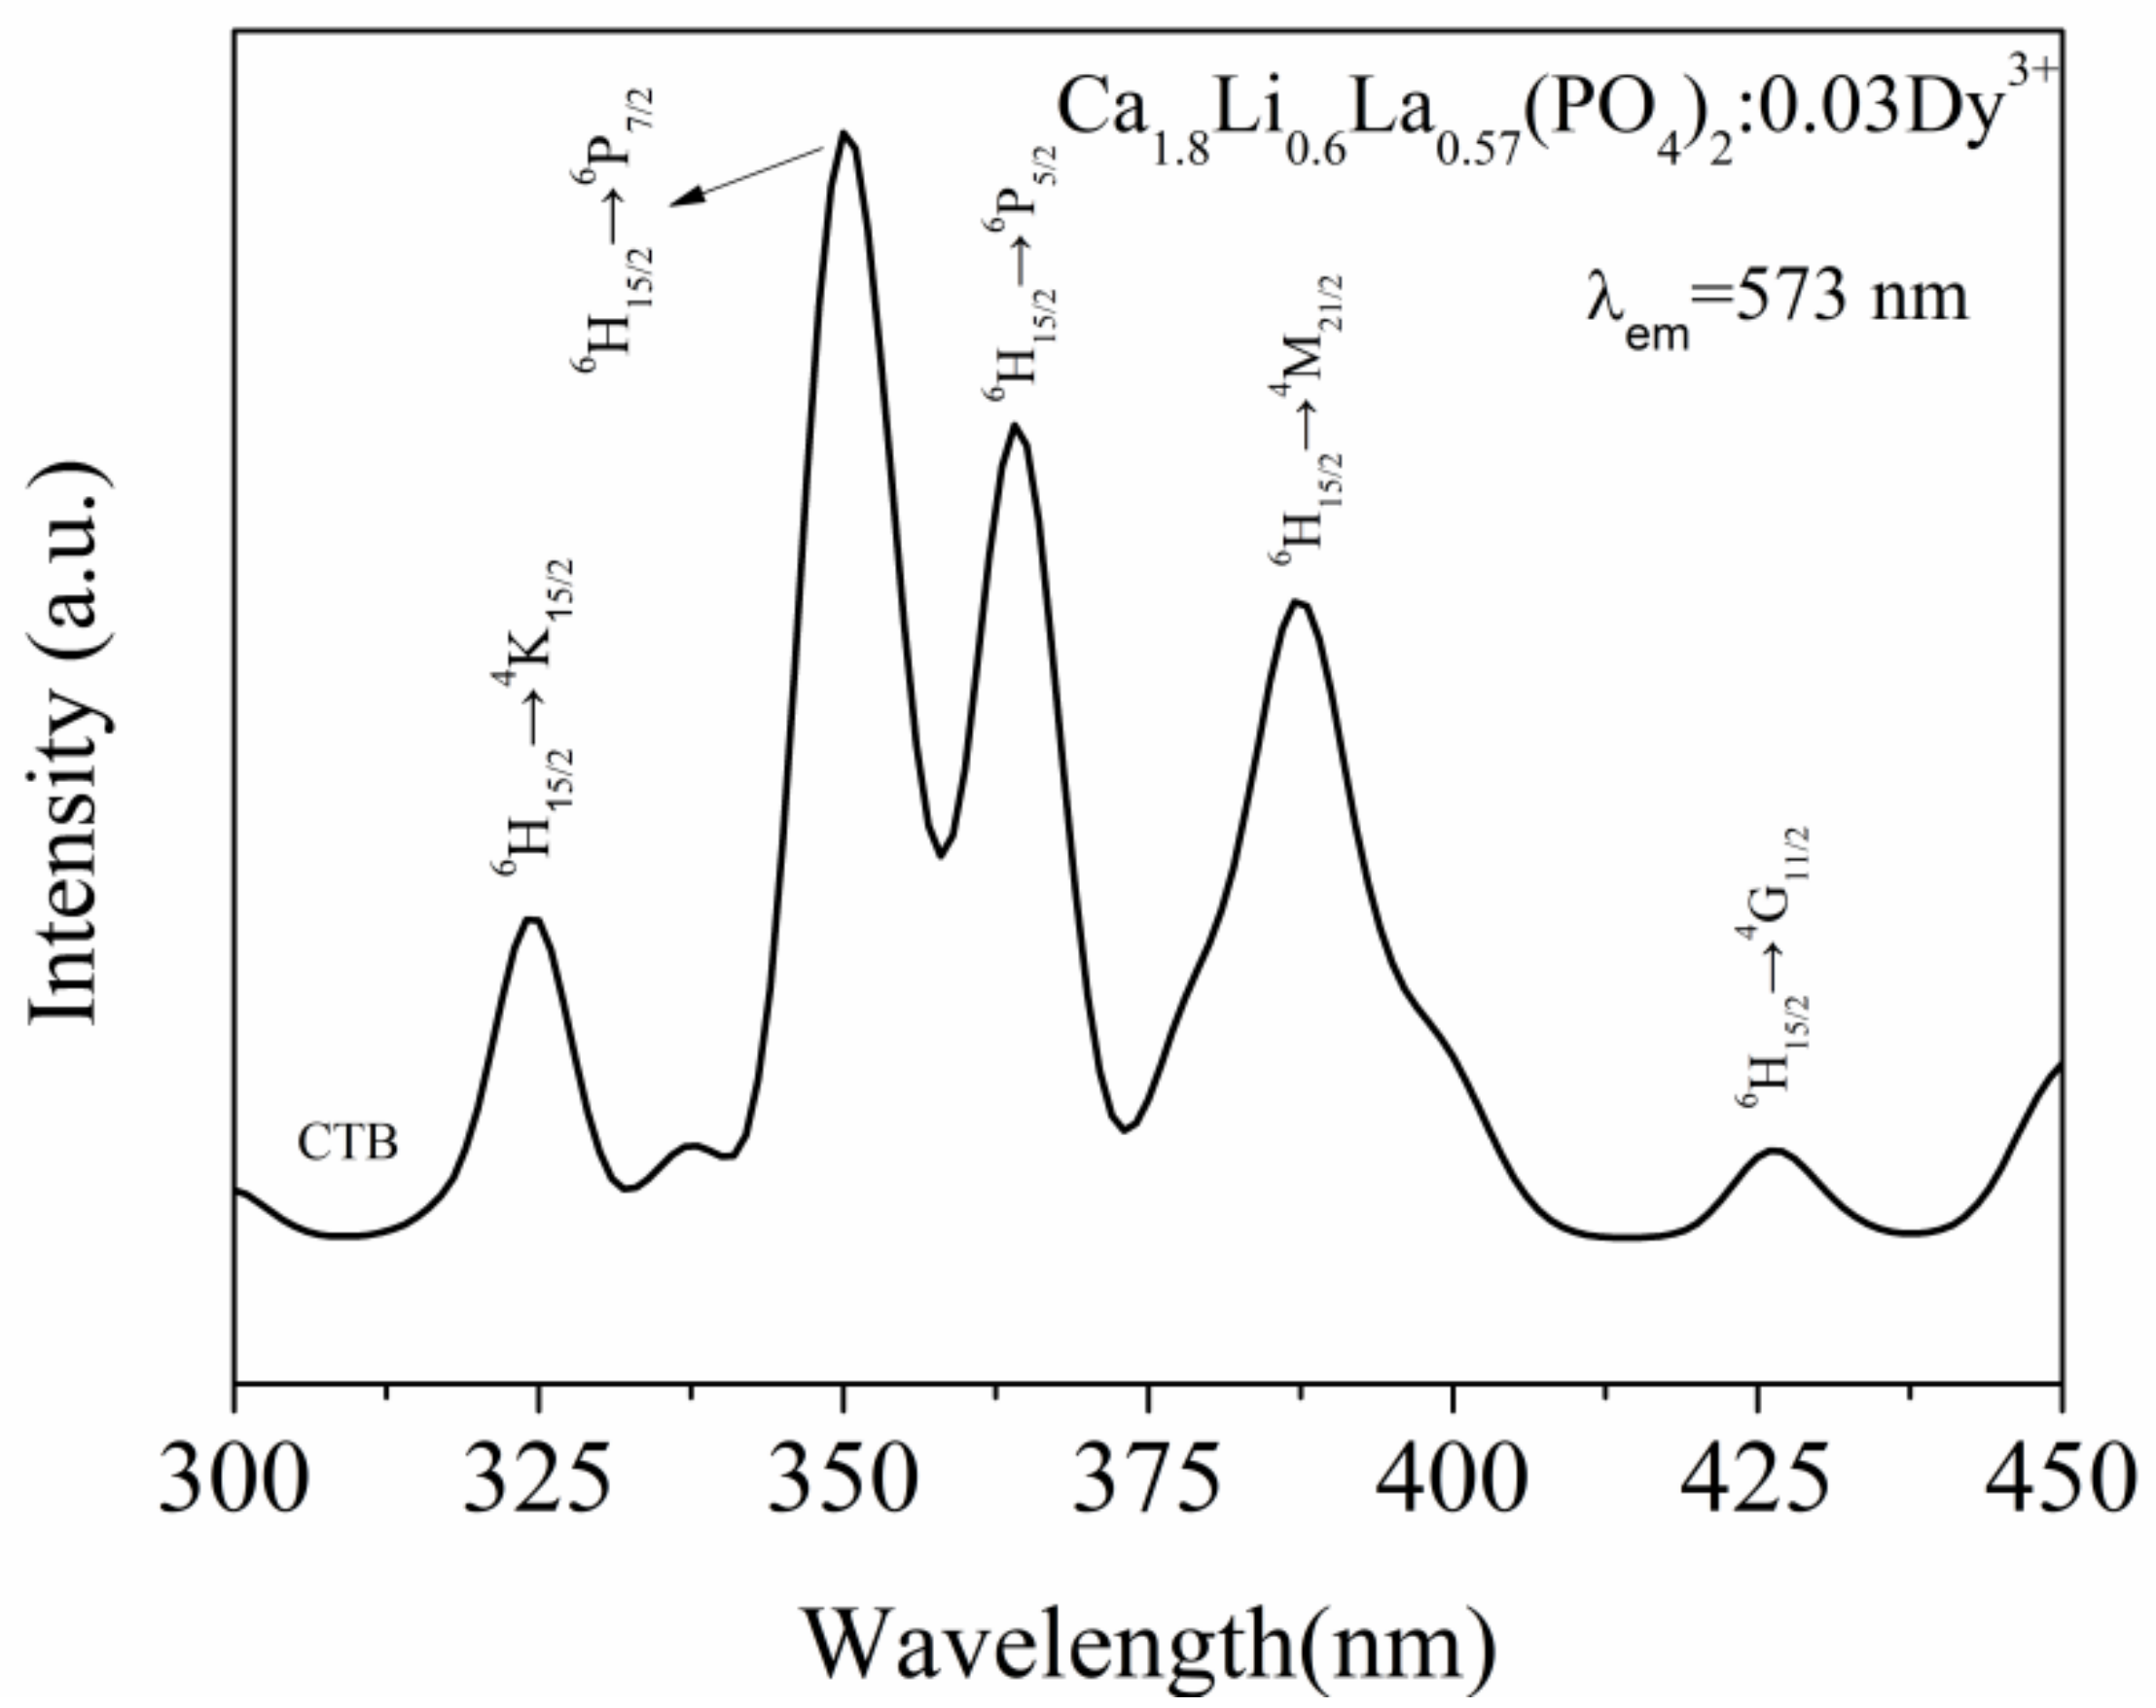
3.3. Photoluminescence Characteristics

The photoluminescence excitation spectrum of Ca1.8Li0.6La0.57(PO4)2:0.03Dy3+ phosphor (λem = 573 nm) is shown in Figure 4. The sample’s largest excitation peak is at 350 nm, while the second strongest excitation peak is at 364 nm, which correspond to the electron transitions at 6H15/26P7/2 and 6H15/26P5/2 of Dy3+, respectively. Furthermore, Dy3+ has characteristic excitation peaks at 324 nm, 387 nm, and 426 nm, which correspond to the electron transitions at 6H15/24K15/2, 6H15/24M21/2, and 6H15/24G11/2 of Dy3+ [23], respectively, and the O2−→Dy3+ charge migration band exists in the region before 320 nm (CTB).
The photoluminescence emission spectra of Ca1.8Li0.6La0.6−x(PO4)2:xDy3+ (x = 0.01, 0.03, 0.06, 0.09, 0.12, 0.15, 0.18, and 0.21) phosphor samples at 350 nm are shown in Figure 5a. The figure shows that in the 450–700 nm band, there are mainly two stronger emission peaks at 481 nm in the blue band and 573 nm in the yellow band, which correspond severally to the electron transitions at 4F9/26H15/2 and 4F9/26H13/2 of Dy3+ [24]. A weaker emission peak at 662 nm in the red band corresponds to the electron transition at 4F9/26H11/2 of Dy3+. The connection between Dy3+ doping concentration and emission intensity at 481 nm and 573 nm is shown in the inset of Figure 5a.
Concentration quenching happened when the doping concentration of Dy3+ ions was 0.03. To investigate the mechanism of energy transfer between Dy3+ ions, we calculated the critical distance. The critical radius distance Rc can be calculated using the equation in Blasse theory [25] as follows:
R c 2 3 V 4 π X C N 1 3
where V represents the volume per unit cell (V = 3509.69 Å), N represents the number of cations in a single cell (N = 21), and Xc represents the Dy3+ critical concentration (XC = 0.03). According to the calculations, Rc = 21.99 Å. The nonradiative energy transfer of ions, which is primarily caused by exchange interactions or multilayer interactions, is the principal source of concentration quenching. When the activator and sensitizer occupy nearby lattice sites and the overlap of their wave functions is adequate for electron exchange, i.e., when the critical distance between the activator and sensitizer is less than 5 Å, non-radiative energy transfer occurs. The values for Rc were substantially greater than 5 Å, indicating that multilevel interactions are used to transmit energy between Dy3+-Dy3+ ions in Ca1.8Li0.6La0.6−x(PO4)2:xDy3+. The Dexter theoretical model states:
I x = K 1 + β ( x ) θ / 3 1
where I is the intensity of the emission, x is the concentration of Dy3+, and K and β are constants. The value of θ determines the type of multilevel interactions. The nearest neighbor ion, dipole–dipole, dipole–quadrupole, and quadrupole–quadrupole interactions are represented severally by = 3, 6, 8, and 10 [26]. To probe into the values of θ, we chose x = 0.03, 0.06, 0.09, 0.12, 0.15, 0.18, and 0.21 samples corresponding to the emission intensity for the calculation. A linear plot of lg(I/x) versus lg(x) in Ca1.8Li0.6La0.6−x(PO4)2:xDy3+ is shown in Figure 5b. Fitting the data reveals that the slope is −1.661, resulting in the value of θ being 4.983, which is near to 6. The main mechanism of concentration quenching in the sample is hence dipole–dipole energy transfer.
Asymmetric molecules have intrinsic dipoles due to the uneven spatial distribution of electrons around the positively charged nucleus. The dipole–dipole interaction is calculated from the potential energy of the two dipoles, and the magnitude of the interaction depends on the central distance of the two dipoles and their relative orientation. After the activator concentration becomes large, a strong energy exchange occurs between activators, and this energy exchange depletes the number of luminescent energy levels and weakens the fluorescence intensity, which leads to a concentration quenching. The three cross-relaxation processes of Dy3+ (CRC1, CRC2, CRC3) are shown in Figure 6. Dy3+ in the 4F9/2 level can be de-excited to the (6H9/2,6F11/2), (6H7/2,6F9/2), and 6F1/2 levels, while the ground state Dy3+ receives energy to be excited to the 6F3/2, 6F5/2, and (6H9/2,6F11/2) levels [3].

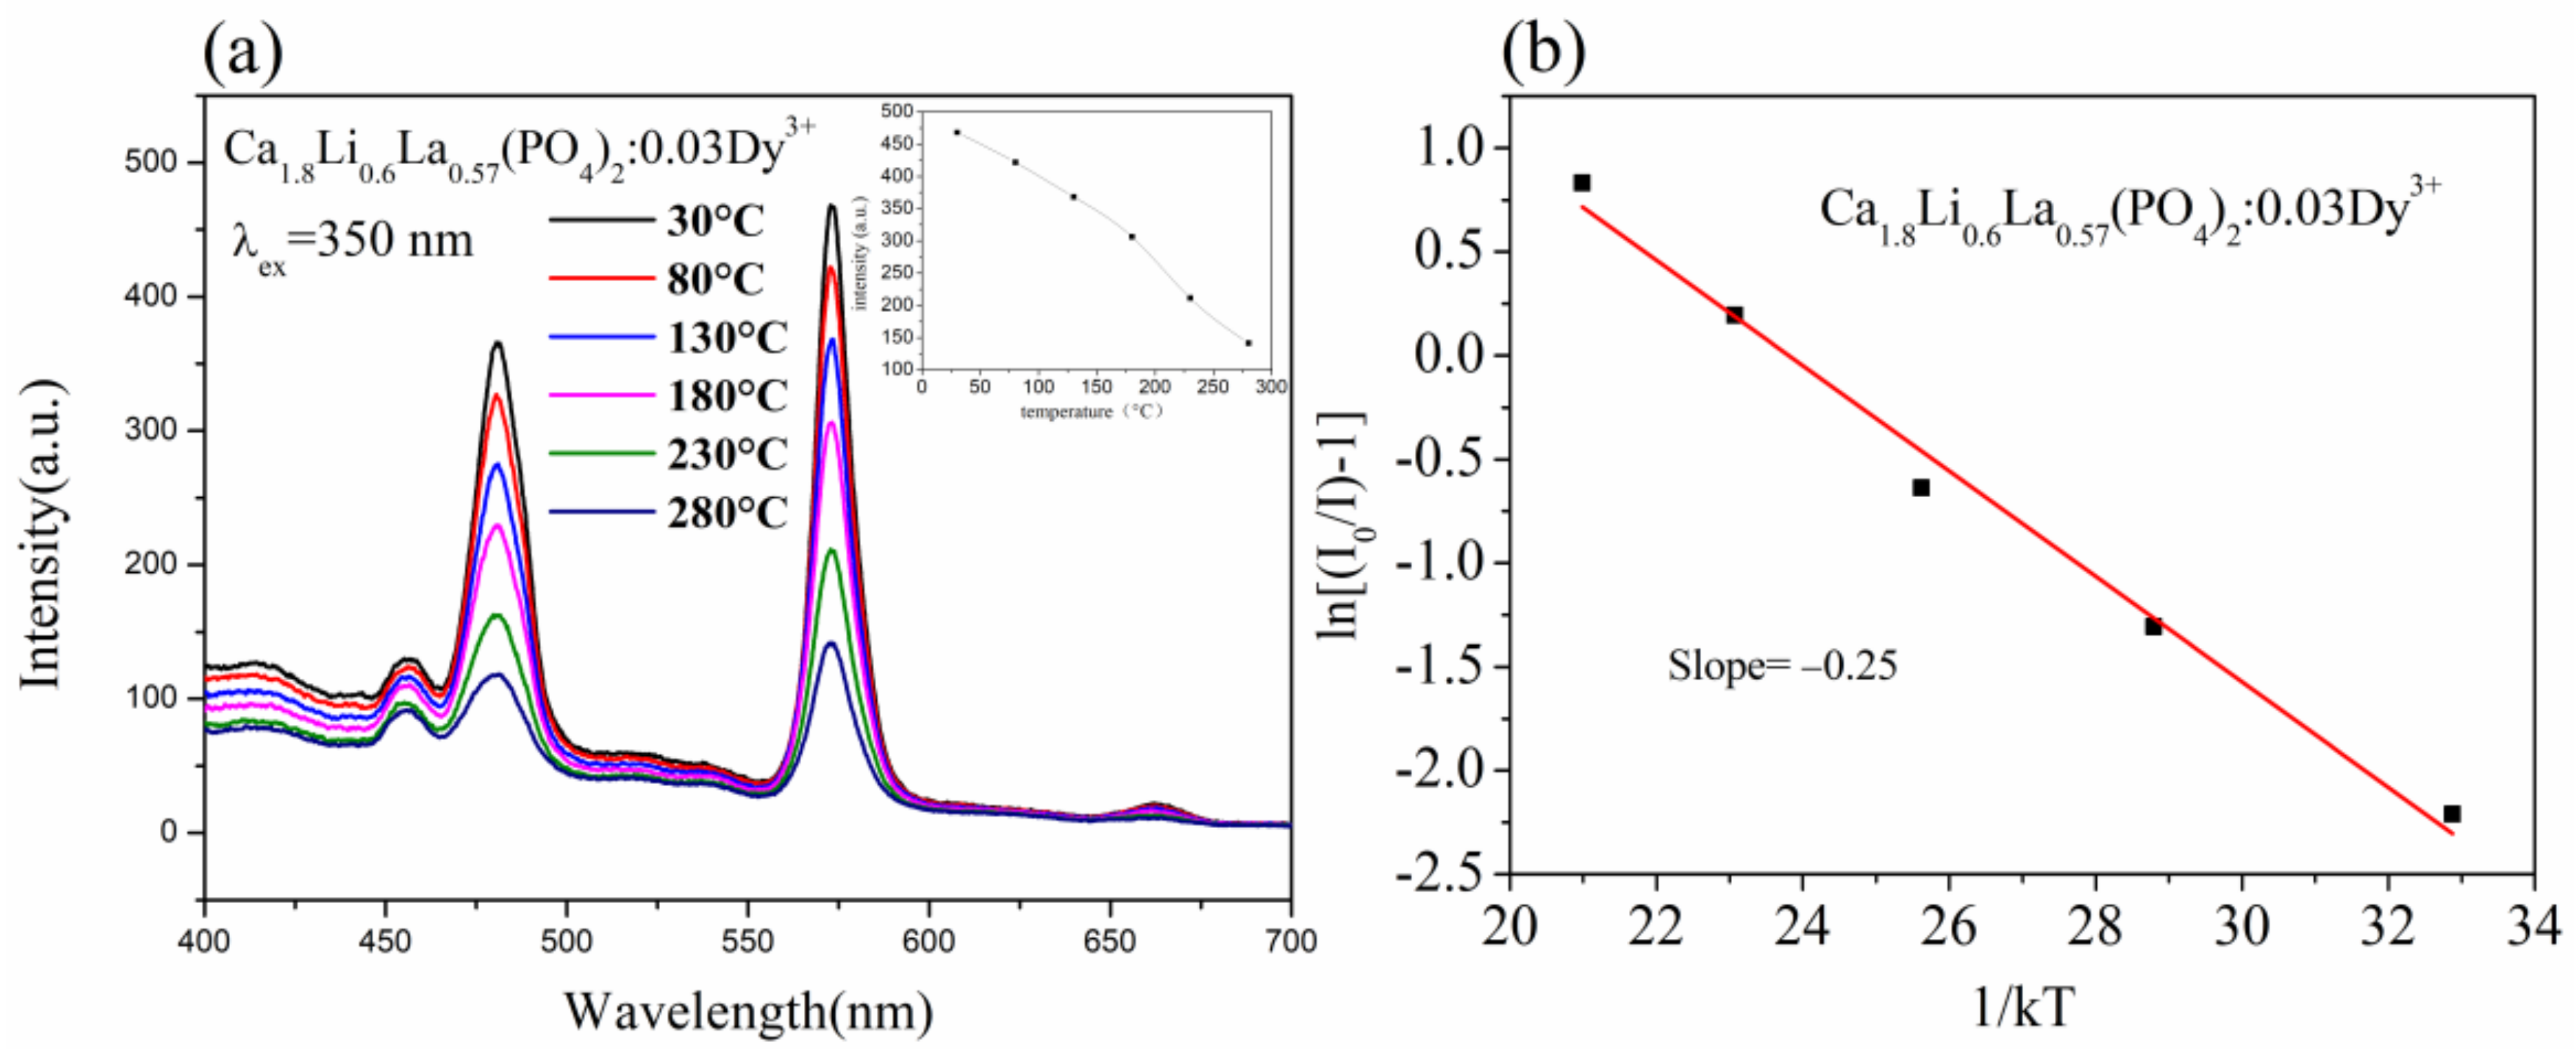
3.4. Thermal Stability

To investigate the samples’ thermal stability, we used variable temperature spectroscopy on the sample with the best luminescence intensity, Ca1.8Li0.6La0.57(PO4)2: 0.03Dy3+. Figure 7a shows the photoluminescence emission spectra (λex = 350 nm) at variable temperatures ranging from 30 to 280 °C for Ca1.8Li0.6La0.57(PO4)2:0.03Dy3+. The intensity values of the highest emission peaks at different temperatures are shown in the insets in Figure 7a. The luminescence intensity of the sample steadily drops as the temperature rises. At 130 °C, the luminescence intensity of the sample was about 78.7% of the initial intensity at room temperature, and at 180 °C, it was about 65.5 % of the initial intensity at room temperature.
The activation energy of the sample was derived from the experimental data using the Arrhenius formula to further study the sample’s thermal stability:
I = I 0 / 1 + A exp ( Δ E / k T )
where T is the temperature, I0 is the starting luminous intensity, I is the luminous intensity at T, ∆E is the activation energy, A is a constant, and k is the Boltzmann constant (8.617 × 10⁻⁵ eV) [27]. The relationship between ln[(I0/I) − 1] and 1/kT is shown in Figure 7b, and the Ca1.8Li0.6La0.57(PO4)2:0.03Dy3+ sample’s activation energy was 0.25 eV. Because a greater ∆E raises the nonradiative barrier between the excited and ground states, the higher the value of ∆E, the better the phosphor’s thermal stability. The sample has a higher ∆E value compared to SrLu(PO4)3:Dy3+ with ∆E = 0.214 eV [3], which means that the sample has a better thermal stability. In conclusion, the thermal stability of Ca1.8Li0.6La0.57(PO4)2:0.03Dy3+ phosphor is excellent.
By comparing the results of this article with the other work [2,3,28,29,30], we obtained Table 4. It can be seen that Ca1.8Li0.6La0.6−x(PO4)2:xDy3+ emits a more standard white light, and it has better thermal stability.

4. Conclusions

By replacing Ca2+ in whitlockite with Li+ and La3+, the high-temperature solid state technique was used to generate Ca1.8Li0.6La0.6−x(PO4)2:xDy3+, a whitlockite luminous material with good luminescence characteristics. First, the X-ray diffraction patterns of the synthesized samples were examined to ensure that they were pure phases. Then, a series of characterizations of the luminescence properties of these samples were carried out. From the experimental data, it is clear that under the excitation of 350 nm UV light, the samples emit white light with two main strong emission peaks at 481 nm in the blue band and 573 nm in the yellow band, which correspond to the electronic transitions at 4F9/26H15/2 and 4F9/26H13/2 of Dy3+, respectively. Concentration quenching occurred when the Dy3+ doping concentration was 0.03. The analysis found that the main source of the samples’ concentration quenching was dipole–dipole energy transfer. At room temperature, the luminescent material emits white light with CIE coordinates of (0.2750, 0.3006). Ca1.8Li0.6La0.6−x(PO4)2:xDy3+ has good thermal stability, and when the temperature reaches 130°C, the luminescence intensity of the sample was 78.7% of the initial intensity at ambient temperature, and their thermal quenching activation energy was 0.25 eV. As a new type of single-component white phosphor, the synthesis process of Ca1.8Li0.6La0.6−x(PO4)2:xDy3+ is relatively simple, the synthesis technology requirement is low, and it has good luminescence performance and thermal stability. Therefore, it has good scientific value and social benefits, and it has great economic prospects in the field of phosphors for LED lights.

Author Contributions

W.T., writing—original draft preparation and formal analysis; K.S., investigation; Q.G., L.M. and L.L., review and editing; H.L. and Y.Z., luminescence properties. All authors have read and agreed to the published version of the manuscript.

Funding

This work is supported by the National Natural Science Foundation of China (Grant no. 41802040), Guangdong Basic and Applied Basic Research Foundation (2021A1515110283 and 2021A1515110702), the Project funded by China Postdoctoral Science Foundation (2021M702562). Wanjuan Tang also thanks to the College Student Research Innovation Program of China University of Geosciences, Beijing.

Institutional Review Board Statement

Not applicable.

Informed Consent Statement

Not applicable.

Data Availability Statement

The study does not report any data.

Acknowledgments

Jewelry and mineral materials laboratory of experimental teaching demonstration center, School of Gemmology, China University of Geosciences, Beijing 100083, China.

Conflicts of Interest

The authors declare no conflict of interest.

References

  1. Yi, J.H. Development of samarium–cobalt rare earth permanent magnetic materia. Rare Met. 2014, 33, 633–640. [Google Scholar] [CrossRef]
  2. Guo, Q.F.; Chen, Y.Y.; Hao, Q.; Stefan, L.; Liu, H.K.; Mei, L.F.; Liao, L.B. Crystal structure and luminescence properties of a thermally stable single-phase white emitting phosphor CaSr2(PO4)2:Dy3+,Li+. Res. Sq. 2021. [Google Scholar] [CrossRef]
  3. Wang, T.; Hu, Y.; Chen, L.; Wang, X.; He, M. An intense single-component warm-white-light Sr3Lu(PO4)3:Dy3+ phosphor for white UV-LEDs. J. Mater. Sci. Mater. Electron. 2016, 27, 13235–13241. [Google Scholar] [CrossRef]
  4. Fan, G.; Ning, R.; Li, X.; Lin, X.; Du, B.; Luo, J.; Zhang, X. Mussel-Inspired Immobilization of Photocatalysts with Synergistic Photocatalytic–Photothermal Performance for Water Remediation. ACS Appl. Mater. Interfaces 2021, 13, 31066–31076. [Google Scholar] [CrossRef]
  5. Mahdavi, K.; Zinatloo-Ajabshir, S.; Yousif, Q.A.; Salavati-Niasari, M. Enhanced photocatalytic degradation of toxic contaminants using Dy2O3-SiO2 ceramic nanostructured materials fabricated by a new, simple and rapid sonochemical approach. Ultrason. Sonochem. 2021, 82, 105892. [Google Scholar] [CrossRef]
  6. Cani, D.; van der Waal, J.C.; Pescarmona, P.P. Highly-accessible, doped TiO2 nanoparticles embedded at the surface of SiO2 as photocatalysts for the degradation of pollutants under visible and UV radiation. Appl. Catal. A Gen. 2021, 621, 118179. [Google Scholar] [CrossRef]
  7. Janjua, M.R.S.A. Hydrogen as an energy currency: Encapsulation of inorganic Ga12N12 with alkali metals for efficient H2 adsorption as hydrogen storage materials. J. Phys. Chem. Solids 2021, 160, 110352. [Google Scholar] [CrossRef]
  8. Jung, G.W.; Park, K. Effect of monovalent charge compensators on the photoluminescence properties of Ca3(PO4)2:Tb3+, A+(A = Li, Na, K) phosphors. J. Mater. Sci. Technol. 2021, 82, 187–196. [Google Scholar] [CrossRef]
  9. Kim, D.; Bo, R.L.; Park, S.H. Study on Na3Lu1−xEux(PO4)2 phosphor: High efficient Na3Eu(PO4)2 red emitting phosphor with excellent thermal stability. J. Alloys Compd. 2019, 805, 346–354. [Google Scholar] [CrossRef]
  10. Park, K.; Kim, D.H.; Hakeem, D.A.; Jung, G.W.; Kim, S.W. Crystal structure and photoluminescence properties of garnet type as synthesized and aged Li7La3Zr2O12:xTb phosphors. Ceram. Int. 2020, 46, 10194–10202. [Google Scholar] [CrossRef]
  11. Park, K.; Hakeem, D.A.; Kim, D.H.; Jung, G.W.; Kim, S.W. Synthesis and Photoluminescence Properties of New Garnet-Type Red-Emitting Li7La3−XZr2O12:xEu3+ Phosphors. SSRN Electron. J. 2019, 179, 92–98. [Google Scholar]
  12. Han, Y.J.; Wang, S.; Liu, H.; Shi, L.; Ma, D.; Cui, X.Y.; Mao, Z.Y.; Wang, D.J.; Zhang, Z.W.; Lu, X.L. A novel Mn4+-activated garnet-type Li5La3Nb2O12 far red-emitting phosphor with high thermal stability for plant cultivation. J. Lumin. 2020, 219, 116888. [Google Scholar] [CrossRef]
  13. Zhang, B.; Huang, W.; Li, X.; Pang, Y.; Wang, L.; Zhang, Q. Role of energy band structure on the luminescence performance of double perovskite La2LiMO6:Eu3+ (M = Sb, Ta, Nb) red emitting phosphors. Opt. Mater. 2020, 107, 110135. [Google Scholar] [CrossRef]
  14. Yu, B.; Li, Y.; Zhang, R.; Li, H.; Wang, Y. A novel thermally stable eulytite-type NaBaBi2(PO4)3:Eu3+ red-emitting phosphor for pc-WLEDs. J. Alloys Compd. 2021, 852, 157020. [Google Scholar] [CrossRef]
  15. Li, Y.; Zheng, J.; Li, Z.; Yang, X.; Chen, J.; Chen, C. Luminescence properties of NaSrPO4:Tm3+ as novel blue emitting phosphors with high color purity. Optik 2018, 169, 257–263. [Google Scholar] [CrossRef]
  16. Nagaraj, R.; Rajagopal, V.; Raja, A.; Ranjith, S. Influence of Dy3+ ion concentration on photoluminescence and energy transfer mechanism of promising KBaScSi3O9 phosphors for warm white LEDs. Spectrochim. Acta Part A Mol. Biomol. Spectrosc. 2021, 264, 120212. [Google Scholar] [CrossRef]
  17. Wu, X.; Jiang, C.; Liang, Z.; Wang, Q.; Feng, J.; Zhu, D.; Pan, S.; Lin, Z.; Tan, D.; Mu, Z. Photoluminescence properties of LaB3O6:Dy3+ phosphors for white light-emitting diodes. Optik 2020, 216, 164877. [Google Scholar] [CrossRef]
  18. Golim, O.P.; Huang, S.; Yang, T. Greenish-yellow emitting Ca9MgLi(PO4)7:Dy3+ phosphors-Photoluminescence and thermal stability. J. Lumin. 2021, 229, 117675. [Google Scholar] [CrossRef]
  19. Dai, T.; Ju, G.; Jin, Y.; Zhou, X.; Li, Y.; Wu, H.; Hu, Z.; Hu, Y. Novel yellow color-emitting BaY2O4:Dy3+ phosphors: Persistent luminescence from blue to red. Appl. Phys. A 2020, 126, 1–9. [Google Scholar] [CrossRef]
  20. Wang, J.; Wang, J.; Ping, D. Luminescent properties of Dy3+ doped Sr3Y(PO4)3 for white LEDs. Mater. Lett. 2013, 107, 96–98. [Google Scholar] [CrossRef]
  21. Zhang, Z.; Han, C.L.; Shi, W.W. Enhanced novel white emission in Ca3(PO4)2:Dy3+ single-phase full-color phosphor by charge compensation. J. Mater. Sci. Mater. Electron. 2015, 26, 1923–1931. [Google Scholar] [CrossRef]
  22. Berends, A.C.; Haar, M.; Krames, M.R. YAG:Ce3+ Phosphor: From Micron-Sized Workhorse for General Lighting to a Bright Future on the Nanoscale. Chem. Rev. 2020, 120, 13461–13479. [Google Scholar] [CrossRef]
  23. Gao, S.; Xu, S.; Wang, Y. Spectral characteristics and White Emission of Dy3+/Tm3+-BaLaGa3O7 phosphors. J. Lumin. 2016, 178, 282–287. [Google Scholar] [CrossRef]
  24. Yu, X.; Yang, P.; Kang, W.; Song, R.; Zheng, Y.; Mi, X. Color-tunable luminescence and energy transfer properties of Ca1.5Sr1.5(PO4)2:Dy3+, Tb3+ phosphor via hydrothermal synthesis. J. Lumin. 2021, 241, 118478. [Google Scholar] [CrossRef]
  25. Blasse, G. Energy transfer in oxidic phosphors. Phys. Lett. A 1968, 28, 444–445. [Google Scholar] [CrossRef]
  26. Dexter, D.L.; Schulman, J.H. Theory of Concentration Quenching in Inorganic Phosphors. J. Chem. Phys. 1954, 22, 1063–1070. [Google Scholar] [CrossRef]
  27. Zhang, Q.; Wang, X.; Ding, X.; Wang, Y. A Potential Red-Emitting Phosphor BaZrGe3O9:Eu3+ for WLED and FED Applications: Synthesis, Structure, and Luminescence Properties. Inorg. Chem. 2017, 56, 6990–6998. [Google Scholar] [CrossRef]
  28. Zhao, J.; Hu, C.; Lu, J.; Sun, R.; Wang, Z.; Yin, Y.; Liu, W.; Gu, C.; Li, Z.; Zhong, D.; et al. Single-phase white-emitting phosphors Ba3Bi(PO4)3:Dy3+, Eu3+ with tunable correlated color temperature and high thermal stability towards light emitting applications. J. Mater. Sci. Mater. Electron. 2021, 32, 28077–28087. [Google Scholar] [CrossRef]
  29. Liu, F.; Liu, Q.; Fang, Y.; Zhang, N.; Yang, B.; Zhao, G. White light emission from NaLa(PO3)4:Dy3+ single-phase phosphors for light-emitting diodes. Ceram. Int. 2015, 41, 1917–1920. [Google Scholar] [CrossRef]
  30. Dillip, G.R.; Kumar, G.B.; Bandi, V.R.; Hareesh, M.; Raju, B.D.P.; Joo, S.W.; Bharat, L.K.; Yu, J.S. Versatile host-sensitized white light emission in a single-component K3ZnB5O10:Dy3+ phosphor for ultraviolet converted light-emitting diodes. J. Alloys Compd. 2017, 699, 1108–1117. [Google Scholar] [CrossRef]
Figure 1. (a) Cell structure diagram of β-Ca3(PO4)2, (b,c) XRD patterns of Ca1.8Li0.6La0.6−x(PO4)2:xDy3+ phosphor and JCPDS No.09-169.
Materials 15 02177 g001
Figure 2. (a,b) SEM images of Ca1.8Li0.6La0.6(PO4)2 phosphor, (cf) TEM and HRTEM image of Ca1.8Li0.6La0.6(PO4)2 phosphor and Ca1.8Li0.6La0.57(PO4)2:0.03Dy3+ phosphor.
Materials 15 02177 g002
Figure 3. CIE coordinates diagram of Ca1.8Li0.6La0.57(PO4)2:0.03Dy3+. Phosphor at different temperatures.
Materials 15 02177 g003
Figure 4. Photoluminescence excitation spectrum of Ca1.8Li0.6La0.6−x(PO4)2:xDy3+ phosphor.
Materials 15 02177 g004
Figure 5. (a) Photoluminescence emission spectra of Ca1.8Li0.6La0.6−x(PO4)2:xDy3+(x = 0.01, 0.03, 0.06, 0.09, 0.12, 0.15, 0.18, and 0.21) phosphor. (b) The relationship between. lg (I/x) and lg(x) of Ca1.8Li0.6La0.6−x(PO4)2:xDy3+ phosphor.
Materials 15 02177 g005
Figure 6. The energy level scheme and the three cross-reaction mechanisms of Dy3+.
Materials 15 02177 g006
Figure 7. (a) The temperature-dependent photoluminescence emission spectra of Ca1.8Li0.6La0.57(PO4)2:0.03Dy3+ phosphor(λex = 350 nm) and (b) the relationship between ln[(I0/I)−1] and 1/kT of Ca1.8Li0.6La0.57(PO4)2:0.03Dy3+ phosphor.
Materials 15 02177 g007
Table 1. Quality of raw materials for Ca1.8Li0.6La0.6−x(PO4)2:xDy3+.
Samplex = 0.00x = 0.01x = 0.03x = 0.06x = 0.09x = 0.12x = 0.15x = 0.18x = 0.21
Li2CO3 (g)0.04430.04430.04430.04430.04430.04430.04430.04430.0443
La2O3 (g)0.19550.19220.18570.17590.16620.15640.14660.13680.1271
CaCO3 (g)0.36030.36030.36030.36030.36030.36030.36030.36030.3603
Dy2O3 (g)0.00000.00370.01120.02240.03360.04480.05590.06710.0783
NH4H2PO4 (g)0.46010.46010.46010.46010.46010.46010.46010.46010.4601
Table 2. Lattice parameters of Ca1.8Li0.6La0.6−x(PO4)2:xDy3+.
SampleStandardx = 0x = 0.01x = 0.03x = 0.06x = 0.09x = 0.12x = 0.15x = 0.18x = 0.21
a (Å)10.42910.43510.41110.40710.41910.43110.42310.42810.41210.402
c (Å)37.38037.34937.43337.41837.31937.35437.27837.27037.23237.173
Cell volume (Å)3520.903521.973513.703509.693508.223519.773507.123510.053495.803483.42
Table 3. CIE coordinates of Ca1.8Li0.6La0.6−x(PO4)2:xDy3+ at different temperatures.
Temperature (°C)XY
30 °C0.27500.3006
80 °C0.27530.3005
130 °C0.27560.3004
180 °C0.27380.2974
230 °C0.26680.2885
280 °C0.25680.2754
Table 4. Comparison of the results of this article with the other work.
Ca1.8Li0.6La0.6−x(PO4)2:xDy3+Ba3Bi(PO4)3:Dy3+, Eu3+SrLu(PO4)3:Dy3+K3ZnB5O10:Dy3+CaSr2(PO4)2:Dy3+, Li+NaLa(PO3)4:Dy3+
Concentration quenchingx = 0.03x = 0.08x = 0.08x = 0.05x = 0.06x = 0.06
CIE Coordinate(0.2750, 0.3006)(0.3920, 0.3780)(0.3740, 0.4070)(0.2560, 0.2580)(0.3450, 0.3787)(0.2923, 0.3359)
Activation energy0.250 eV0.230 eV0.214 eV0.520 eVUnspecifiedUnspecified
Publisher’s Note: MDPI stays neutral with regard to jurisdictional claims in published maps and institutional affiliations.

