
W–Cu Composite with High W Content Prepared by Grading Rounded W Powder with Narrow Particle Size Distribution

 ,
,
Abstract
:1. Introduction
2. Materials and Methods
2.1. Tungsten Powder Treatment
2.2. W–Cu Composite Preparation
2.3. Characterization
3. Results
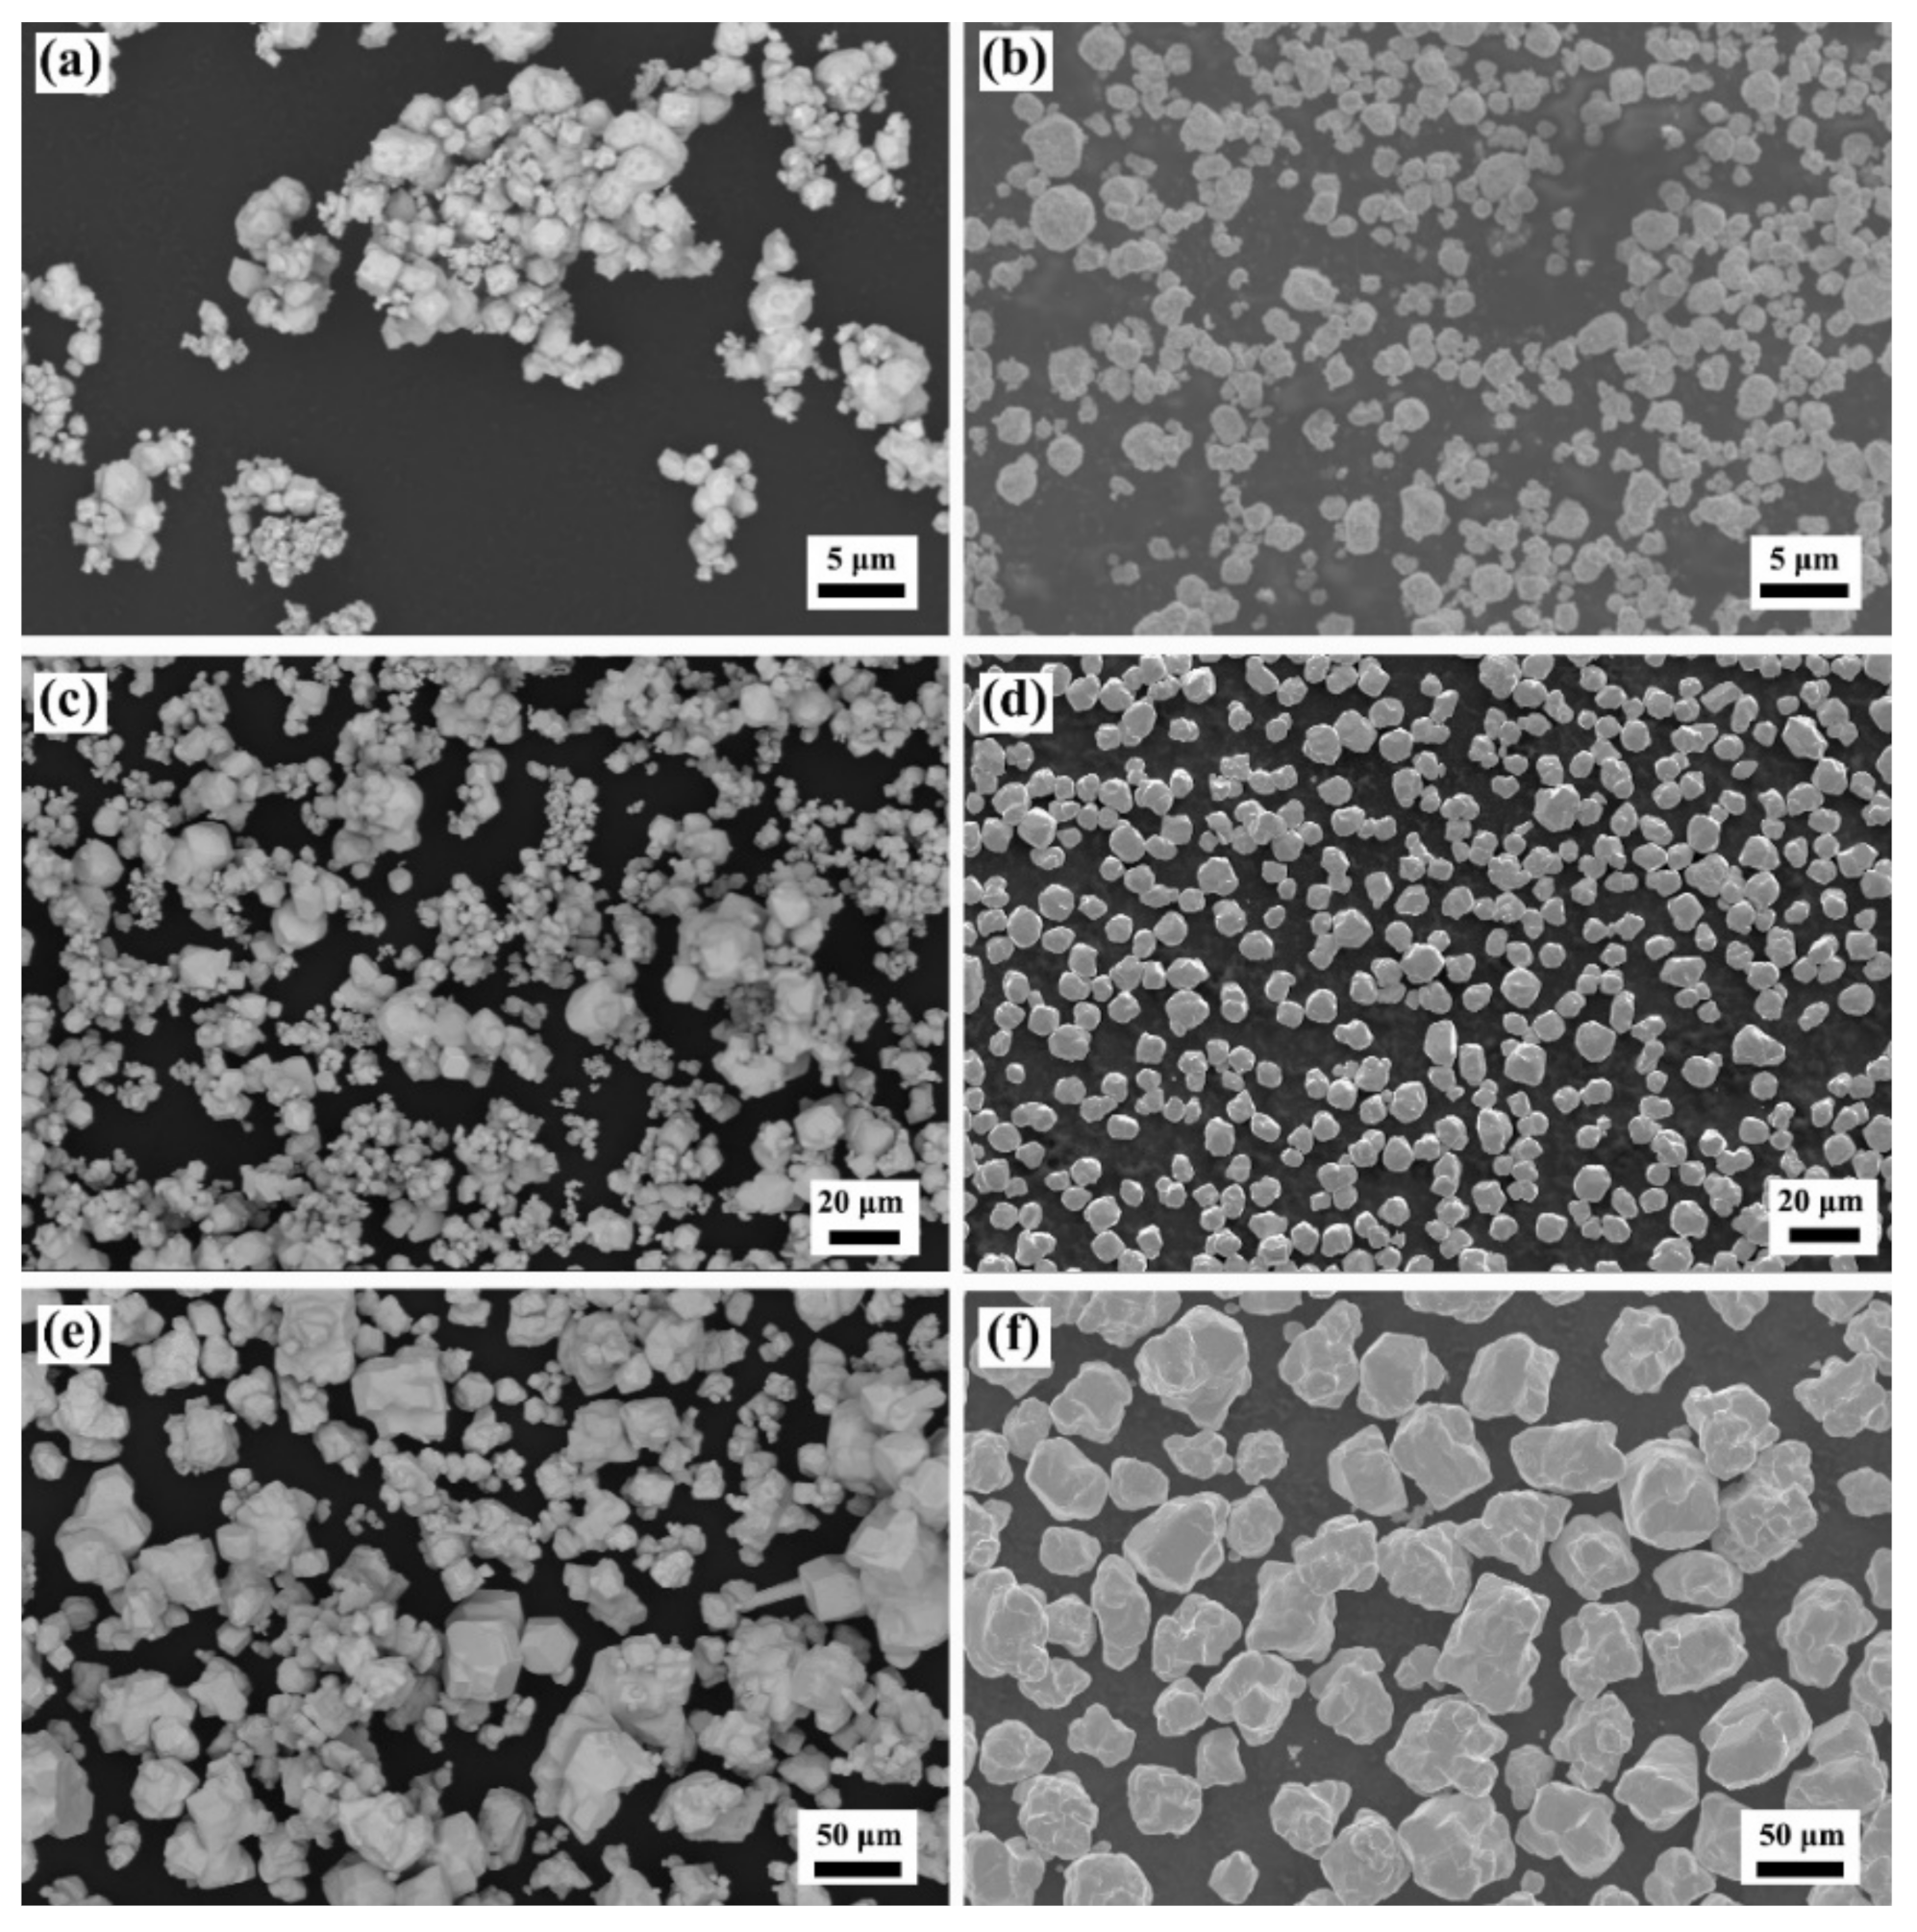
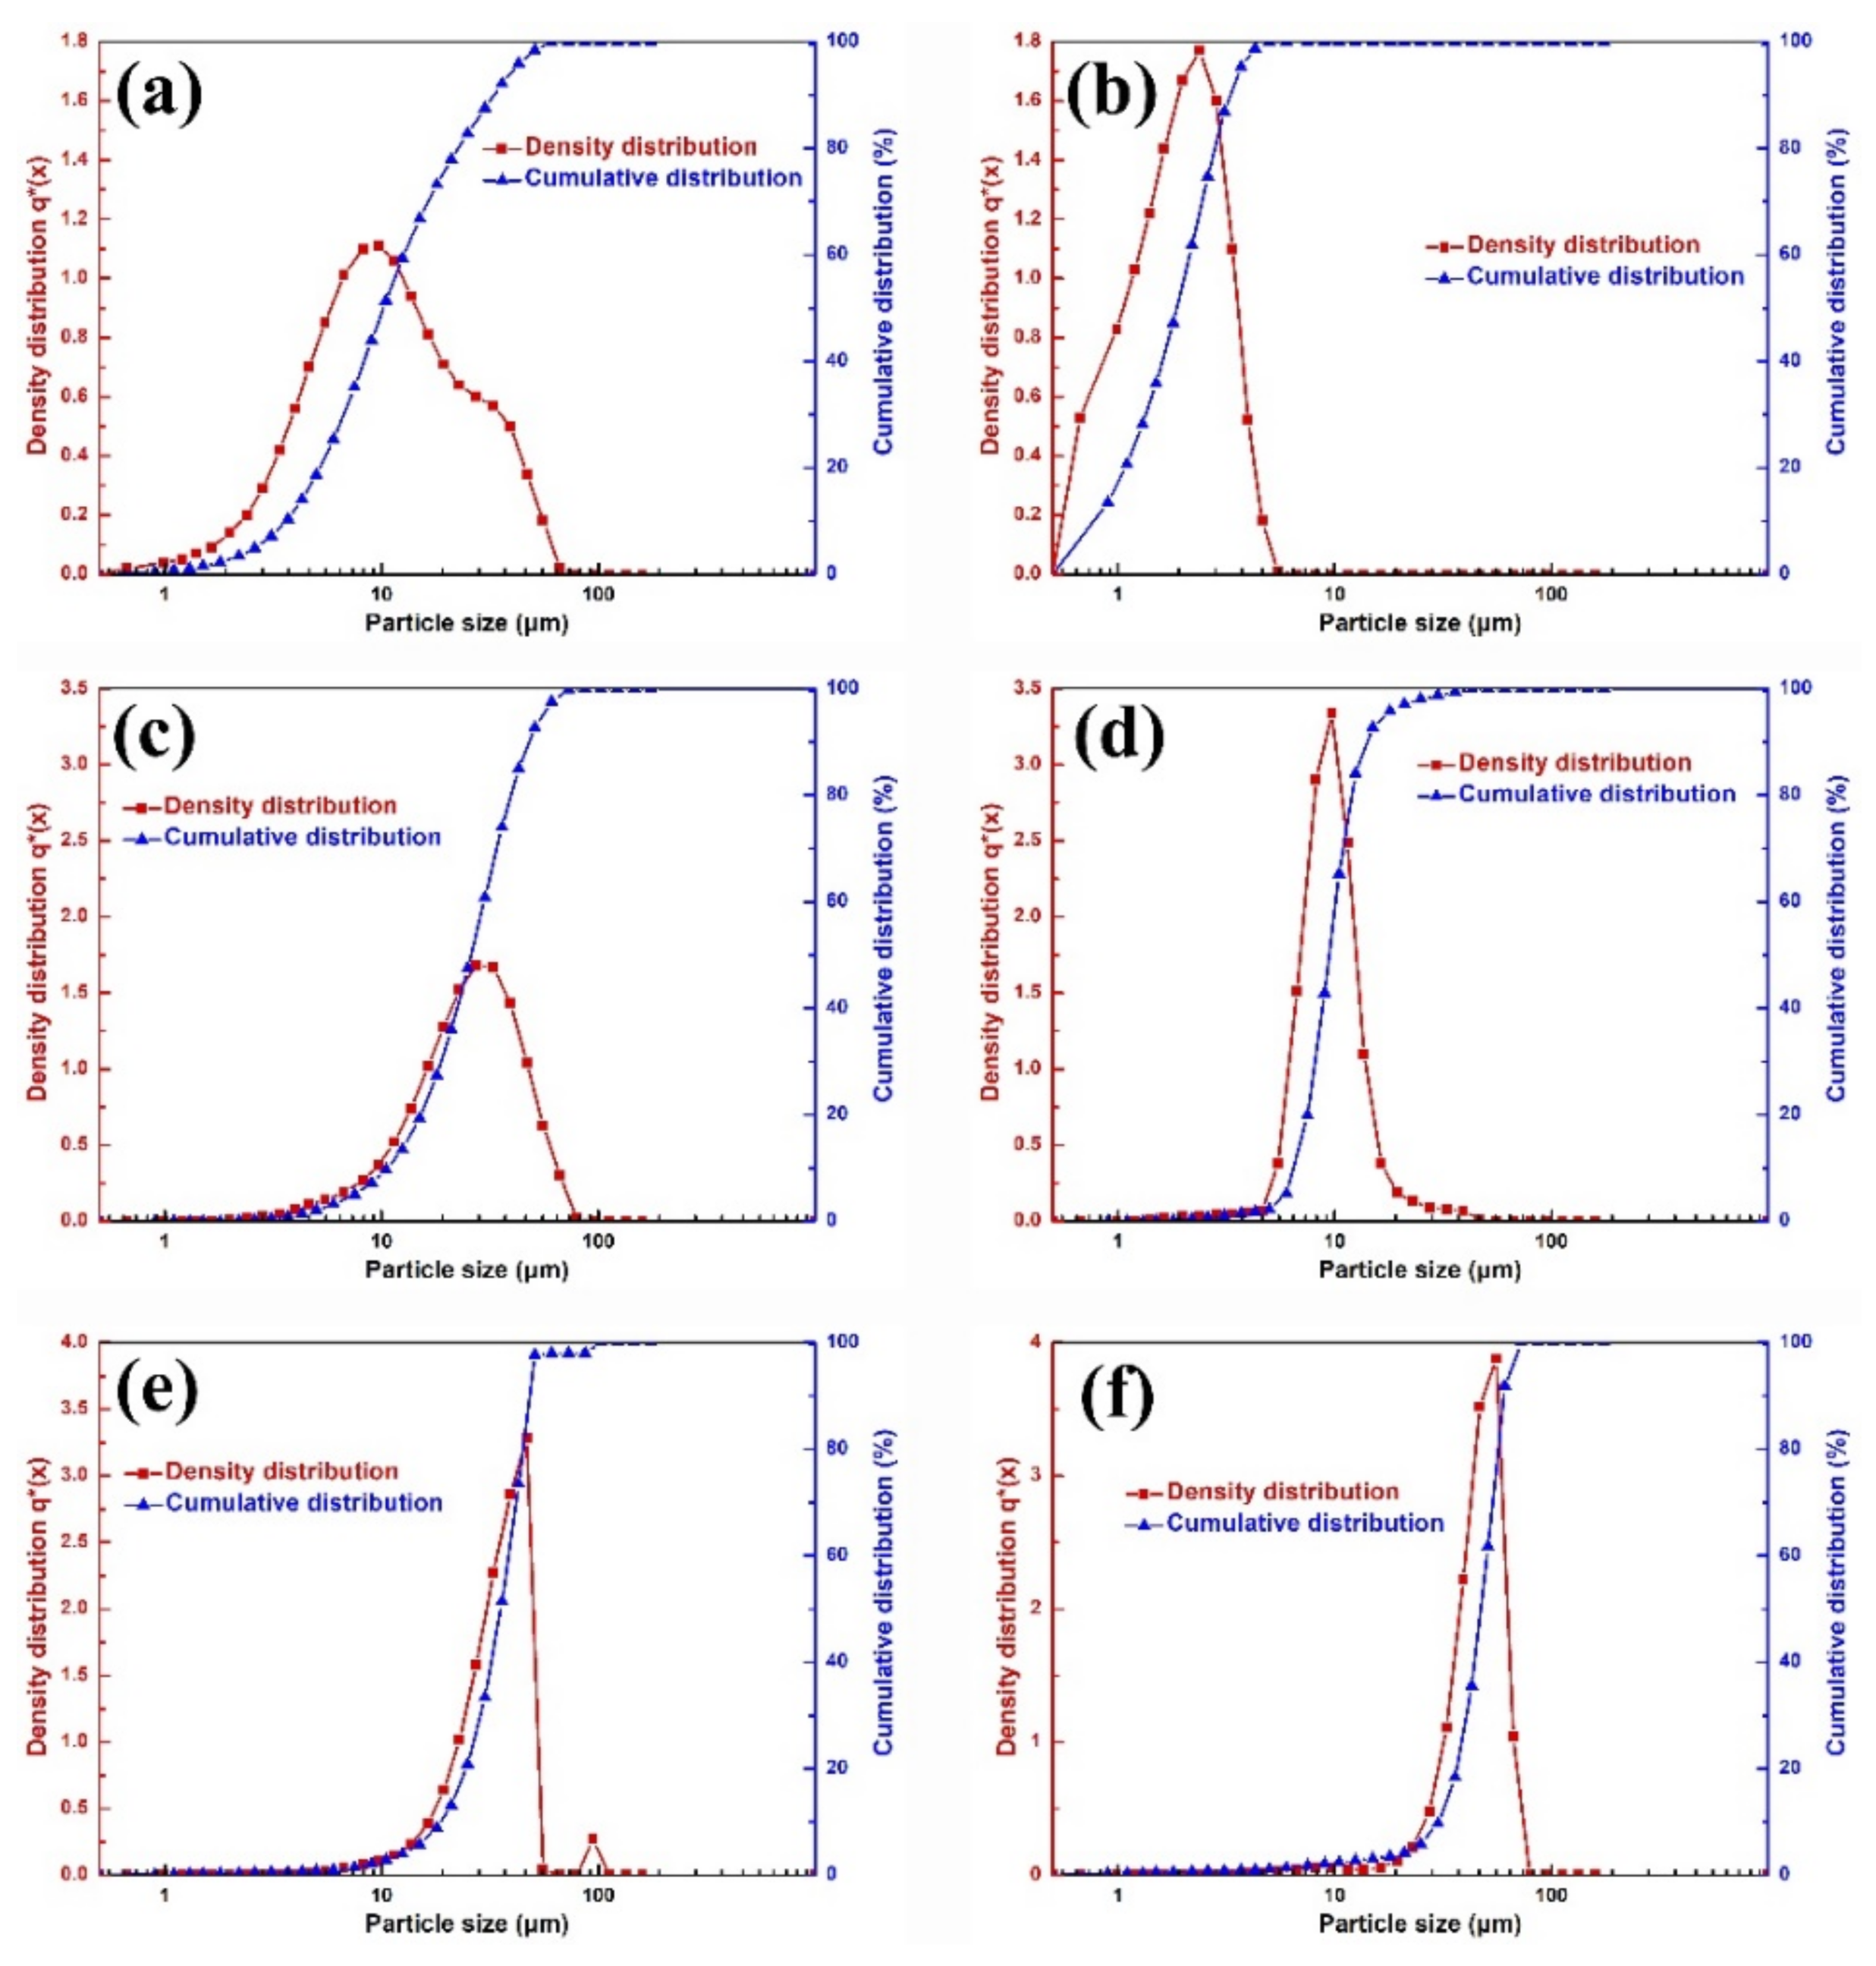
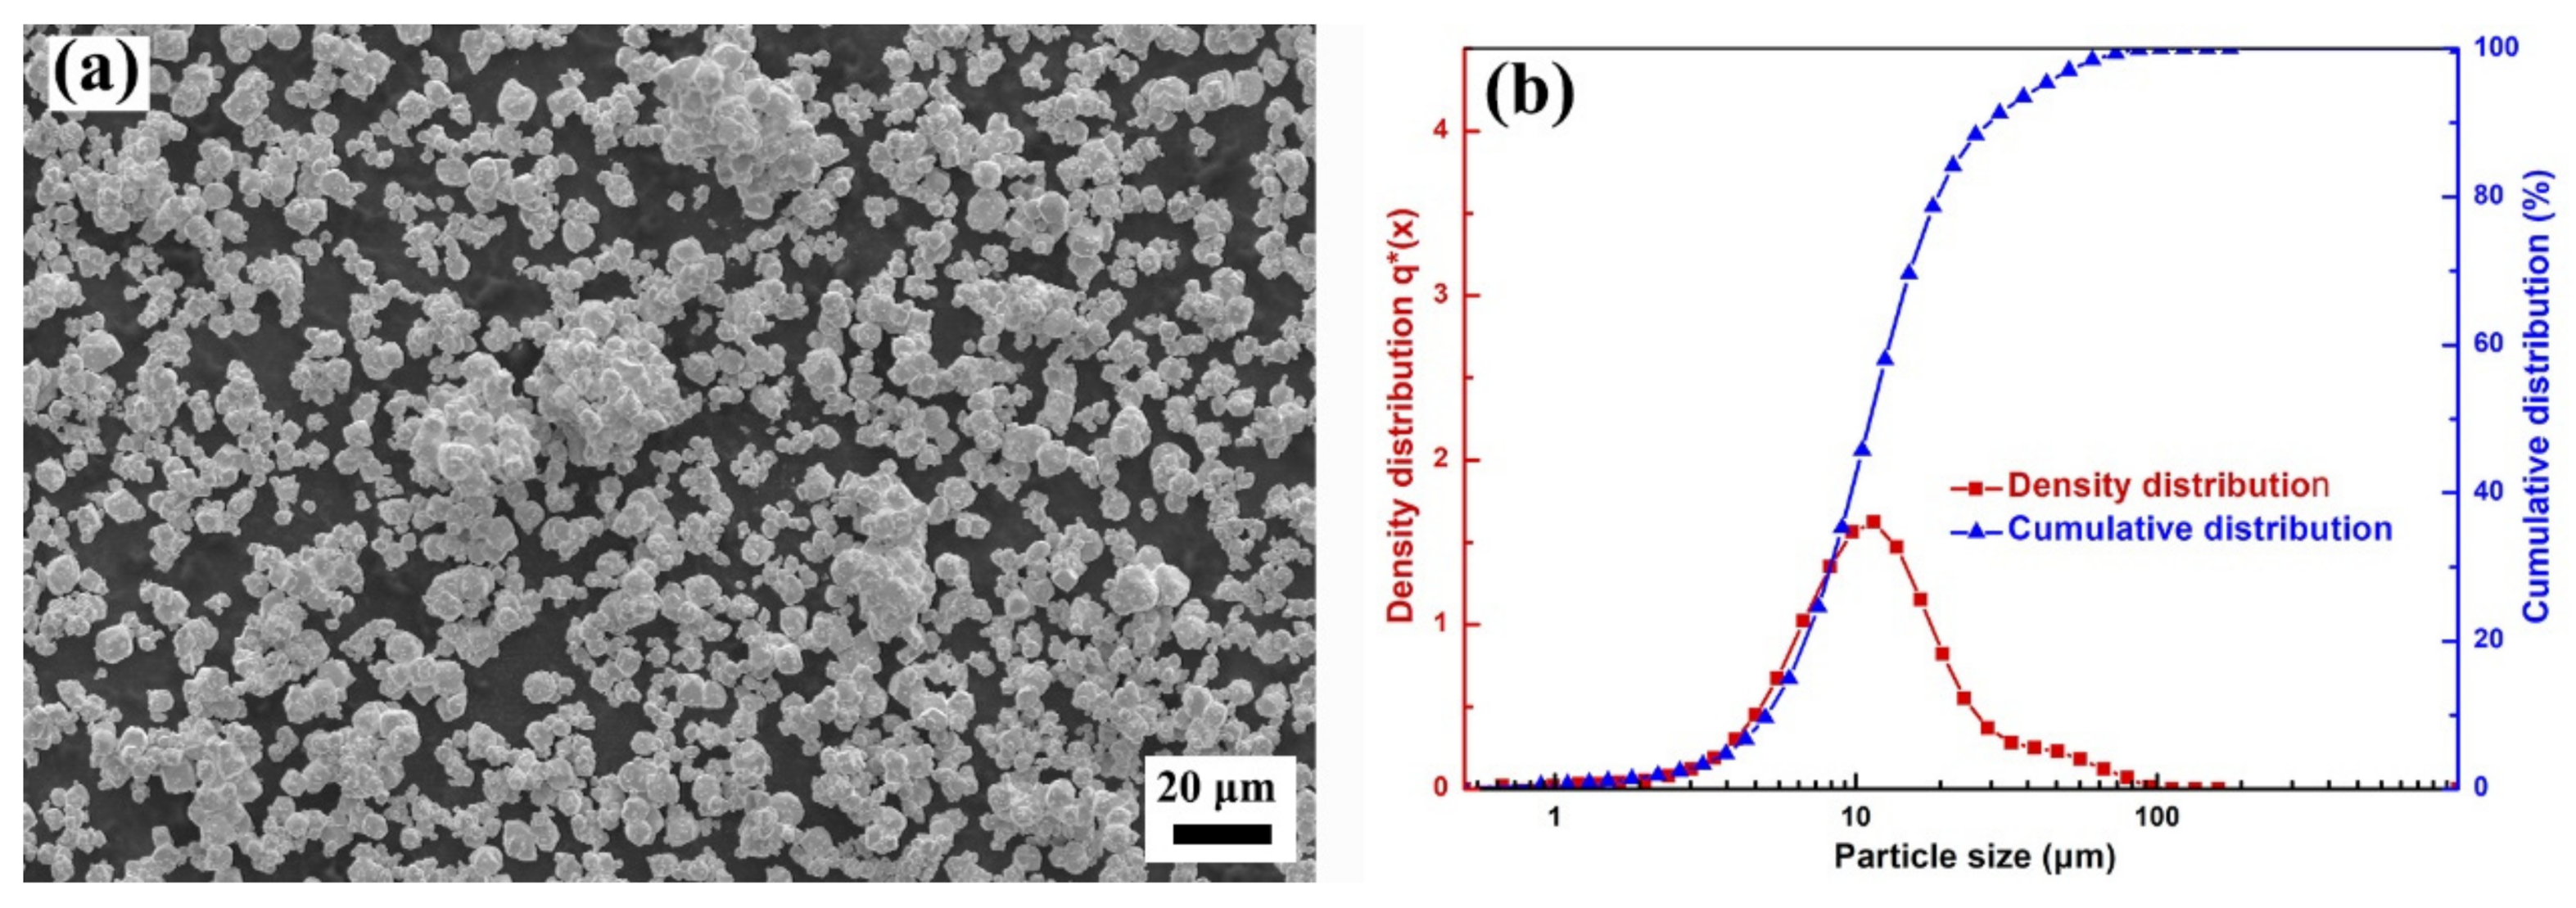
3.1. W Powder Treatment

| Sample | D10 (μm) | D50 (μm) | D90 (μm) | Ψ | Surface Mean Diameter (μm) | Volume Mean Diameter (μm) |
|---|---|---|---|---|---|---|
| WY–030 | 3.63 | 10.23 | 33.23 | 1.44 | 7.20 | 14.53 |
| WM–030 | 0.80 | 1.88 | 3.32 | 0.67 | 1.52 | 1.98 |
| WY–050 | 5.26 | 11.24 | 27.26 | 1.96 | 9.29 | 14.67 |
| WY–080 | 10.70 | 25.95 | 48.20 | 0.72 | 19.24 | 27.93 |
| WM–080 | 6.49 | 9.48 | 14.21 | 0.41 | 8.94 | 10.30 |
| WY–200 | 18.78 | 35.53 | 48.45 | 0.42 | 26.33 | 35.24 |
| WM–200 | 30.22 | 47.41 | 60.38 | 0.32 | 31.07 | 46.12 |
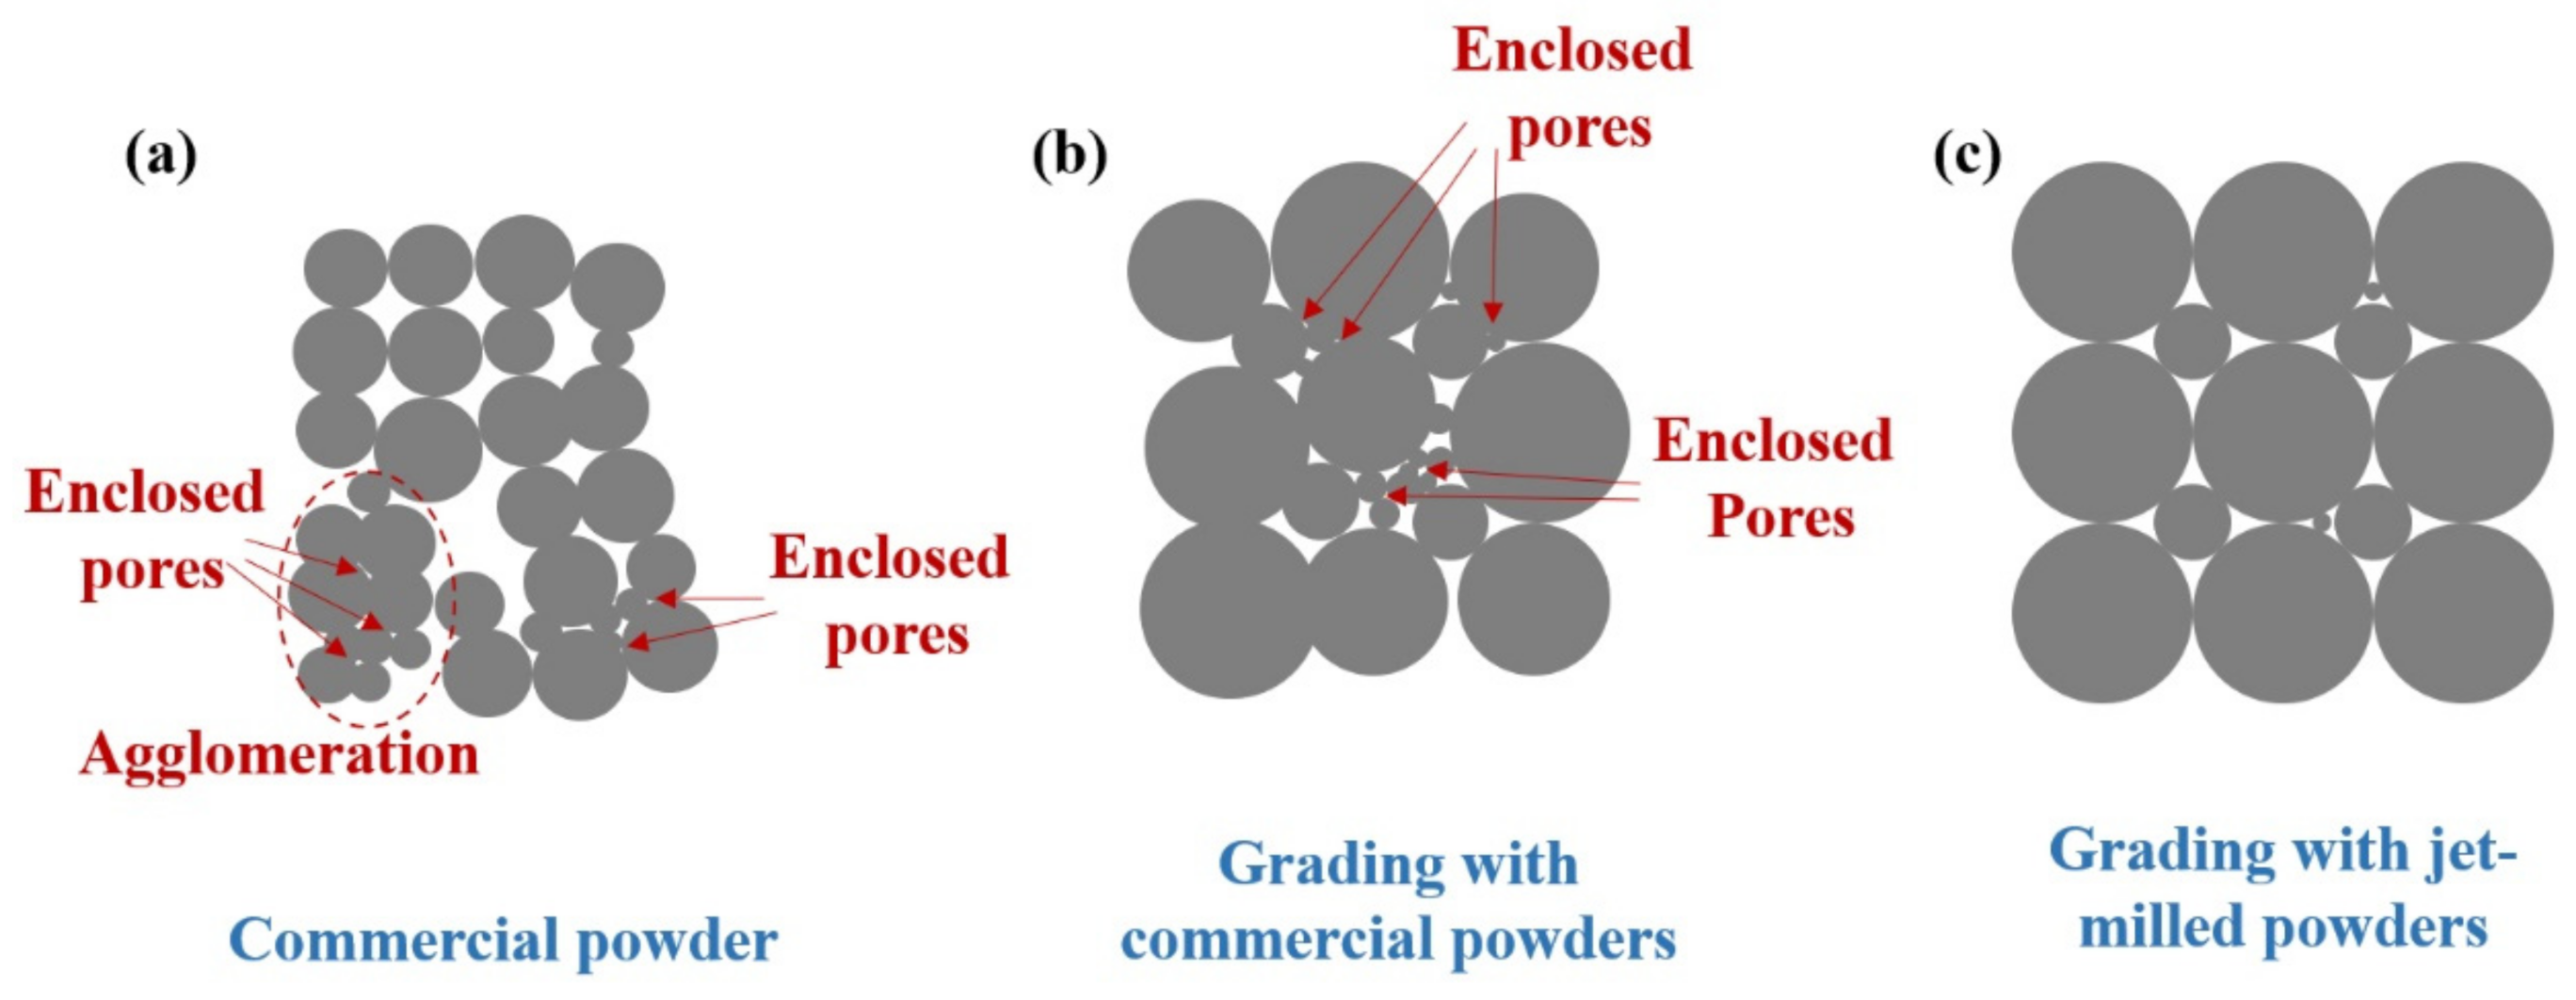
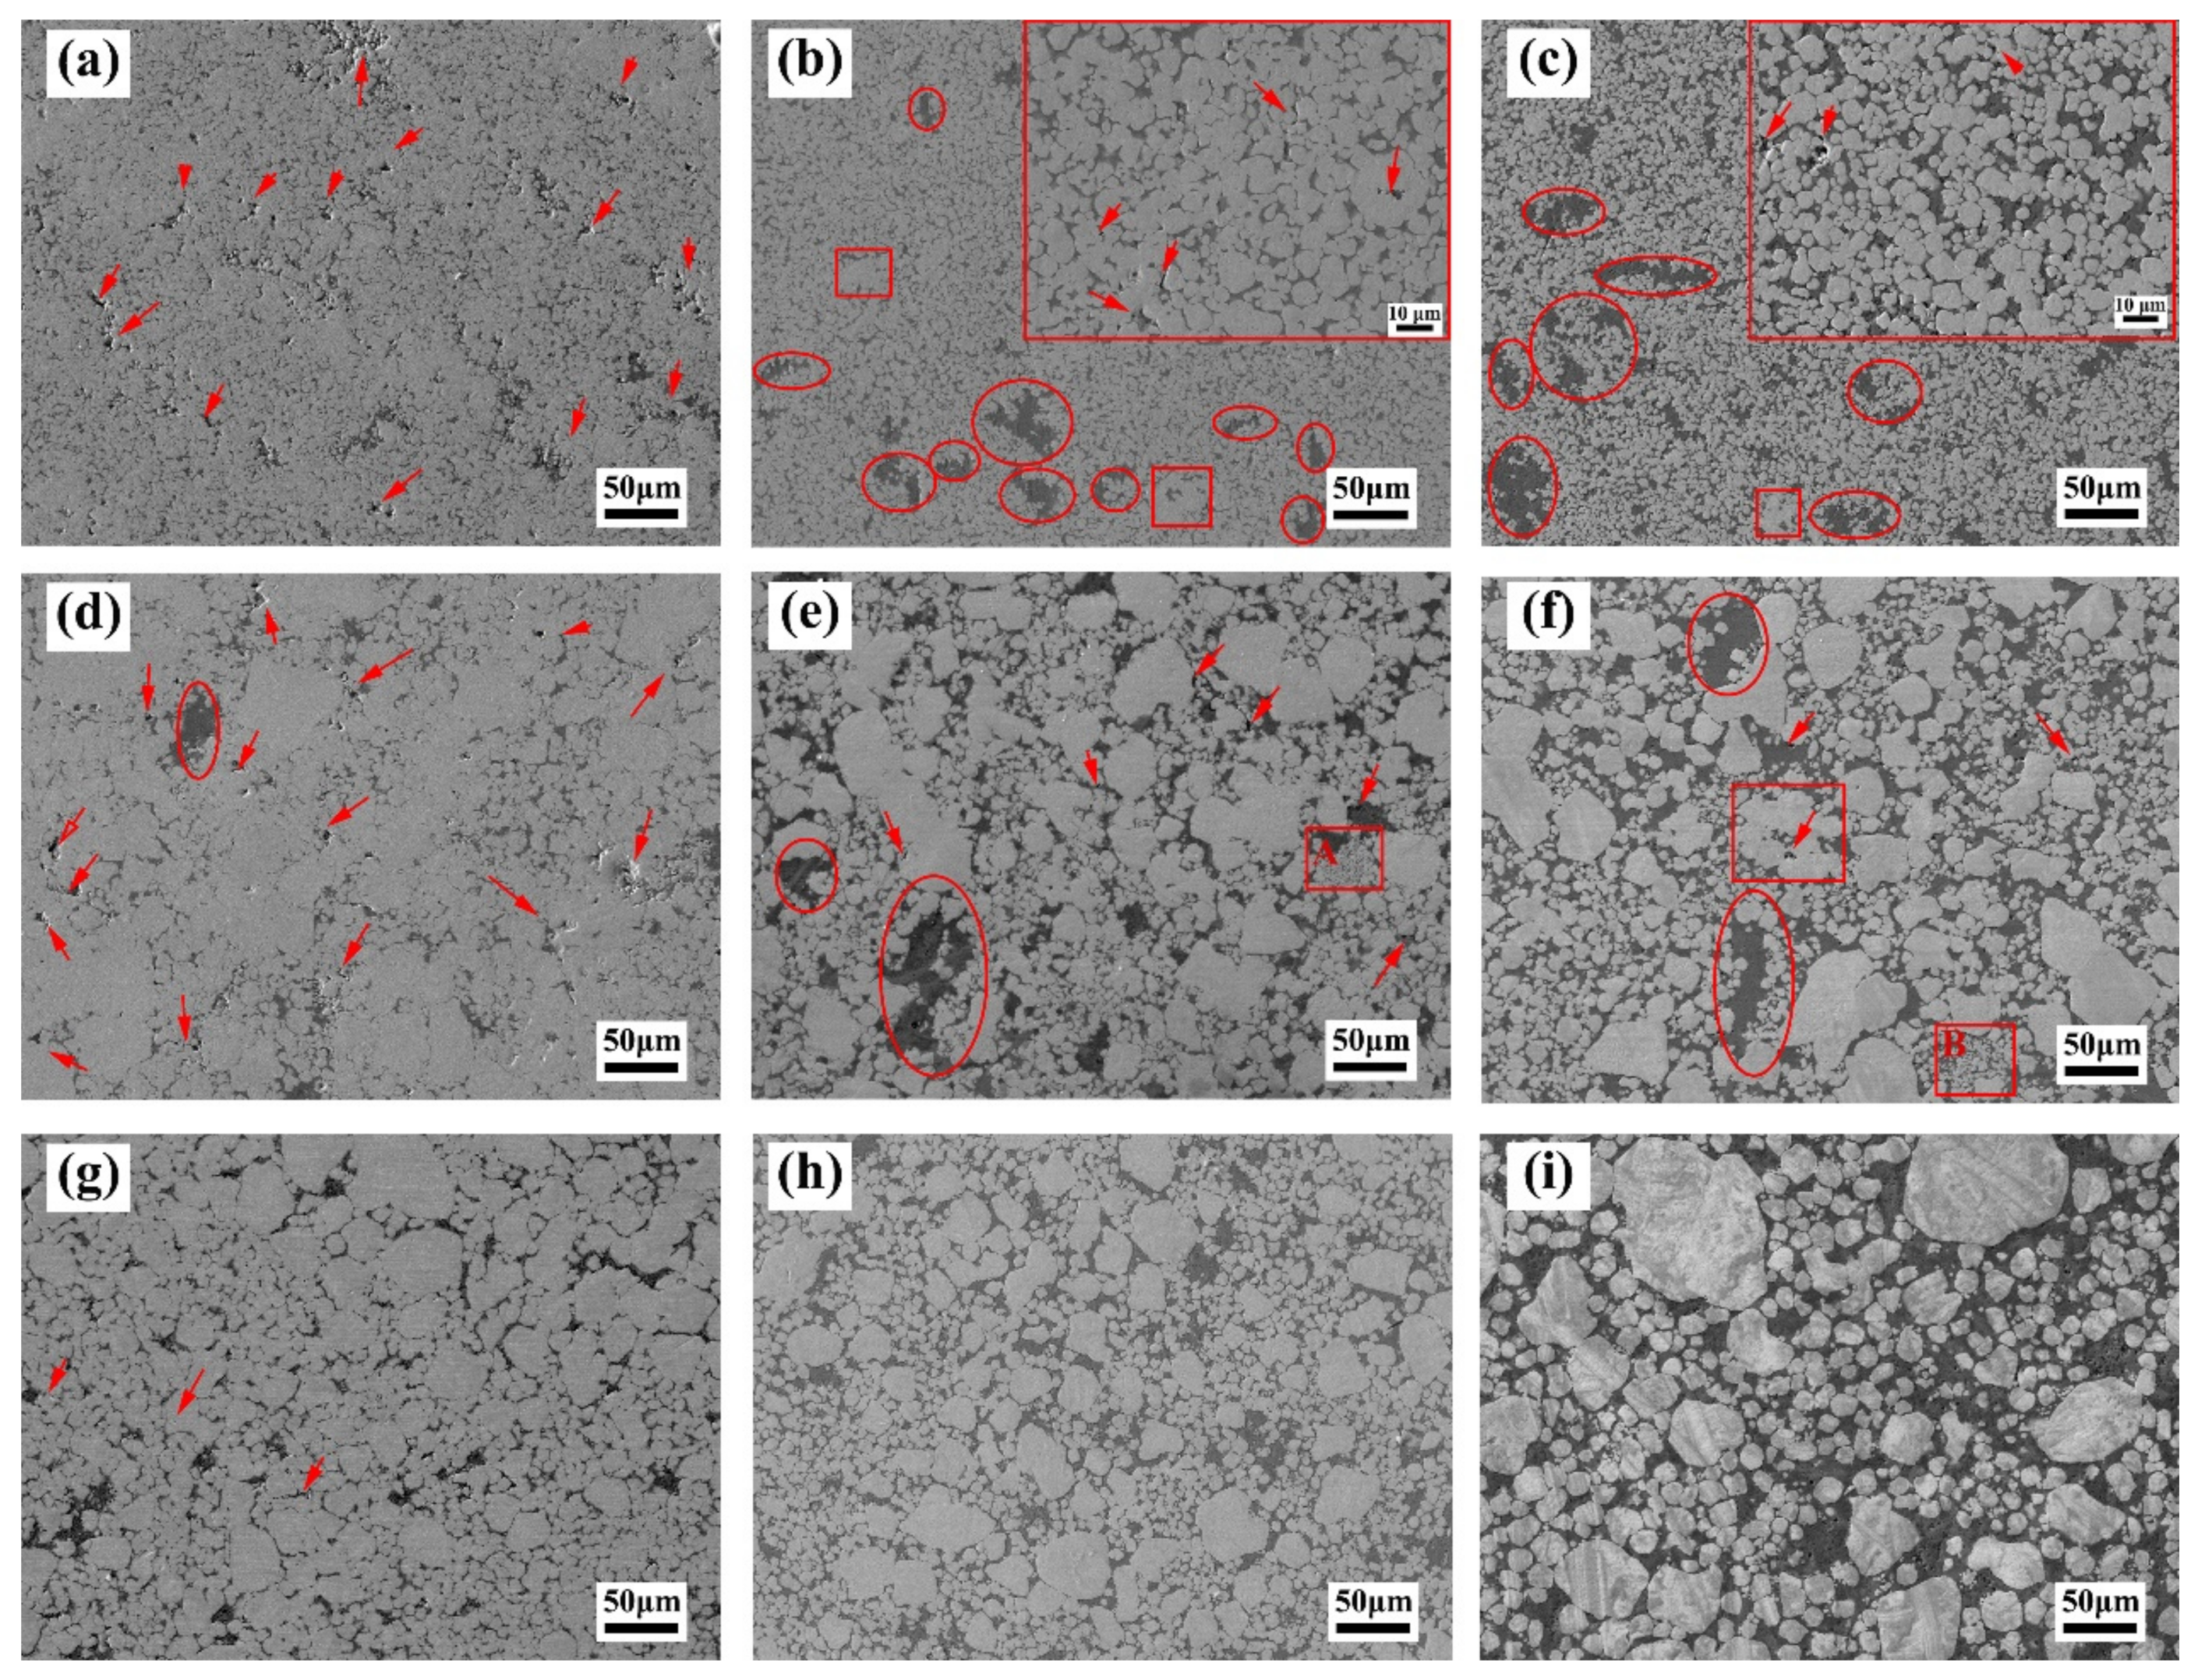
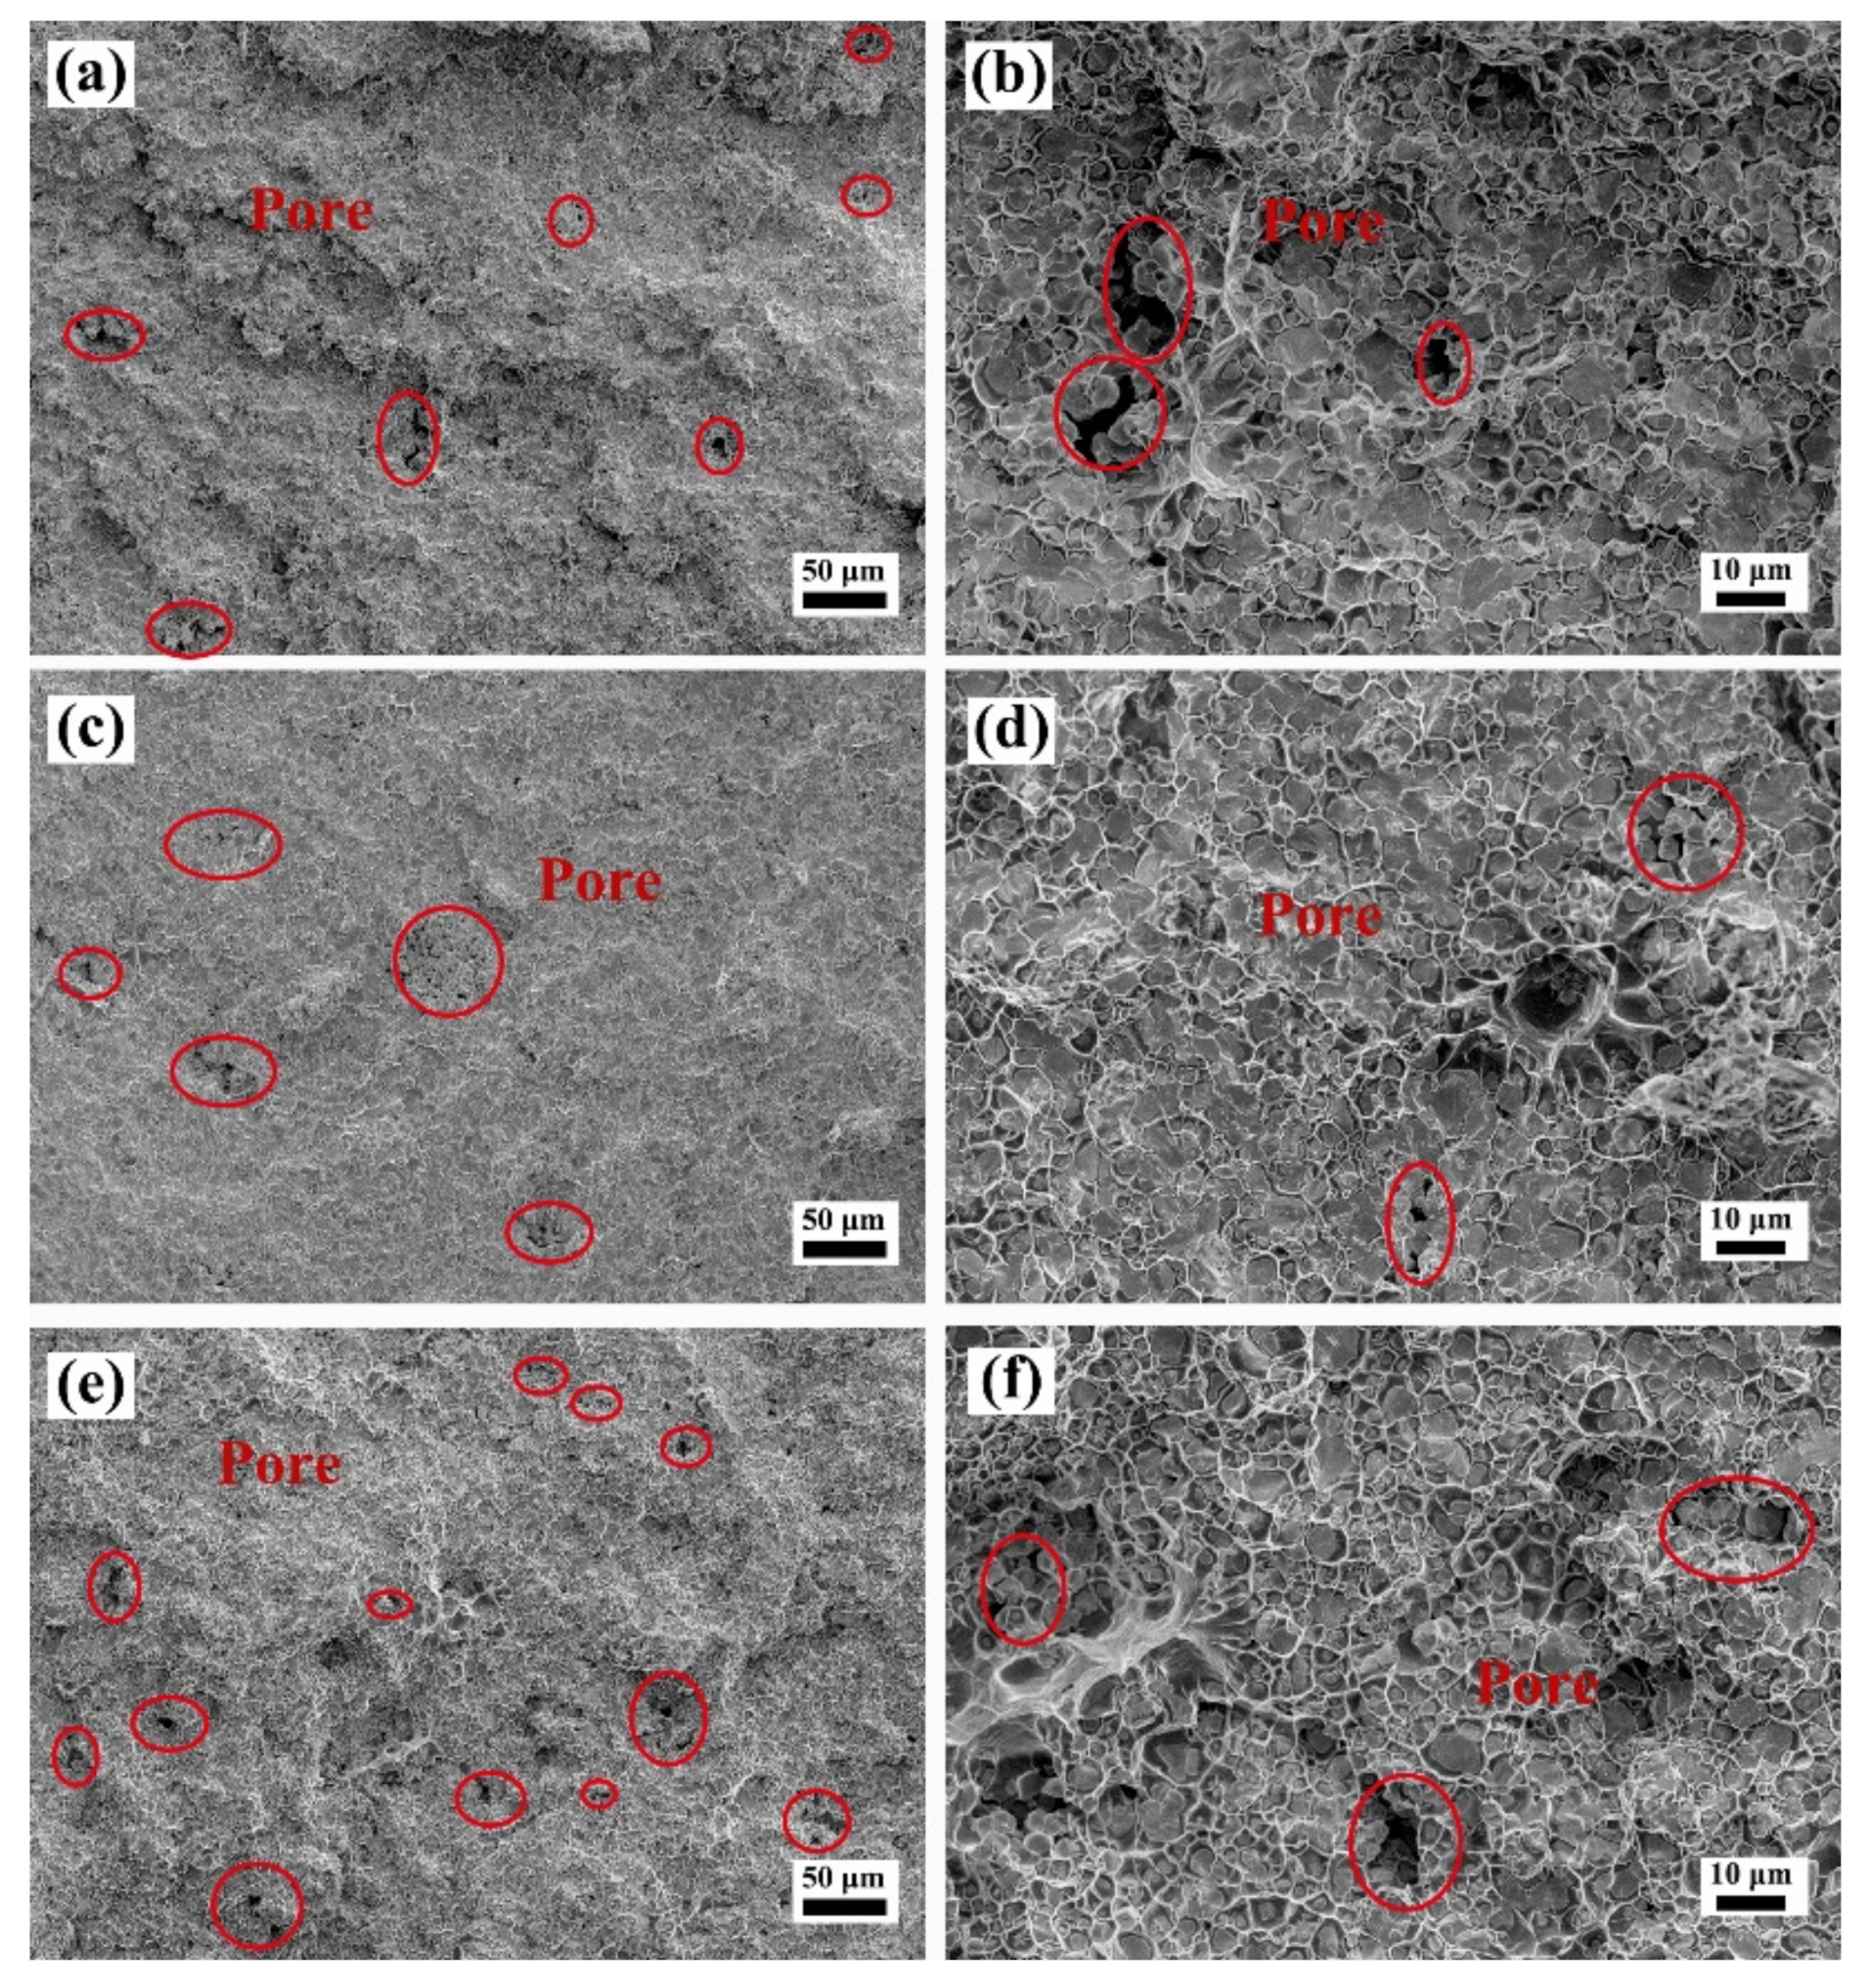
3.2. Microstructure

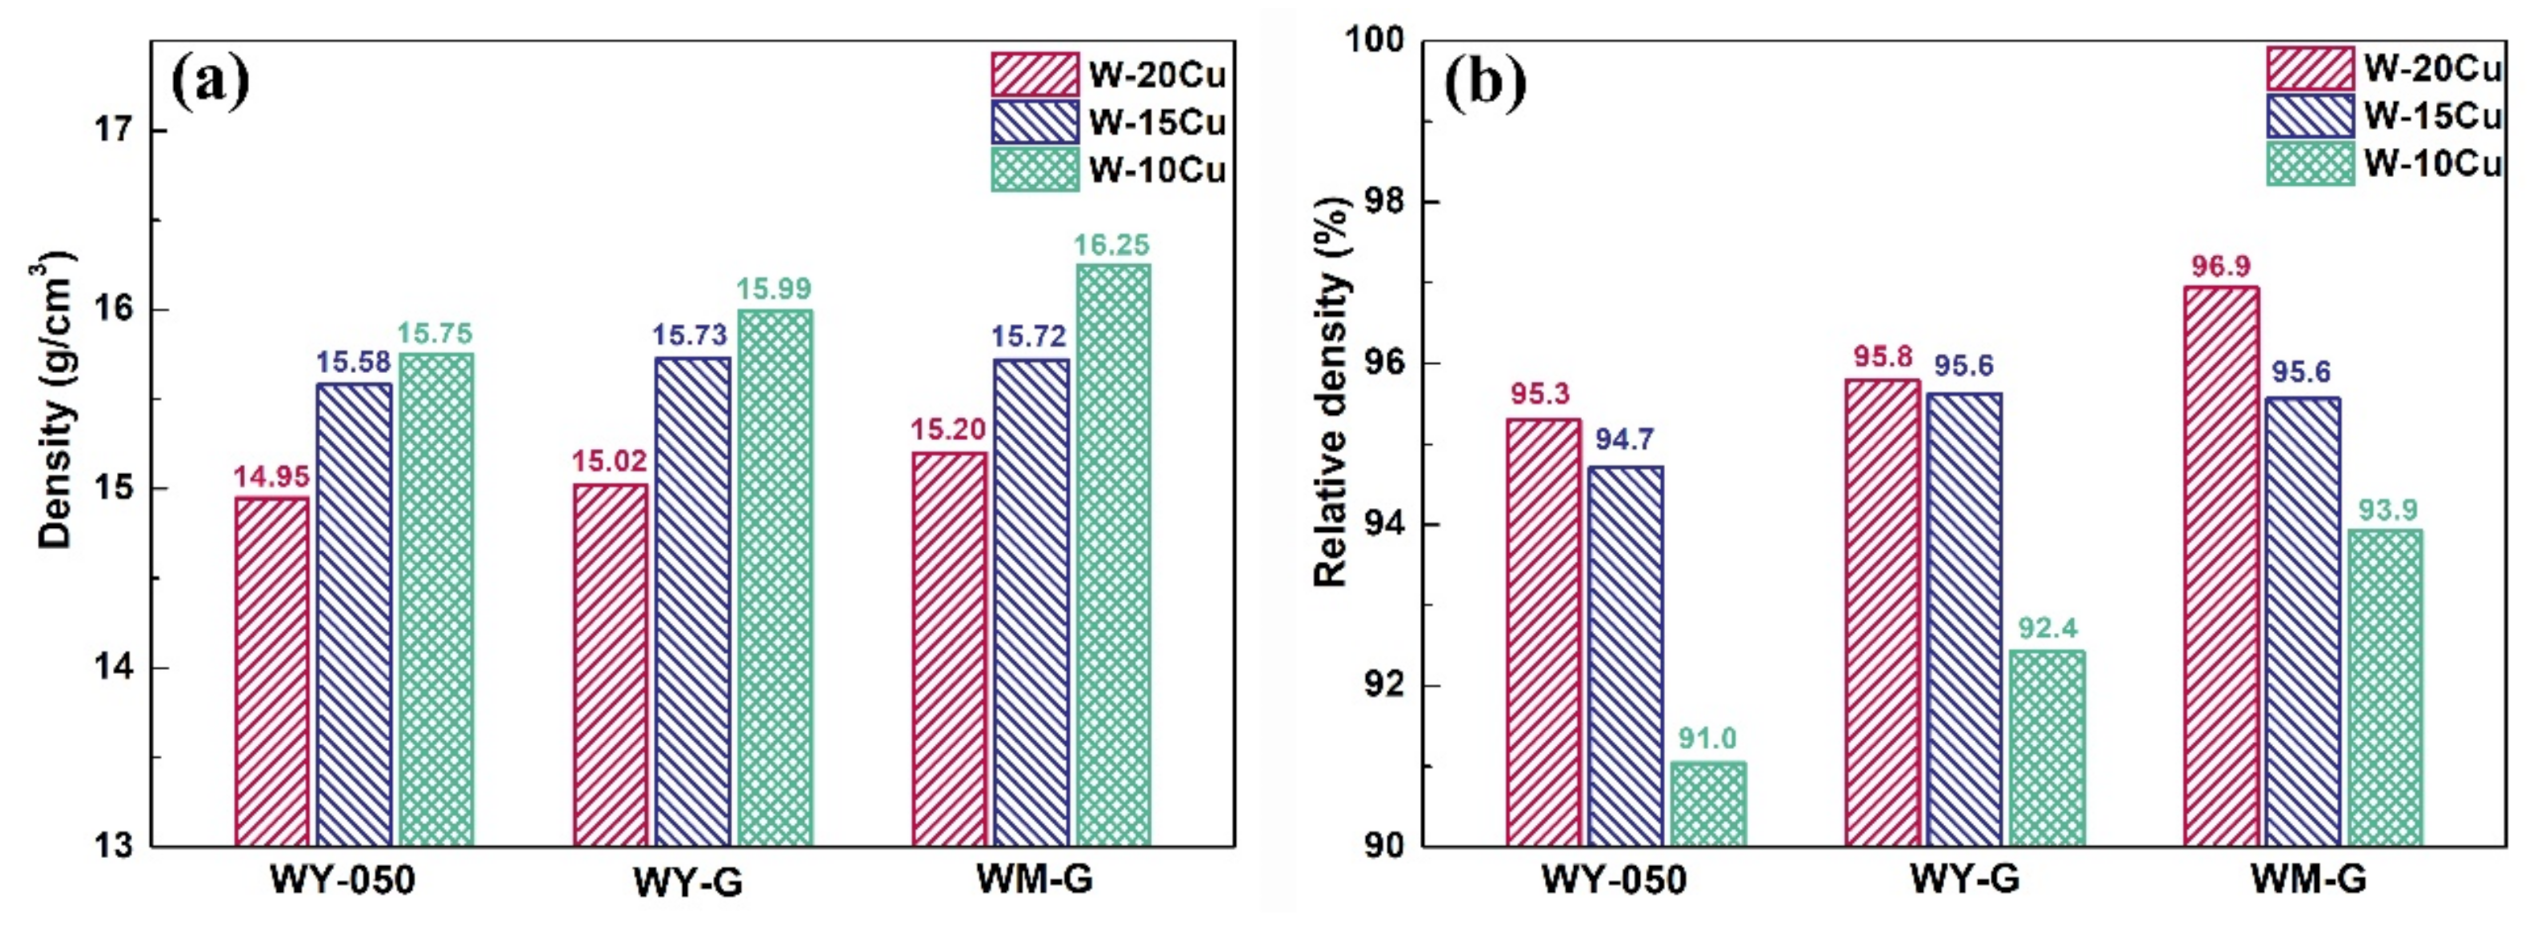
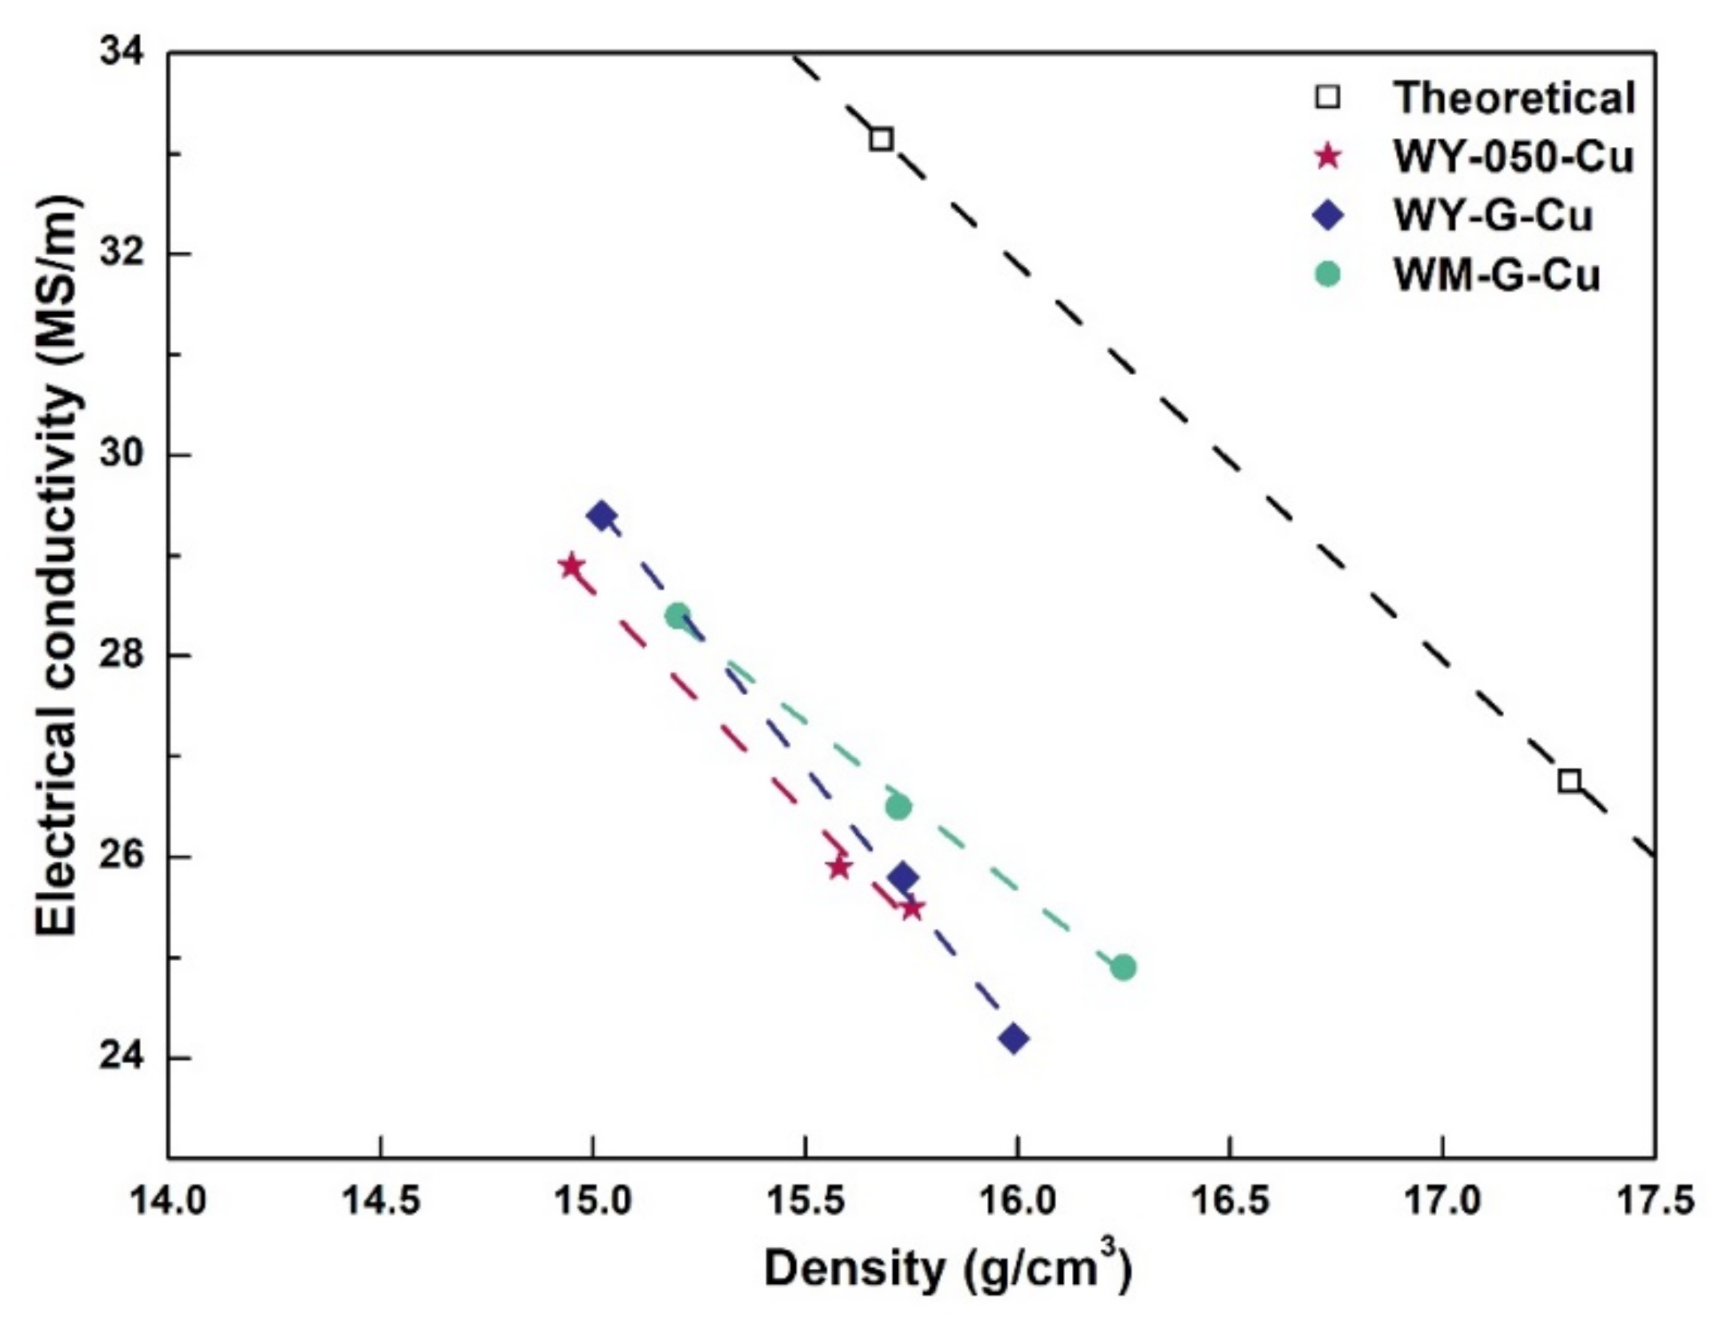
3.3. Physical Properties
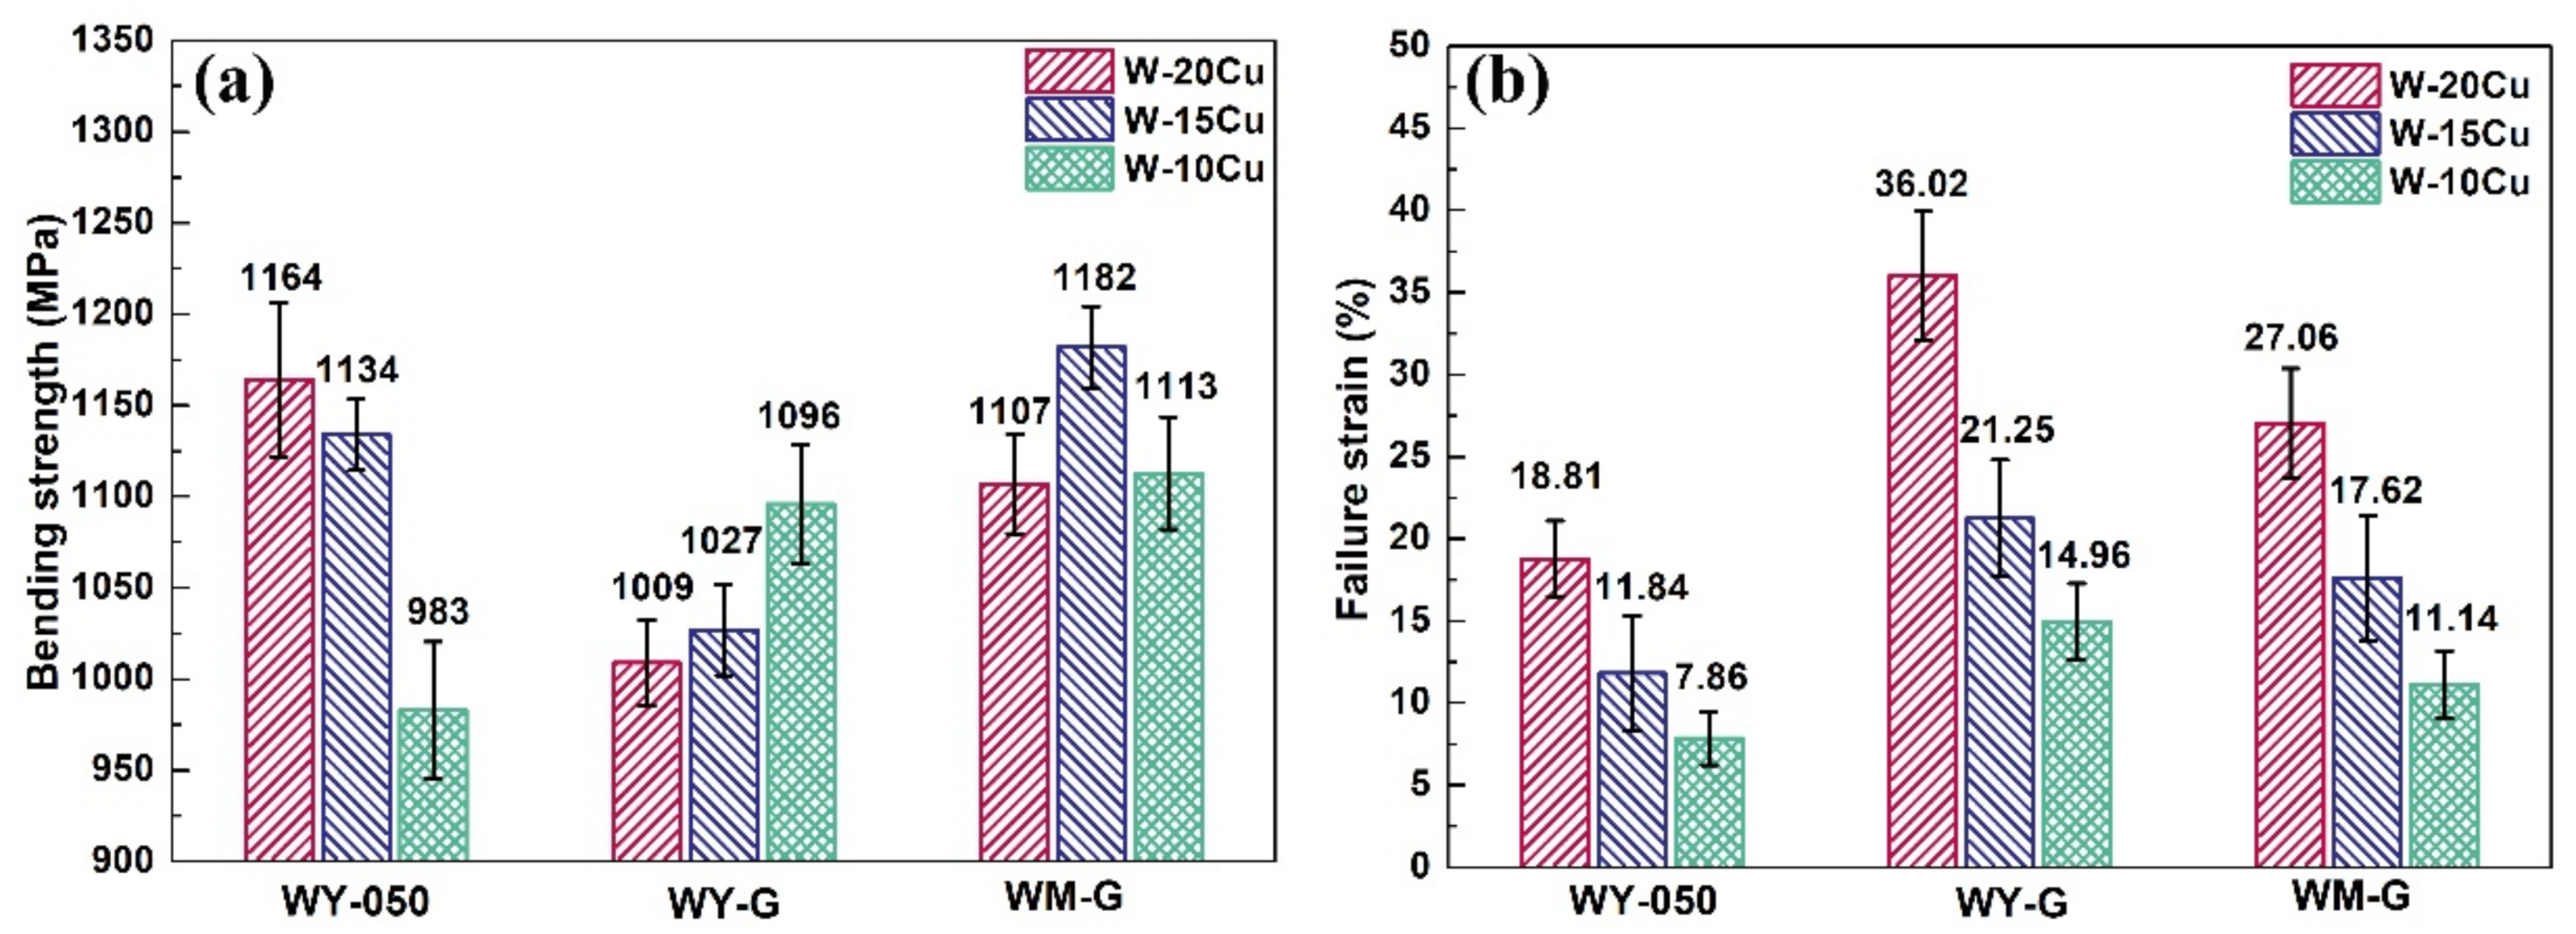
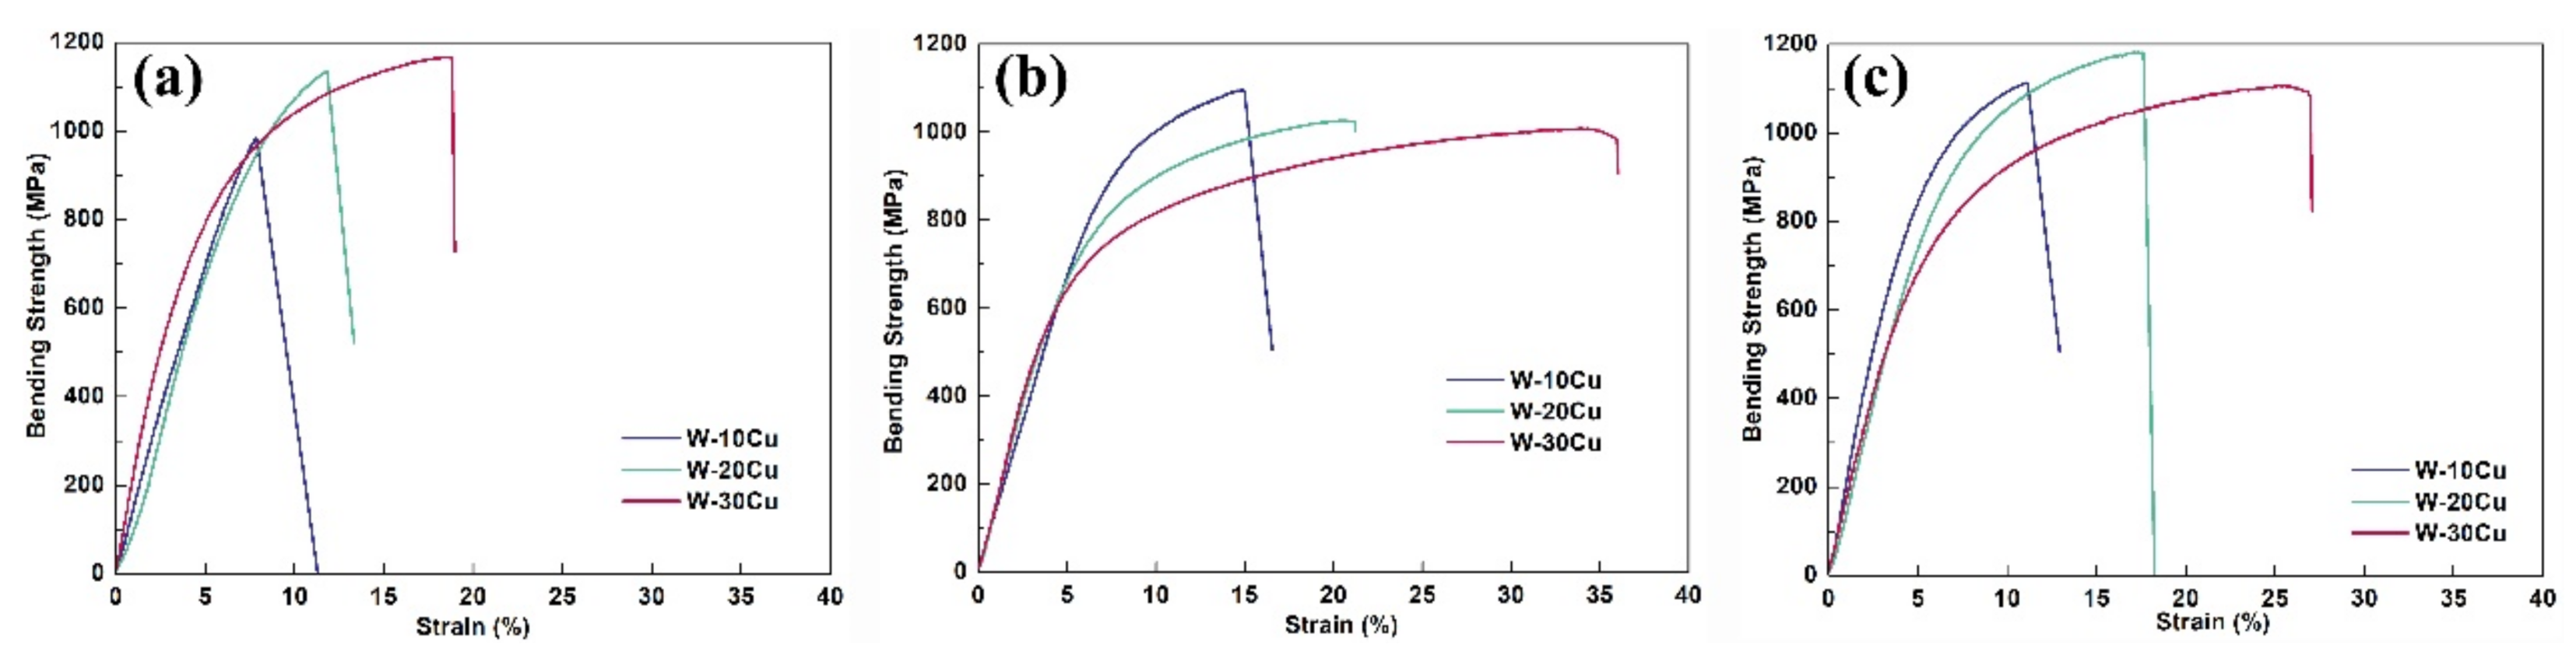
3.4. Mechanical Properties
4. Discussion
5. Conclusions
- Rounded W powders with narrow particle size distribution are obtained by jet-milling.
- W–Cu composites prepared with graded powder have higher density. W–Cu composite with a high density of 16.25 g/cm3 can be directly obtained by conventional compacting at a low pressure of 300 MPa and following infiltration using graded W powders, which are treated through jet-milling.
- There are few pores in WM–G–10Cu composite, but a large number of pores in WY–050–10Cu and WY–G–10Cu composites. The WM–G–Cu composites have the best comprehensive performance.
- WM–G powder is more suitable for preparing W–Cu composites with a high W content and more likely to be used to obtain large W–Cu composites.
Author Contributions
Funding
Institutional Review Board Statement
Informed Consent Statement
Data Availability Statement
Conflicts of Interest
References
- Hou, C.; Song, X.; Tang, F.; Li, Y.; Cao, L.; Wang, J.; Nie, Z. W–Cu composites with submicron- and nanostructures: Progress and challenges. NPG Asia Mater. 2019, 11, 74. [Google Scholar] [CrossRef]
- Zhang, Q.; Liang, S.; Hou, B.; Zhuo, L. The effect of submicron-sized initial tungsten powders on microstructure and properties of infiltrated W-25 wt% Cu alloys. Int. J. Refract. Met. Hard Mater. 2016, 59, 87–92. [Google Scholar] [CrossRef]
- Zhao, Z.; Liu, J.; Guo, W.; Li, S.; Wang, G. Effect of Zn and Ni added in W–Cu alloy on penetration performance and penetration mechanism of shaped charge liner. Int. J. Refract. Met. Hard Mater. 2016, 54, 90–97. [Google Scholar] [CrossRef]
- Mikó, T.; Kristály, F.; Pethő, D.; Svéda, M.; Karacs, G.; Gergely, G.; Gácsi, Z.; Roósz, A. Investigation of nanocrystalline sintered W-25 wt% Cu composite. Int. J. Refract. Met. Hard Mater. 2021, 95, 105438. [Google Scholar] [CrossRef]
- Zhang, L.; Chen, W.; Luo, G.; Chen, P.; Shen, Q.; Wang, C. Low-temperature densification and excellent thermal properties of W–Cu thermal-management composites prepared from copper-coated tungsten powders. J. Alloys Compd. 2014, 588, 49–52. [Google Scholar] [CrossRef]
- Wei, B.; Yu, X.; Chen, R.; Chen, P.; Cheng, J. A novel approach to fabricate W–Cu functionally graded materials via sedimentation and infiltration method. Mater. Sci. Eng. A 2021, 816, 141276. [Google Scholar] [CrossRef]
- Borji, S.; Ahangarkani, M.; Zangeneh-Madar, K.; Valefi, Z. The effect of sintering activator on the erosion behavior of infiltrated W-10 wt% Cu composite. Int. J. Refract. Met. Hard Mater. 2017, 66, 150–157. [Google Scholar] [CrossRef]
- Zhang, Q.; Liang, S.; Zhuo, L. Ultrafine-grained W–25 wt% Cu composite with superior high-temperature characteristics. Mater. Sci. Technol. 2017, 33, 2071–2077. [Google Scholar] [CrossRef]
- Ahangarkani, M.; Zangeneh-Madar, K.; Borji, S. Microstructural study on the effect of directional infiltration and Ni activator on tensile strength and conductivity of W-10 wt% Cu composite. Int. J. Refract. Met. Hard Mater. 2018, 71, 340–351. [Google Scholar] [CrossRef]
- Li, J.; Deng, N.; Wu, P.; Zhou, Z. Elaborating the Cu-network structured of the W–Cu composites by sintering intermittently electroplated core-shell powders. J. Alloys Compd. 2019, 770, 405–410. [Google Scholar] [CrossRef]
- Luo, C.; Wang, Y.; Xu, J.; Xu, G.; Yan, Z.; Li, J.; Li, H.; Lu, H.; Suo, J. The activated sintering of W Cu composites through spark plasma sintering. Int. J. Refract. Met. Hard Mater. 2019, 81, 27–35. [Google Scholar] [CrossRef]
- Zhu, X.; Cheng, J.; Chen, P.; Wei, B.; Gao, Y.; Gao, D. Preparation and characterization of nanosized W-Cu powders by a novel solution combustion and hydrogen reduction method. J. Alloys Compd. 2019, 793, 352–359. [Google Scholar] [CrossRef]
- Li, X.; Hu, P.; Wang, J.; Chen, S.; Zhou, W. In situ synthesis of core-shell W-Cu nanopowders for fabricating full-densified and fine-grained alloys with dramatically improved performance. J. Alloys Compd. 2021, 853, 156958. [Google Scholar] [CrossRef]
- Pillari, L.K.; Bakshi, S.R.; Chaudhuri, P.; Murty, B.S. Fabrication of W-Cu functionally graded composites using high energy ball milling and spark plasma sintering for plasma facing components. Adv. Powder Technol. 2020, 31, 3657–3666. [Google Scholar] [CrossRef]
- Wang, X.; Wei, S.; Xu, L.; Li, J.; Li, X.; Shan, K. Preparation of w–cu nano-composite powders with high copper content using a chemical co-deposition technique. Adv. Powder Technol. 2018, 29, 1323–1330. [Google Scholar] [CrossRef]
- Zhou, Q.; Chen, P. Characterization of fine-grained W–10 wt% Cu composite fabricated by hot-shock consolidation. Int. J. Refract. Met. Hard Mater. 2015, 52, 137–142. [Google Scholar] [CrossRef]
- Liu, J.-K.; Zhang, G.-H.; Sun, G.-D. Preparation of Ultrafine W-10 Wt Pct Cu Composite Powders and Their Corresponding Sintered Compacts. Metall. Mater. Trans. A 2019, 50, 4827–4838. [Google Scholar] [CrossRef]
- German, R.M. Prediction of sintered density for bimodal powder mixtures. Metall. Trans. A 1992, 23, 1455–1465. [Google Scholar] [CrossRef]
- Zou, J.; Song, D.; Shi, H.; Liang, S. Effects of grading tungsten powders on properties of CuW alloy. Mater. Res. Express 2020, 7, 026528. [Google Scholar] [CrossRef]
- Li, R.; Qin, M.; Liu, C.; Huang, H.; Lu, H.; Chen, P.; Qu, X. Injection molding of tungsten powder treated by jet mill with high powder loading: A solution for fabrication of dense tungsten component at relative low temperature. Int. J. Refract. Met. Hard Mater. 2017, 62, 42–46. [Google Scholar] [CrossRef]
- Sun, Y.-L.; Liu, Q.-C.; Huang, X.; Zhang, F.-X.; Yang, J.; Mei, H. Effect of jet milling on micro-strain behavior and rupture behavior of agglomerates of ultrafine WC powders. Trans. Nonferrous Met. Soc. China 2019, 29, 2128–2140. [Google Scholar] [CrossRef]
- Ouyang, M.; Xu, L.; Zhang, Q.; Wang, C.; Wang, C.; Zhang, H.; Liu, X. Effects of jet milling on W–10 wt% Cu composite powder for injection molding. J. Mater. Res. Technol. 2020, 9, 8535–8543. [Google Scholar] [CrossRef]
- Hosokawa, A.; Yamaguchi, W.; Suzuki, K.; Takagi, K. Influences of microstructure on macroscopic crystallinity and magnetic properties of Sm-Fe-N fine powder produced by jet-milling. J. Alloys Compd. 2021, 869, 159288. [Google Scholar] [CrossRef]
- Li, R.; Qin, M.; Huang, H.; Liu, C.; Chen, Z.; Huang, M.; Zhang, L.; Qu, X. Fabrication of fine-grained spherical tungsten powder by radio frequency (RF) inductively coupled plasma spheroidization combined with jet milling. Adv. Powder Technol. 2017, 28, 3158–3163. [Google Scholar] [CrossRef]
- Li, R.; Qin, M.; Liu, C.; Chen, Z.; Wang, X.; Qu, X. Particle size distribution control and related properties improvements of tungsten powders by fluidized bed jet milling. Adv. Powder Technol. 2017, 28, 1603–1610. [Google Scholar] [CrossRef]
- German, R.M. A model for the thermal properties. Metall. Trans. A 1993, 24, 1745–1752. [Google Scholar] [CrossRef]
- Ahangarkani, M.; Zangeneh-Madar, K.; Borji, S.; Valefi, Z. Microstructural study on ultra-high temperature erosion mechanism of infiltrated W-10 wt% Cu composite. Int. J. Refract. Met. Hard Mater. 2017, 67, 115–124. [Google Scholar] [CrossRef]


| Sample | Commercial W Powder (wt%) | Jet-Milled W Powder (wt%) | Cu (wt%) | |||||
|---|---|---|---|---|---|---|---|---|
| 3 μm | 5 μm | 8 μm | 20 μm | 3 μm | 8 μm | 20 μm | ||
| WY–050–20Cu | - | 80 | - | - | - | - | - | 20 |
| WY–050–15Cu | - | 85 | - | - | - | - | - | 15 |
| WY–050–10Cu | - | 90 | - | - | - | - | - | 10 |
| WY–G–20Cu | 2.58 | - | 38.71 | 38.71 | - | - | - | 20 |
| WY–G–15Cu | 2.74 | - | 41.13 | 41.13 | - | - | - | 15 |
| WY–G–10Cu | 2.90 | - | 43.55 | 43.55 | - | - | - | 10 |
| WM–G–20Cu | - | - | - | - | 2.58 | 38.71 | 38.71 | 20 |
| WM–G–15Cu | - | - | - | - | 2.74 | 41.13 | 41.13 | 15 |
| WM–G–10Cu | - | - | - | - | 2.90 | 43.55 | 43.55 | 10 |
| Sample | Density (g/cm3) | Relative Density (%) | Electrical Conductivity | Hardness (HB) | |
|---|---|---|---|---|---|
| MS/m | %IACS | ||||
| WY–050–20Cu | 14.95 ± 0.04 | 95.3 ± 0.26 | 28.9 ± 0.10 | 49.8 ± 0.16 | 229 ± 6.66 |
| WY–050–15Cu | 15.58 ± 0.03 | 94.7 ± 0.16 | 25.9 ± 0.02 | 44.7 ± 0.03 | 248 ± 7.51 |
| WY–050–10Cu | 15.75 ± 0.04 | 91.0 ± 0.23 | 25.5 ± 0.05 | 44.0 ± 0.08 | 241 ± 5.57 |
| WY–G–20Cu | 15.02 ± 0.03 | 95.8 ± 0.17 | 29.4 ± 0.11 | 50.7 ± 0.19 | 209 ± 4.04 |
| WY–G–15Cu | 15.73 ± 0.04 | 95.6 ± 0.25 | 25.8 ± 0.05 | 44.5 ± 0.08 | 224 ± 2.08 |
| WY–G–10Cu | 15.99 ± 0.09 | 92.4 ± 0.51 | 24.2 ± 0.18 | 41.7 ± 0.32 | 231 ± 5.51 |
| WM–G–20Cu | 15.20 ± 0.04 | 96.9 ± 0.23 | 28.4 ± 0.16 | 45.0 ± 0.27 | 211 ± 8.33 |
| WM–G–15Cu | 15.72 ± 0.03 | 95.6 ± 0.18 | 26.5 ± 0.03 | 45.7 ± 0.05 | 222 ± 2.52 |
| WM–G–10Cu | 16.25 ± 0.04 | 93.9 ± 0.24 | 24.9 ± 0.14 | 42.9 ± 0.24 | 232 ± 5.51 |
Publisher’s Note: MDPI stays neutral with regard to jurisdictional claims in published maps and institutional affiliations. |
© 2022 by the authors. Licensee MDPI, Basel, Switzerland. This article is an open access article distributed under the terms and conditions of the Creative Commons Attribution (CC BY) license (https://creativecommons.org/licenses/by/4.0/).
Share and Cite
Chen, Z.; Li, B.; Zhang, Q.; Hu, X.; Ding, Y.; Zhu, Z.; Xiao, P.; Liang, S. W–Cu Composite with High W Content Prepared by Grading Rounded W Powder with Narrow Particle Size Distribution. Materials 2022, 15, 1904. https://doi.org/10.3390/ma15051904
Chen Z, Li B, Zhang Q, Hu X, Ding Y, Zhu Z, Xiao P, Liang S. W–Cu Composite with High W Content Prepared by Grading Rounded W Powder with Narrow Particle Size Distribution. Materials. 2022; 15(5):1904. https://doi.org/10.3390/ma15051904
Chicago/Turabian StyleChen, Zheng, Bingxue Li, Qiao Zhang, Xudong Hu, Yi Ding, Zhixiang Zhu, Peng Xiao, and Shuhua Liang. 2022. "W–Cu Composite with High W Content Prepared by Grading Rounded W Powder with Narrow Particle Size Distribution" Materials 15, no. 5: 1904. https://doi.org/10.3390/ma15051904
APA StyleChen, Z., Li, B., Zhang, Q., Hu, X., Ding, Y., Zhu, Z., Xiao, P., & Liang, S. (2022). W–Cu Composite with High W Content Prepared by Grading Rounded W Powder with Narrow Particle Size Distribution. Materials, 15(5), 1904. https://doi.org/10.3390/ma15051904