
Multi-Objective Function Optimization of Cemented Neutralization Slag Backfill Strength Based on RSM-BBD

Abstract
:1. Introduction
2. Materials and Methods
2.1. Materials
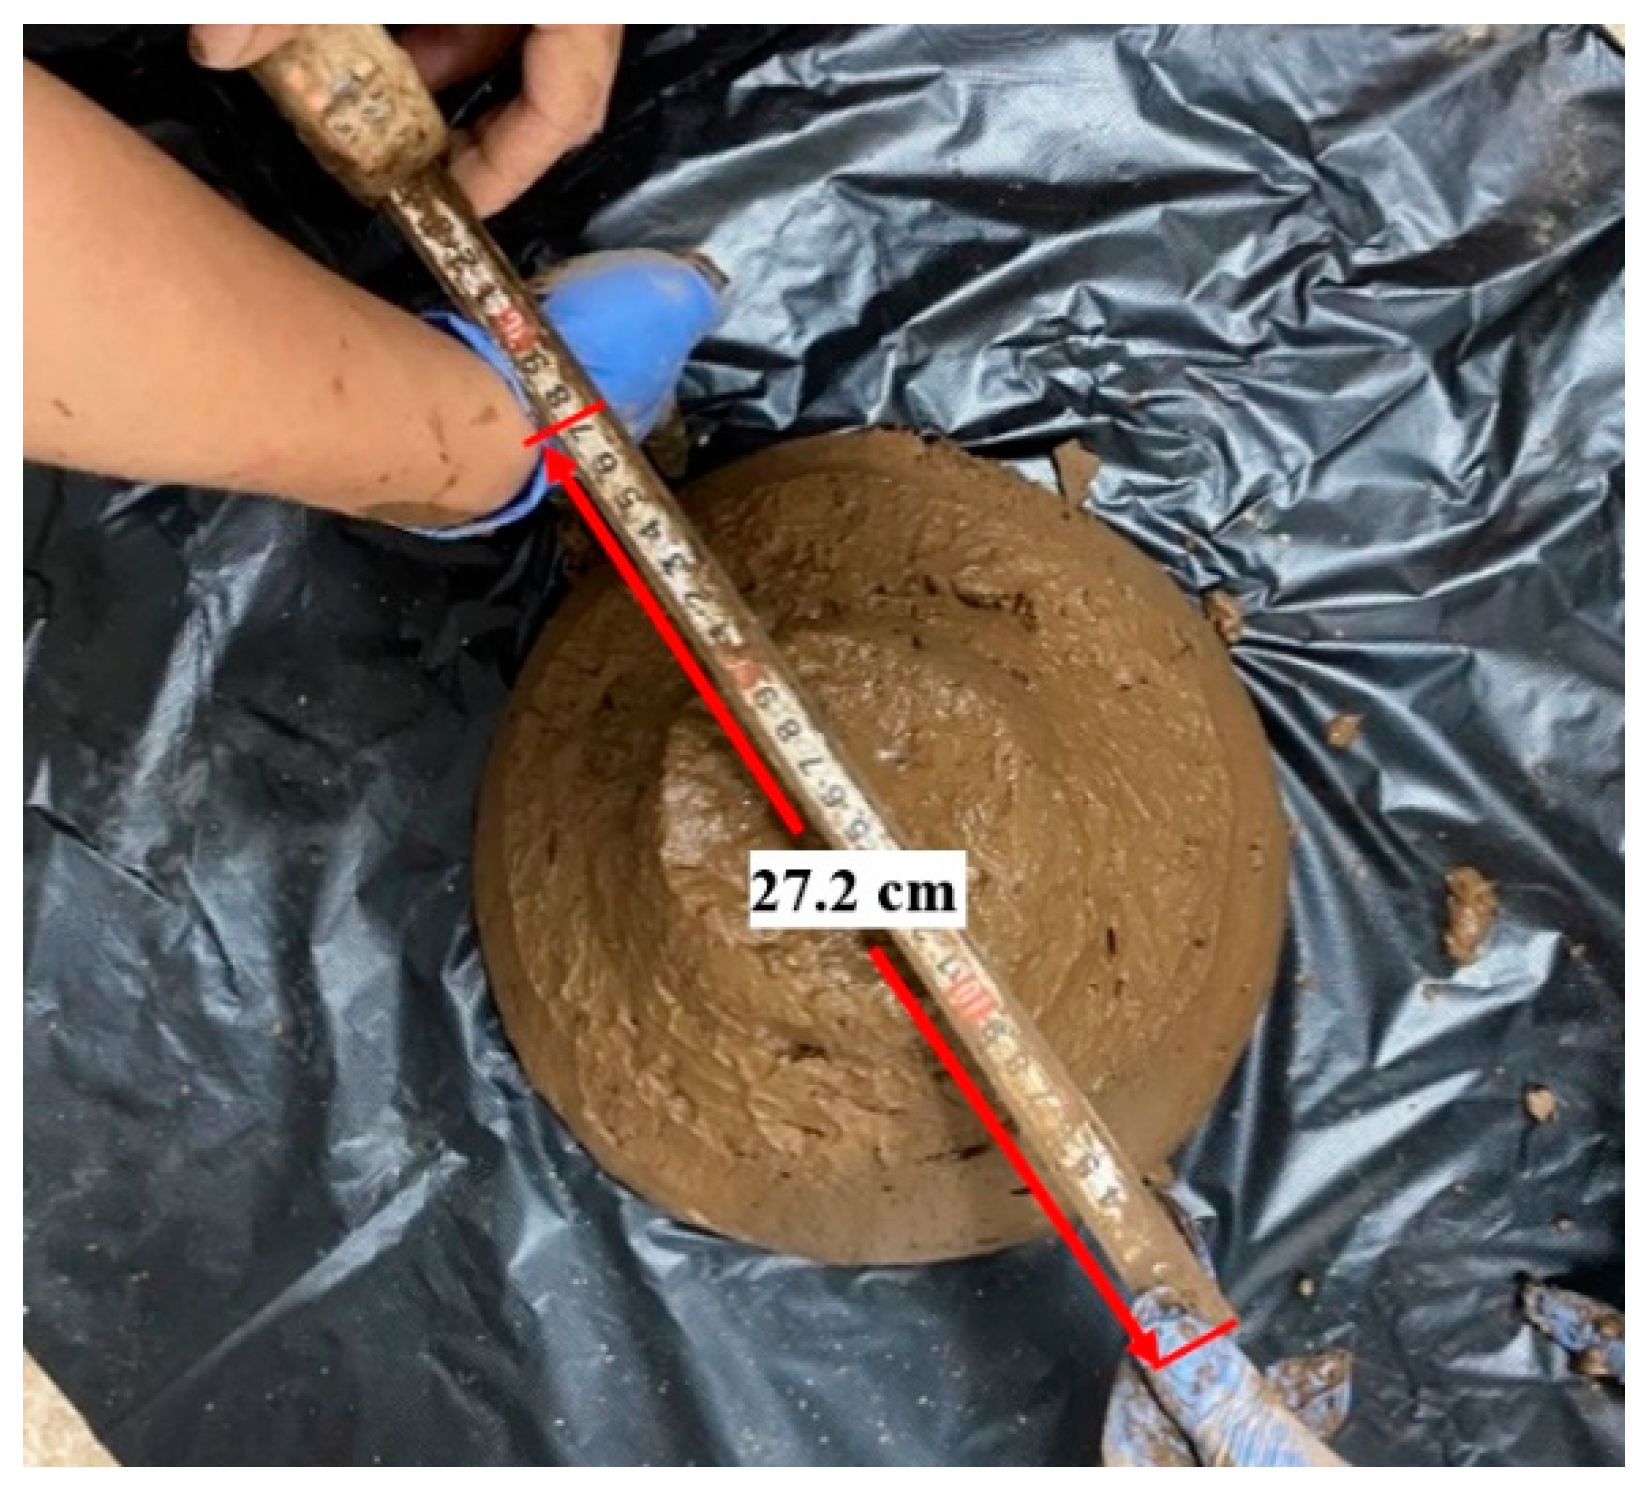
2.2. Determination of Slurry Parameter Range
2.3. Preparation of Cemented Backfill
2.4. Statistical Analysis
3. Results and Discussion
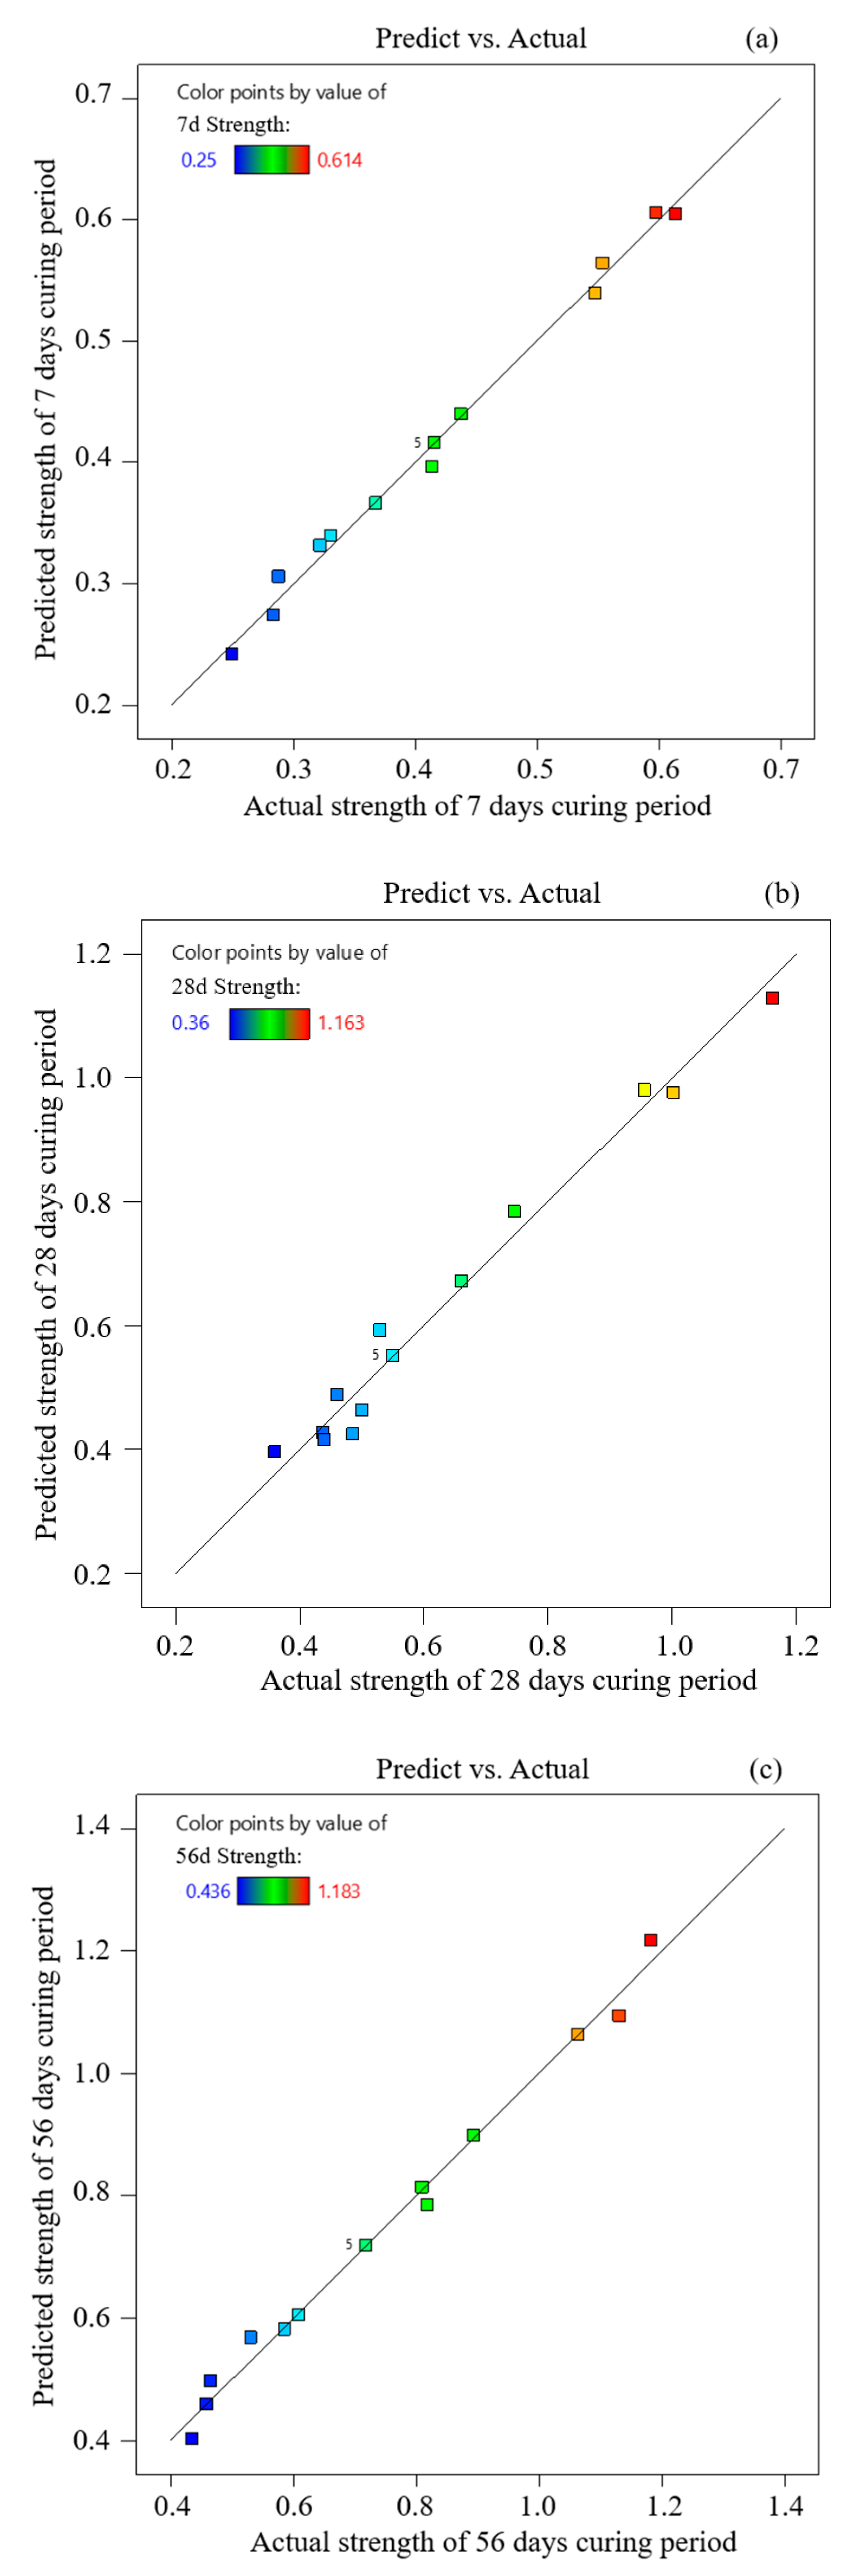
3.1. Evaluation of Strength Test and Model Fitting
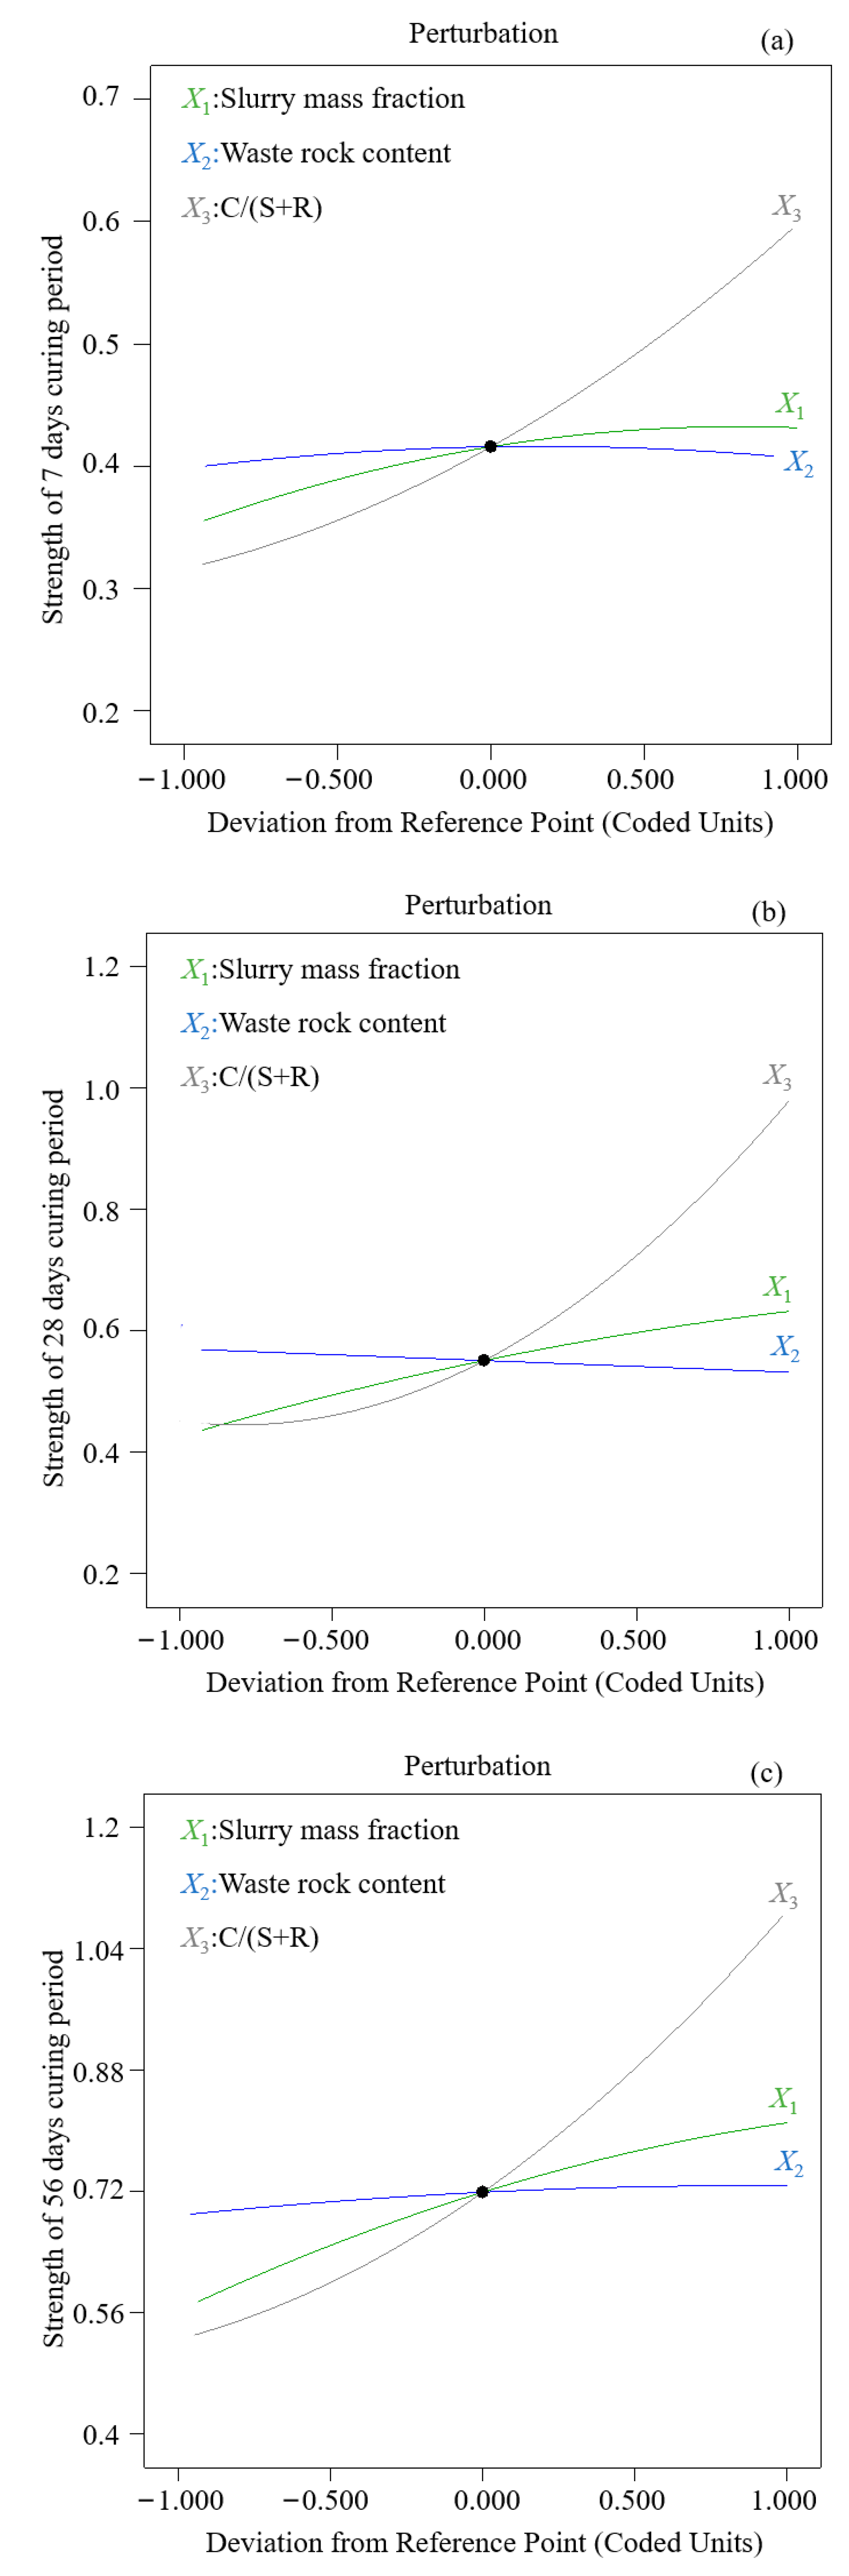
3.2. Influence of Single Factor on Backfill Strength
3.2.1. Influence of Single Factor on Backfill Strength
3.2.2. Effect of C/(S+R) on Backfill Strength
3.2.3. Effect of Waste Rock Content on Backfill Strength
3.3. Response Surface Analysis
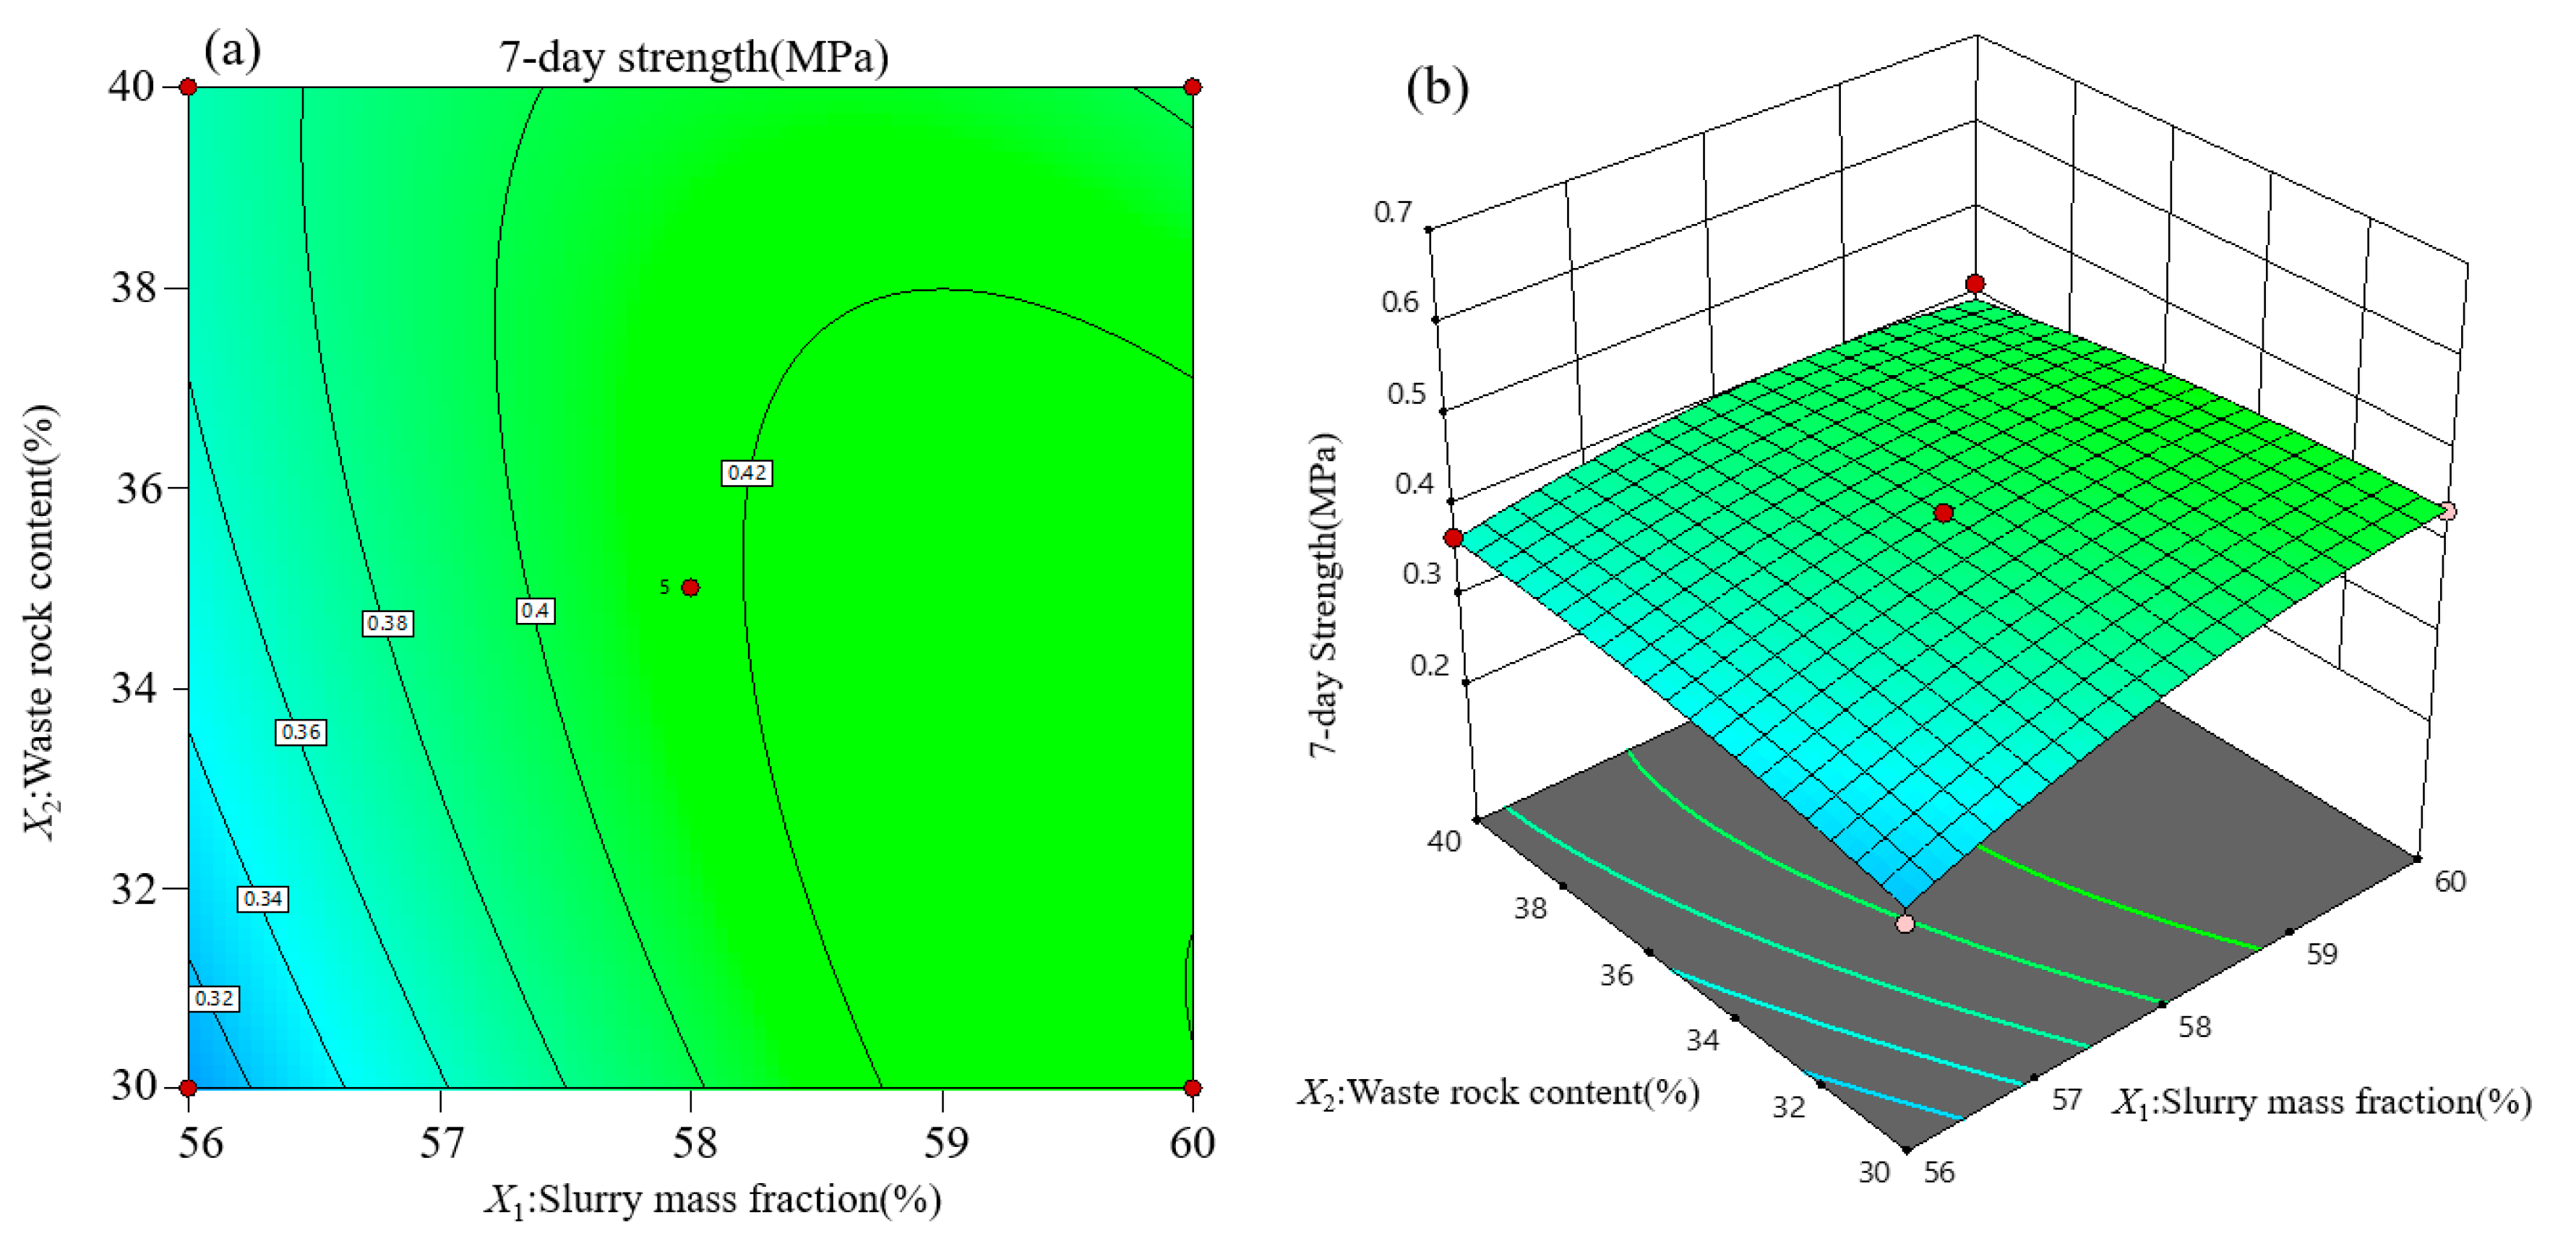
3.3.1. Response Surface Analysis of Backfill Strength at 7 Days
3.3.2. Response Surface Analysis of Backfill Strength at 28 Days
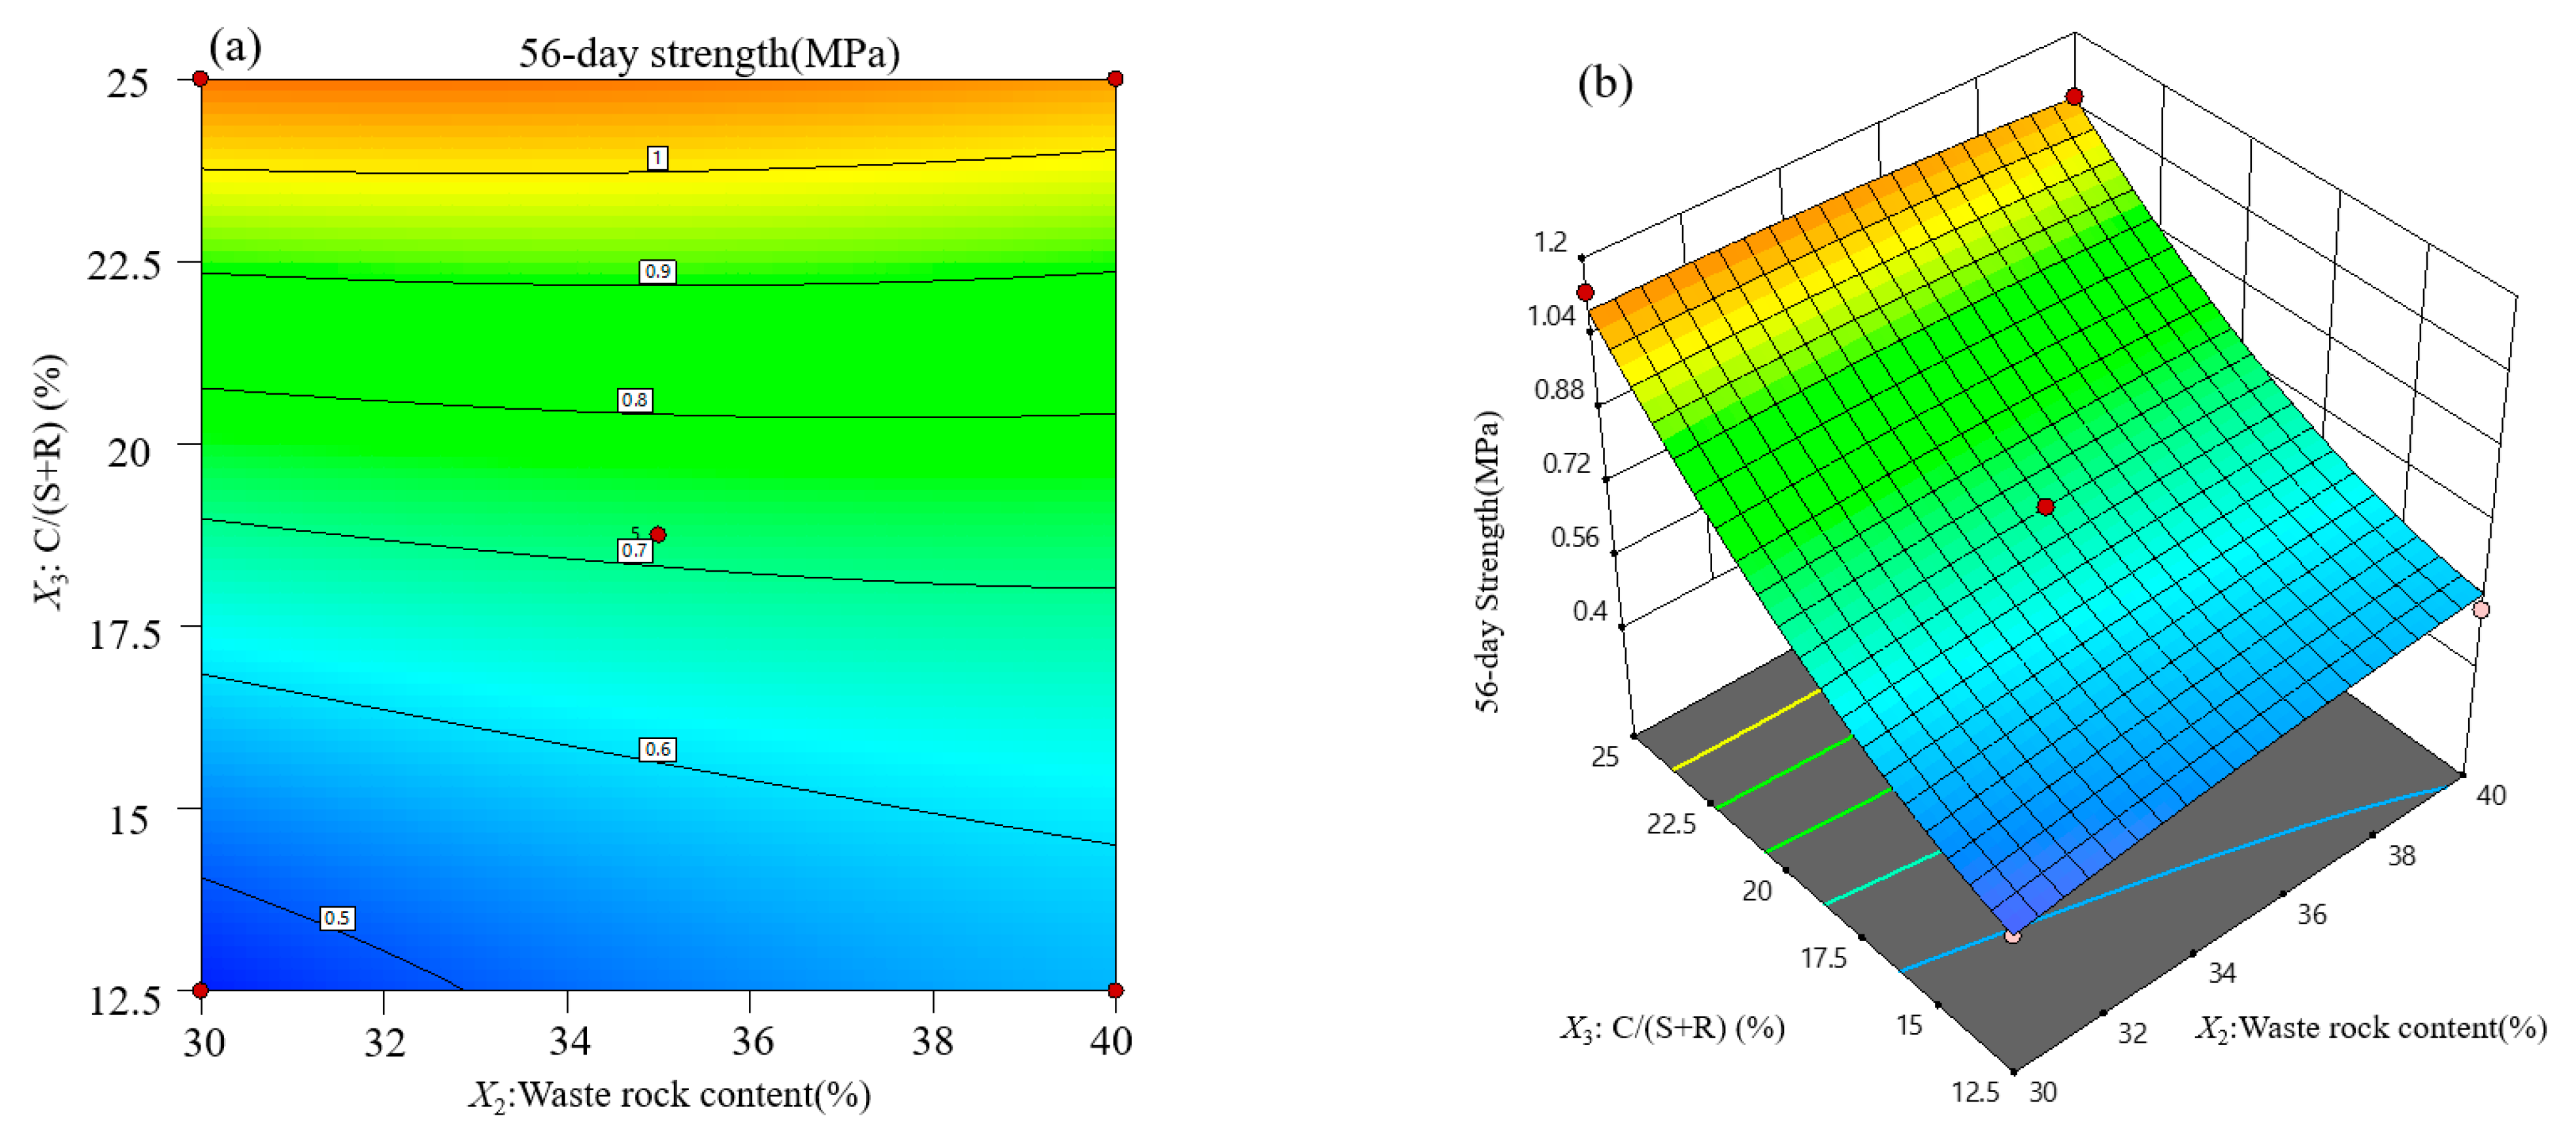
3.3.3. Response Surface Analysis of Backfill Strength at 56 Days
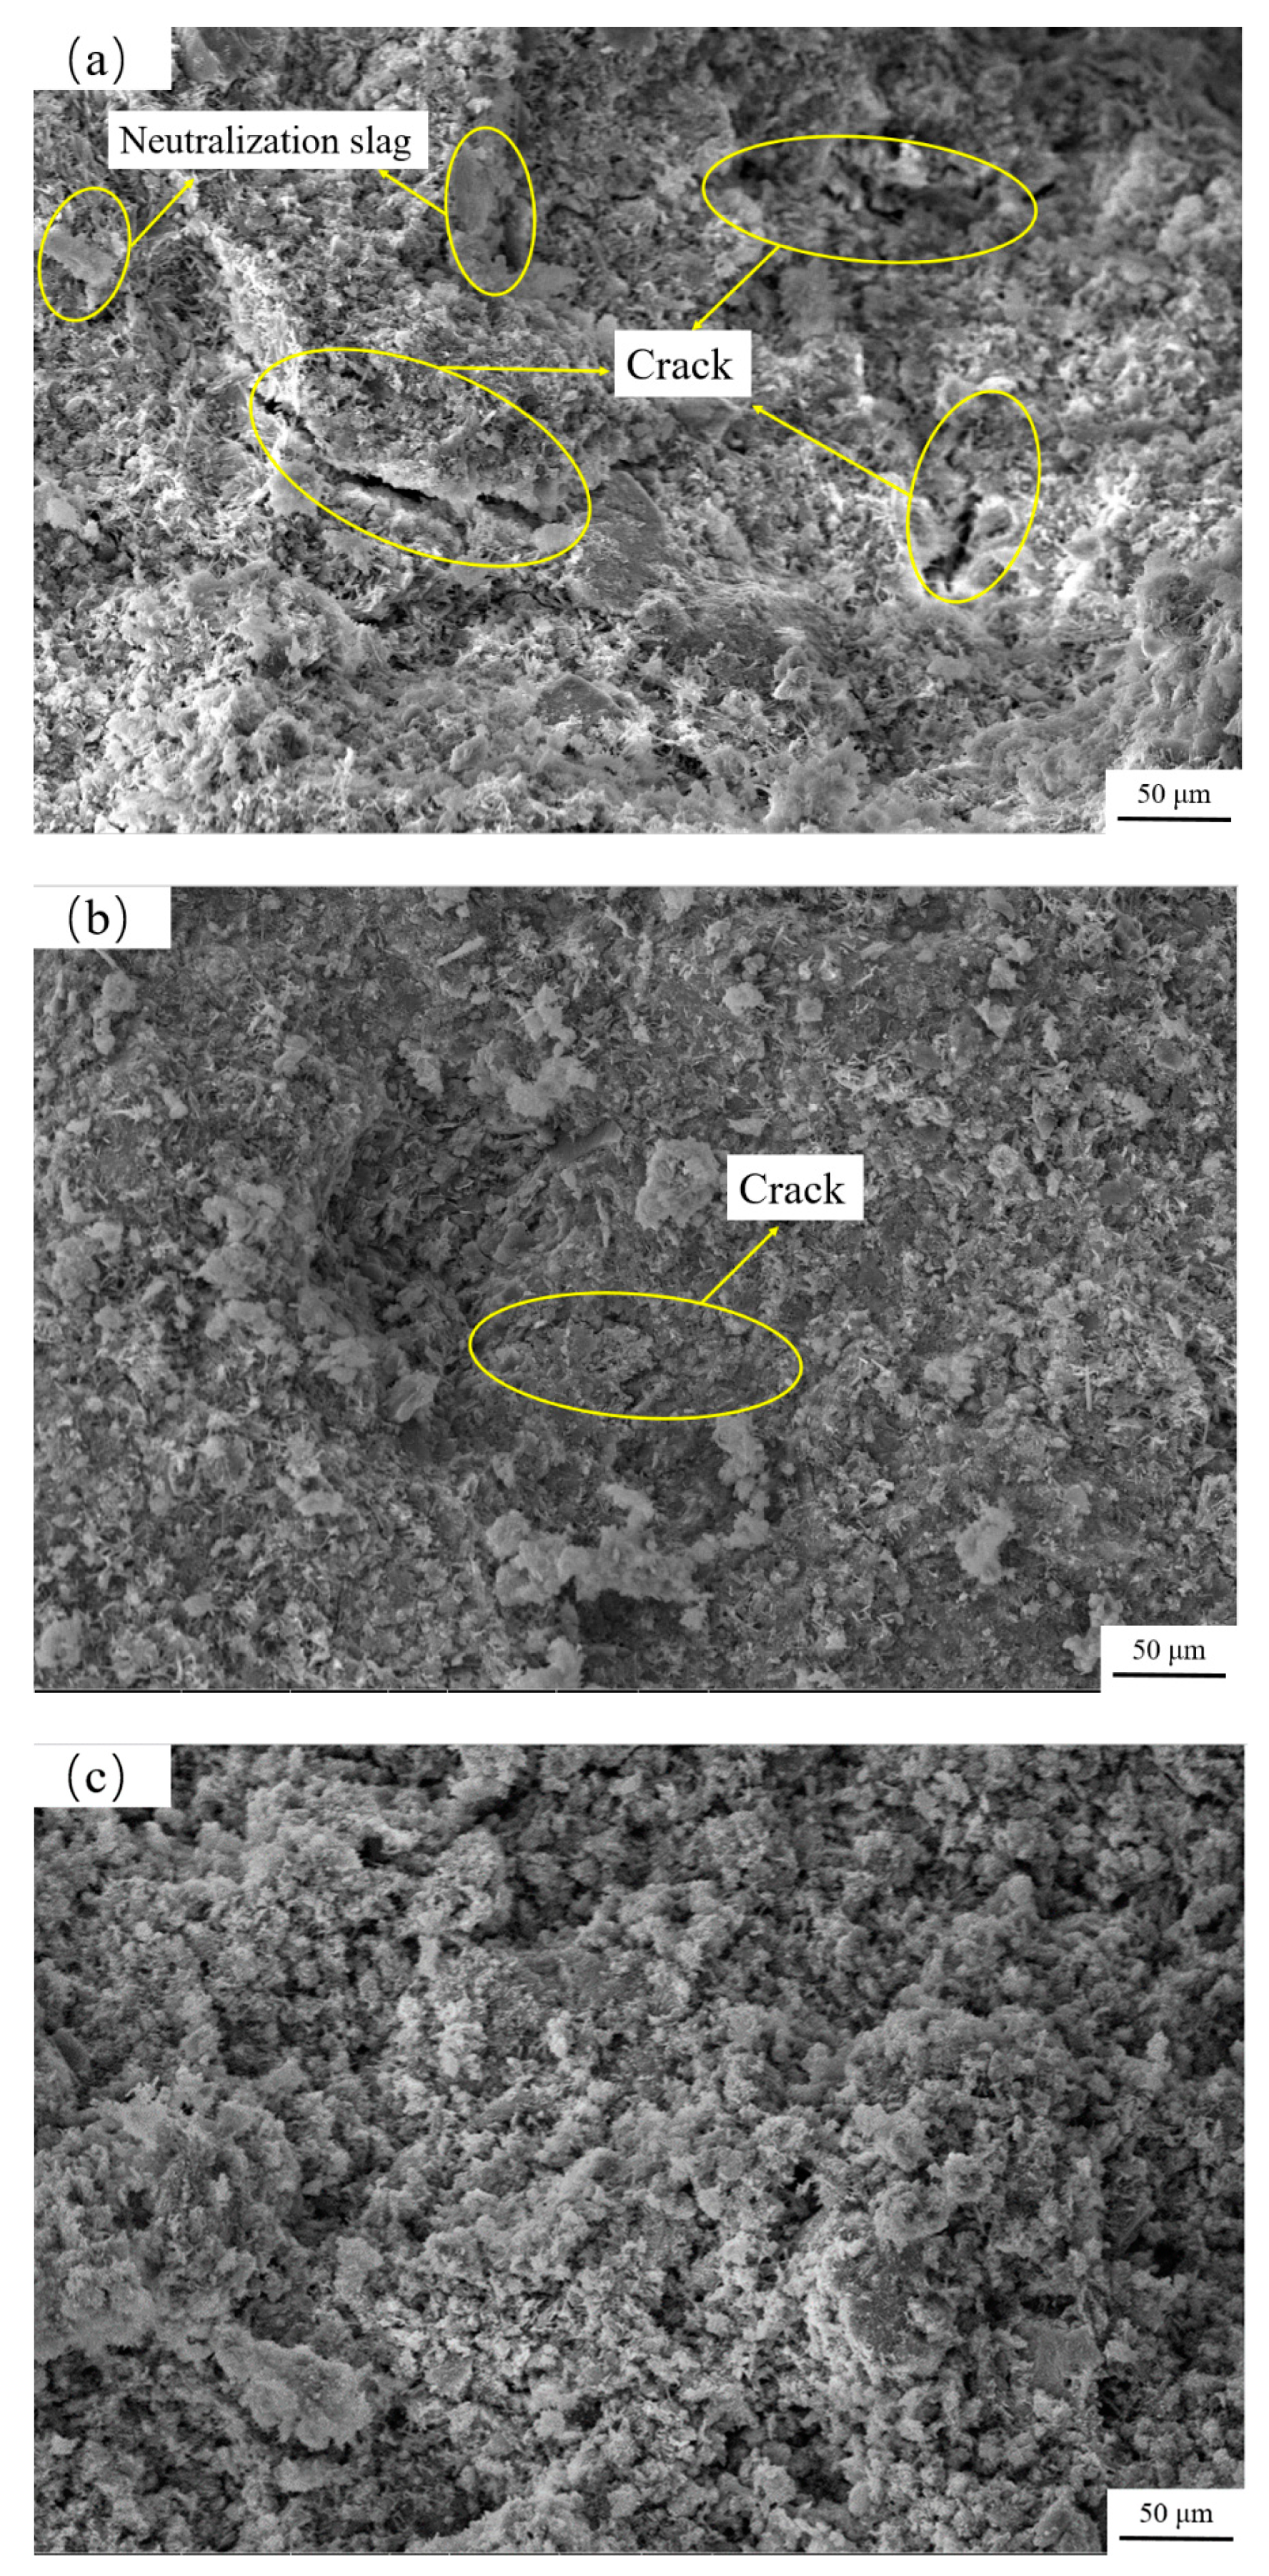
3.4. SEM Analysis of Backfill at Different Curing Ages
3.5. Backfill Strength Optimization and Verification
4. Conclusions
- In this study, the neutralization slag of the Carlin-type gold mine was applied to the backfill of goaf for the first time. The slurry proportion test was carried out by the RSM-BBD method, and the response model was established for the strength of cemented backfill at 7, 28 and 56 days. The F- and p-values showed that the response model had high significance, which could simulate the development of the strength of this celestial body.
- The research showed that the strength of backfill at the same curing age was positively correlated with the slurry mass fraction X1 and the cement–sand ratio X3. The cement–sand ratio had a significant impact on the strength of the backfill, while the slurry mass fraction had a great impact on the later strength of the backfill.
- The interaction between slurry mass fraction and waste rock content had a great impact on the early strength of backfill. Additionally, the interaction between slurry mass fraction and cement–sand ratio had a significant impact on the middle and late strength of the backfill.
- SEM analysis results showed that with the increased curing time, the cement hydration reaction was sufficient and a large number of C-S-H cementitious molecules were generated. Thus, the internal skeleton of the backfill became dense, and the strength enhancement effect was remarkable.
- The optimal ratio was obtained: the mass fraction of slurry was 58.45%, the content of waste rock was 32.17%, and the cement–sand ratio was 20.13%. Through the confirmatory test, the results showed that the strength of the backfill at 7, 28 and 56 days was 0.42, 0.64 and 0.85 MPa, respectively, meeting the requirements of the target strength.
Author Contributions
Funding
Institutional Review Board Statement
Informed Consent Statement
Data Availability Statement
Conflicts of Interest
References
- Yu, H.; Li, S.; Wang, X. The Recent Progress China Has Made in the Backfill Mining Method, Part I: The Theory and Equipment of Backfill Pipeline Transportation. Minerals 2021, 11, 1274. [Google Scholar] [CrossRef]
- Wang, F.; Jiang, B.; Chen, S.; Ren, M. Surface collapse control under thick unconsolidated layers by backfilling strip mining in coal mines. Int. J. Rock Mech. Min. Sci. 2019, 113, 268–277. [Google Scholar] [CrossRef]
- Qin, J.; Zheng, J.; Li, L. Experimental study of the shrinkage behavior of cemented paste backfill. J. Rock Mech. Geotech. Eng. 2021, 13, 545–554. [Google Scholar] [CrossRef]
- Wang, R.; Zeng, F.; Li, L. Stability analyses of side-exposed backfill considering mine depth and extraction of adjacent stope. Int. J. Rock Mech. Min. Sci. 2021, 142, 104735. [Google Scholar] [CrossRef]
- Cao, S.; Yilmaz, E.; Song, W. Evaluation of Viscosity, Strength and Microstructural Properties of Cemented Tailings Backfill. Minerals 2018, 8, 352. [Google Scholar] [CrossRef] [Green Version]
- Behera, S.; Mishra, D.; Singh, P.; Mishra, K.; Mandal, S.; Ghosh, C.; Ritesh, K.; Mandal, P. Utilization of mill tailings, fly ash and slag as mine paste backfill material: Review and future perspective. Constr. Build. Mater. 2021, 309, 125120. [Google Scholar] [CrossRef]
- Deng, H.; Liu, Y.; Zhang, W.; Yu, S.; Tian, G. Study on the Strength Evolution Characteristics of Cemented Tailings Backfill from the Perspective of Porosity. Minerals 2021, 11, 82. [Google Scholar] [CrossRef]
- Wang, Z.; Yu, W.; Liu, F. The materialization characteristics and Ratio of a New Soil Paste Filling Material. Adv. Civ. Eng. 2020, 2020, 6645494. [Google Scholar] [CrossRef]
- Rakhimova, N.R.; Rakhimov, R.Z.; Naumkina, N.I.; Khuzin, A.F.; Osin, Y.N. Influence of limestone content, fineness, and composition on the properties and microstructure of alkali-activated slag cement. Cem. Concr. Compos. 2016, 72, 268–274. [Google Scholar] [CrossRef]
- Kupwade-Patil, K.; Al-Aibani, A.F.; Abdulsalam, M.F.; Mao, C.; Bumajdad, A.; Palkovic, S.D.; Büyüköztürk, O. Microstructure of cement paste with natural pozzolanic volcanic ash and Portland cement at different stages of curing. Constr. Build. Mater. 2016, 113, 423–441. [Google Scholar] [CrossRef] [Green Version]
- Box, G.E.P.; Wilson, K.B. On the Experimental Attainment of Optimum Conditions. J. R. Stat. Society. Ser. B 1951, 13, 1–45. [Google Scholar] [CrossRef]
- Zhou, L.; Zhou, H.; Yang, X. Preparation and performance of a novel starch-based inorganic/organic composite coagulant for textile wastewater treatment. Sep. Purif. Technol. 2019, 210, 93–99. [Google Scholar] [CrossRef]
- Daud, N.M.; Rozaimah, S.A.S.; Hassimi, A.H. Response surface methodological analysis for the optimization of acid-catalyzed transesterification biodiesel wastewater pre-treatment using coagulation-flocculation process. Process Saf. Environ. Prot. 2018, 113, 184–192. [Google Scholar] [CrossRef]
- Wu, A.; Ruan, Z.; Bürger, R.; Yin, S.; Wang, J.; Wang, Y. Optimization of flocculation and settling parameters of tailings slurry by response surface methodology. Miner. Eng. 2020, 156, 106488. [Google Scholar] [CrossRef]
- Yang, L.; Wang, L.; Gao, J.; Guo, S.; Ye, X.; Koppala, S.; Hu, T.; Hou, M.; Hu, L. Optimization of Process Parameters for Preparing Metallic Matrix Diamond Tool Bits by Microwave Pressureless Sintering Using Response Surface Methodology. Materials 2018, 11, 2185. [Google Scholar] [CrossRef] [PubMed] [Green Version]
- Han, C.L.; Yang, X.Y.; Shen, X.F.; Peng, T.S.; Cheng, H.F.; Zhang, F.G.; Zhang, J.X. Application of response surface method (RSM) to investigate the effect of process parameters on the microstructure and shear strength of TZM/graphite joints bonded by using spark plasma sintering. Int. J. Refract. Met. Hard Mater. 2021, 100, 105622. [Google Scholar] [CrossRef]
- Kadir, G.; Eda, F.A. Entropy generation of different panel radiator types: Design of experiments using response surface methodology (RSM). J. Build. Eng. 2021, 41, 102369. [Google Scholar] [CrossRef]
- Habibi, A.; Ramezanianpour, A.M.; Mahdikhani, M. RSM-based optimized mix design of recycled aggregate concrete containing supplementary cementitious materials based on waste generation and global warming potential. Resour. Conserv. Recycl. 2021, 167, 105420. [Google Scholar] [CrossRef]
- Pinheiro, D.R.; Neves, R.F.; Paz, S.P.A. A sequential Box-Behnken Design (BBD) and Response Surface Methodology (RSM) to optimize SAPO-34 synthesis from kaolin waste. Microporous Mesoporous Mater. 2021, 323, 111250. [Google Scholar] [CrossRef]
- Kaya, M.; Yıldırım, Z.B.; Köksal, F.; Beycioğlu, A.; Kasprzyk, I. Evaluation and Multi-Objective Optimization of Lightweight Mortars Parameters at Elevated Temperature via Box–Behnken Optimization Approach. Materials 2021, 14, 7405. [Google Scholar] [CrossRef]
- Liu, L.; Fang, Z.; Qi, C.; Zhang, B.; Guo, L.; Song, K.-I. Experimental investigation on the relationship between pore characteristics and unconfined compressive strength of cemented paste backfill. Constr. Build. Mater. 2018, 179, 254–264. [Google Scholar] [CrossRef]
- Alireza, G.; Mamadou, F. Strength evolution and deformation behaviour of cemented paste backfill at early ages: Effect of curing stress, filling strategy and drainage. Int. J. Min. Sci. Technol. 2016, 26, 809–817. [Google Scholar] [CrossRef]
- Chang, Q.; Chen, J.; Zhou, H.; Bai, J. Implementation of Paste Backfill Mining Technology in Chinese Coal Mines. Sci. World J. 2014, 2014, 821025. [Google Scholar] [CrossRef]
- Dai, C.; Wu, A.; Qi, Y.; Chen, Z. The Optimization of Mix Proportions for Cement Paste Backfill Materials via Box–Behnken Experimental Method. J. Inst. Eng. Ser. D 2019, 100, 307–316. [Google Scholar] [CrossRef] [Green Version]
- Fu, Z.G.; Qiao, D.P.; Guo, Z.L.; Huang, F.; Wang, J.X. Experimental research on mixture proportion and strength of cemented hydraulic fill with waste rock and eolian sand based on RSM-BBD. J. China Coal Soc. 2018, 43, 694–703. [Google Scholar]
- Sun, Q.; Wei, X.; Li, T.; Zhang, L. Strengthening Behavior of Cemented Paste Backfill Using Alkali-Activated Slag Binders and Bottom Ash Based on the Response Surface Method. Materials 2020, 13, 855. [Google Scholar] [CrossRef] [Green Version]
- Yin, S.H.; Hao, S.; Zhou, L.; Dou, Y.Y.; Li, X.W. Research on strength regression and slurry optimization of cemented backfill based on response surface method [J]. J. Cent. South Univ. Sci. Technol. 2020, 51, 1595–1605. [Google Scholar]
- Xiao, R.; Hou, L.; Gu, H.; Lu, X.; Jiao, S. Study on the Interaction of Hot Air Heating Parameters for Asphalt Pavement Based on the Response Surface Method. Arab. J. Sci. Eng. 2021, 1–17. [Google Scholar] [CrossRef]
- Tan, Q.; Xia, Y.; Wang, X.; Xie, Z.; Wei, D. Carbon-oxygen isotopes and rare earth elements as an exploration vector for Carlin-type gold deposits: A case study of the Shuiyindong gold deposit, Guizhou Province, SW China. J. Asian Earth Sci. 2017, 148, 1–12. [Google Scholar] [CrossRef]
- He, R.; Li, D.; Yang, K.; Li, T.; Ren, B. Process optimization and modeling of recycling Mo (VI) from spent Mo-Fe2O3/Al2O3 catalyst by roasting with sodium carbonate using response surface methodology (RSM). Int. J. Refract. Met. Hard Mater. 2020, 87, 105162. [Google Scholar] [CrossRef]
- Babajani, N.; Jamshidi, S. Investigation of photocatalytic malachite green degradation by iridium doped zinc oxide nanoparticles: Application of response surface methodology. J. Alloys Compd. 2019, 782, 533–544. [Google Scholar] [CrossRef]
- Aliyu, Y.N.S.; Bin, N.M.; Hartadi, S.M.; Usman, A.; Saeed, S.M. Modeling and optimization of mixing parameters using response surface methodology and characterization of palm oil clinker fine modified bitumen. Constr. Build. Mater. 2021, 298, 123849. [Google Scholar] [CrossRef]
- Han, H.; Li, B.; Wu, H.; Shao, W. Multi-objective shape optimization of double pipe heat exchanger with inner corrugated tube using RSM method. Int. J. Therm. Sci. 2015, 90, 173–186. [Google Scholar] [CrossRef]
- Pajaie, H.S.; Taghizadeh, M. Optimization of nano-sized SAPO-34 synthesis in methanol-to-olefin reaction by response surface methodology. J. Ind. Eng. Chem. 2015, 24, 59–70. [Google Scholar] [CrossRef]
- Rong, H.; Zhou, M.; Hou, H. Pore Structure Evolution and Its Effect on Strength Development of Sulfate-Containing Cemented Paste Backfill. Minerals 2017, 7, 8. [Google Scholar] [CrossRef] [Green Version]


| Aggregate | Density/(g·cm−3) | Dense unit weight/(g·cm−3) | Porosity/% | Stacking Compactness/% |
|---|---|---|---|---|
| Neutralization slag | 2.418 | 0.948 | 0.608 | 0.392 |
| Waste rock | 2.67 | 1.801 | 0.33 | 0.67 |
| Component | P2O5 | SO3 | As | SiO2 | Ca | Al2O3 | Fe | Others |
|---|---|---|---|---|---|---|---|---|
| Content/% | 0.26 | 19.98 | 0.51 | 18.05 | 14.6 | 4.94 | 8.23 | 33.43 |
| Influential Factor | Code Value | Coding Level | ||
|---|---|---|---|---|
| −1 | 0 | 1 | ||
| Slurry mass fraction (%) | X1 | 56 | 58 | 60 |
| Waste rock content (%) | X2 | 30 | 35 | 40 |
| C/(S+R) (%) | X3 | 12.5 | 18.75 | 25 |
| Run | Coded Variables | Original Variables | ||||
|---|---|---|---|---|---|---|
| X1 | X2 | X3 | Slurry Mass Fraction (%) | Waste Rock Content (%) | C/(S+R) (%) | |
| 1 | 0 | 0 | 0 | 58 | 35 | 18.75 |
| 2 | 0 | 0 | 0 | 58 | 35 | 18.75 |
| 3 | 0 | 0 | 0 | 58 | 35 | 18.75 |
| 4 | −1 | −1 | 0 | 56 | 30 | 18.75 |
| 5 | −1 | 0 | −1 | 56 | 35 | 12.5 |
| 6 | 0 | 0 | 0 | 58 | 35 | 18.75 |
| 7 | 1 | 0 | 1 | 60 | 35 | 25 |
| 8 | 1 | 0 | −1 | 60 | 35 | 12.5 |
| 9 | 1 | −1 | 0 | 60 | 30 | 18.75 |
| 10 | −1 | 1 | 0 | 56 | 40 | 18.75 |
| 11 | 1 | 1 | 0 | 60 | 40 | 18.75 |
| 12 | 0 | −1 | −1 | 58 | 30 | 12.5 |
| 13 | 0 | 0 | 0 | 58 | 35 | 18.75 |
| 14 | −1 | 0 | 1 | 56 | 35 | 25 |
| 15 | 0 | 1 | 1 | 58 | 40 | 25 |
| 16 | 0 | −1 | 1 | 58 | 30 | 25 |
| 17 | 0 | 1 | −1 | 58 | 40 | 12.5 |
| Number | Code Value | Actual Strength/MPa | Predicted Strength/MPa | ||||||
|---|---|---|---|---|---|---|---|---|---|
| X1 | X2 | X3 | Y1 | Y2 | Y3 | Y1* | Y2* | Y3* | |
| 1 | 0 | 0 | 0 | 0.416 | 0.551 | 0.719 | 0.416 | 0.551 | 0.719 |
| 2 | 0 | 0 | 0 | 0.416 | 0.551 | 0.719 | 0.416 | 0.551 | 0.719 |
| 3 | 0 | 0 | 0 | 0.416 | 0.551 | 0.719 | 0.416 | 0.551 | 0.719 |
| 4 | −1 | −1 | 0 | 0.288 | 0.486 | 0.465 | 0.306 | 0.424 | 0.498 |
| 5 | −1 | 0 | −1 | 0.250 | 0.360 | 0.436 | 0.242 | 0.395 | 0.403 |
| 6 | 0 | 0 | 0 | 0.416 | 0.551 | 0.719 | 0.416 | 0.551 | 0.719 |
| 7 | 1 | 0 | 1 | 0.598 | 1.163 | 1.183 | 0.606 | 1.128 | 1.216 |
| 8 | 1 | 0 | −1 | 0.331 | 0.501 | 0.586 | 0.340 | 0.463 | 0.582 |
| 9 | 1 | −1 | 0 | 0.438 | 0.661 | 0.81 | 0.440 | 0.672 | 0.814 |
| 10 | −1 | 1 | 0 | 0.368 | 0.438 | 0.609 | 0.366 | 0.427 | 0.605 |
| 11 | 1 | 1 | 0 | 0.414 | 0.53 | 0.818 | 0.396 | 0.592 | 0.785 |
| 12 | 0 | −1 | −1 | 0.284 | 0.461 | 0.459 | 0.274 | 0.488 | 0.459 |
| 13 | 0 | 0 | 0 | 0.416 | 0.551 | 0.719 | 0.416 | 0.551 | 0.719 |
| 14 | −1 | 0 | 1 | 0.548 | 0.746 | 0.894 | 0.540 | 0.784 | 0.898 |
| 15 | 0 | 1 | 1 | 0.554 | 1.003 | 1.064 | 0.564 | 0.976 | 1.064 |
| 16 | 0 | −1 | 1 | 0.614 | 0.956 | 1.131 | 0.605 | 0.980 | 1.094 |
| 17 | 0 | 1 | −1 | 0.322 | 0.439 | 0.531 | 0.331 | 0.415 | 0.568 |
| Source of Variation | Sum of Squares | Mean Square | F-Value | p-Value | ||||||||
|---|---|---|---|---|---|---|---|---|---|---|---|---|
| Y1 | Y2 | Y3 | Y1 | Y2 | Y3 | Y1 | Y2 | Y3 | Y1 | Y2 | Y3 | |
| Model | 0.1877 | 0.7789 | 0.8154 | 0.0209 | 0.0865 | 0.0906 | 113.2 | 38.34 | 88.49 | <0.0001 | <0.0001 | <0.0001 |
| X1 | 0.0134 | 0.0851 | 0.1233 | 0.0134 | 0.0851 | 0.1233 | 72.54 | 37.69 | 120.39 | <0.0001 | 0.0005 | <0.0001 |
| X2 | 0.0001 | 0.003 | 0.0031 | 0.0001 | 0.003 | 0.0031 | 0.7843 | 1.31 | 3.01 | 0.4052 | 0.2895 | 0.1264 |
| X3 | 0.1588 | 0.5549 | 0.6384 | 0.1588 | 0.5549 | 0.6384 | 861.69 | 245.82 | 623.6 | <0.0001 | <0.0001 | <0.0001 |
| X1X2 | 0.0027 | 0.0017 | 0.0046 | 0.0027 | 0.0017 | 0.0046 | 14.68 | 0.7629 | 4.52 | 0.0065 | 0.4114 | 0.0712 |
| X1X3 | 0.0002 | 0.019 | 0.0048 | 0.0002 | 0.019 | 0.0048 | 1.3 | 8.44 | 4.72 | 0.291 | 0.0228 | 0.0664 |
| X2X3 | 0.0024 | 0.0012 | 0.0048 | 0.0024 | 0.0012 | 0.0048 | 13.03 | 0.5273 | 4.72 | 0.0086 | 0.4913 | 0.0664 |
| X12 | 0.0027 | 0.0021 | 0.0044 | 0.0027 | 0.0021 | 0.0044 | 14.71 | 0.9234 | 4.34 | 0.0064 | 0.3686 | 0.0756 |
| X22 | 0.0008 | 0 | 0.0005 | 0.0008 | 0 | 0.0005 | 4.24 | 0 | 0.4976 | 0.0784 | 1 | 0.5033 |
| X32 | 0.0071 | 0.1129 | 0.0328 | 0.0071 | 0.1129 | 0.0328 | 38.65 | 50.01 | 32.03 | 0.0004 | 0.0002 | 0.0008 |
| Residual | 0.0013 | 0.0158 | 0.0072 | 0.0002 | 0.0023 | 0.001 | ||||||
| Lack of Fit | 0.0013 | 0.0158 | 0.0072 | 0.0004 | 0.0053 | 0.0024 | ||||||
| Pure Error | 0 | 0 | 0 | 0 | 0 | 0 | ||||||
| Total | 0.189 | 0.7947 | 0.8226 | |||||||||
| Solve Count | Ma | Ms | Mj | Mw | X1 | X2 | X3 | Y1 | Y2 | Y3 |
|---|---|---|---|---|---|---|---|---|---|---|
| 0 | 0.46 | 0.27 | 0.18 | 0.64 | 58.7 | 36.8 | 24.9 | 0.59 | 1.01 | 1.12 |
| 1 | 0.46 | 0.27 | 0.18 | 0.65 | 58.3 | 36.8 | 24.9 | 0.59 | 0.99 | 1.09 |
| 2 | 0.46 | 0.29 | 0.15 | 0.64 | 58.6 | 39.0 | 20.0 | 0.44 | 0.62 | 0.81 |
| 3 | 0.46 | 0.29 | 0.18 | 0.63 | 59.7 | 39.0 | 24.0 | 0.53 | 0.99 | 1.09 |
| 4 | 0.46 | 0.29 | 0.18 | 0.64 | 59.4 | 39.0 | 24.0 | 0.54 | 0.97 | 1.07 |
| 5 | 0.48 | 0.24 | 0.18 | 0.64 | 58.6 | 33.2 | 24.9 | 0.61 | 1.02 | 1.14 |
| 6 | 0.48 | 0.24 | 0.18 | 0.65 | 58.2 | 33.2 | 24.9 | 0.6 | 0.99 | 1.11 |
| 7 | 0.48 | 0.27 | 0.15 | 0.64 | 58.5 | 35.6 | 20.1 | 0.45 | 0.64 | 0.81 |
| 8 | 0.48 | 0.27 | 0.18 | 0.63 | 59.7 | 35.6 | 24.1 | 0.57 | 1.01 | 1.12 |
| 9 | 0.48 | 0.27 | 0.18 | 0.64 | 59.3 | 35.6 | 24.1 | 0.57 | 0.98 | 1.1 |
| 10 | 0.48 | 0.29 | 0.15 | 0.63 | 59.6 | 37.8 | 19.4 | 0.43 | 0.63 | 0.82 |
| 11 | 0.48 | 0.29 | 0.15 | 0.64 | 59.2 | 37.8 | 19.4 | 0.43 | 0.62 | 0.81 |
| 12 | 0.51 | 0.24 | 0.15 | 0.64 | 58.4 | 32.2 | 20.1 | 0.46 | 0.65 | 0.81 |
| 13 | 0.51 | 0.24 | 0.18 | 0.63 | 59.6 | 32.2 | 24.1 | 0.6 | 1.03 | 1.15 |
| 14 | 0.51 | 0.24 | 0.18 | 0.64 | 59.2 | 32.2 | 24.1 | 0.59 | 1 | 1.13 |
| 15 | 0.51 | 0.27 | 0.15 | 0.63 | 59.5 | 34.5 | 19.4 | 0.45 | 0.66 | 0.83 |
| 16 | 0.51 | 0.27 | 0.15 | 0.64 | 59.2 | 34.5 | 19.4 | 0.45 | 0.64 | 0.81 |
| 17 | 0.53 | 0.24 | 0.15 | 0.63 | 59.5 | 31.2 | 19.5 | 0.45 | 0.68 | 0.83 |
| 18 | 0.53 | 0.24 | 0.15 | 0.64 | 59.1 | 31.2 | 19.5 | 0.45 | 0.66 | 0.81 |
| Curing Time | 7-Day | 28-Day | 56-Day | |
|---|---|---|---|---|
| Backfill Strength | ||||
| Estimate value | 0.46 | 0.65 | 0.81 | |
| Test value | 0.42 | 0.64 | 0.85 | |
| Error value | 8.7% | 1.54% | 4.94% | |
Publisher’s Note: MDPI stays neutral with regard to jurisdictional claims in published maps and institutional affiliations. |
© 2022 by the authors. Licensee MDPI, Basel, Switzerland. This article is an open access article distributed under the terms and conditions of the Creative Commons Attribution (CC BY) license (https://creativecommons.org/licenses/by/4.0/).
Share and Cite
Huang, M.; Chen, L.; Zhang, M.; Zhan, S. Multi-Objective Function Optimization of Cemented Neutralization Slag Backfill Strength Based on RSM-BBD. Materials 2022, 15, 1585. https://doi.org/10.3390/ma15041585
Huang M, Chen L, Zhang M, Zhan S. Multi-Objective Function Optimization of Cemented Neutralization Slag Backfill Strength Based on RSM-BBD. Materials. 2022; 15(4):1585. https://doi.org/10.3390/ma15041585
Chicago/Turabian StyleHuang, Mingqing, Lin Chen, Ming Zhang, and Shulin Zhan. 2022. "Multi-Objective Function Optimization of Cemented Neutralization Slag Backfill Strength Based on RSM-BBD" Materials 15, no. 4: 1585. https://doi.org/10.3390/ma15041585
APA StyleHuang, M., Chen, L., Zhang, M., & Zhan, S. (2022). Multi-Objective Function Optimization of Cemented Neutralization Slag Backfill Strength Based on RSM-BBD. Materials, 15(4), 1585. https://doi.org/10.3390/ma15041585