
Determination of Band Structure of Naturally Occurring Goethite with Al Substitution: A Case Study of Zhushan Iron Zone

Abstract
:1. Introduction
2. Materials and Methods
2.1. Sample Preparation
2.2. X-ray Diffraction (XRD) Analysis
2.3. X-ray Fluorescence (XRF) Spectroscopy Analysis
2.4. Transmission Electron Microscopy (TEM) Analysis
2.5. Synchrotron X-ray Absorption and Emission Spectroscopy (XAS and XES) Analysis
2.6. Photoelectron Spectroscopy (PS) Analysis
2.7. Density Functional Calculations
2.8. Photochemical Experiments
3. Results
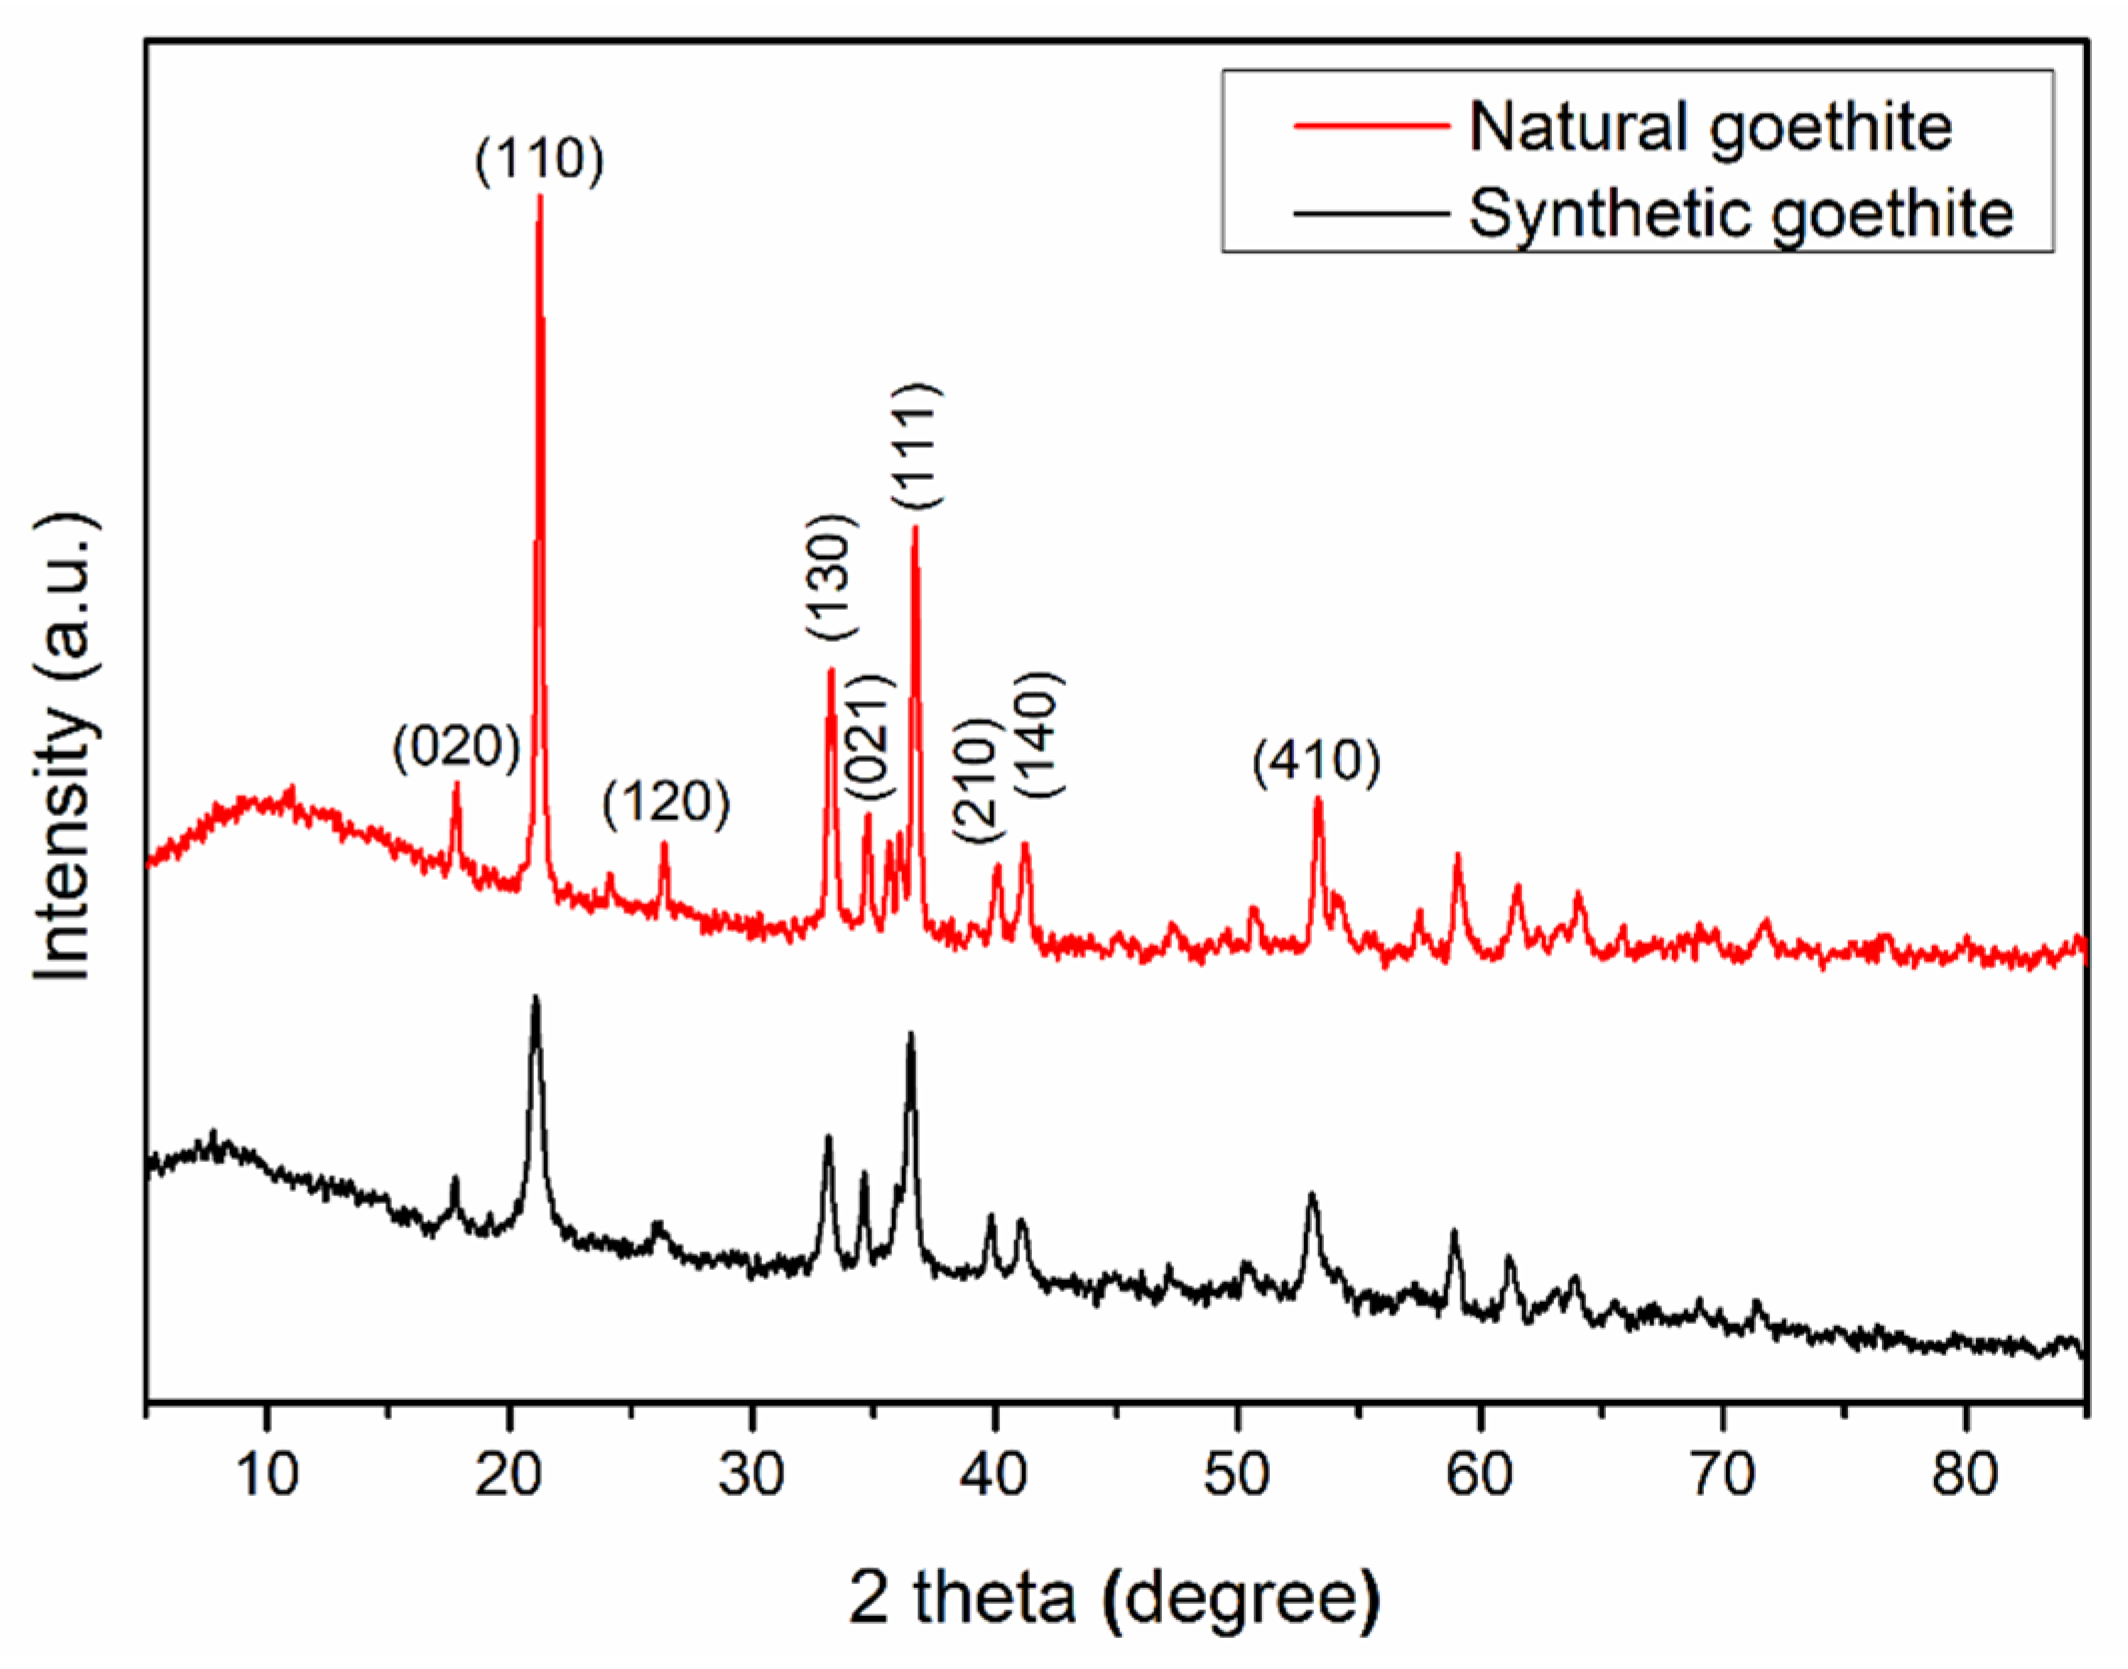
3.1. XRD Analysis
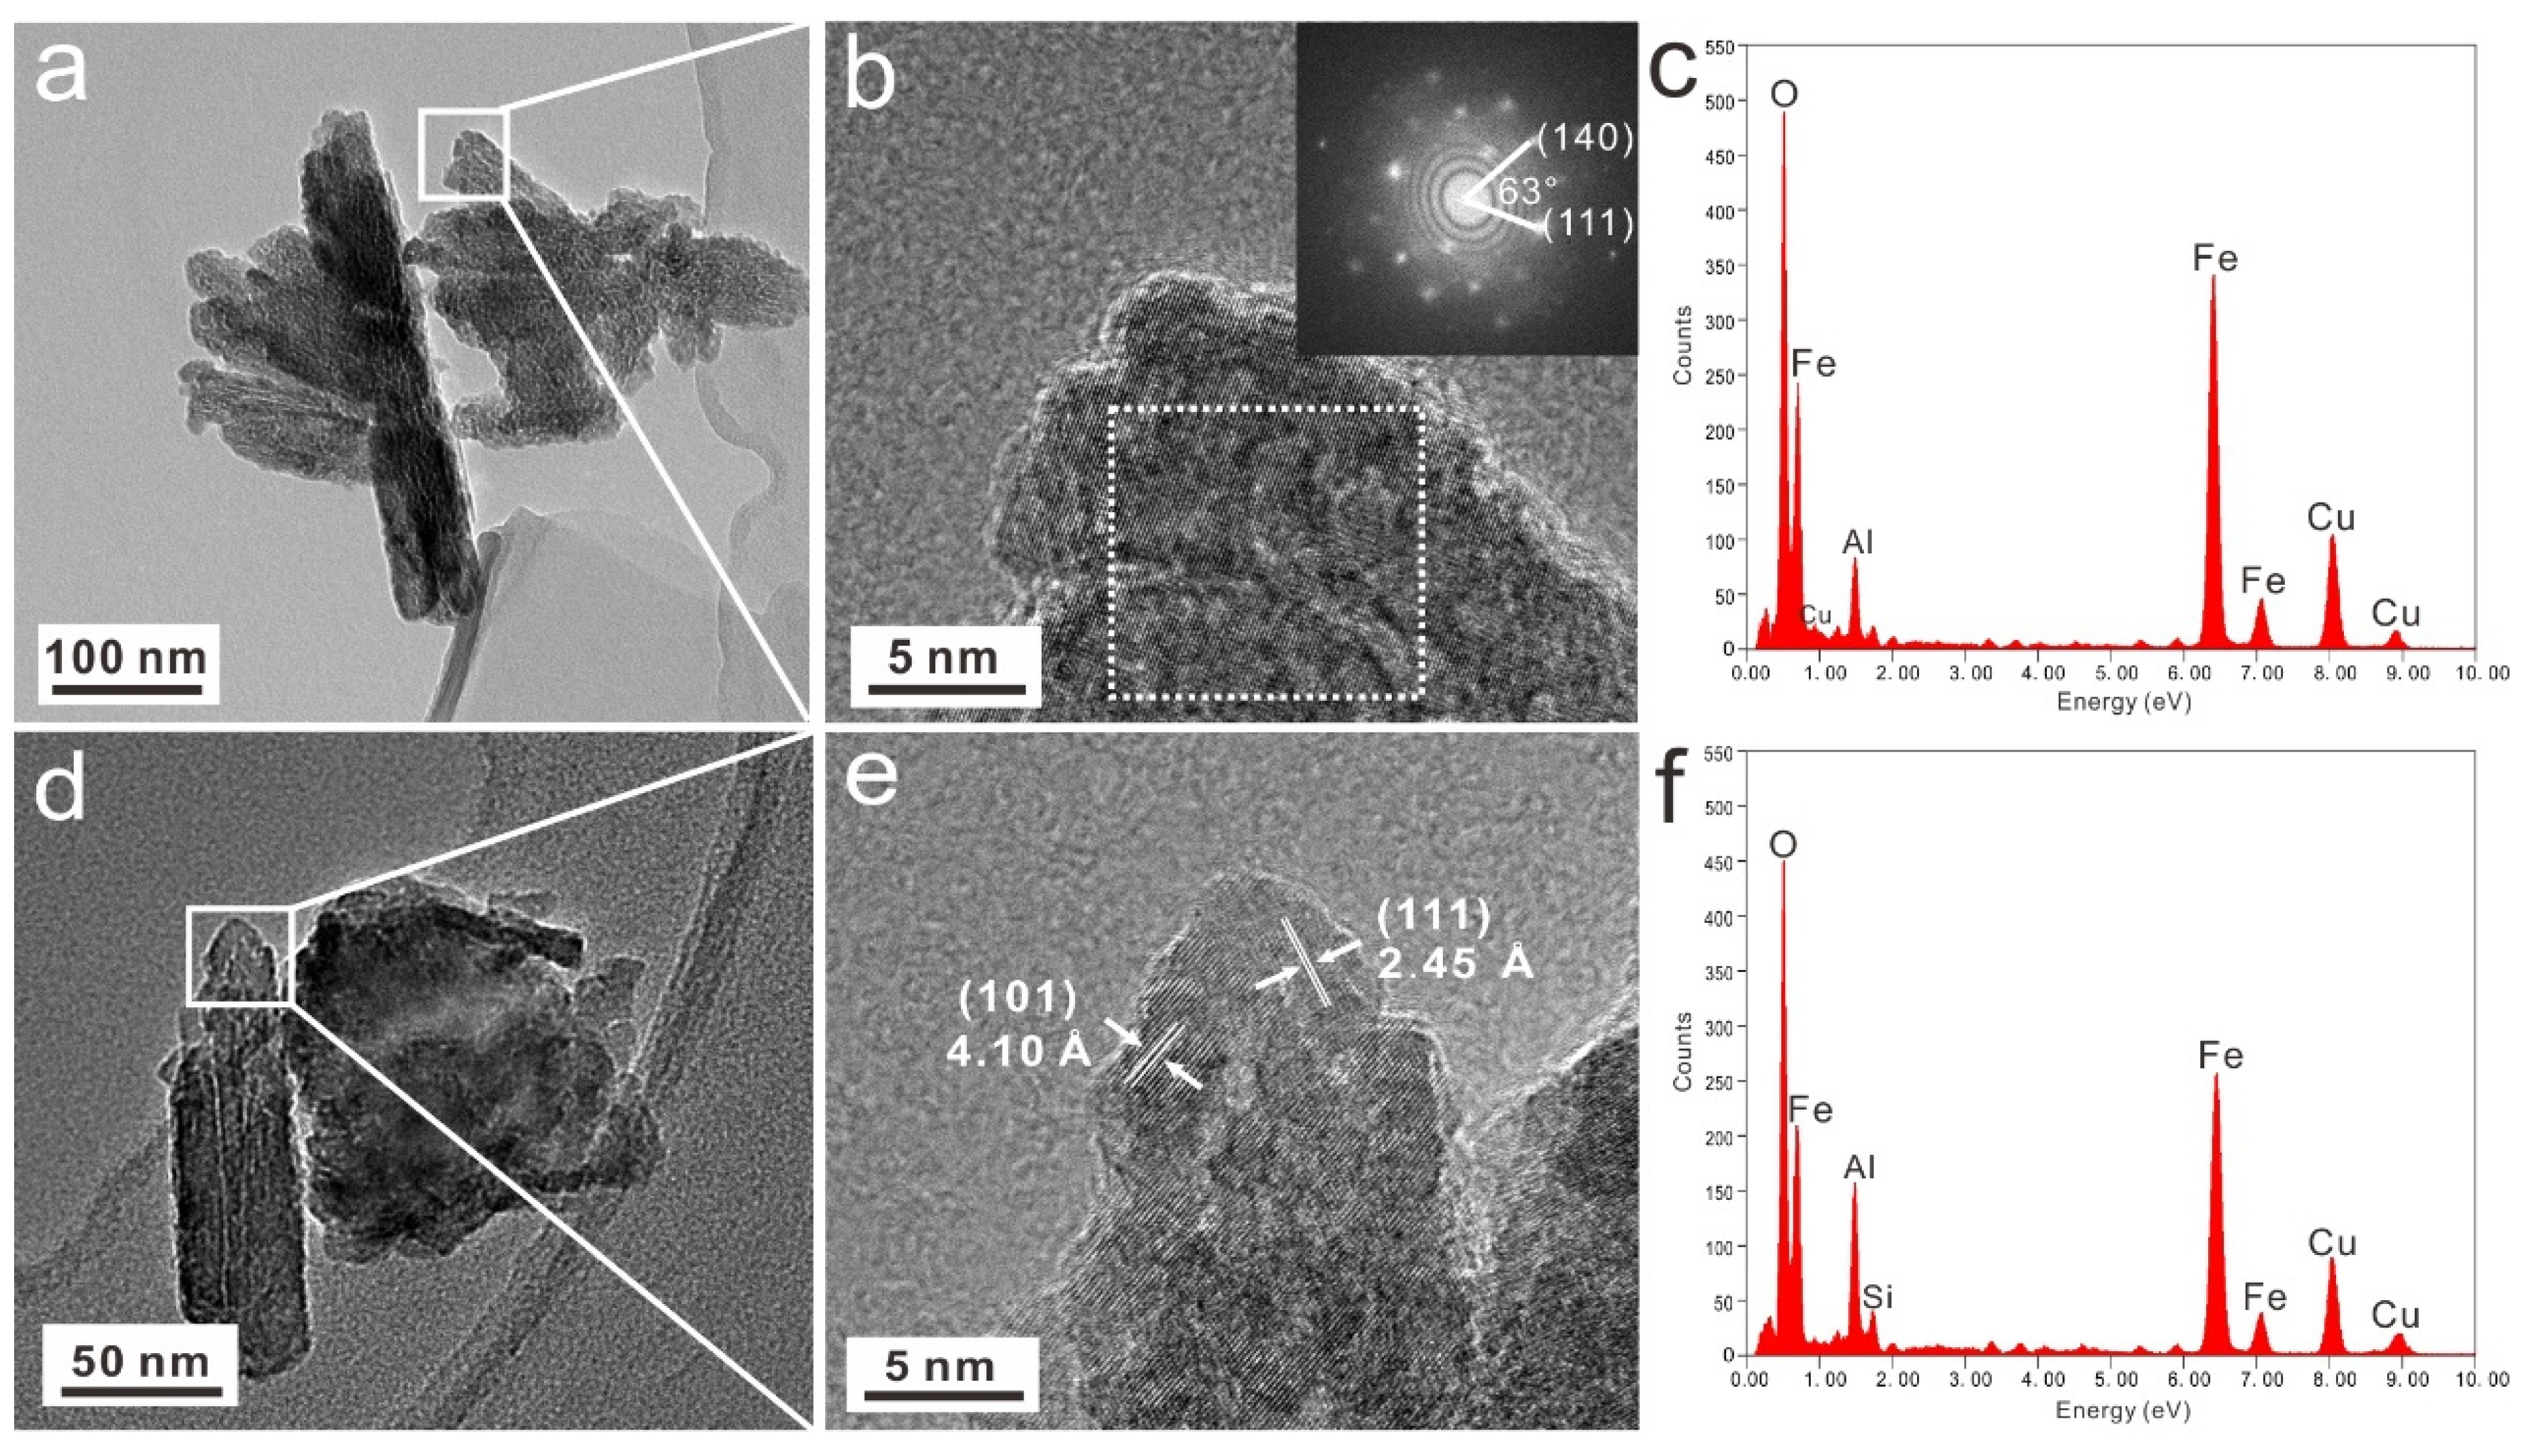
3.2. TEM Analysis
3.3. XRF Analysis
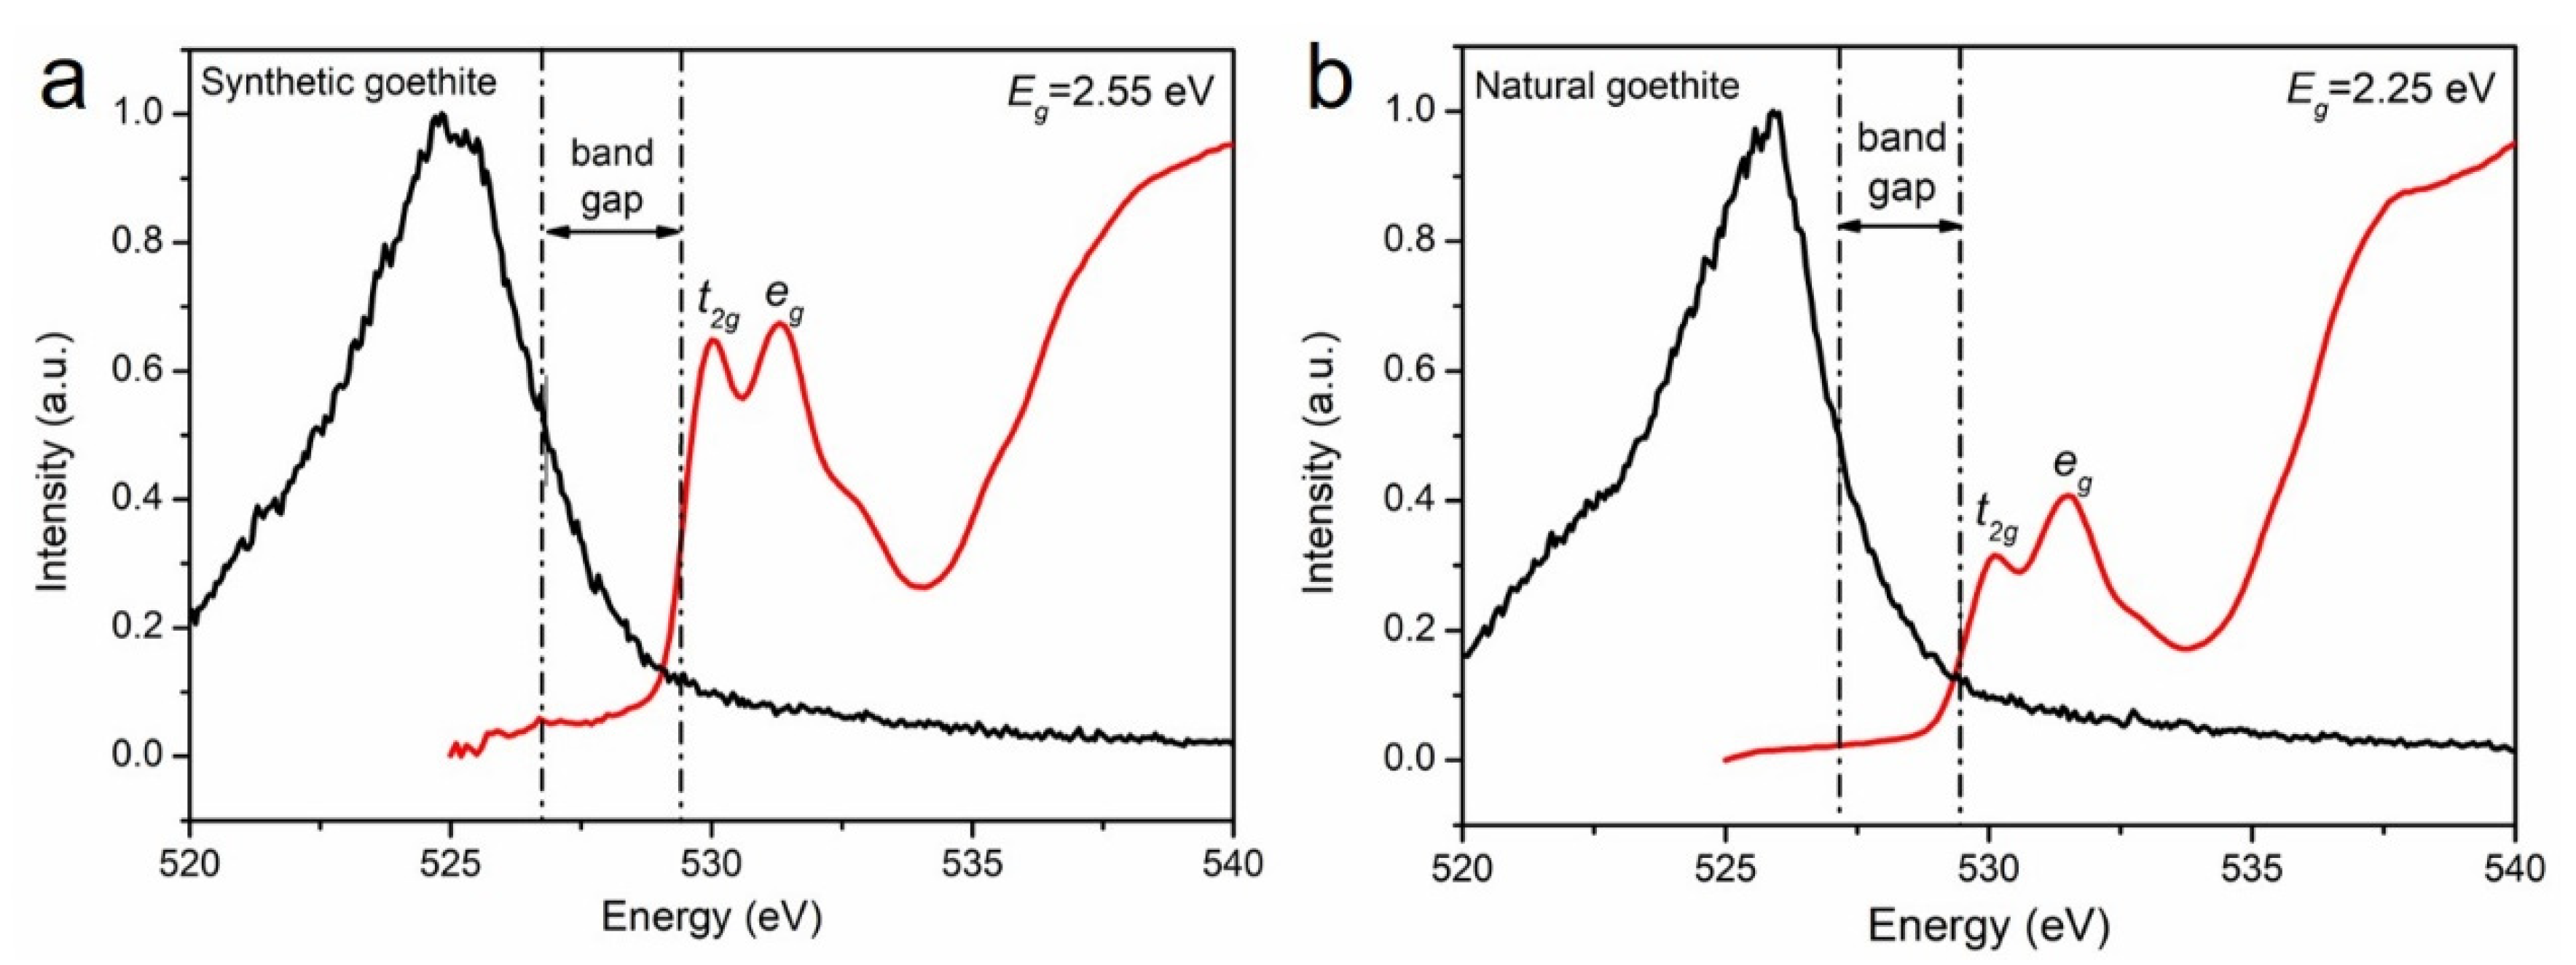
3.4. XAS and XES Analysis
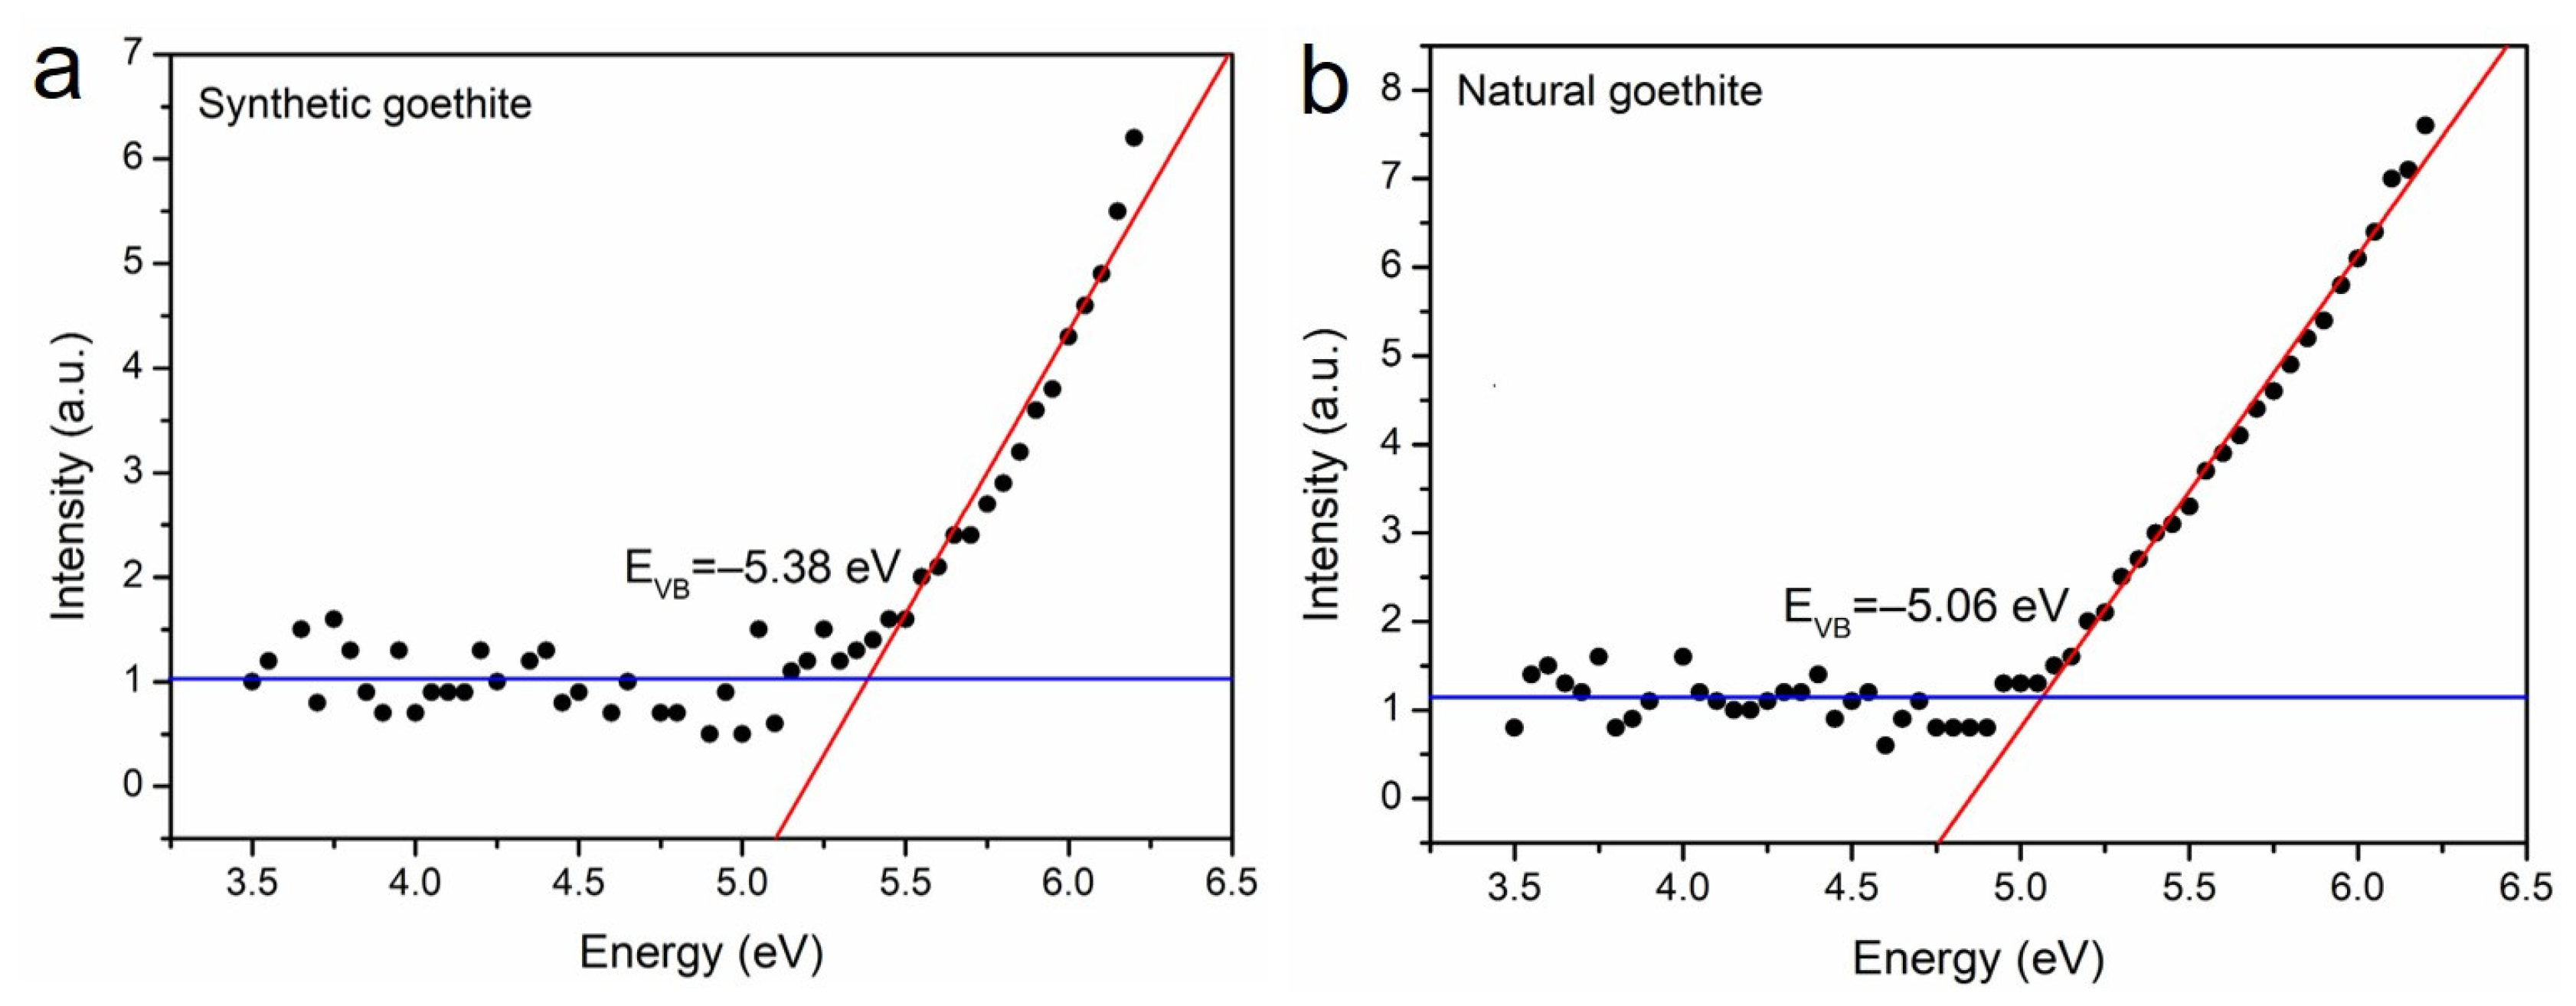
3.5. PS Analysis
3.6. Density Functional Calculations
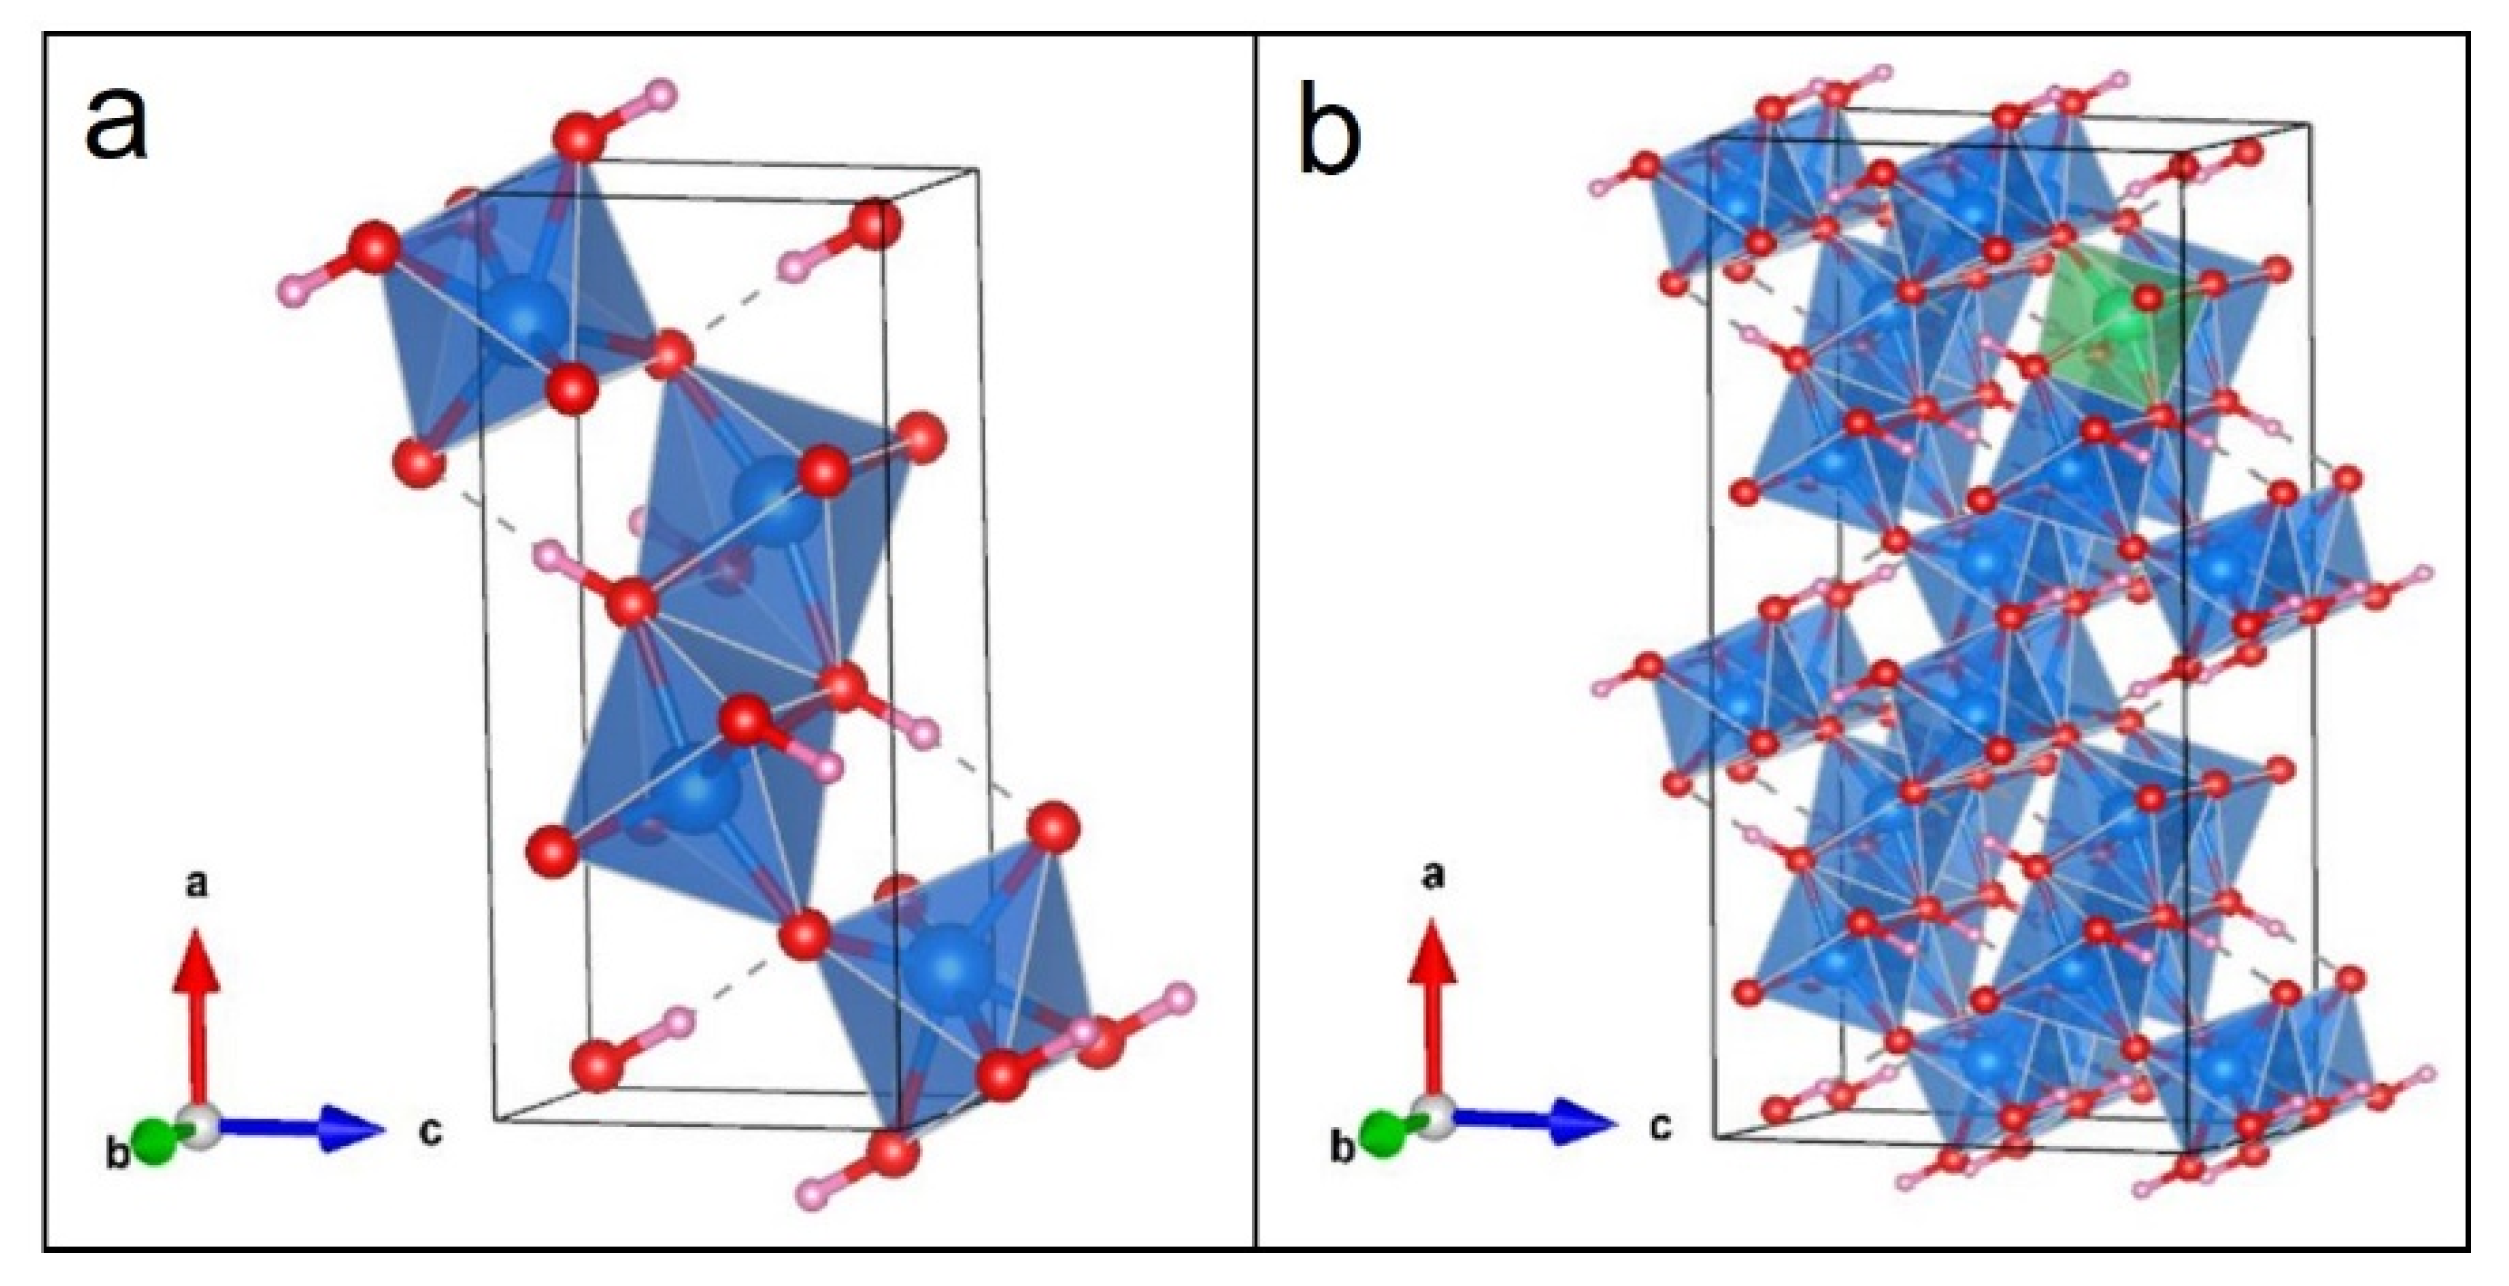
3.6.1. Building the Crystal Models
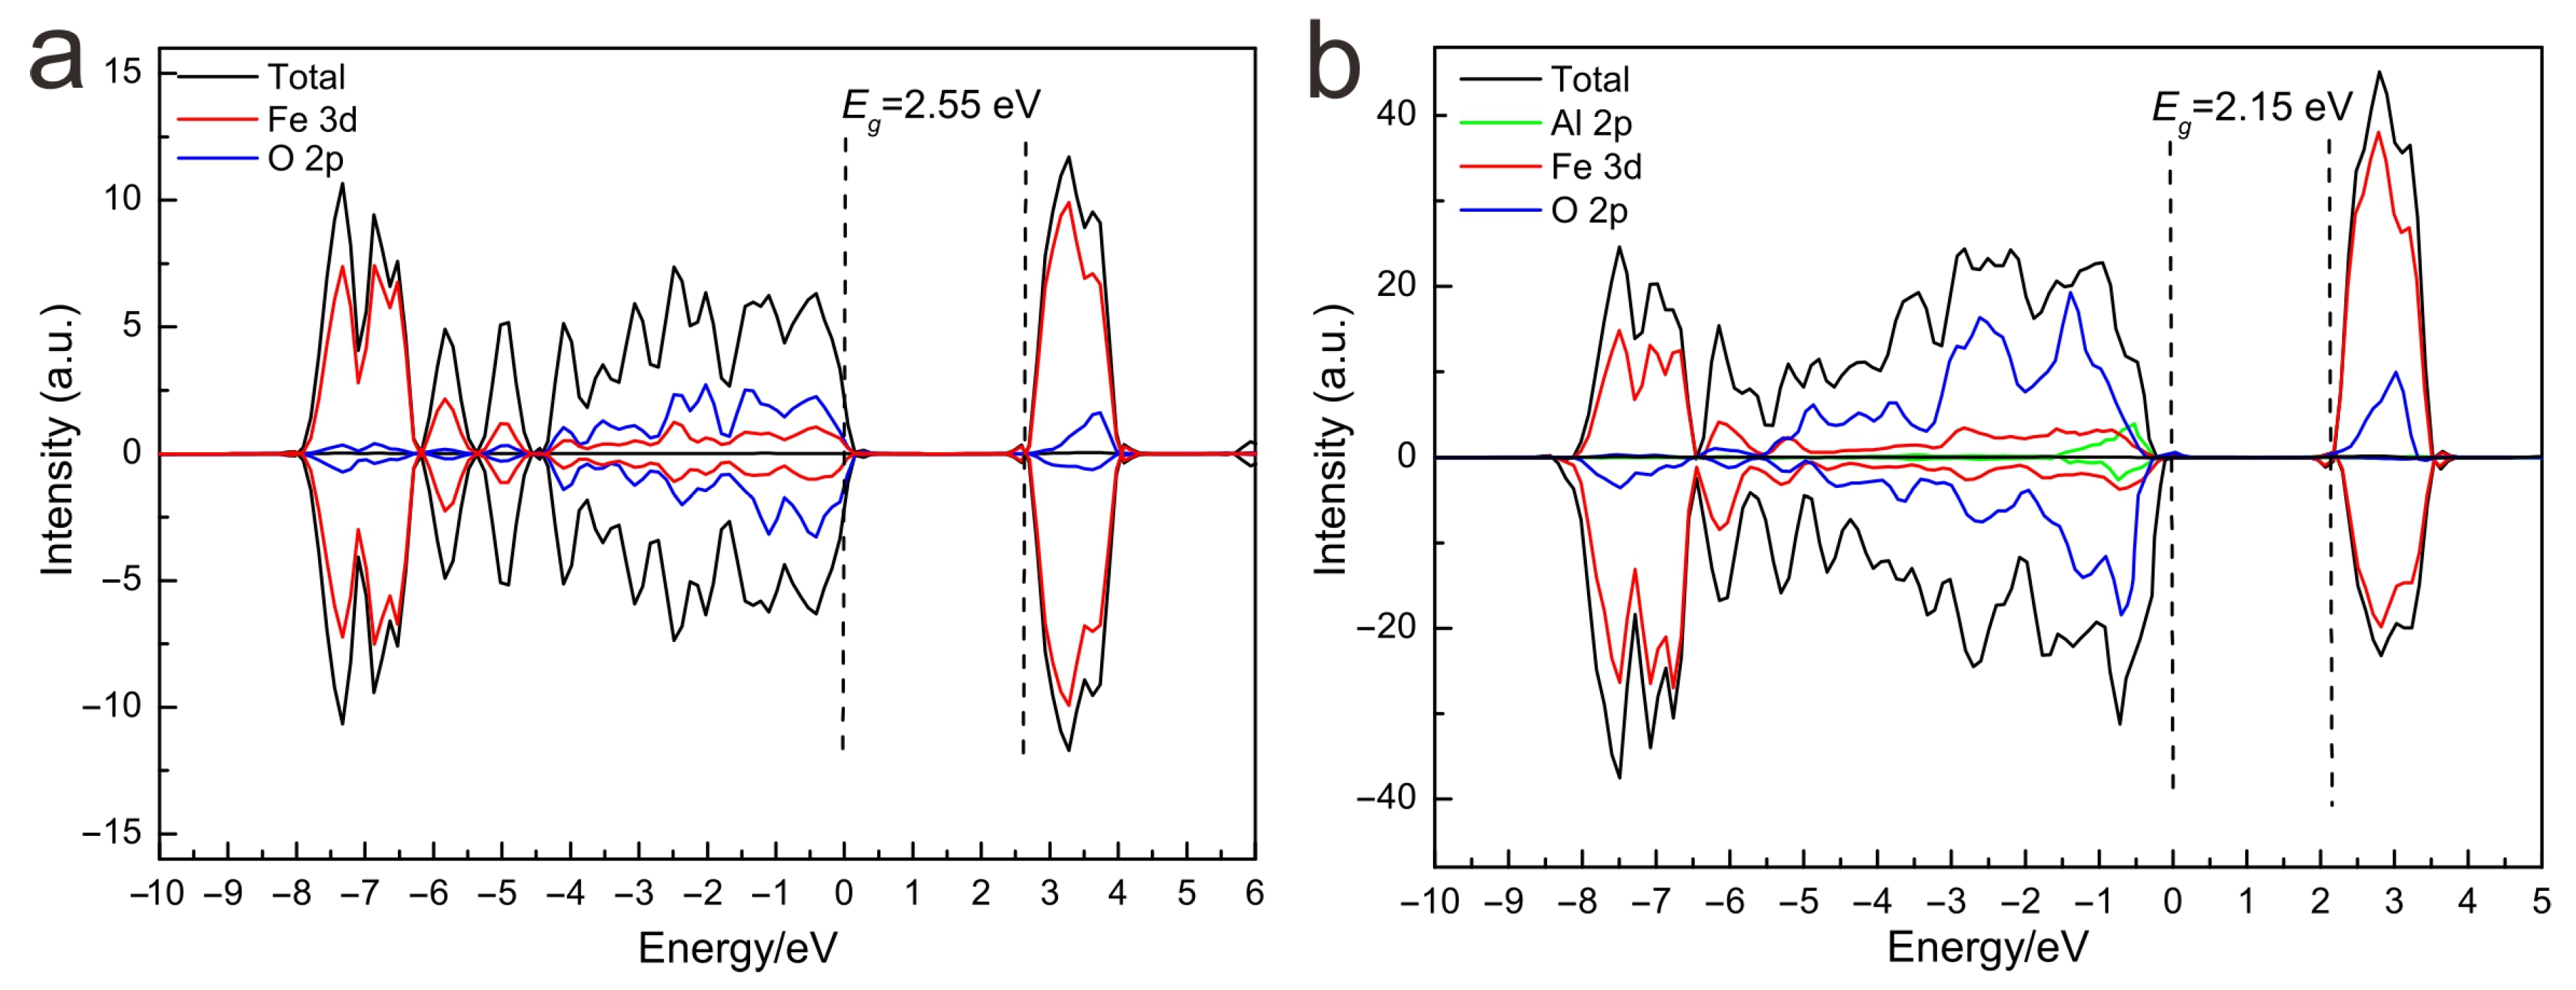
3.6.2. Electronic Structure of Different Models
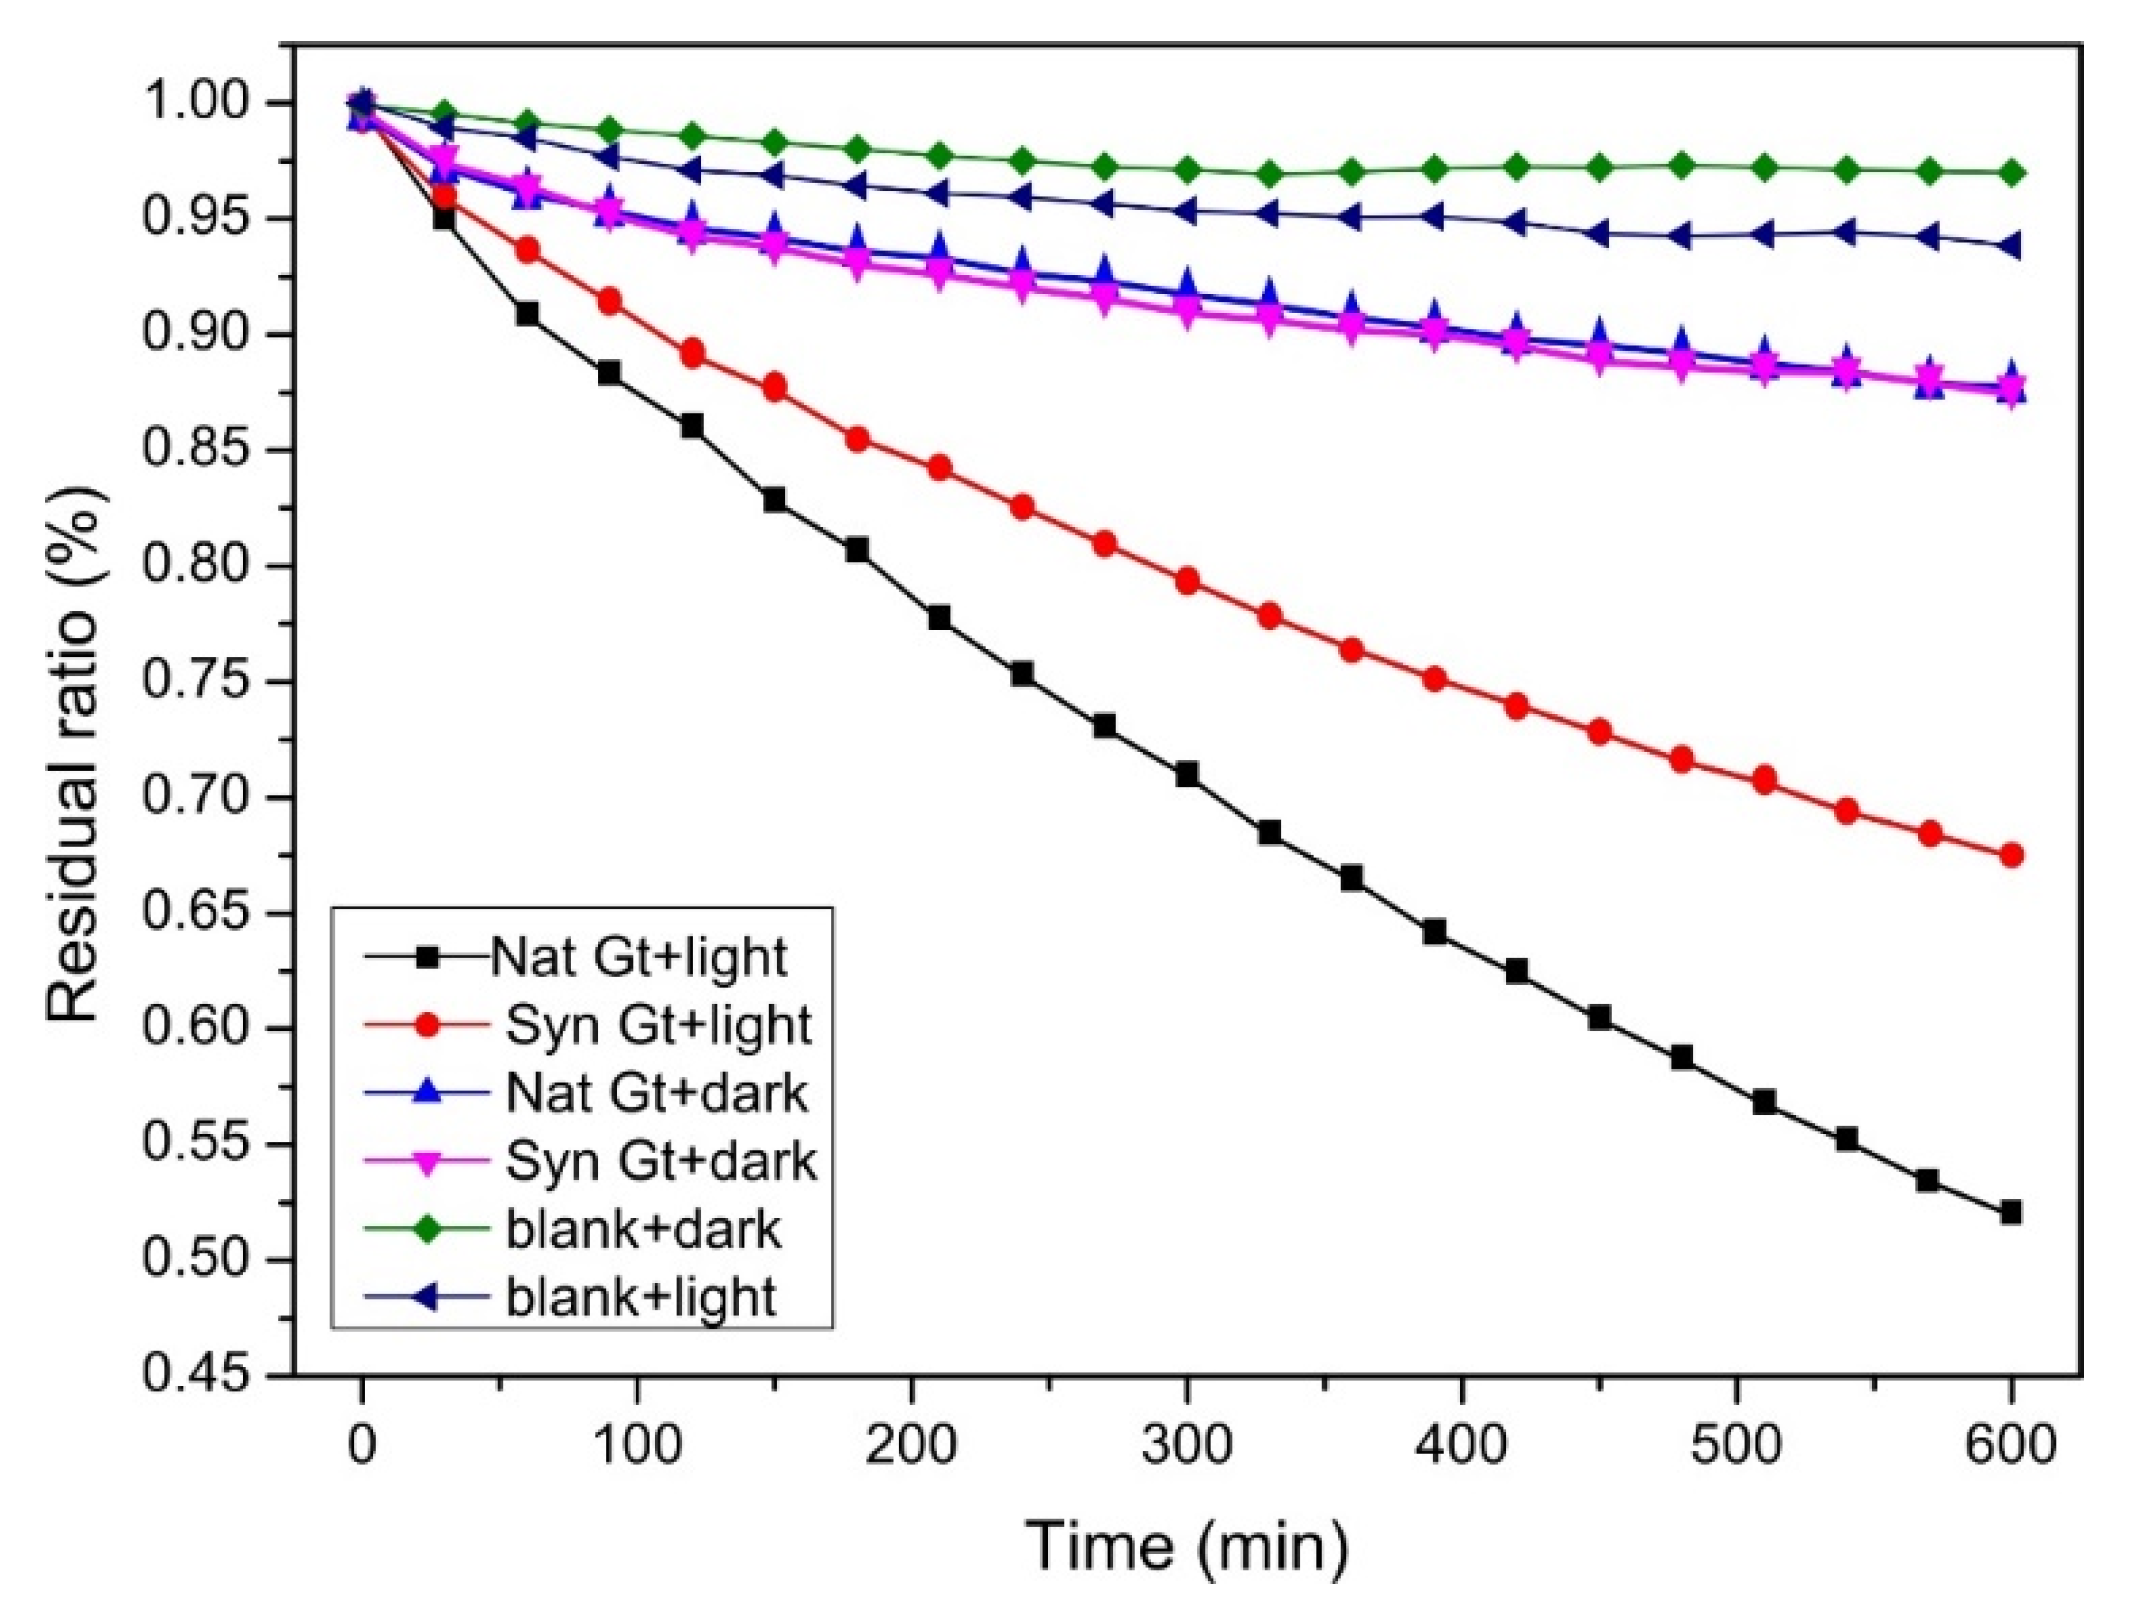
3.7. Photochemical Degradation of Methyl Orange
4. Discussion
5. Conclusions
Supplementary Materials
Author Contributions
Funding
Institutional Review Board Statement
Informed Consent Statement
Data Availability Statement
Conflicts of Interest
References
- Cornell, R.M.; Schwertmann, U. The Iron Oxides: Structure, Properties, Reactions, Occurrences and Uses; John Wiley & Sons: Hoboken, NJ, USA, 2003. [Google Scholar]
- Goldsmith, Y.; Stein, M.; Enzel, Y. From dust to varnish: Geochemical constraints on rock varnish formation in the Negev Desert, Israel. Geochim. Cosmochim. Acta 2014, 126, 97–111. [Google Scholar] [CrossRef]
- Li, Y.; Ding, H.; Lu, A.; Wang, H.; Yang, X.; Xu, X. Mineralogical Characteristics of Fe–Mn Cutans in Yellow Brown Earth of Wuhan, China. J. Nanosci. Nanotechnol. 2017, 17, 6873–6880. [Google Scholar] [CrossRef]
- Beukes, N.; Gutzmer, J.; Mukhopadhyay, J. The geology and genesis of high-grade hematite iron ore deposits. Appl. Earth Sci. 2003, 112, 18–25. [Google Scholar] [CrossRef]
- Kleja, D.B.; van Schaik, J.W.; Persson, I.; Gustafsson, J.P. Characterization of iron in floating surface films of some natural waters using EXAFS. Chem. Geol. 2012, 326-327, 19–26. [Google Scholar] [CrossRef] [Green Version]
- Lee, S.; Xu, H. XRD and TEM studies on nanophase manganese oxides in freshwater ferromanganese nodules from Green Bay, Lake Michigan. Clays Clay Miner. 2016, 64, 523–536. [Google Scholar] [CrossRef]
- Wright, G.; Czelusta, J. Mineral resources and economic development. In Proceedings of the Conference on Sector Reform in Latin America, Stanford Center for International Development, Palo Alto, CA, USA, 13–15 November 2003. [Google Scholar]
- Huang, L.; Hong, J.; Tan, W.; Hu, H.; Liu, F.; Wang, M. Characteristics of micromorphology and element distribution of iron–manganese cutans in typical soils of subtropical China. Geoderma 2008, 146, 40–47. [Google Scholar] [CrossRef]
- Liu, T.; Broecker, W.S.; Stein, M. Rock varnish evidence for a Younger Dryas wet period in the Dead Sea basin. Geophys. Res. Lett. 2013, 40, 2229–2235. [Google Scholar] [CrossRef] [Green Version]
- Pan, B.; Hui, Q.; Pan, B.; Nie, G.; Xiao, L.; Lu, L.; Zhang, W.; Zhang, Q.; Zheng, S. Highly efficient removal of heavy metals by polymer-supported nanosized hydrated Fe(III) oxides: Behavior and XPS study. Water Res. 2010, 44, 815–824. [Google Scholar] [CrossRef]
- Hua, M.; Zhang, S.; Pan, B.; Zhang, W.; Lv, L.; Zhang, Q. Heavy metal removal from water/wastewater by nanosized metal oxides: A review. J. Hazard. Mater. 2012, 211–212, 317–331. [Google Scholar] [CrossRef]
- Sherman, D.M. Electronic structures of iron(III) and manganese(IV) (hydr)oxide minerals: Thermodynamics of photochemical reductive dissolution in aquatic environments. Geochim. Cosmochim. Acta 2005, 69, 3249–3255. [Google Scholar] [CrossRef]
- Georgiou, C.D.; Sun, H.J.; McKay, C.P.; Grintzalis, K.; Papapostolou, I.; Zisimopoulos, D.; Panagiotidis, K.; Zhang, G.; Koutsopoulou, E.; Christidis, G.E.; et al. Evidence for photochemical production of reactive oxygen species in desert soils. Nat. Commun. 2015, 6, 7100. [Google Scholar] [CrossRef] [PubMed] [Green Version]
- Lan, S.; Wang, X.; Xiang, Q.; Yin, H.; Tan, W.; Qiu, G.; Liu, F.; Zhang, J.; Feng, X. Mechanisms of Mn(II) catalytic oxidation on ferrihydrite surfaces and the formation of manganese (oxyhydr)oxides. Geochim. Cosmochim. Acta 2017, 211, 79–96. [Google Scholar] [CrossRef]
- Xu, X.; Li, Y.; Li, Y.; Lu, A.; Qiao, R.; Liu, K.; Ding, H.; Wang, C. Characteristics of desert varnish from nanometer to micrometer scale: A photo-oxidation model on its formation. Chem. Geol. 2019, 522, 55–70. [Google Scholar] [CrossRef]
- Jung, H.; Xu, X.; Wan, B.; Wang, Q.; Borkiewicz, O.J.; Li, Y.; Chen, H.; Lu, A.; Tang, Y. Photocatalytic oxidation of dissolved Mn(II) on natural iron oxide minerals. Geochim. Cosmochim. Acta 2021, 312, 343–356. [Google Scholar] [CrossRef]
- Rodríguez, E.M.; Fernández, G.; Alvarez, P.; Hernández, R.; Beltrán, F.J. Photocatalytic degradation of organics in water in the presence of iron oxides: Effects of pH and light source. Appl. Catal. B Environ. 2011, 102, 572–583. [Google Scholar] [CrossRef]
- Wu, Y.; Luo, H.; Wang, H. Synthesis of iron(III)-based metal–organic framework/graphene oxide composites with increased photocatalytic performance for dye degradation. RSC Adv. 2014, 4, 40435–40438. [Google Scholar] [CrossRef]
- Kakuta, S.; Numata, T.; Okayama, T. Shape effects of goethite particles on their photocatalytic activity in the decomposition of acetaldehyde. Catal. Sci. Technol. 2014, 4, 164–169. [Google Scholar] [CrossRef]
- Zhang, H.; Bayne, M.; Fernando, S.; Legg, B.; Zhu, M.; Penn, R.L.; Banfield, J.F. Size-Dependent Bandgap of Nanogoethite. J. Phys. Chem. C 2011, 115, 17704–17710. [Google Scholar] [CrossRef]
- Liu, H.; Chen, T.; Zou, X.; Qing, C.; Frost, R.L. Thermal treatment of natural goethite: Thermal transformation and physical properties. Thermochim. Acta 2013, 568, 115–121. [Google Scholar] [CrossRef] [Green Version]
- Gilbert, B.; Kim, C.S.; Dong, C.; Guo, J.; Nico, P.S.; Shuh, D.K. Oxygen K-Edge Emission and Absorption Spectroscopy of Iron Oxyhydroxide Nanoparticles. In Proceedings of AIP Conference; American Institute of Physics: College Park, MD, USA, 2 February 2007. [Google Scholar]
- Perdew, J.P.; Burke, K.; Ernzerhof, M. Generalized gradient approximation made simple. Phys. Rev. Lett. 1996, 77, 3865–3868. [Google Scholar] [CrossRef] [Green Version]
- Forsyth, J.B.; Hedley, I.G.; Johnson, C.E. The magnetic structure and hyperfine field of goethite (α-FeOOH). J. Phys. C Solid State Phys. 1968, 1, 179. [Google Scholar] [CrossRef]
- Fitzpatrick, R.; Schwertmann, U. Al-substituted goethite—An indicator of pedogenic and other weathering environments in South Africa. Geoderma 1982, 27, 335–347. [Google Scholar] [CrossRef]
- Manceau, A.; Schlegel, M.; Musso, M.; Sole, V.; Gauthier, C.; Petit, P.; Trolard, F. Crystal chemistry of trace elements in natural and synthetic goethite. Geochim. Cosmochim. Acta 2000, 64, 3643–3661. [Google Scholar] [CrossRef]
- Xu, X.; Ding, H.; Li, Y.; Wang, H.; Lu, A. The Micro-Scaled Characterization of Natural Terrestrial Ferromanganese Coatings and Their Semiconducting Properties. Coatings 2020, 10, 666. [Google Scholar] [CrossRef]
- Xu, Y.; Schoonen, M.A. The absolute energy positions of conduction and valence bands of selected semiconducting minerals. Am. Miner. 2000, 85, 543–556. [Google Scholar] [CrossRef]
- Gualtieri, A.F.; Venturelli, P. In situ study of the goethite-hematite phase transformation by real time synchrotron powder diffraction. Am. Miner. 1999, 84, 895–904. [Google Scholar] [CrossRef]
- Anisimov, V.I.; Aryasetiawan, F.; Lichtenstein, A.I. First-principles calculations of the electronic structure and spectra of strongly correlated systems: The LDA + U method. J. Phys. Condens. Matter 1997, 9, 7359–7367. [Google Scholar] [CrossRef]
- Fuente, S.A.; Belelli, P.G.; Castellani, N.J. LDA+U and GGA+U studies of Al-rich and bulk goethite (α-FeOOH). Mater. Chem. Phys. 2013, 137, 1012–1020. [Google Scholar] [CrossRef]
- Scanlon, D.O.; Dunnill, C.W.; Buckeridge, J.; Shevlin, S.A.; Logsdail, A.J.; Woodley, S.M.; Catlow, C.R.A.; Powell, M.J.; Palgrave, R.G.; Parkin, I.; et al. Band alignment of rutile and anatase TiO2. Nat. Mater. 2013, 12, 798–801. [Google Scholar] [CrossRef]
- Ansari, S.A.; Khan, M.M.; Ansari, M.O.; Kalathil, S.; Lee, J.; Cho, M.H. Band gap engineering of CeO2 nanostructure using an electrochemically active biofilm for visible light applications. RSC Adv. 2014, 4, 16782–16791. [Google Scholar] [CrossRef]

| Sample | Fe2O3 | SiO2 | Al2O3 | MgO | CaO | K2O | Na2O | P2O5 | LOI | Total |
|---|---|---|---|---|---|---|---|---|---|---|
| 1 | 83.17 | 2.62 | 1.06 | 0.11 | 0.07 | 0.02 | 0.12 | 0.26 | 11.39 | 98.82 |
| 2 | 80.79 | 3.35 | 1.12 | 0.13 | 0.06 | 0.05 | 0.00 | 0.29 | 12.30 | 98.09 |
| 3 | 80.57 | 3.46 | 1.33 | 0.11 | 0.03 | 0.01 | 0.02 | 0.17 | 12.34 | 98.04 |
| 4 | 79.91 | 3.60 | 1.41 | 0.18 | 0.07 | 0.02 | 0.18 | 0.26 | 12.52 | 98.15 |
| 5 | 82.60 | 3.80 | 2.12 | 0.02 | 0.04 | 0.02 | 0.06 | 0.21 | 8.86 | 97.73 |
| 6 | 77.71 | 4.05 | 3.21 | 0.05 | 0.04 | 0.32 | 0.00 | 0.38 | 11.51 | 97.27 |
| 7 | 82.28 | 3.63 | 1.17 | 0.01 | 0.03 | 0.01 | 0.18 | 0.16 | 10.33 | 97.80 |
| 8 | 82.93 | 3.02 | 1.46 | 0.04 | 0.05 | 0.15 | 0.05 | 0.09 | 10.78 | 98.57 |
| 9 | 84.79 | 1.32 | 2.28 | 0.02 | 0.06 | 0.02 | 0.03 | 0.15 | 10.45 | 99.12 |
| 10 | 81.52 | 3.28 | 1.85 | 0.14 | 0.05 | 0.15 | 0.00 | 0.05 | 10.15 | 97.19 |
| Average | 81.02 | 3.46 | 1.79 | 0.06 | 0.05 | 0.02 | 0.06 | 0.13 | 11.13 | 97.72 |
| Values | a (Å) | b (Å) | c (Å) | V (Å3) |
|---|---|---|---|---|
| Calculated | 10.02 | 3.03 | 4.65 | 141.18 |
| Experimental | 9.91 | 3.01 | 4.58 | 136.62 |
Publisher’s Note: MDPI stays neutral with regard to jurisdictional claims in published maps and institutional affiliations. |
© 2022 by the authors. Licensee MDPI, Basel, Switzerland. This article is an open access article distributed under the terms and conditions of the Creative Commons Attribution (CC BY) license (https://creativecommons.org/licenses/by/4.0/).
Share and Cite
Shao, Y.; Hu, G.; Liu, Z.; Xu, X.; Zhang, M.; Ding, C.; Li, Y. Determination of Band Structure of Naturally Occurring Goethite with Al Substitution: A Case Study of Zhushan Iron Zone. Materials 2022, 15, 1465. https://doi.org/10.3390/ma15041465
Shao Y, Hu G, Liu Z, Xu X, Zhang M, Ding C, Li Y. Determination of Band Structure of Naturally Occurring Goethite with Al Substitution: A Case Study of Zhushan Iron Zone. Materials. 2022; 15(4):1465. https://doi.org/10.3390/ma15041465
Chicago/Turabian StyleShao, Yan, Guofeng Hu, Zihao Liu, Xiaoming Xu, Mengqi Zhang, Cong Ding, and Yan Li. 2022. "Determination of Band Structure of Naturally Occurring Goethite with Al Substitution: A Case Study of Zhushan Iron Zone" Materials 15, no. 4: 1465. https://doi.org/10.3390/ma15041465
APA StyleShao, Y., Hu, G., Liu, Z., Xu, X., Zhang, M., Ding, C., & Li, Y. (2022). Determination of Band Structure of Naturally Occurring Goethite with Al Substitution: A Case Study of Zhushan Iron Zone. Materials, 15(4), 1465. https://doi.org/10.3390/ma15041465