
Experimental Assessment and Numerical Modeling of the Bond–Slip Correlation for Steel Rebars in r.c. Members


Abstract
1. Introduction
2. Bond–Slip Modeling in r.c. Structures
2.1. Analytical Modeling
2.2. Numerical Modeling
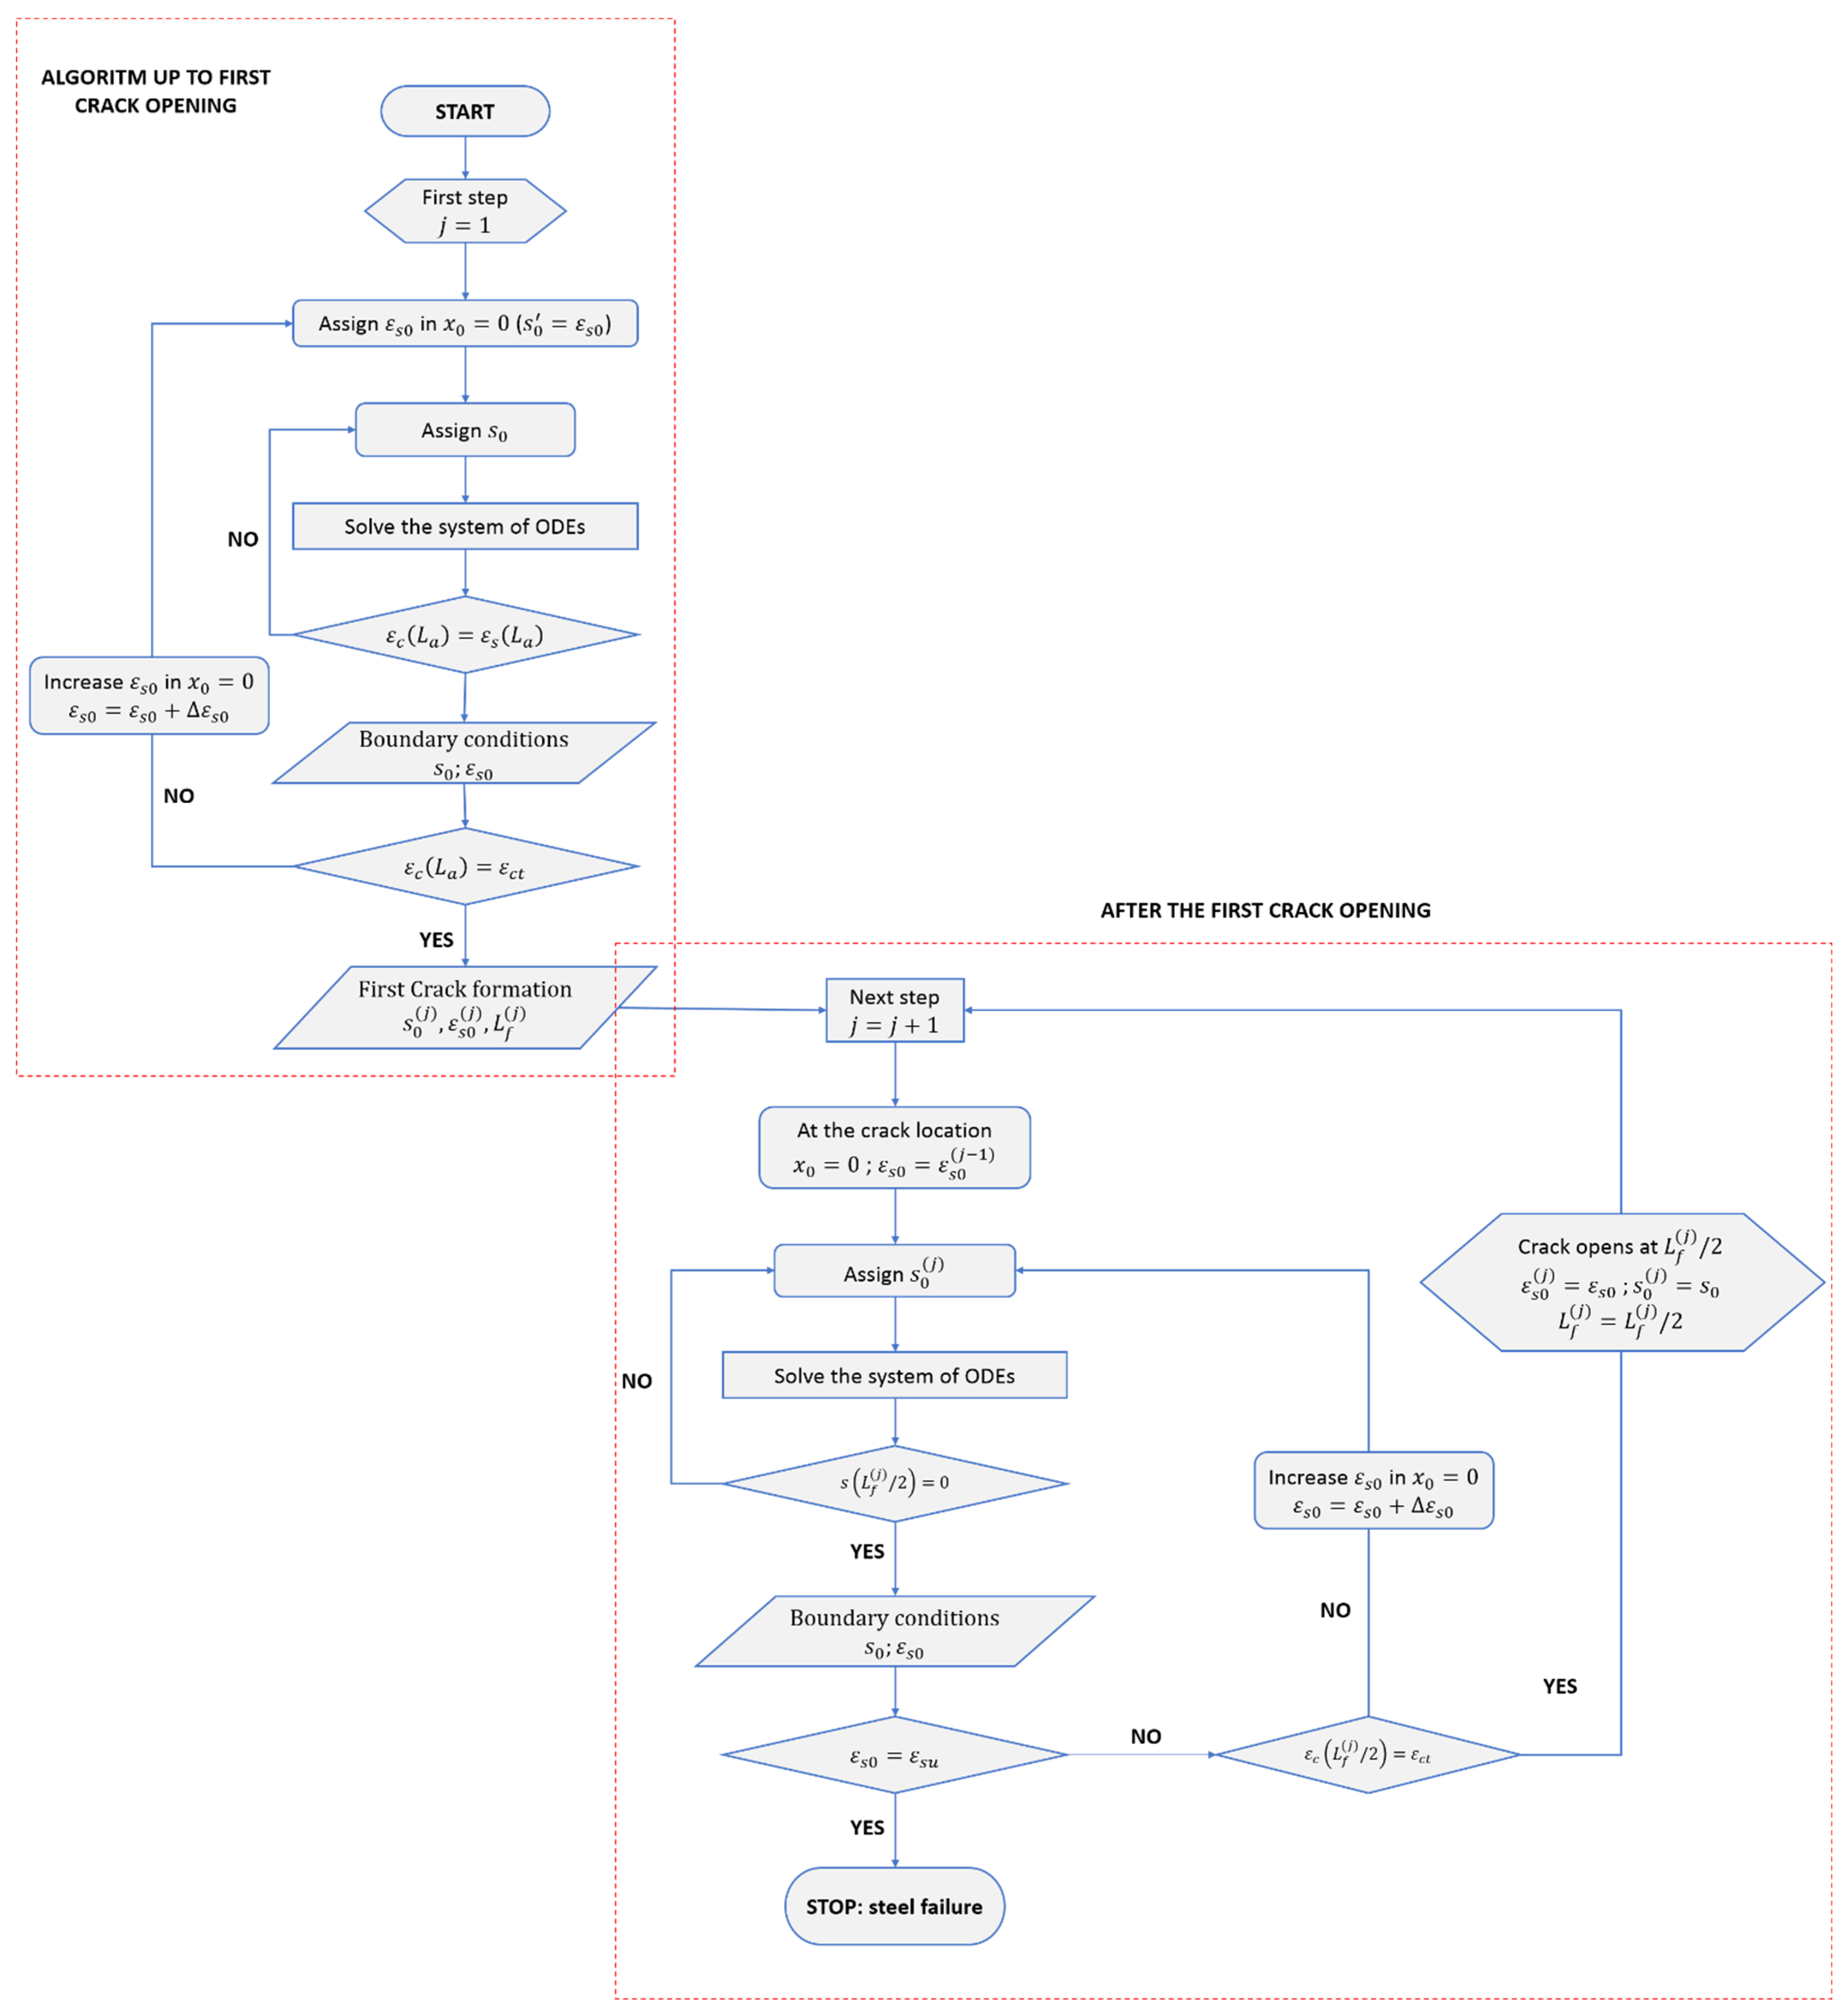
- the origin of the x-axis is set at the starting cross-section of the tie, , where , and half of the tie is subdivided into intervals of constant length ;
- the constitutive laws for steel and concrete under tensile stresses are assigned, as well as the bond–slip law and the function;
- tentative boundary conditions, and in , are assigned, and the bond and tensile stress, and , are evaluated using the previously defined bond–slip law and the steel constitutive law;
- the system of Equation (8) is integrated in the i-th interval using the Runge–Kutta 4th order method [28], determining the slip and the steel stress at the end of the interval ;
- the bond stress, , in is evaluated using the bond–slip law;
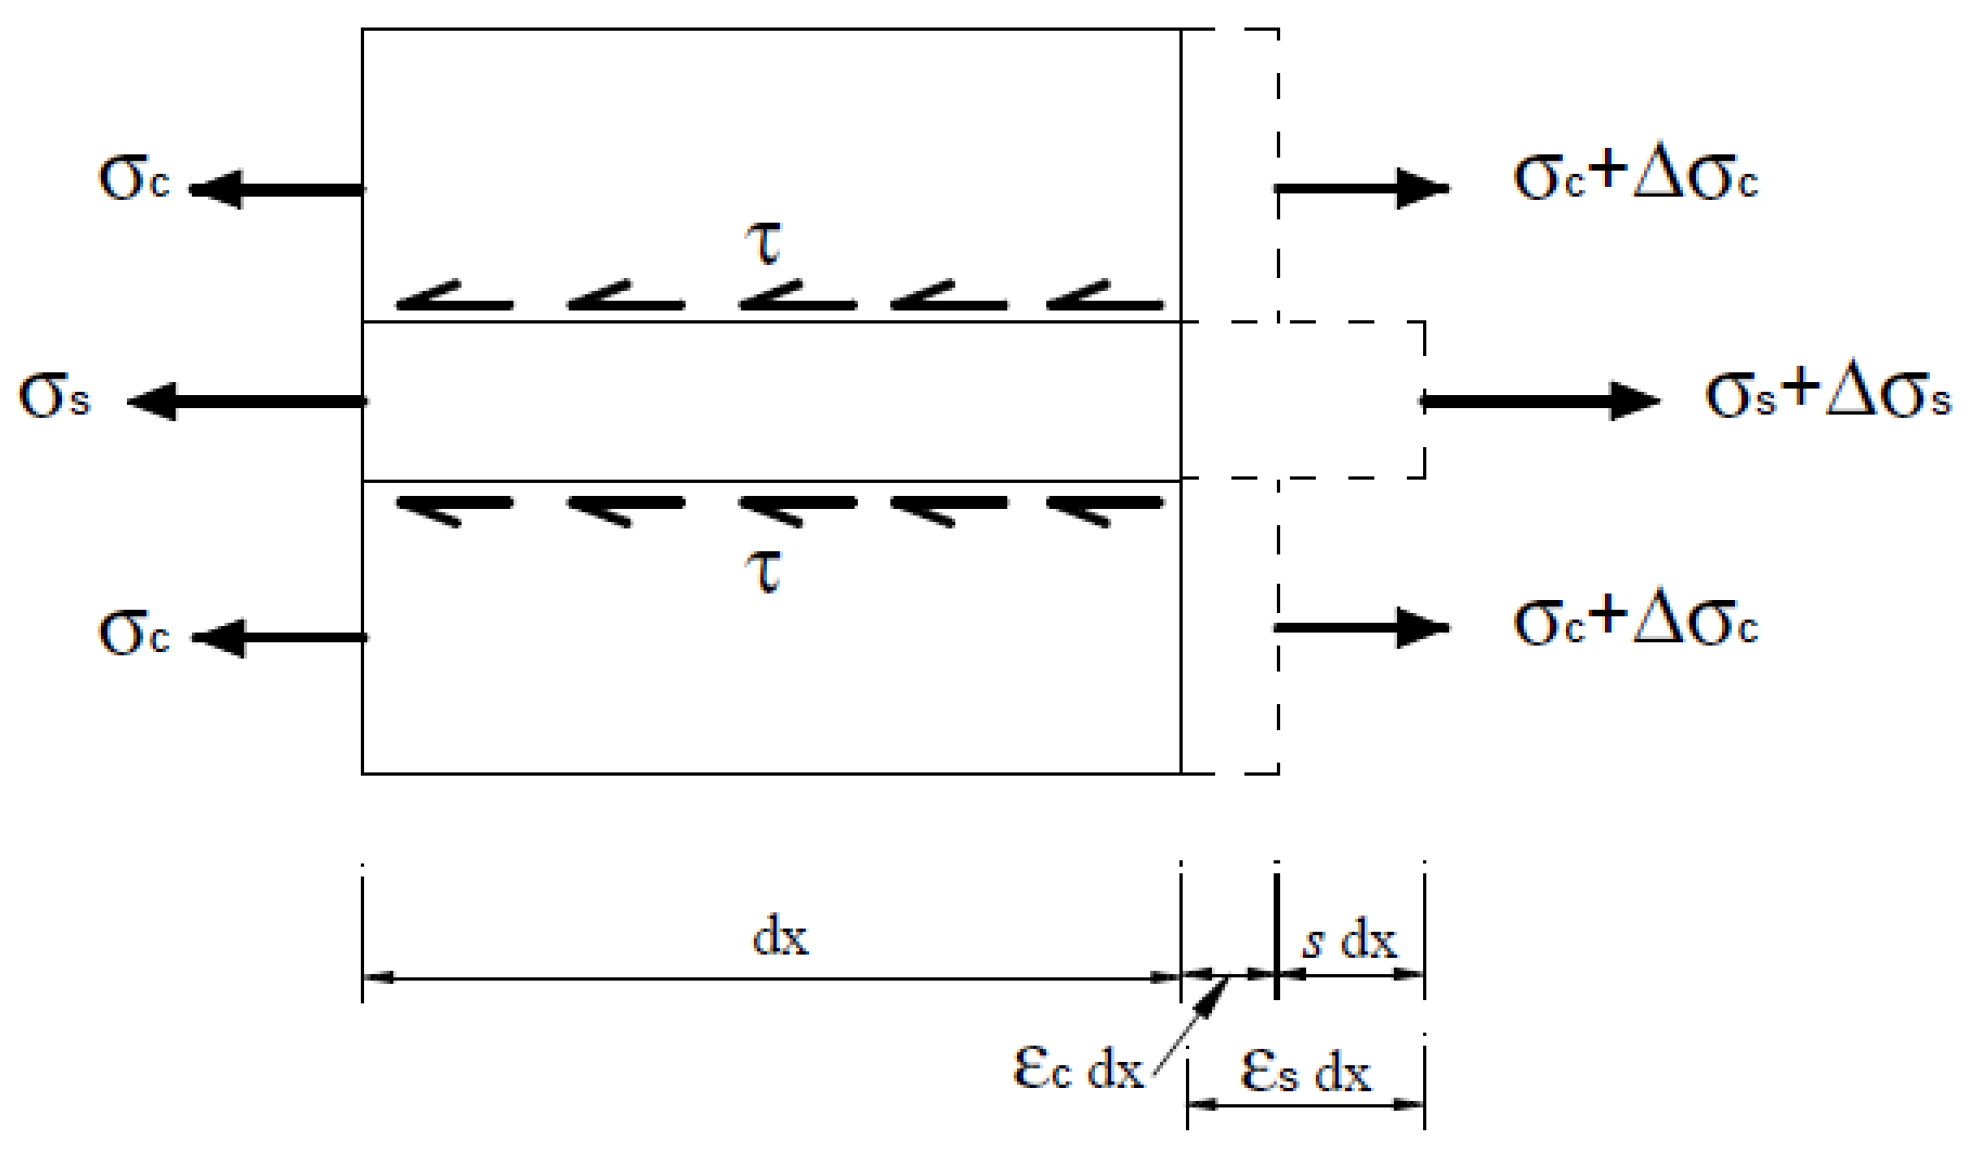
- the stress in the concrete section, , is calculated through the equilibrium condition
- the iteration is stopped when , and consequently , or when , and convergence is checked (see step 9);
- the process is iterated from step 4 for the next interval
- the convergence is checked—if the concrete strain can be considered equal to the steel strain for the assigned tolerance, in , convergence is achieved, but otherwise, a new value is assigned to , keeping the value of unchanged, and the process is iterated from step 3 till convergence. The search for is performed using one of the numerical root-finding methods, such as the secant method or the Newton–Raphson method;
- once the convergence is achieved, the actual value of is retained together with the actual transfer length
- 11.
- the origin of the x-axis is set at the starting cross-section of the considered portion of the tie, bounded by adjacent cracks spaced , and the half of the portion is subdivided into intervals of constant length ;
- 12.
- the boundary conditions and in are assigned following from the previous step, i.e., after the -th crack formation phase, leading to , and the bond stress and tensile stress are evaluated accordingly;
- 13.
- the system of ODEs in Equation (8) is solved by repeating the same procedure (steps 3 to 9) and checking convergence, which is achieved when slip vanishes at the midpoint of the tie, i.e., ;
- 14.
- if has reached the concrete ultimate tensile strain , a new crack opens at , otherwise the value of is increased and step 13 is repeated till the condition is satisfied. Once new crack opens, the new portion of the tie is set to and the process from 11 is iterated until the steel strain reaches the ultimate value .
3. Experimental Results
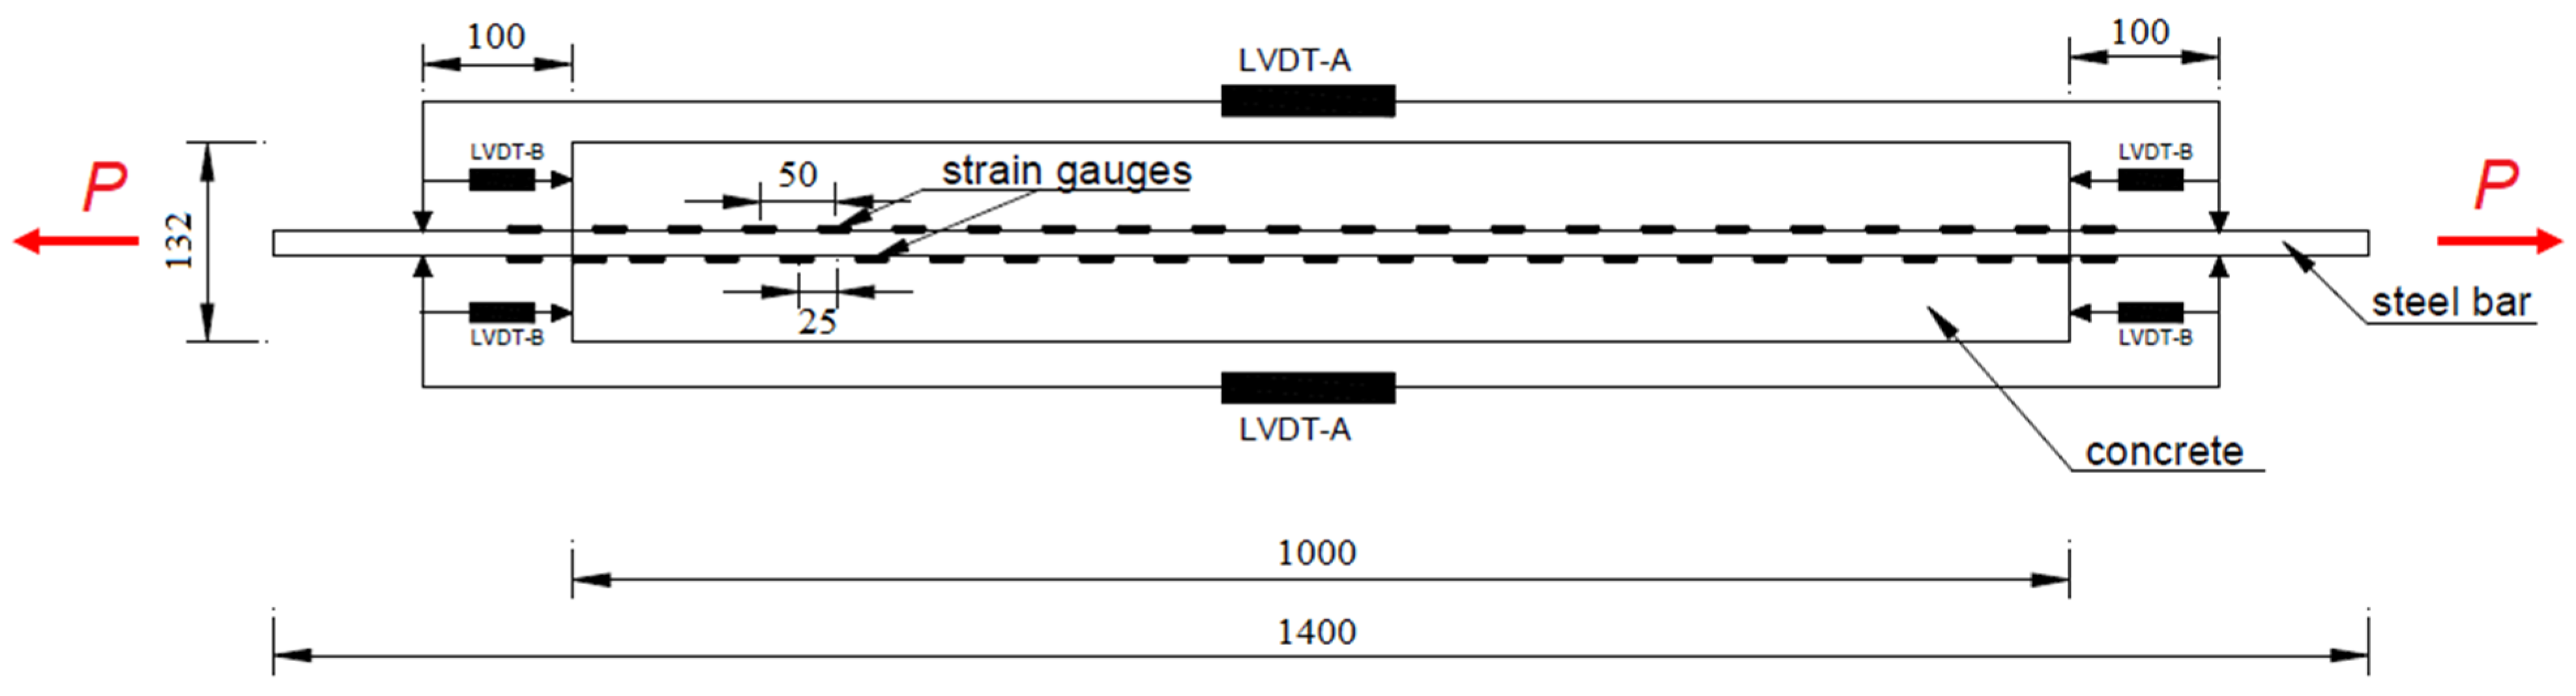
3.1. Long Specimen
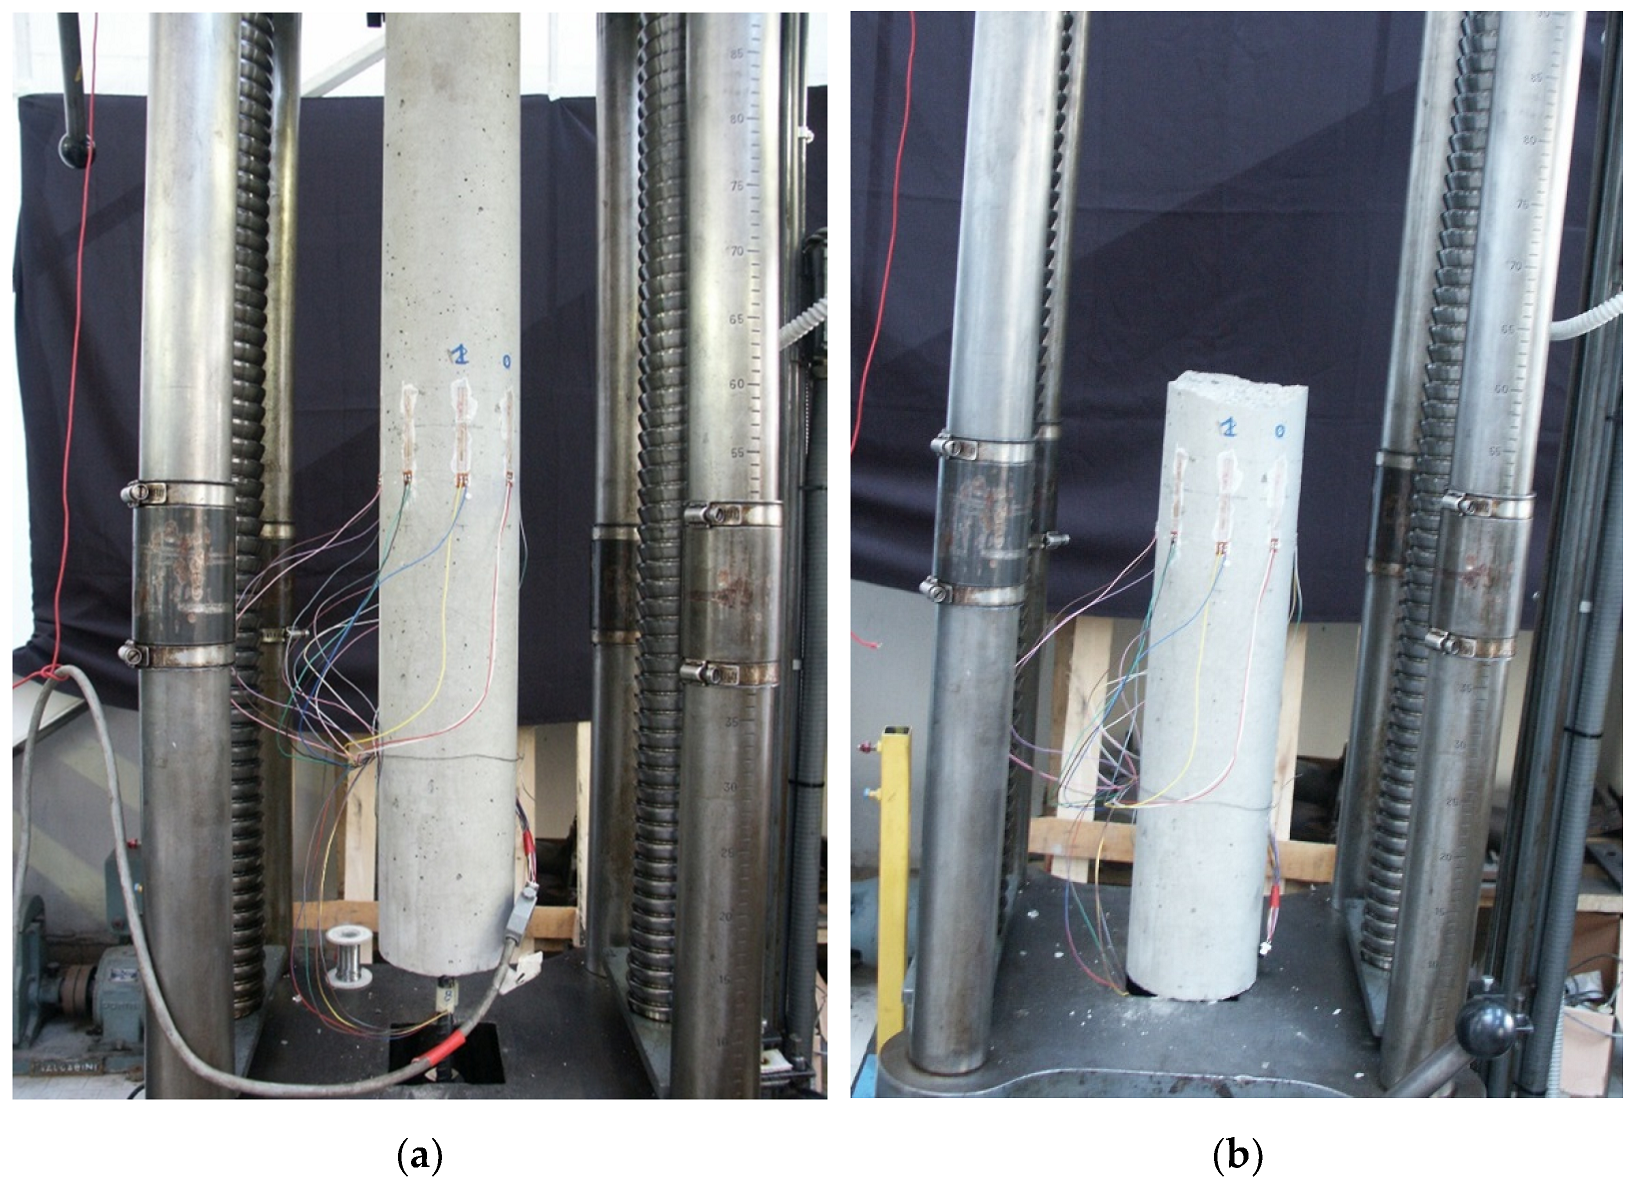
3.2. Short Specimen
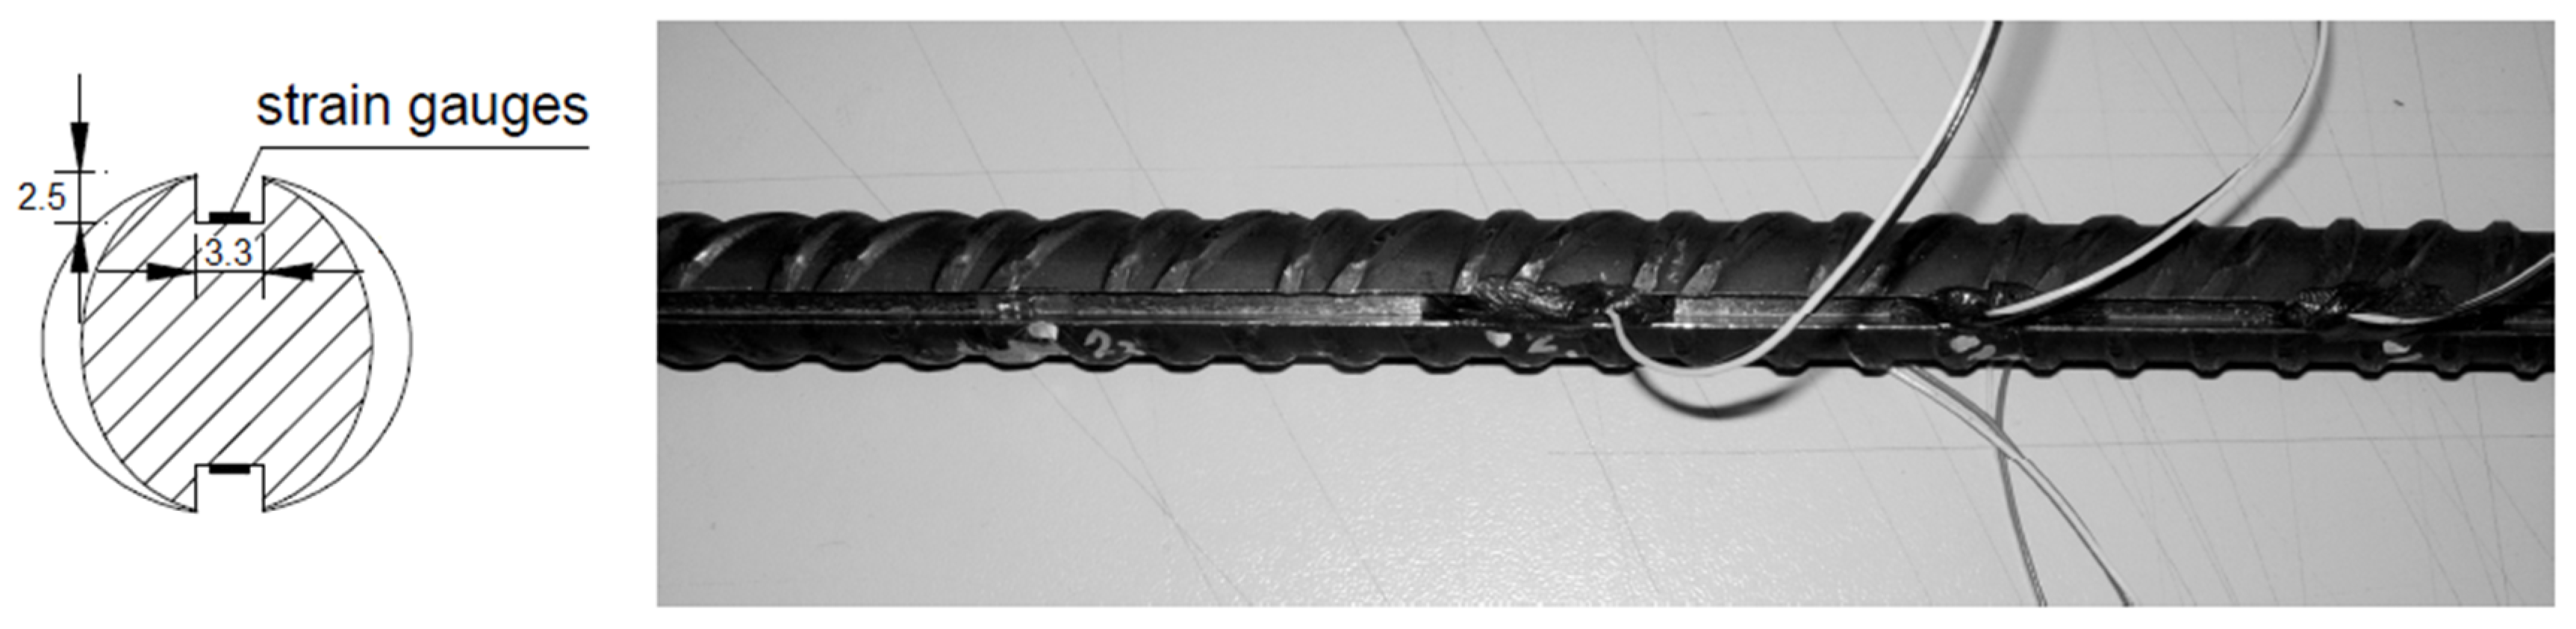
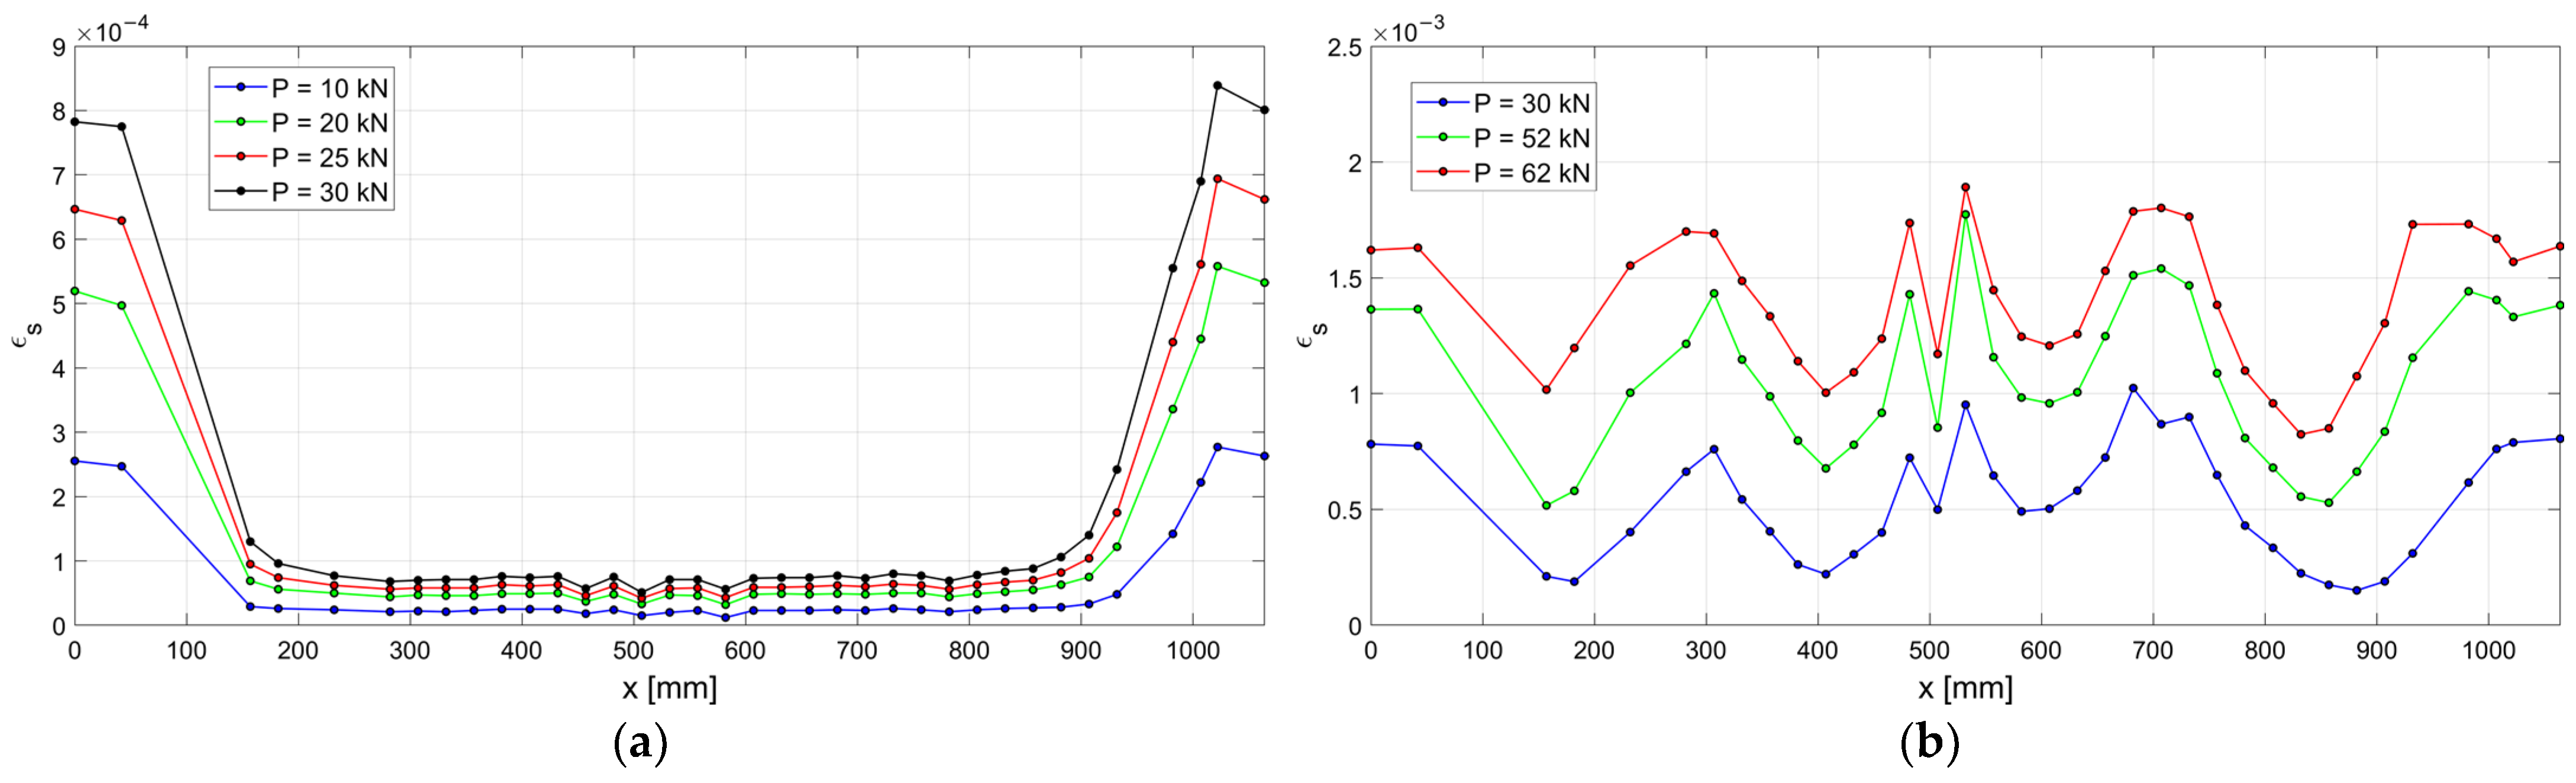
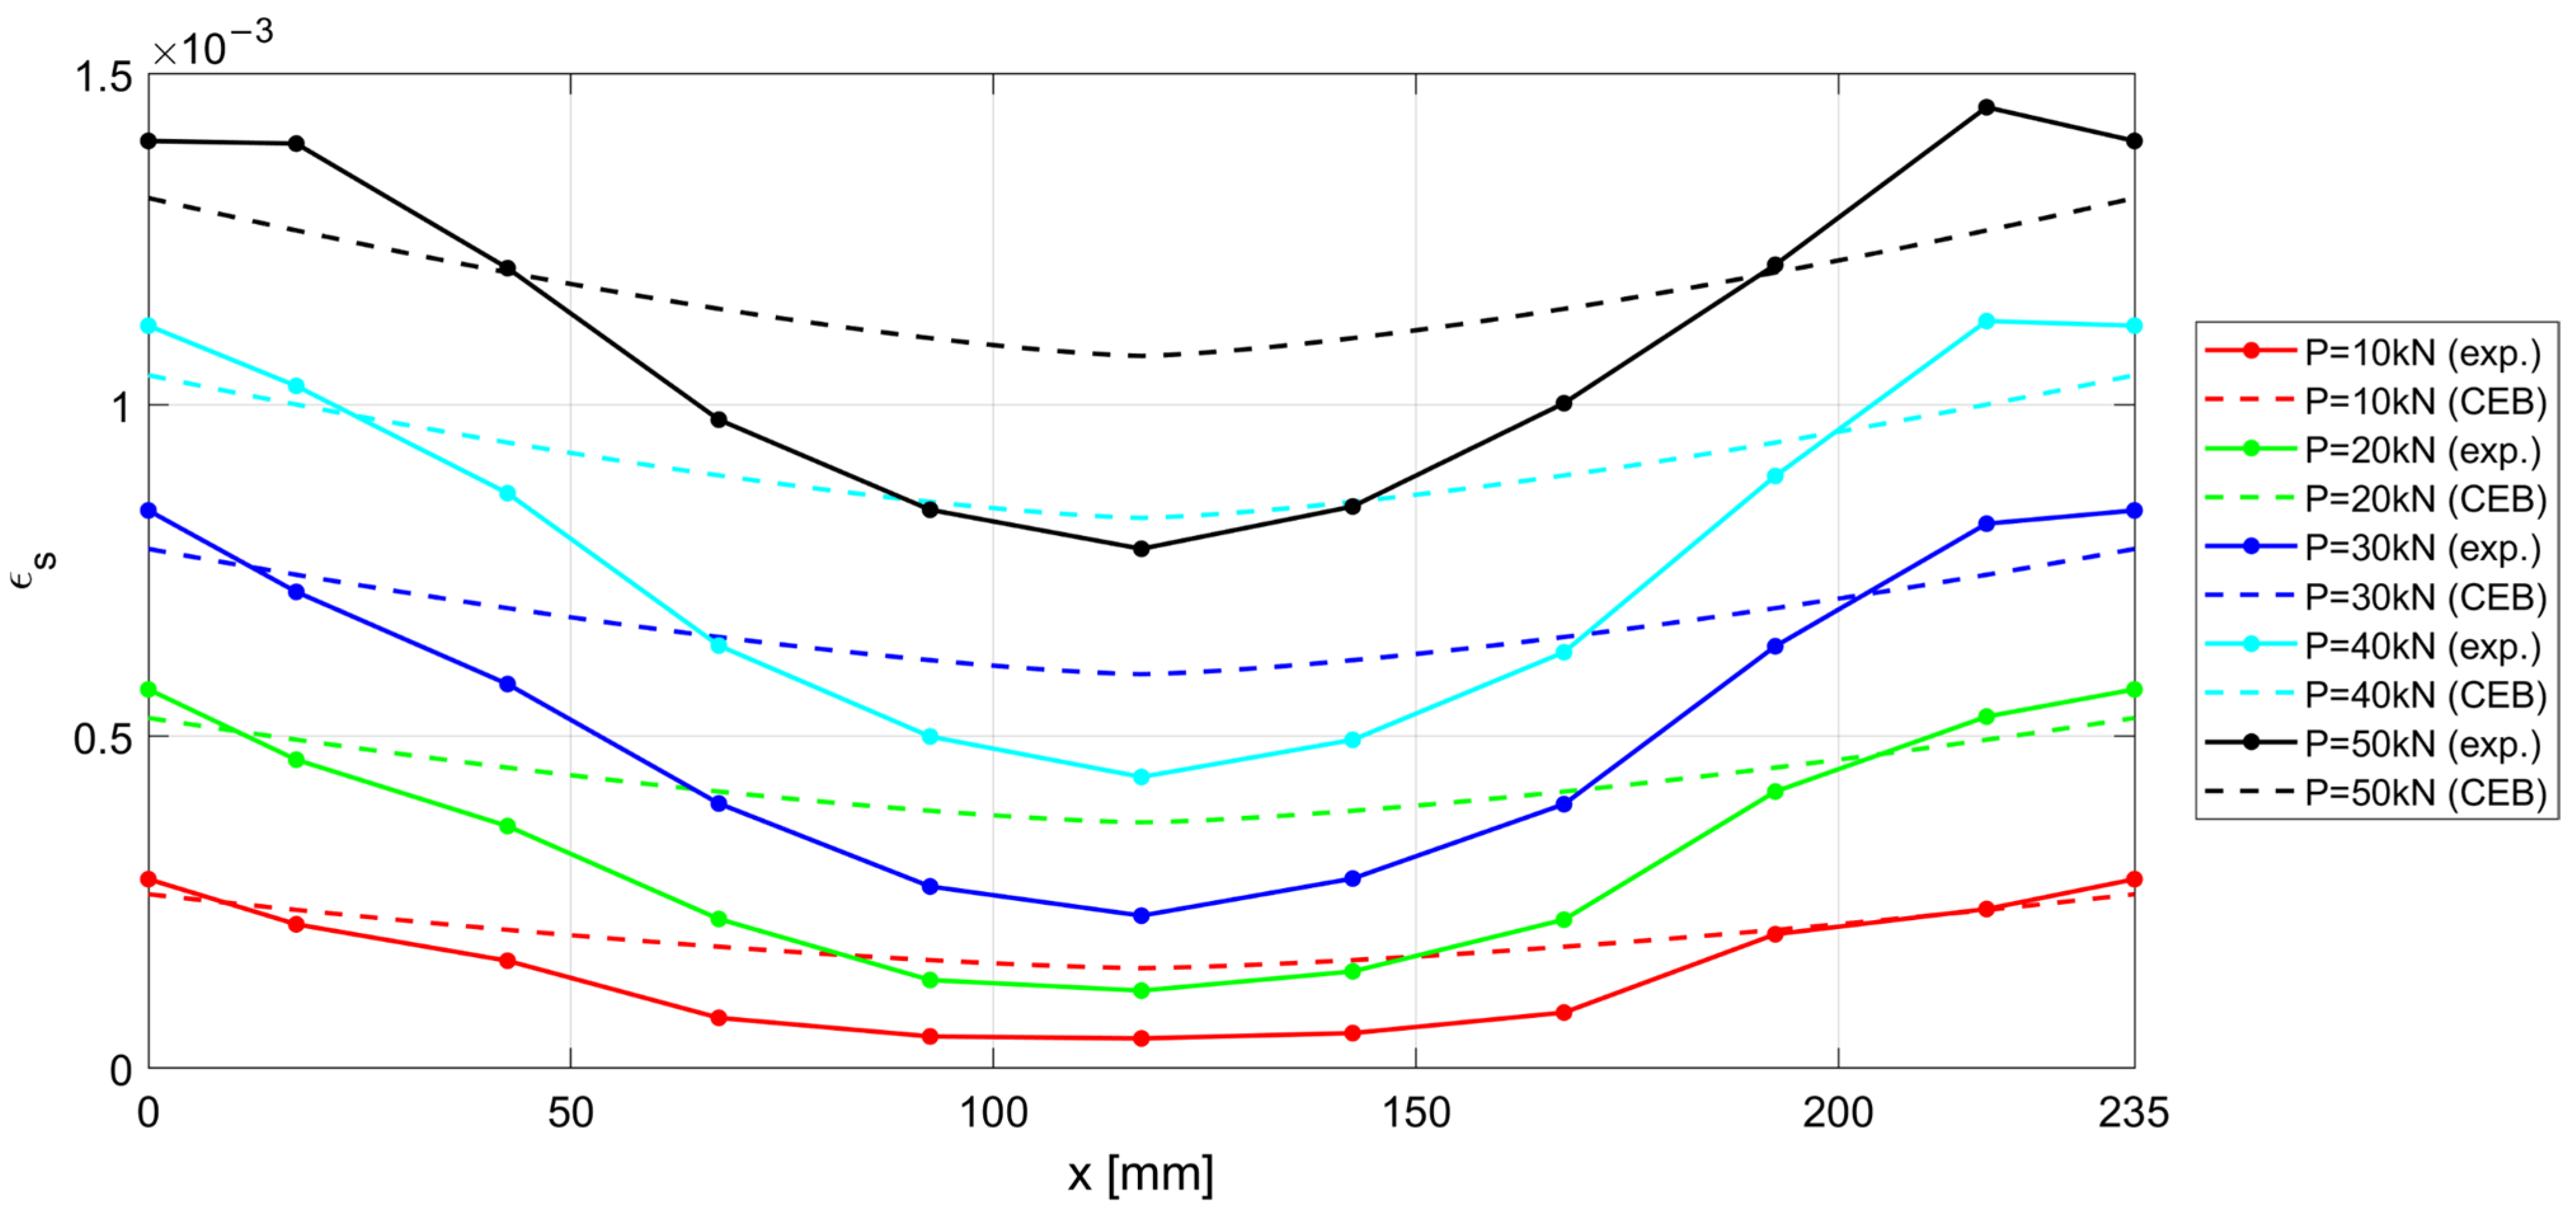
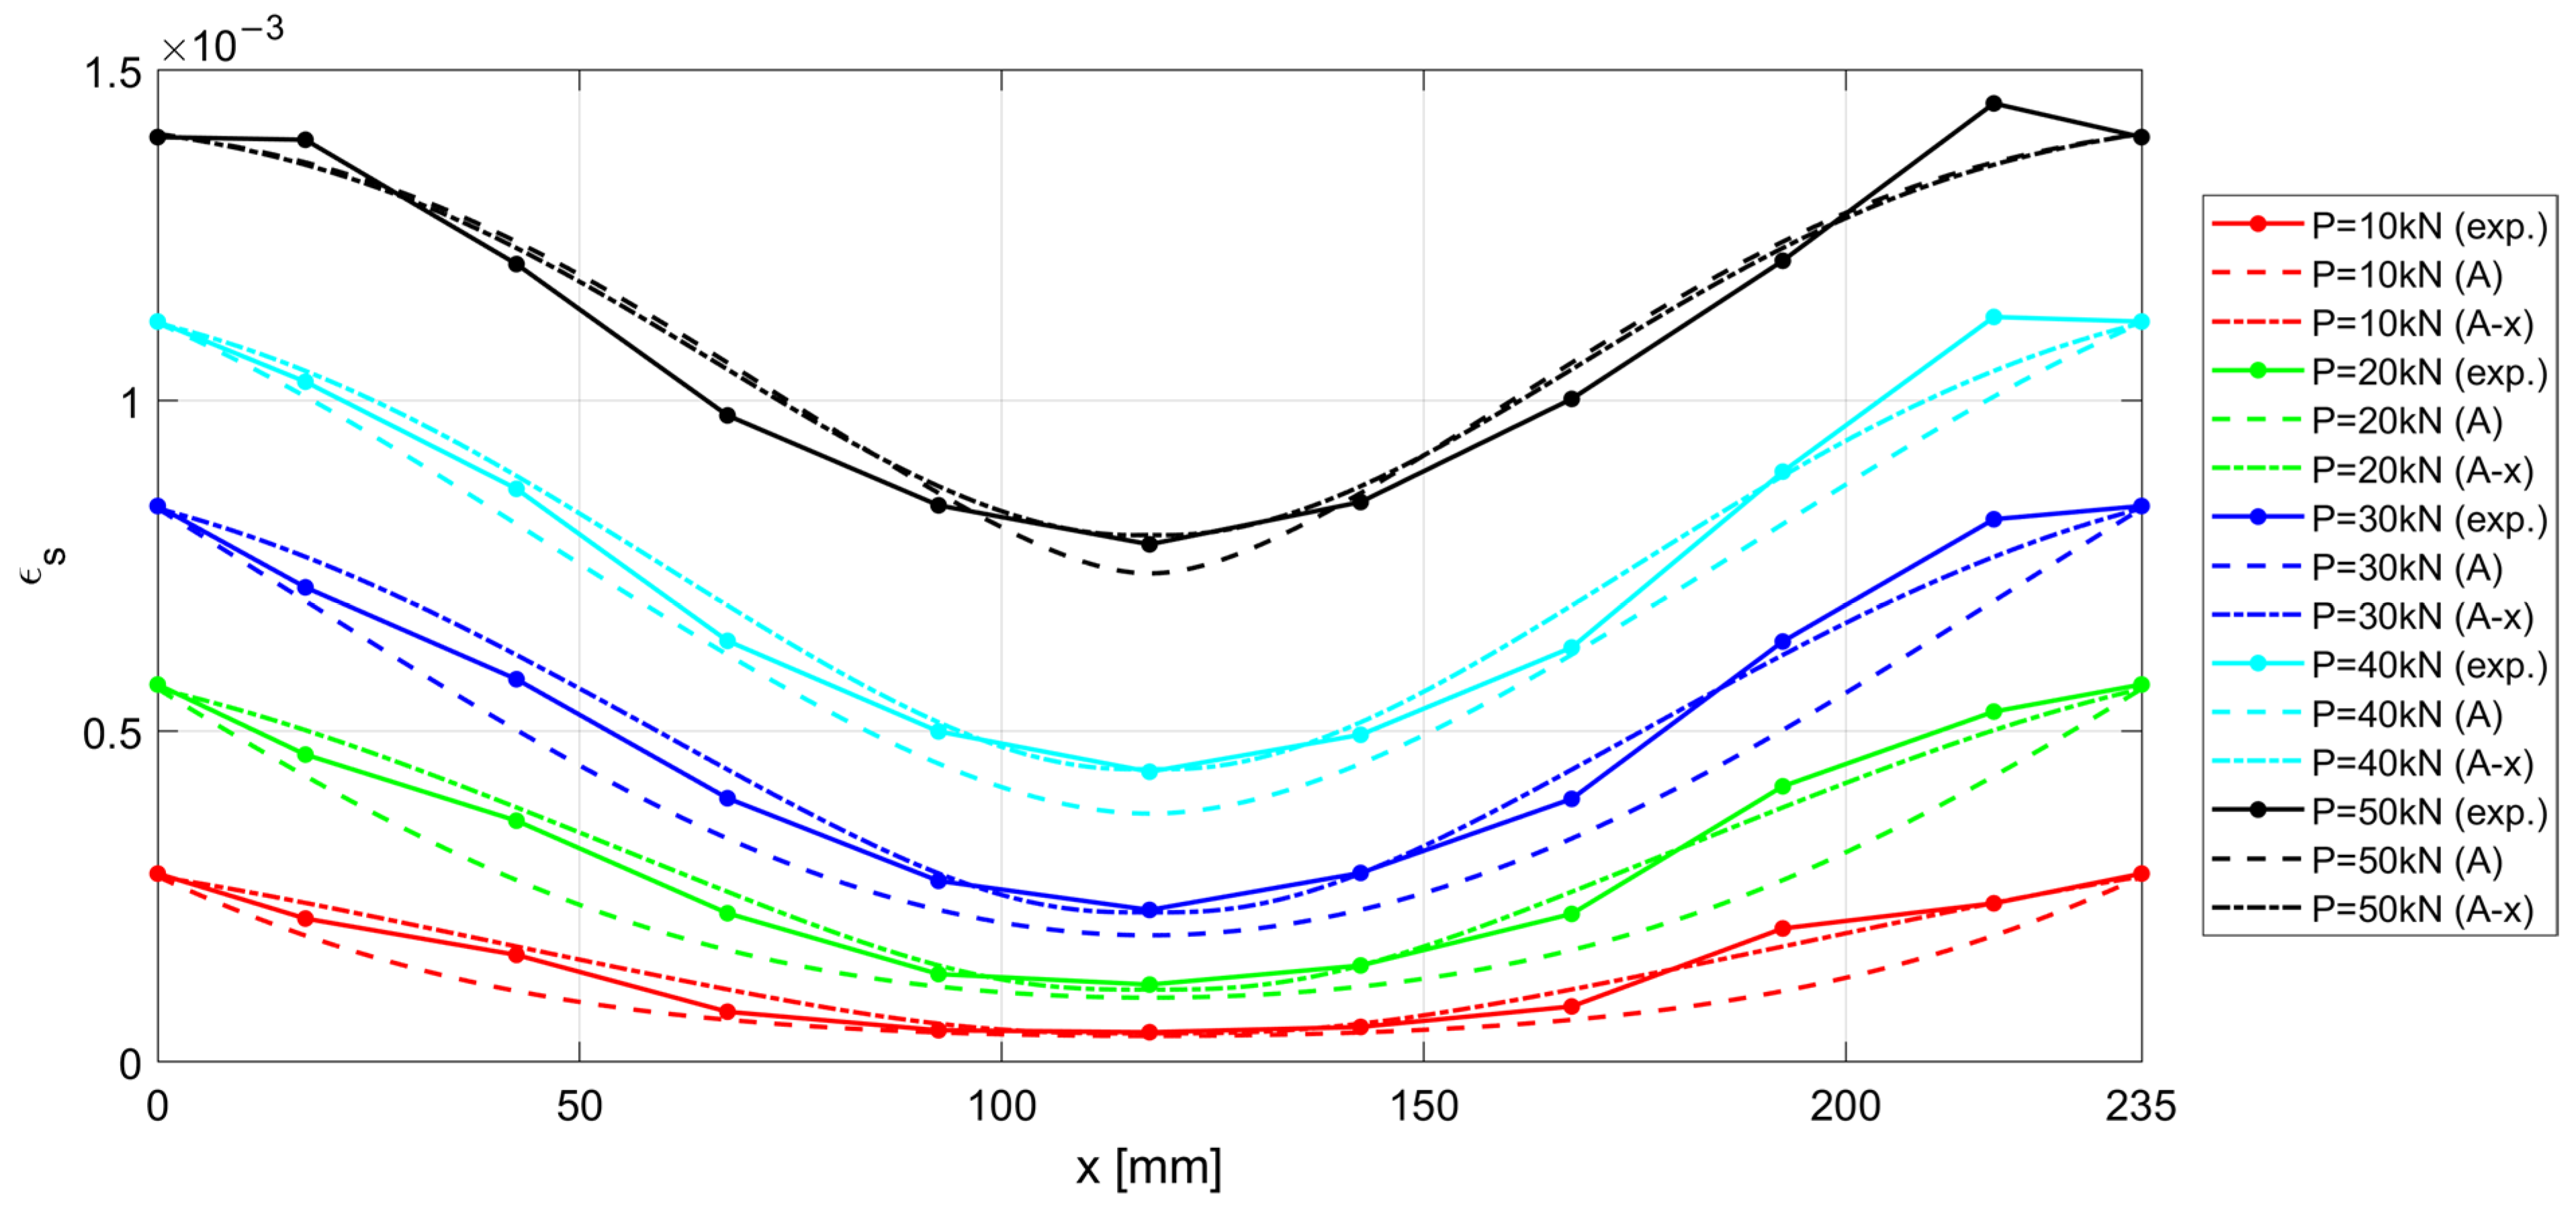
- It leads to an underestimation of the bond stress transfer from steel to concrete. In fact, the steel deformations are characterized by a constant overestimation of the stresses in the bars, especially in the central section of the sample (see Figure 17), thus leading to concrete stresses significantly lower than in the real case;
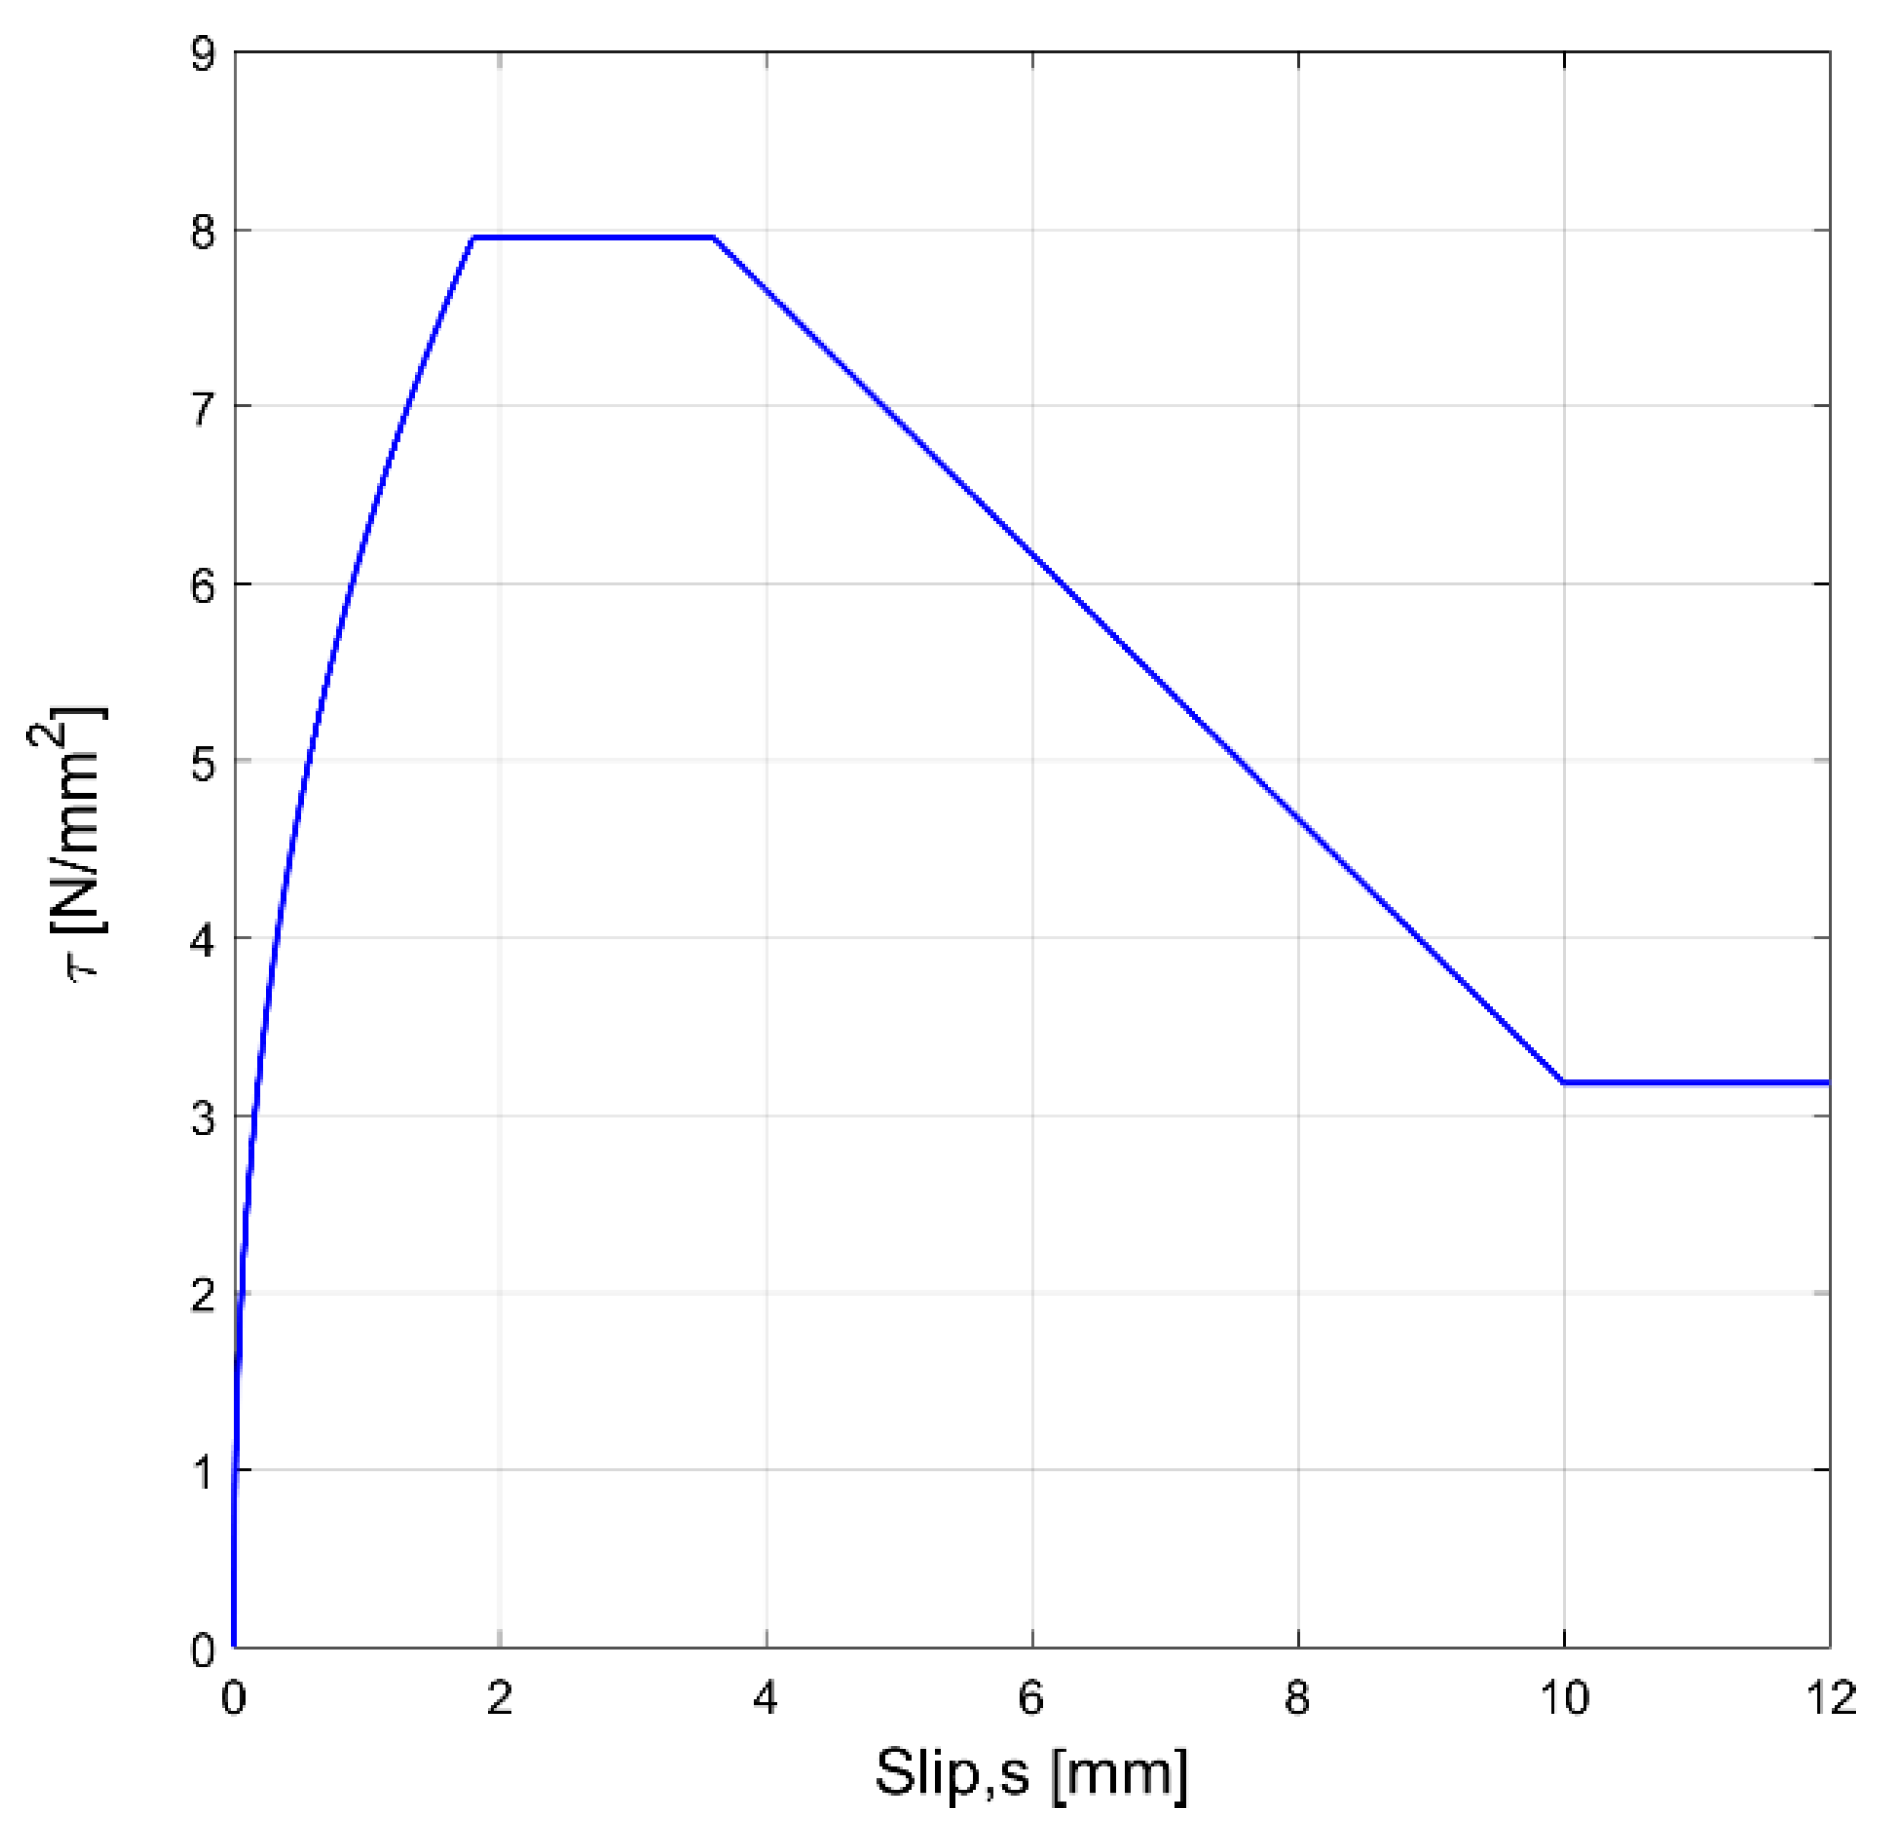
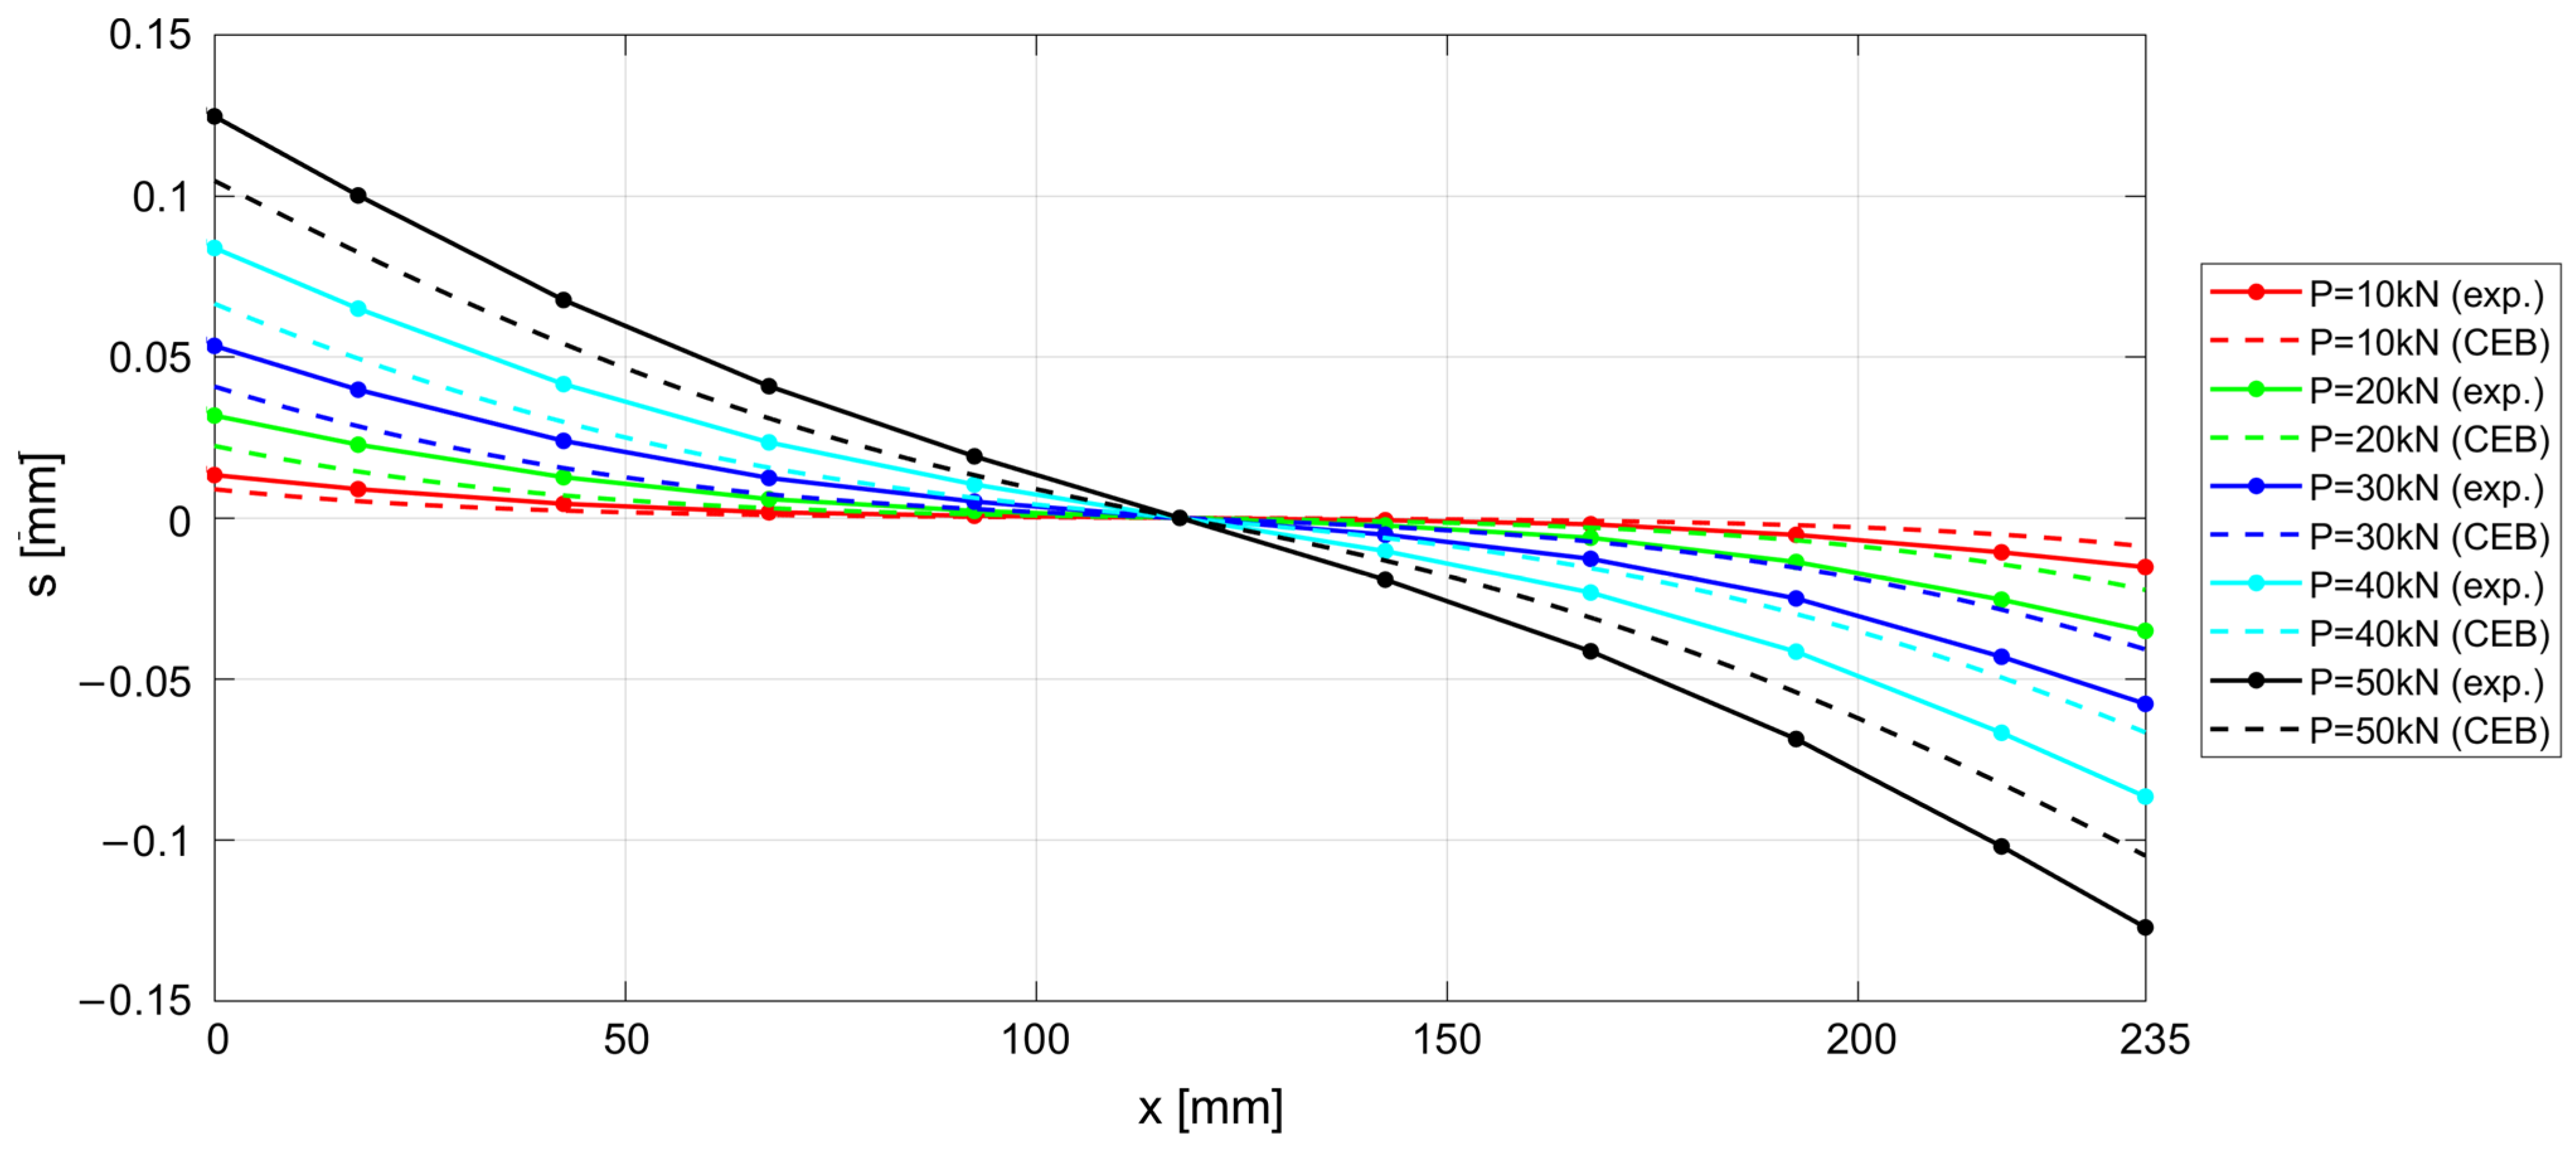
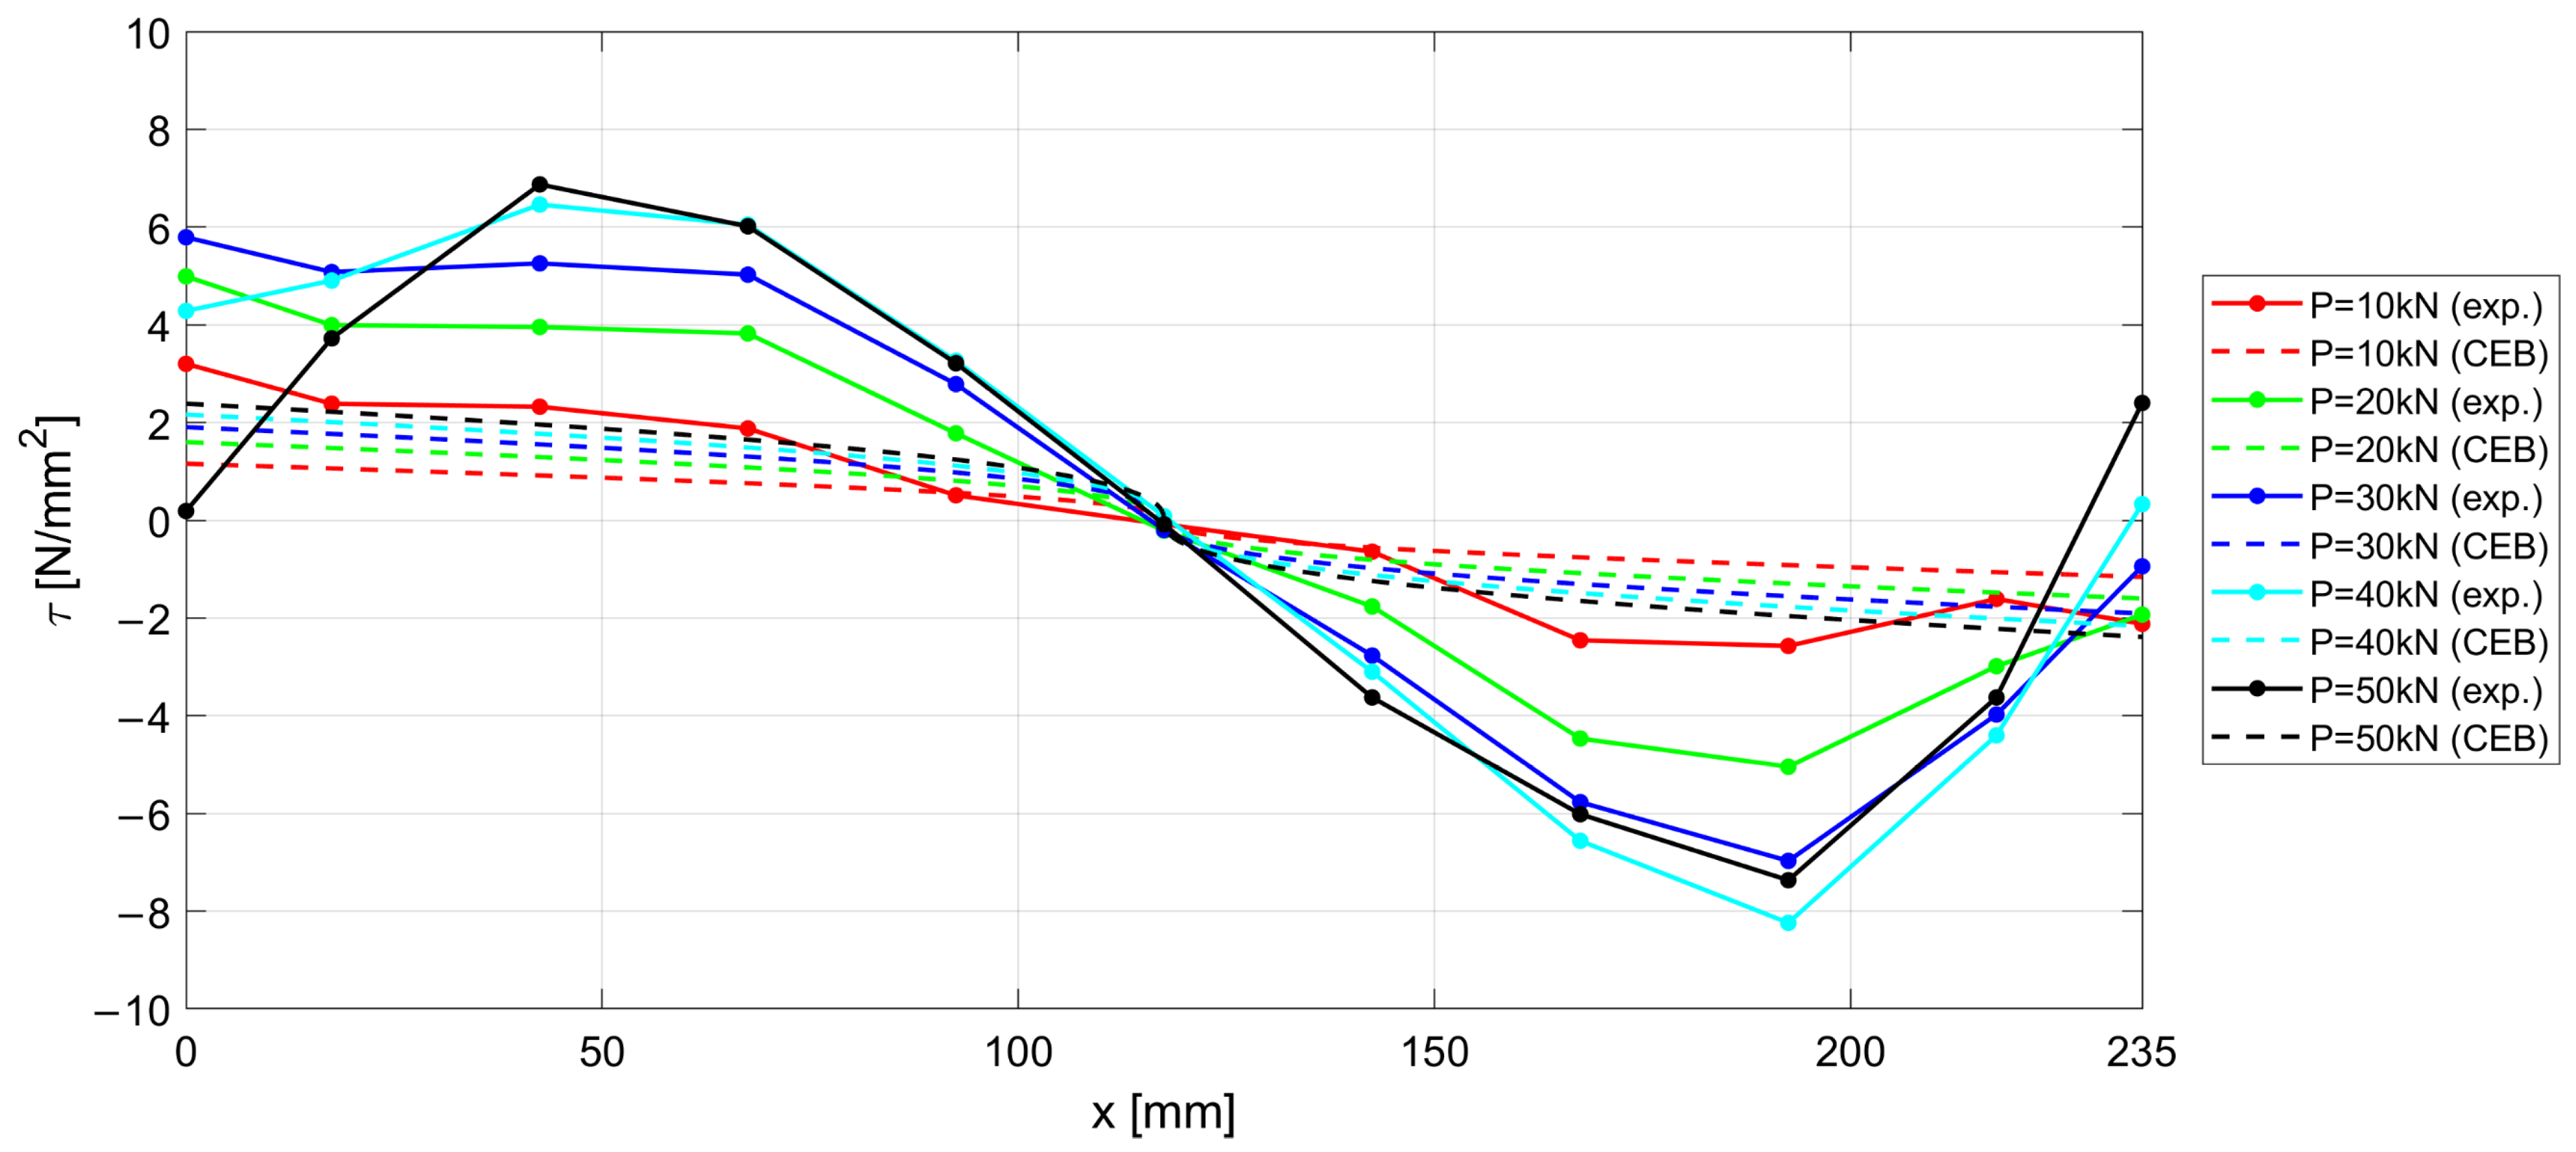
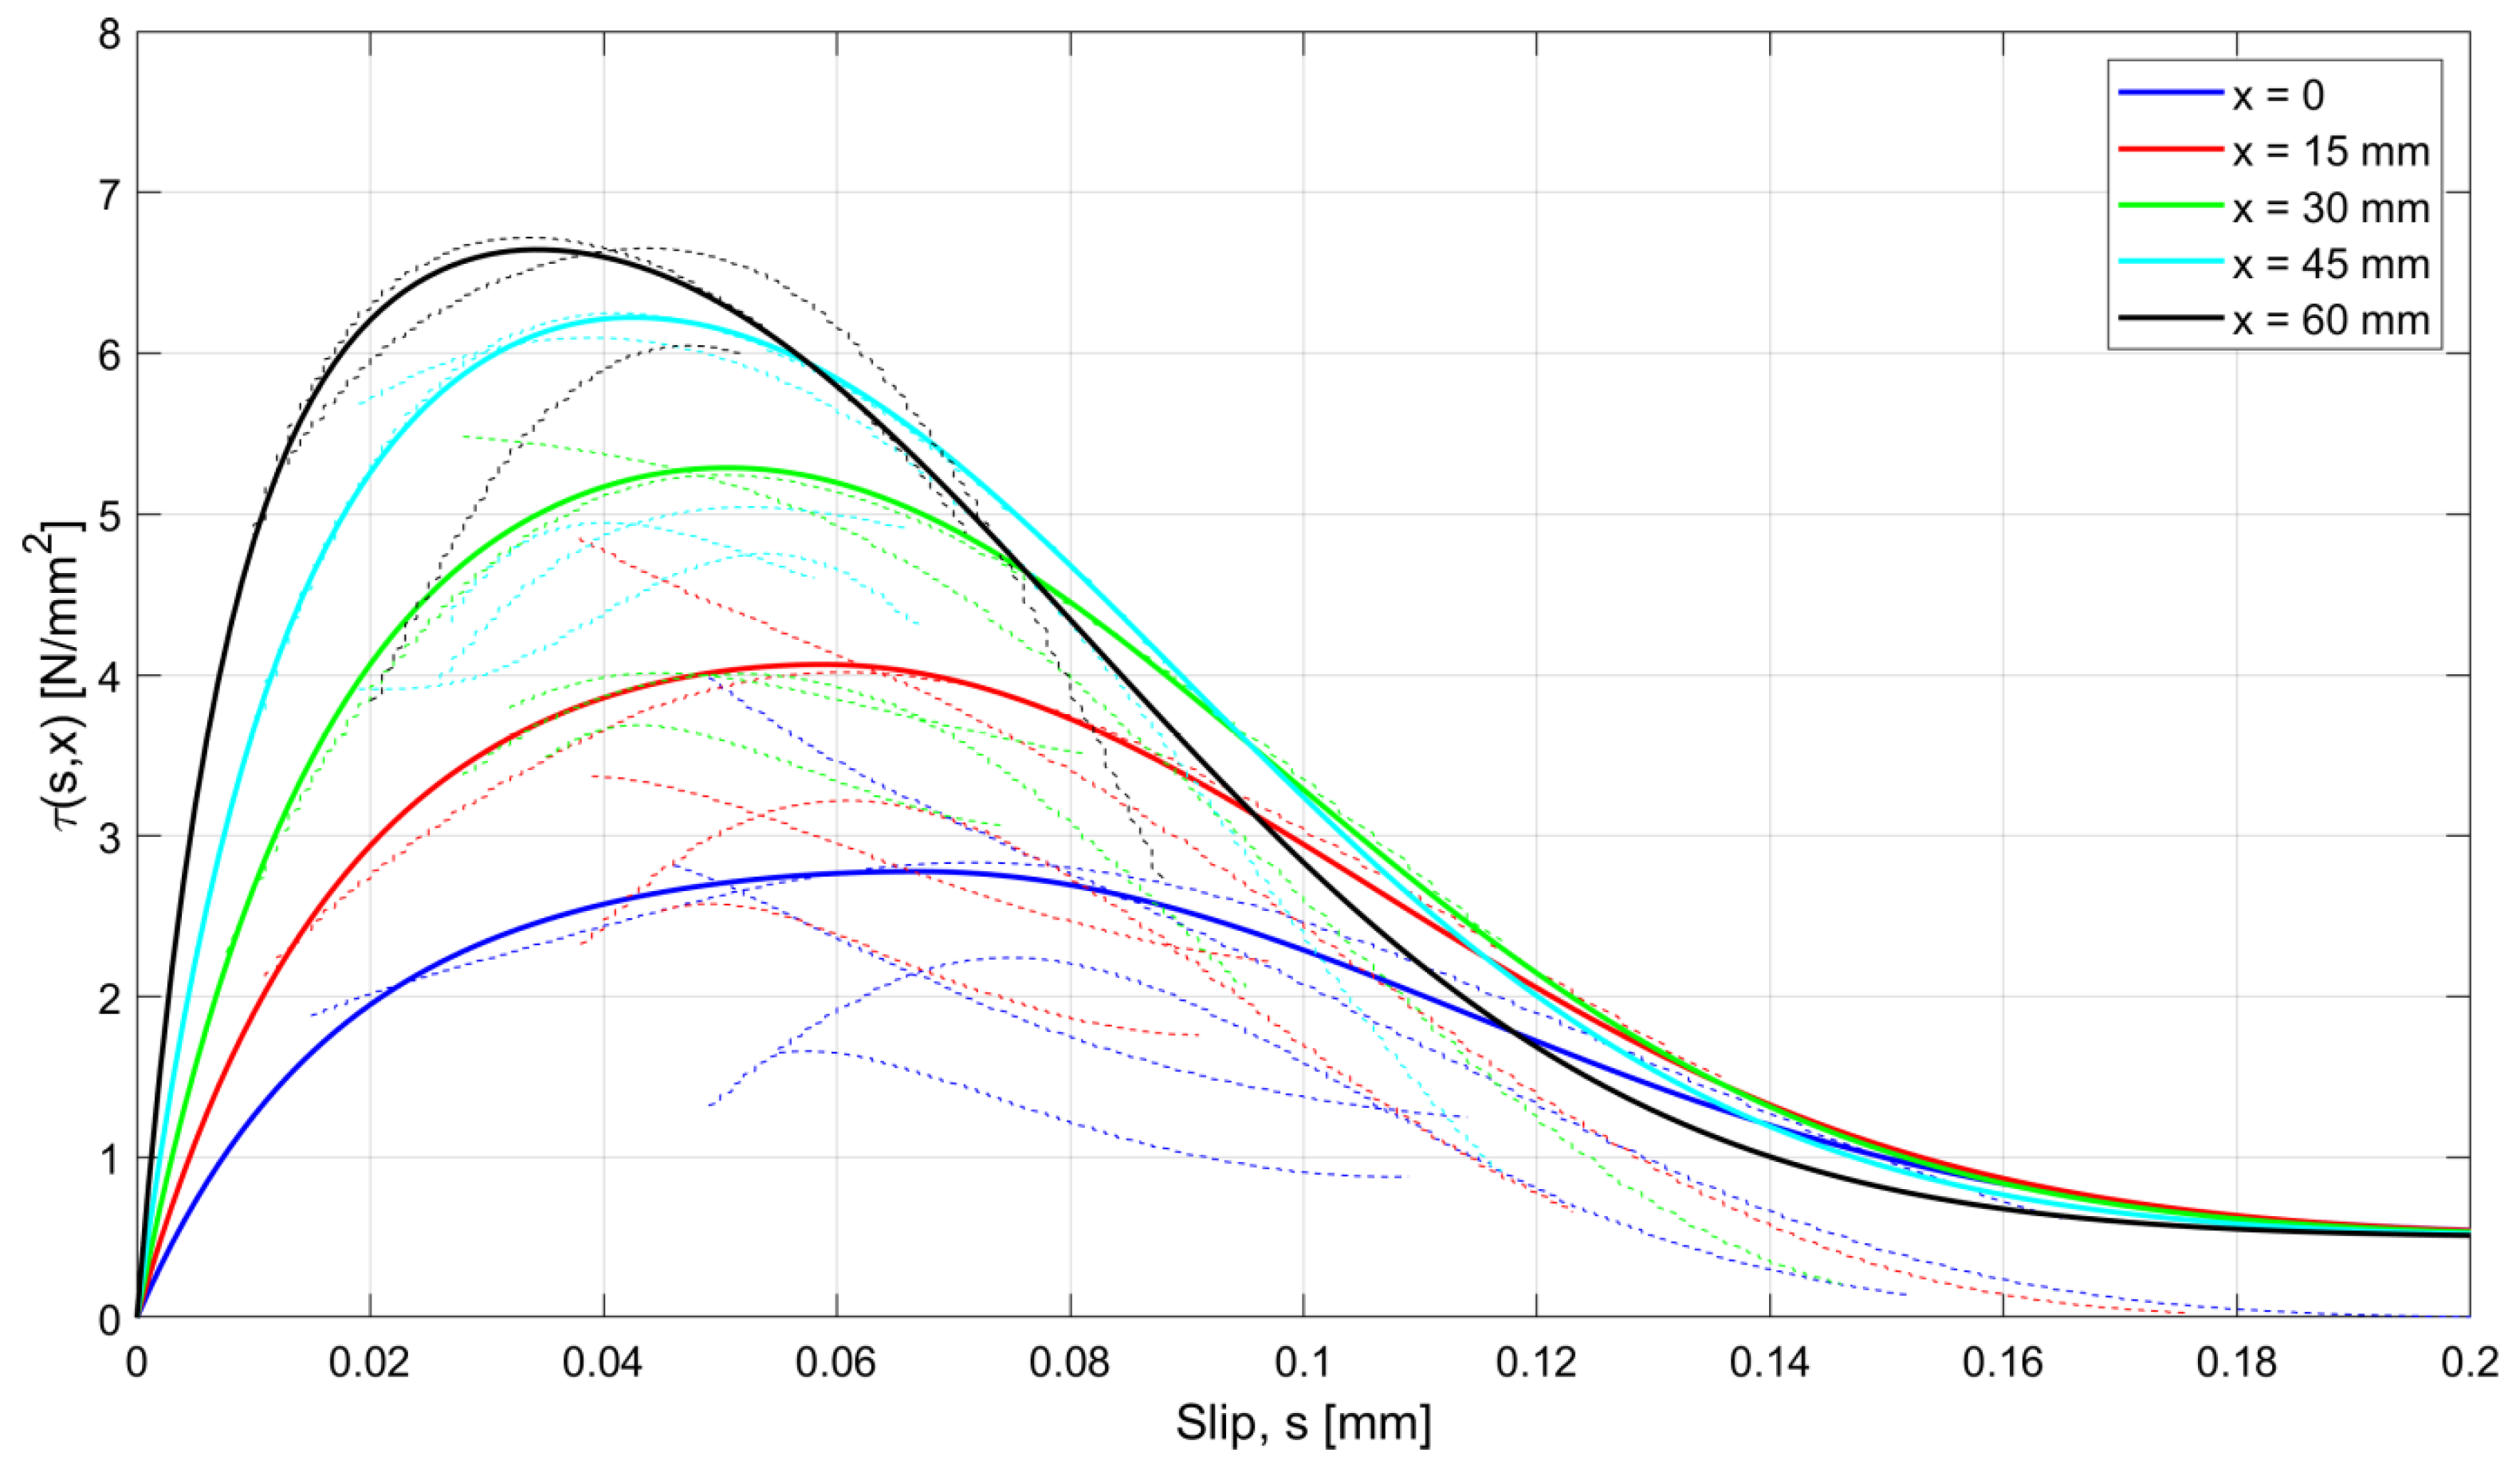
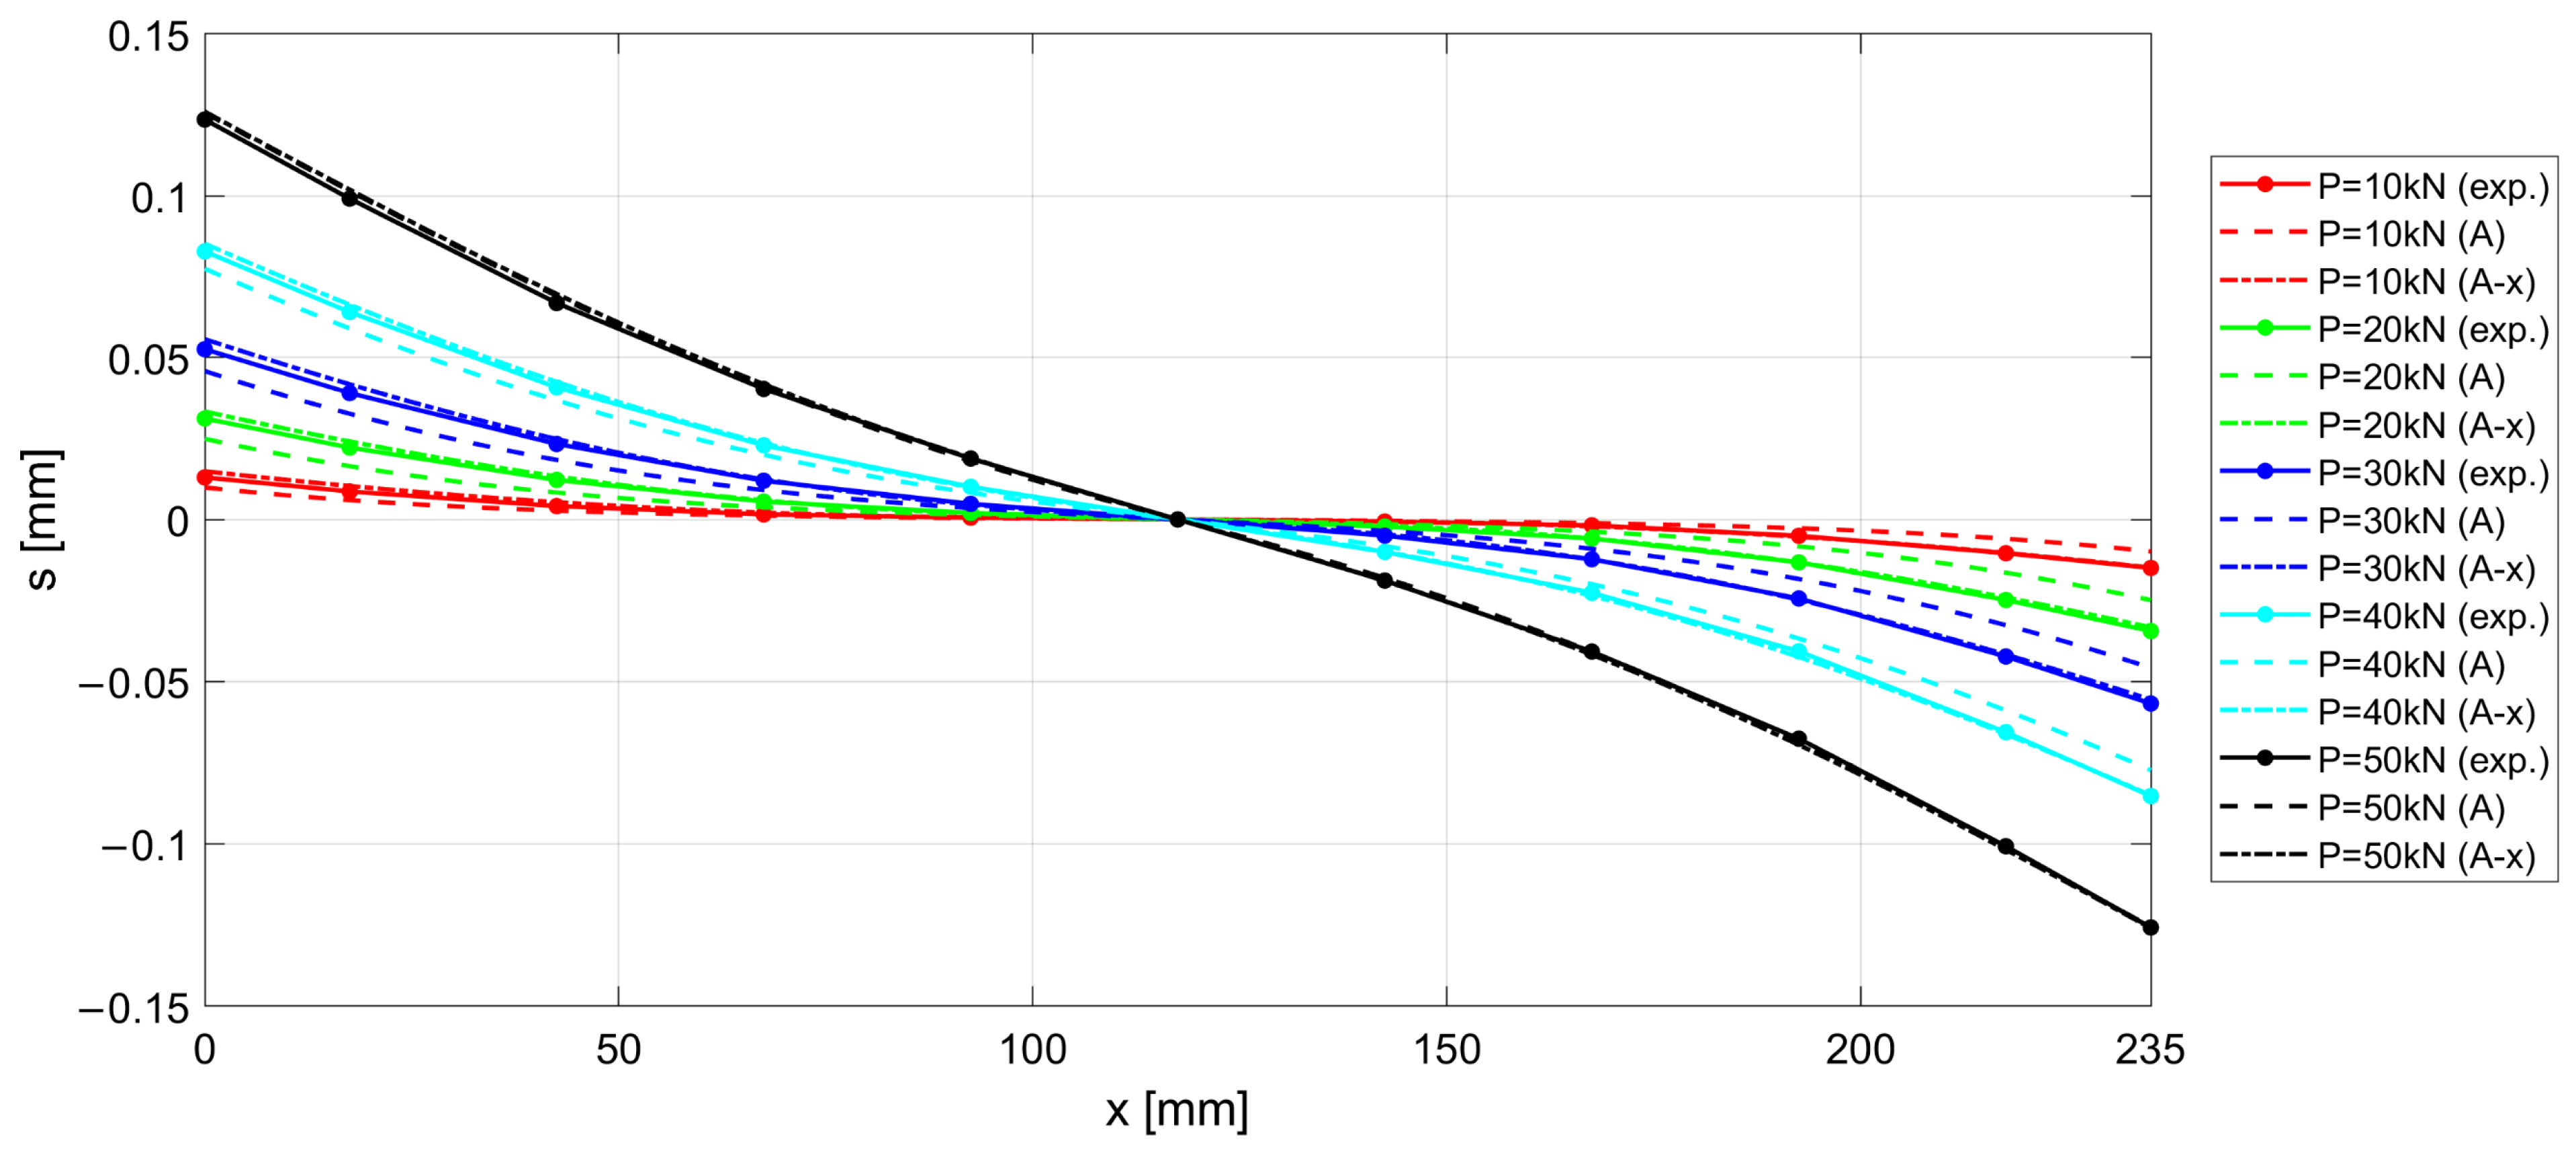
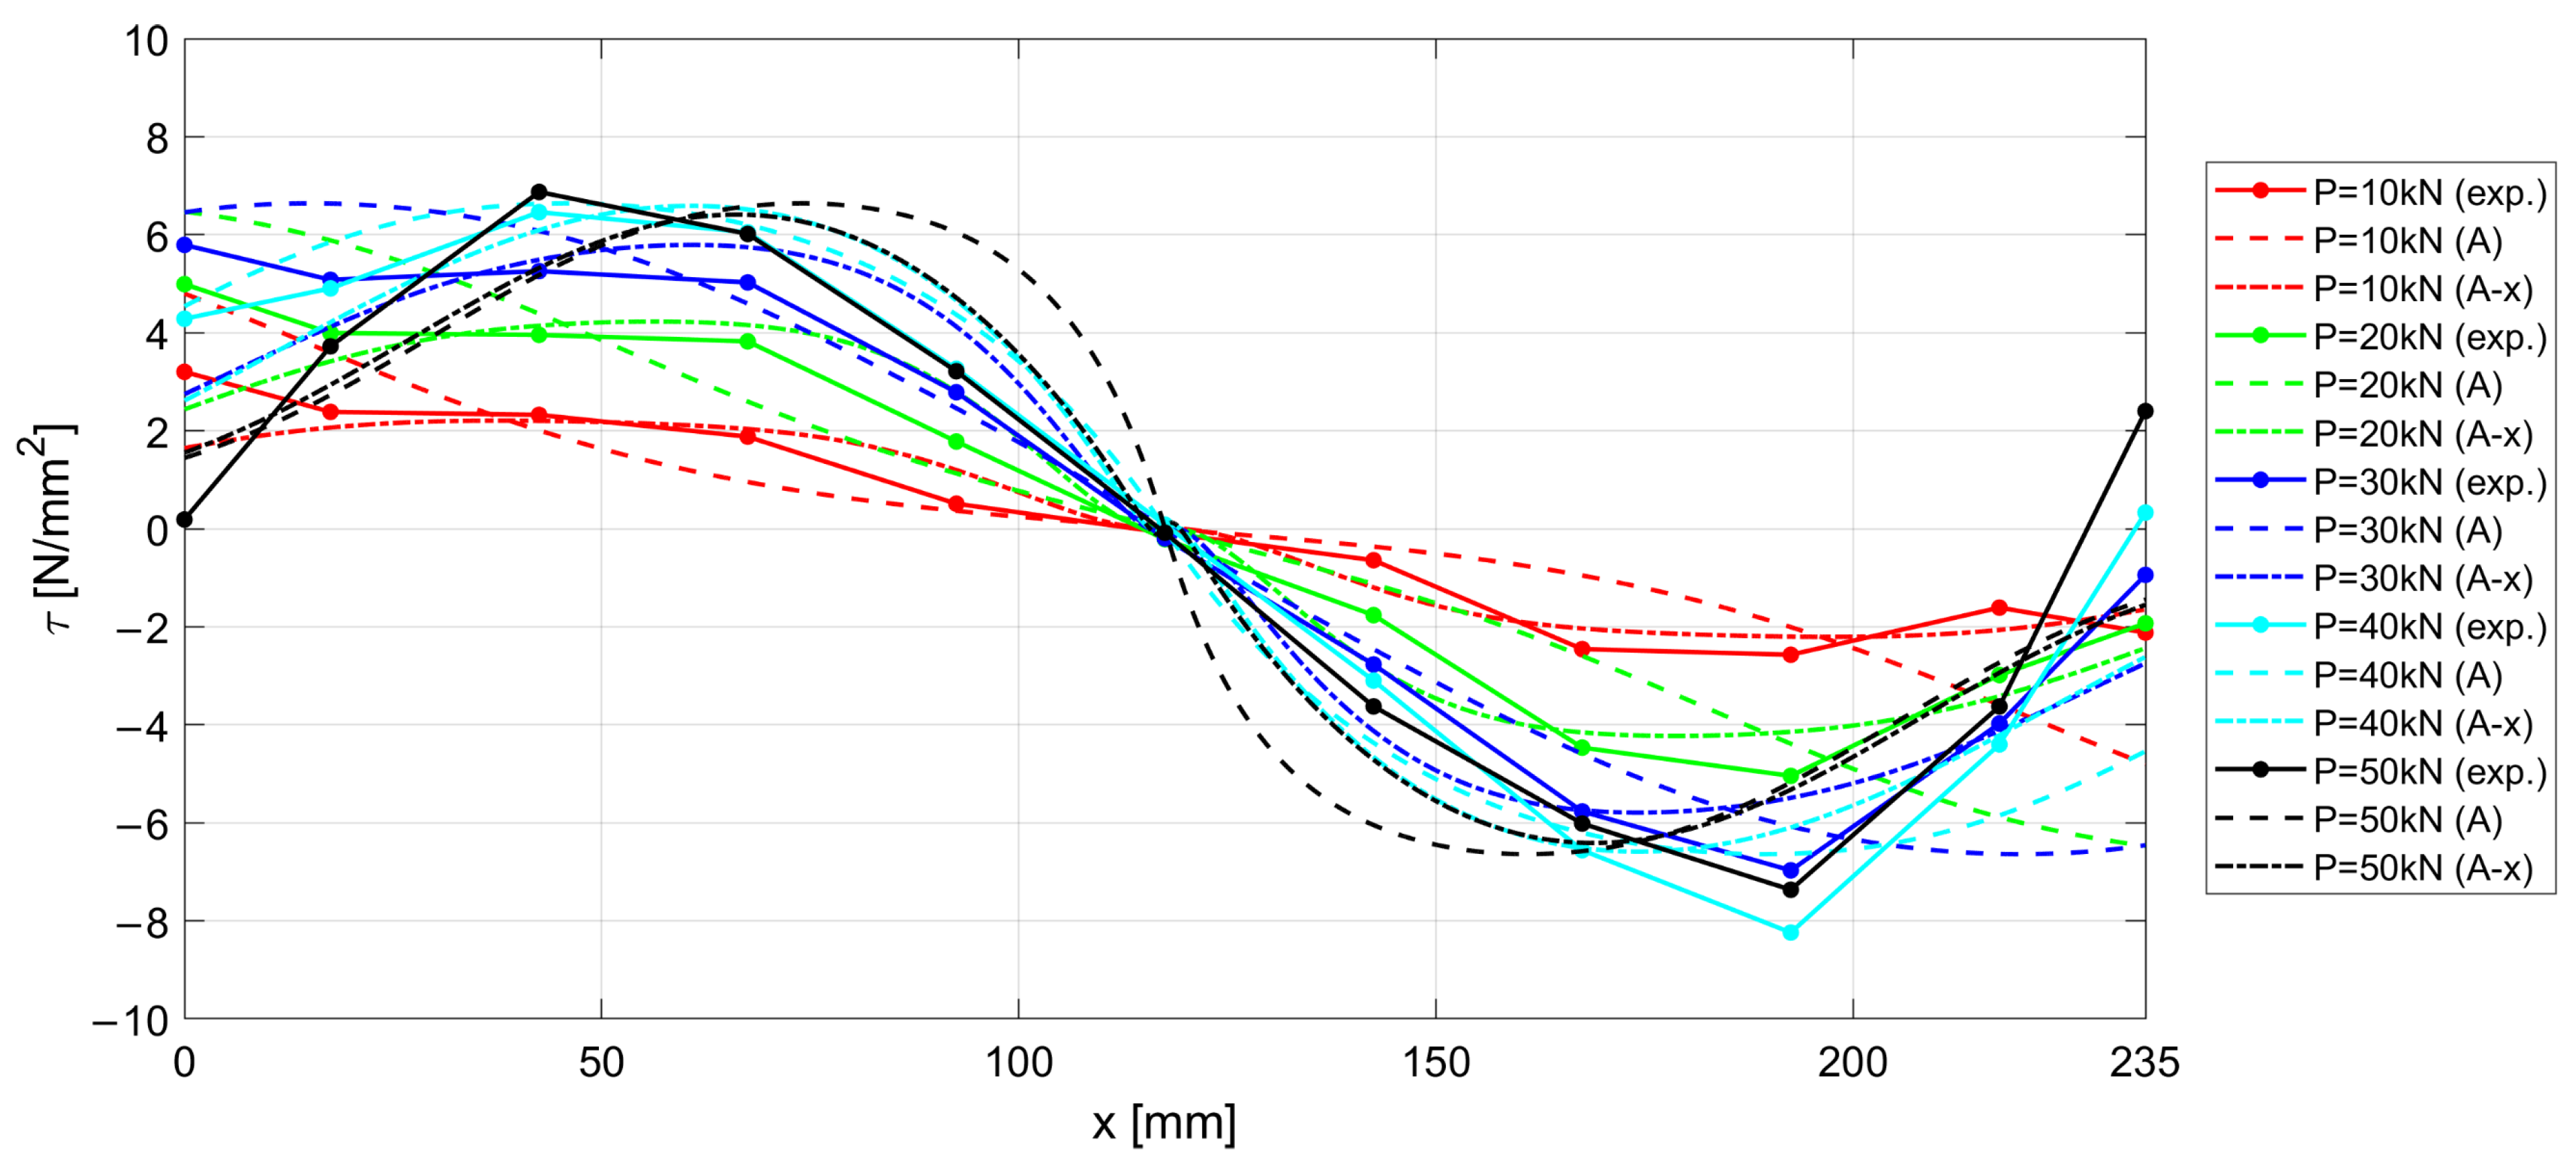
- Nonetheless, a satisfactory level of approximation is obtained for the slip at the end sections of the r.c. tie, which estimates the crack width (see Figure 18), but the corresponding shear stresses are significantly different from the experimental ones. In fact, maximum slips, which are limited to 0.2 mm, are one order of magnitude lower than the slips associated with the plastic range of the bond–slip CEB model (see Figure 13). This outcome confirms that the actual magnitude of the slip values is well below that corresponding to the horizontal plateau or to the descending branch of the CEB bond–slip model.
4. Discussion
5. Conclusions
Author Contributions
Funding
Institutional Review Board Statement
Informed Consent Statement
Data Availability Statement
Conflicts of Interest
References
- EN 1998-1. Eurocode 8; Design of Structures for Earthquake Resistance—Part 1: General Rules, Seismic Actions and Rules for Buildings. European Committee for Standardization (CEN): Brussels, Belgium, 2003.
- EN 1998-3. Eurocode 8; Design of Structures for Earthquake Resistance—Part 3: Assessment and Retrofitting of Buildings. European Committee for Standardization (CEN): Brussels, Belgium, 2003.
- Marsili, F.; Croce, P.; Friedman, N.; Formichi, P.; Landi, F. Seismic Reliability Assessment of a Concrete Water Tank Based on the Bayesian Updating of the Finite Element Model. ASCE-ASME J. Risk Uncertain. Eng. Syst. Part B Mech. Eng. 2017, 3, 021004. [Google Scholar] [CrossRef]
- Kwak, H.G.; Kim, S.P. Nonlinear analysis of RC beams based on moment–curvature relation. Comput. Struct. 2002, 80, 615–628. [Google Scholar] [CrossRef]
- Carvalho, G.; Bento, R.; Bhatt, C. Nonlinear static and dynamic analyses of reinforced concrete buildings—Comparison of different modelling approaches. Earthq. Struct. 2013, 4, 451–470. [Google Scholar] [CrossRef]
- Croce, P.; Beconcini, M.L.; Formichi, P.; Landi, F.; Puccini, B.; Zotti, V. Bayesian Methodology for Probabilistic Description of Mechanical Parameters of Masonry Walls. ASCE-ASME J. Risk Uncertain. Eng. Syst. Part A Civ. Eng. 2021, 7, 04021008. [Google Scholar] [CrossRef]
- Beconcini, M.L.; Cioni, P.; Croce, P.; Formichi, P.; Landi, F.; Mochi, C. Non-linear static analysis of masonry buildings under seismic actions. In Proceedings of the 22nd World Multi-Conference on Systemics, Cybernetics and Informatics (IMSCI 2018), Orlando, FL, USA, 8–11 July 2018; International Institute of Informatics and Systemics: Winter Garden, FL, USA; pp. 126–131. Available online: http://www.iiisci.org/Journal/CV$/sci/pdfs/EA239AY18.pdf (accessed on 19 November 2021).
- Murcia-Delso, J.; Benson Shing, P. Bond-Slip Model for Detailed Finite-Element Analysis of Reinforced Concrete Structures. J. Struct. Eng. 2015, 141, 04014125. [Google Scholar] [CrossRef]
- Ciampi, V.; Eligehausen, R.; Bertero, V.V.; Popov, E.P. Analytical Model for Concrete Anchorages of Reinforced Bars under Generalized Excitations; Report. No. UCB/EERC83/23; University of California: Berkeley, CA, USA, 1982. [Google Scholar]
- Eligehausen, R.; Bigaj-Van Vliet, A. Bond Behaviour and Models. In Structural Concrete, the Textbook on Behaviour, Design and Performance; CEB-FIP Bulletins 1, 2, 3; Fédération Internationale du Béton (FIB): Lausanne, Switzerland, 1999. [Google Scholar]
- Park, R.; Paulay, T. Reinforced Concrete Structures; John Wiley & Sons: New York, NY, USA, 2001. [Google Scholar]
- Tastani, S.P.; Pantazopoulou, S.J. Experimental Evaluation of the Direct Tension Pullout Bond Test. In Proceedings of the Symposium on “Bond in Concrete—From Research to Standards, Budapest, Hungary, 20–22 November 2002; pp. 268–276. [Google Scholar]
- Borosnyói, A.; Balázs, G.L. Models for Flexural Cracking in Concrete: The State of the Art. Struct. Concr. 2005, 6, 53–62. [Google Scholar] [CrossRef]
- CEB-FIB. Bond of Reinforcement in Concrete; Bullettin nr. 10. FIB; Fédération Internationale du Béton (FIB): Lausanne, Switzerland, 2000. [Google Scholar] [CrossRef]
- Cairns, J. Local bond–slip model for plain surface reinforcement. Struct. Concr. 2021, 22, 666–675. [Google Scholar] [CrossRef]
- Croce, P.; Formichi, P.; Landi, F. Influence of Reinforcing Steel Corrosion on Life Cycle Reliability Assessment of Existing R.C. Buildings. Buildings 2020, 10, 99. [Google Scholar] [CrossRef]
- Beconcini, M.L.; Croce, P.; Formichi, P. Influence of Bond-Slip on the Behavior of Reinforced Concrete Beam to Column Joints. In Proceedings of the International fib Symposium “Taylor Made Concrete Structures: New Solutions for our Society, Amsterdam, The Netherlands, 19–21 May 2008; pp. 533–539. [Google Scholar]
- Formichi, P. Bond-Slip Laws and Confinement Conditions for Reinforcing Bars in r.c. Elements; University of Pisa: Pisa, Italy, 2010. (In Italian) [Google Scholar]
- Casanova, A.; Jason, L.; Davenne, L. Bond Slip Model for the Simulation of Reinforced Concrete Structures. Eng. Struct. 2012, 39, 66–78. [Google Scholar] [CrossRef]
- Hong, S.; Park, S.K. Uniaxial Bond Stress-Slip Relationship of Reinforcing Bars in Concrete. Adv. Mater. Sci. Eng. 2012, 2012, 328570. [Google Scholar] [CrossRef]
- Tang, C.W.; Cheng, C.K. Modeling Local Bond Stress–Slip Relationships of Reinforcing Bars Embedded in Concrete with Different Strengths. Materials 2020, 13, 3701. [Google Scholar] [CrossRef] [PubMed]
- Mains, R.M. Measurements of the Distribution of Tensile Bond Stresses along Reinforcing Bars. J. Am. Concr. Inst. Proc. 1951, 48, 225–252. [Google Scholar]
- Bresler, B.; Bertero, V. Behavior of Reinforced Concrete under Repeated Load. J. Struct. Div. 1968, 94, 1567–1590. [Google Scholar] [CrossRef]
- Nilson, A.H. Internal measurement of bond slip. ACI J. 1972, 69, 439–441. [Google Scholar]
- Croce, P.; Formichi, P. Numerical Simulation of the Behavior of Cracked Reinforced Concrete Members. Mater. Sci. Appl. 2014, 5, 883–894. [Google Scholar] [CrossRef][Green Version]
- Fédération Internationale du Béton (FIB). FIB Model Code for Concrete Structure 2010; Wilhelm Ernst & Sohn: Berlin, Germany, 2013. [Google Scholar]
- Cairns, J. Bond and anchorage of embedded steel reinforcement in fib Model Code 2010. Struct. Concr. 2015, 1, 45–55. [Google Scholar] [CrossRef]
- Butcher, J.C. A history of Runge-Kutta methods. Appl. Numer. Math. 1996, 20, 247–260. [Google Scholar] [CrossRef]
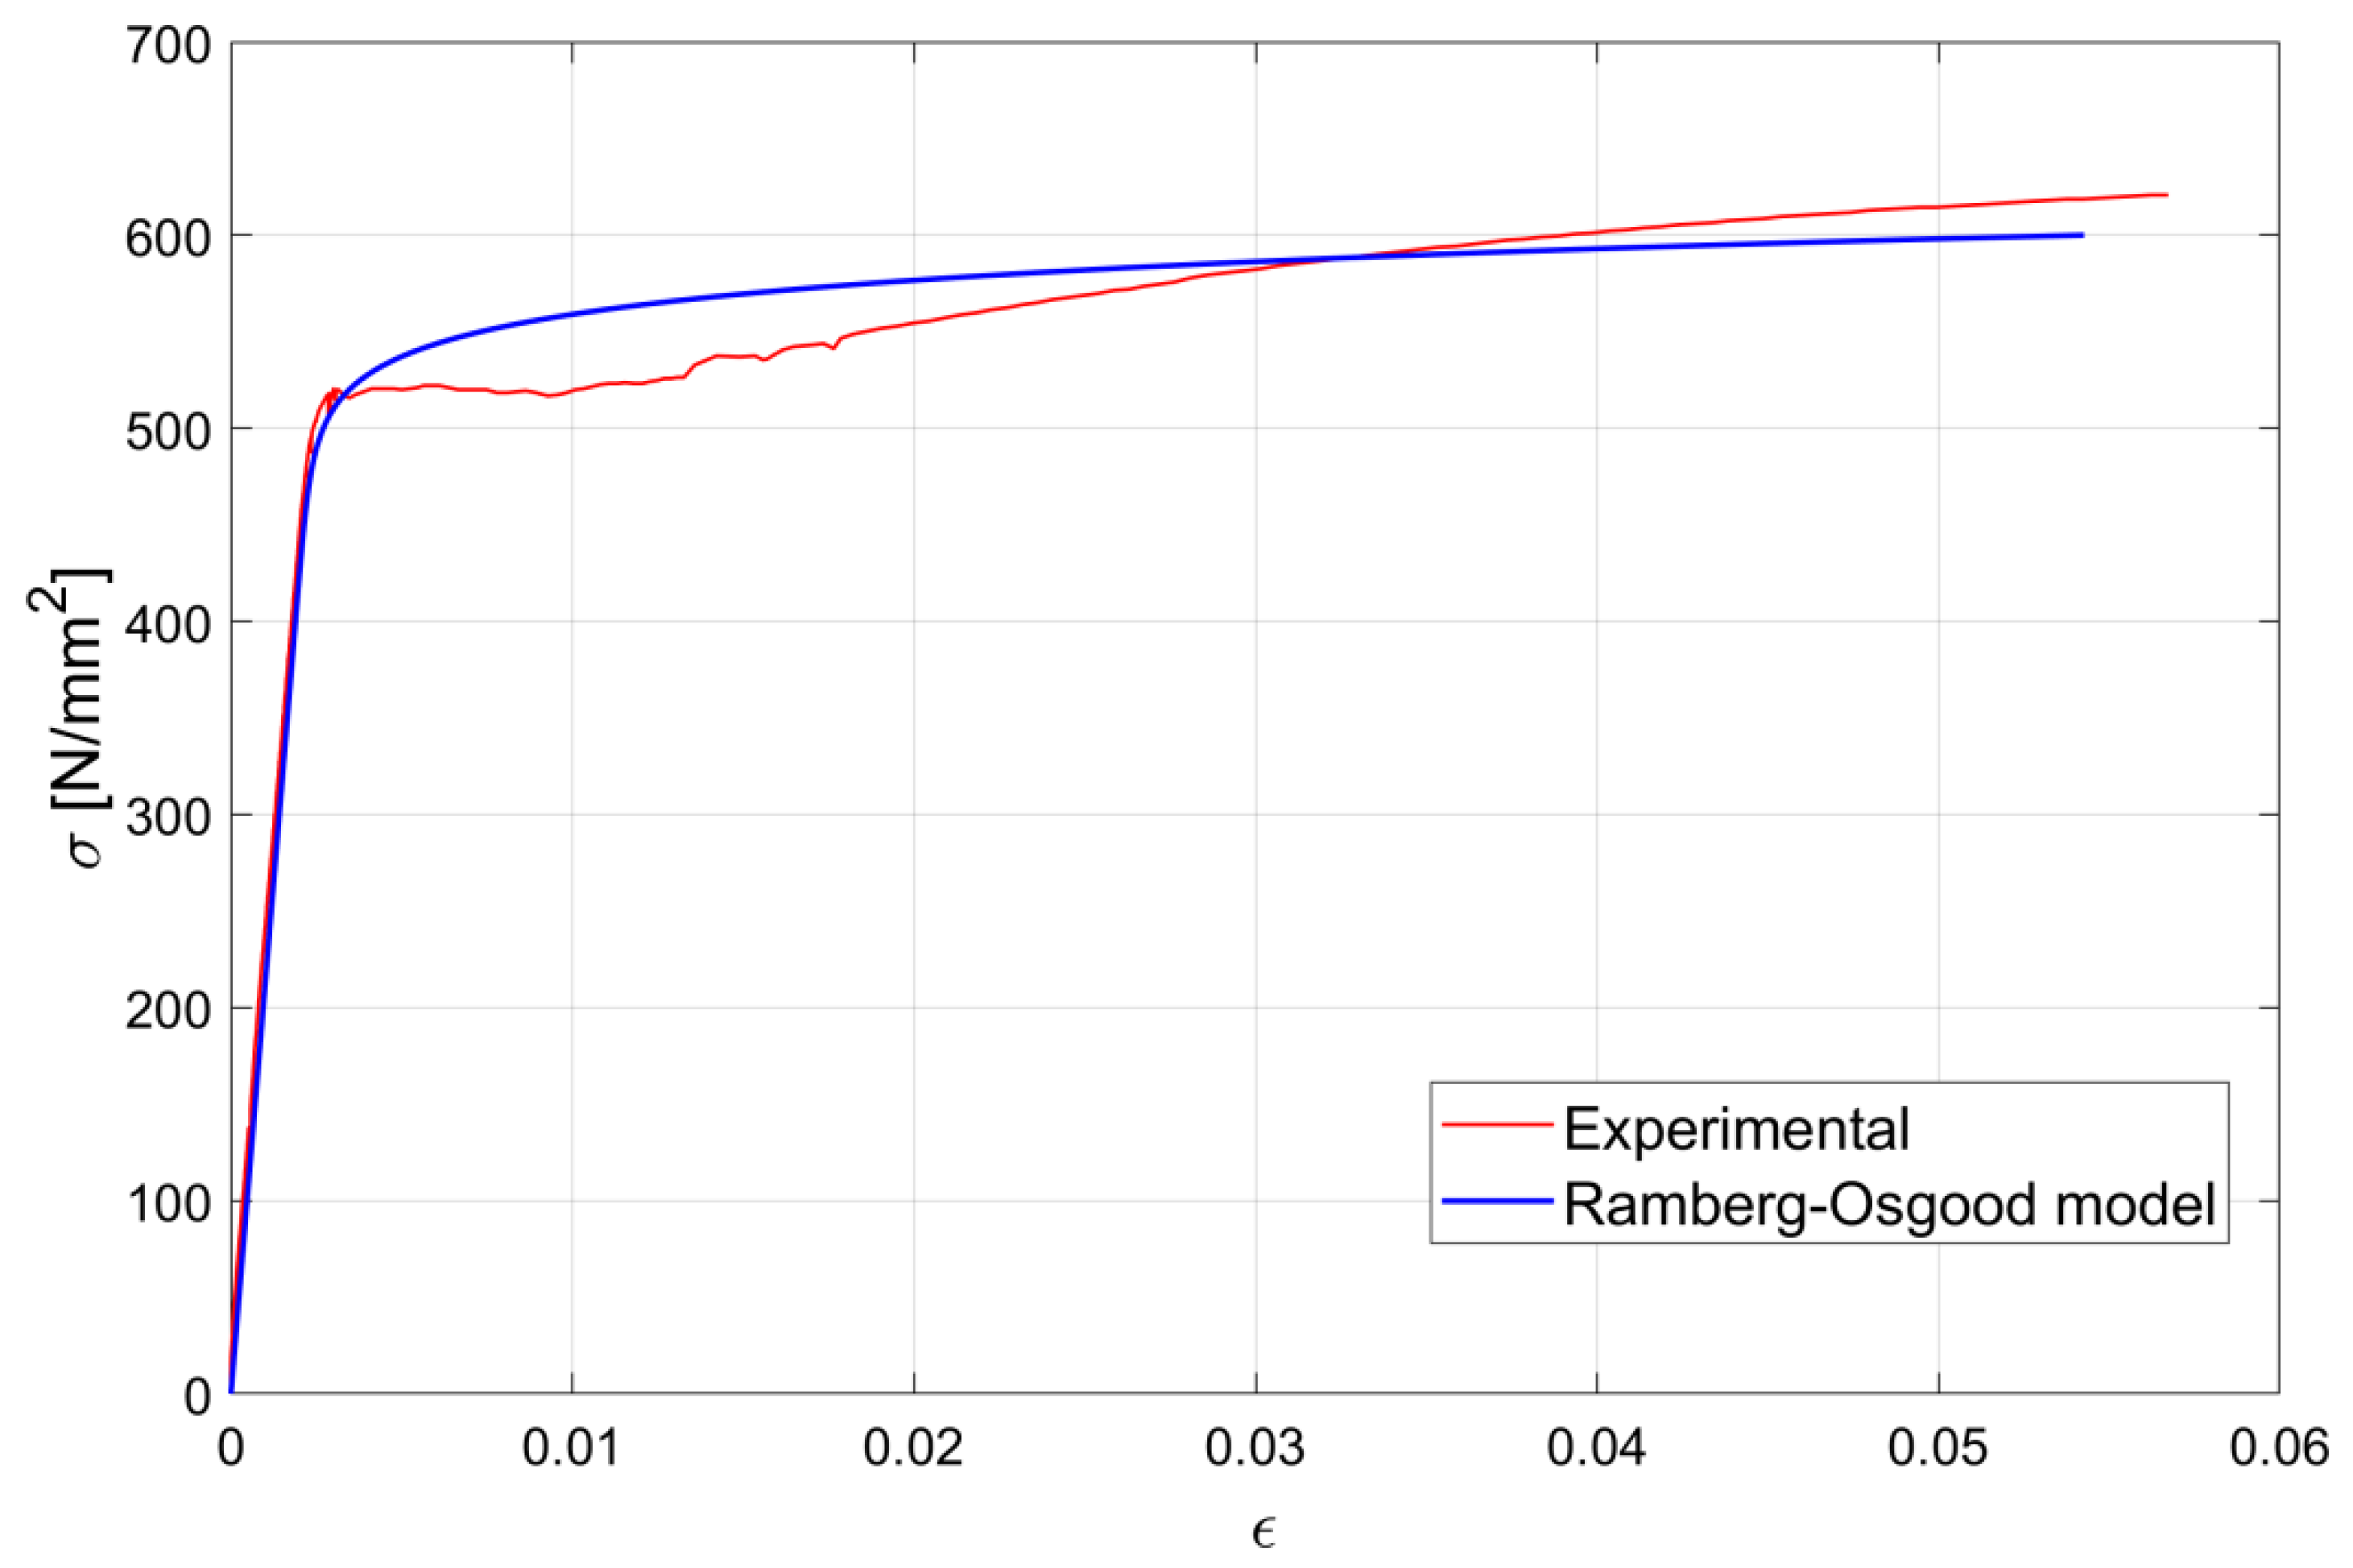
- Ramberg, W.; Osgood, W.R. Description of Stress-Strain Curves by Three Parameters; Technical Note No. 902; National Advisory Committee for Aeronautics: Washington, DC, USA, 1943.
- EN 1992-1-1. Eurocode 2; Design of Concrete Structures—Part 1-1: General Rules and Rules for Buildings. European Committee for Standardization (CEN): Brussels, Belgium, 2004.


| N. | L (mm) | Φ1 (mm) | Φc (mm) | N1 | N2 | NLVDT-A | NLVDT-B |
|---|---|---|---|---|---|---|---|
| 1 | 1000 | 16 | 132 | 4 | 40 | 4 | 4 |
| 2 | 235 | 16 | 132 | 1 | 9 | 4 | 2 |
| 3 | 235 | 16 | 132 | 1 | 9 | 4 | 2 |
| 4 | 235 | 16 | 132 | 1 | 9 | 4 | 2 |
| 5 | 1000 | 20 | 132 | 4 | 40 | 4 | 2 |
| 6 | 1000 | 20 | 132 | 4 | 40 | 4 | - |
| N. | H (mm) | D (mm) | Mass (kg) | Density (kg/m3) | R (kN) | fc (N/mm2) |
|---|---|---|---|---|---|---|
| 1 | 195 | 100 | 3.45 | 2253 | 296 | 37.7 |
| 195 | 100 | 3.45 | 2253 | 318 | 40.5 | |
| 195 | 100 | 3.42 | 2233 | 328 | 41.8 | |
| 195 | 100 | 3.44 | 2246 | 330 | 42.0 | |
| 2, 3, 4 | 193 | 100 | 3.36 | 2217 | 320 | 40.7 |
| 196 | 100 | 3.40 | 2209 | 311 | 39.6 | |
| 5 | 196 | 100 | 3.52 | 2287 | 254 | 32.3 |
| 196 | 100 | 3.52 | 2287 | 299 | 38.1 | |
| 6 | 198 | 100 | 3.56 | 2289 | 234 | 29.8 |
| 196 | 100 | 3.54 | 2300 | 236 | 30.0 |
| N. | H (mm) | D (mm) | Mass (kg) | Density (kg/m3) | R (kN) | fct,sp (N/mm2) |
|---|---|---|---|---|---|---|
| 1 | 200 | 100 | 3.54 | 2254 | 96 | 3.1 |
| 200 | 100 | 3.54 | 2254 | 96 | 3.1 | |
| 2, 3, 4 | 200 | 100 | 3.44 | 2190 | 101 | 3.2 |
| 200 | 100 | 3.50 | 2228 | 91 | 2.9 | |
| 5 | 200 | 100 | 3.56 | 2266 | 106 | 3.4 |
| 200 | 100 | 3.56 | 2266 | 100 | 3.2 | |
| 6 | 200 | 100 | 3.56 | 2266 | 105 | 3.3 |
| 200 | 100 | 3.54 | 2254 | 125 | 4.0 |
| N. | Φc (mm) | fct (N/mm2) | Ect (N/mm2) | fctm(EC2) (N/mm2) | Ect(EC2) (N/mm2) |
|---|---|---|---|---|---|
| 1 | 132 | 2.32 | 29,000 | 3.5 | 35,277 |
| 2 | 132 | 2.16 | 24,100 | 2.4 | 30,835 |
| 3 | 132 | 2.05 | 21,200 | 3.1 | 33,468 |
Publisher’s Note: MDPI stays neutral with regard to jurisdictional claims in published maps and institutional affiliations. |
© 2022 by the authors. Licensee MDPI, Basel, Switzerland. This article is an open access article distributed under the terms and conditions of the Creative Commons Attribution (CC BY) license (https://creativecommons.org/licenses/by/4.0/).
Share and Cite
Croce, P.; Formichi, P.; Landi, F. Experimental Assessment and Numerical Modeling of the Bond–Slip Correlation for Steel Rebars in r.c. Members. Materials 2022, 15, 951. https://doi.org/10.3390/ma15030951
Croce P, Formichi P, Landi F. Experimental Assessment and Numerical Modeling of the Bond–Slip Correlation for Steel Rebars in r.c. Members. Materials. 2022; 15(3):951. https://doi.org/10.3390/ma15030951
Chicago/Turabian StyleCroce, Pietro, Paolo Formichi, and Filippo Landi. 2022. "Experimental Assessment and Numerical Modeling of the Bond–Slip Correlation for Steel Rebars in r.c. Members" Materials 15, no. 3: 951. https://doi.org/10.3390/ma15030951
APA StyleCroce, P., Formichi, P., & Landi, F. (2022). Experimental Assessment and Numerical Modeling of the Bond–Slip Correlation for Steel Rebars in r.c. Members. Materials, 15(3), 951. https://doi.org/10.3390/ma15030951