
Long-Term Water Balance Evaluation in Glass Ionomer Restorative Materials


Abstract
1. Introduction
2. Materials and Methods
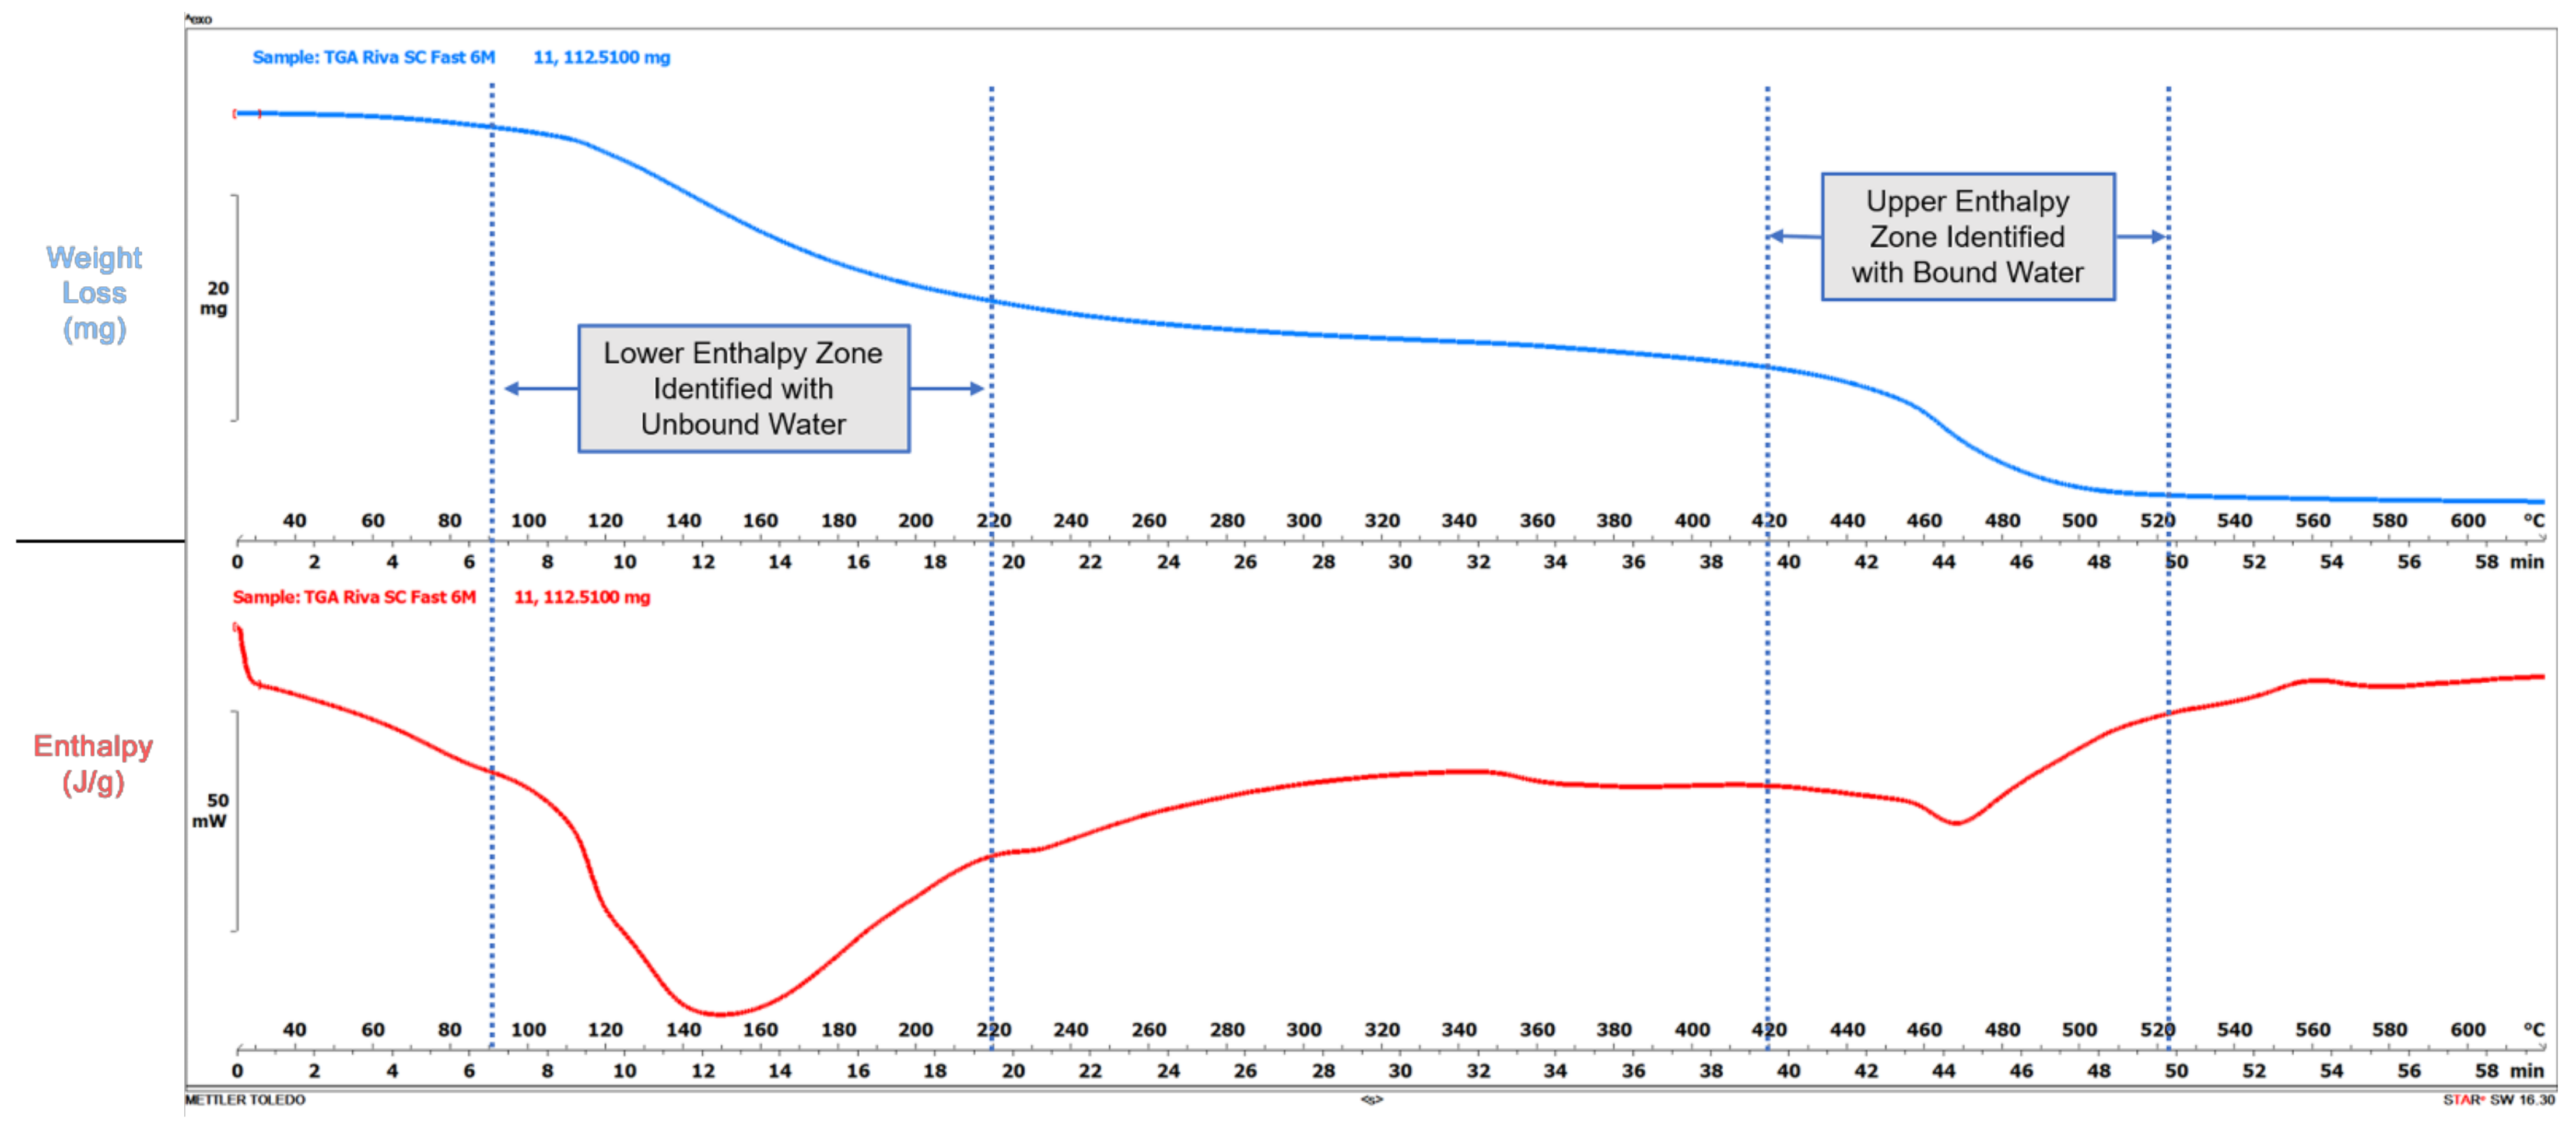
- (1)
- Unbound water content and enthalpy, based on lower temperature enthalpy and weight loss; and
- (2)
- Bound water content and enthalpy, based on higher temperature enthalpy and weight loss.
3. Results
4. Discussion
5. Conclusions
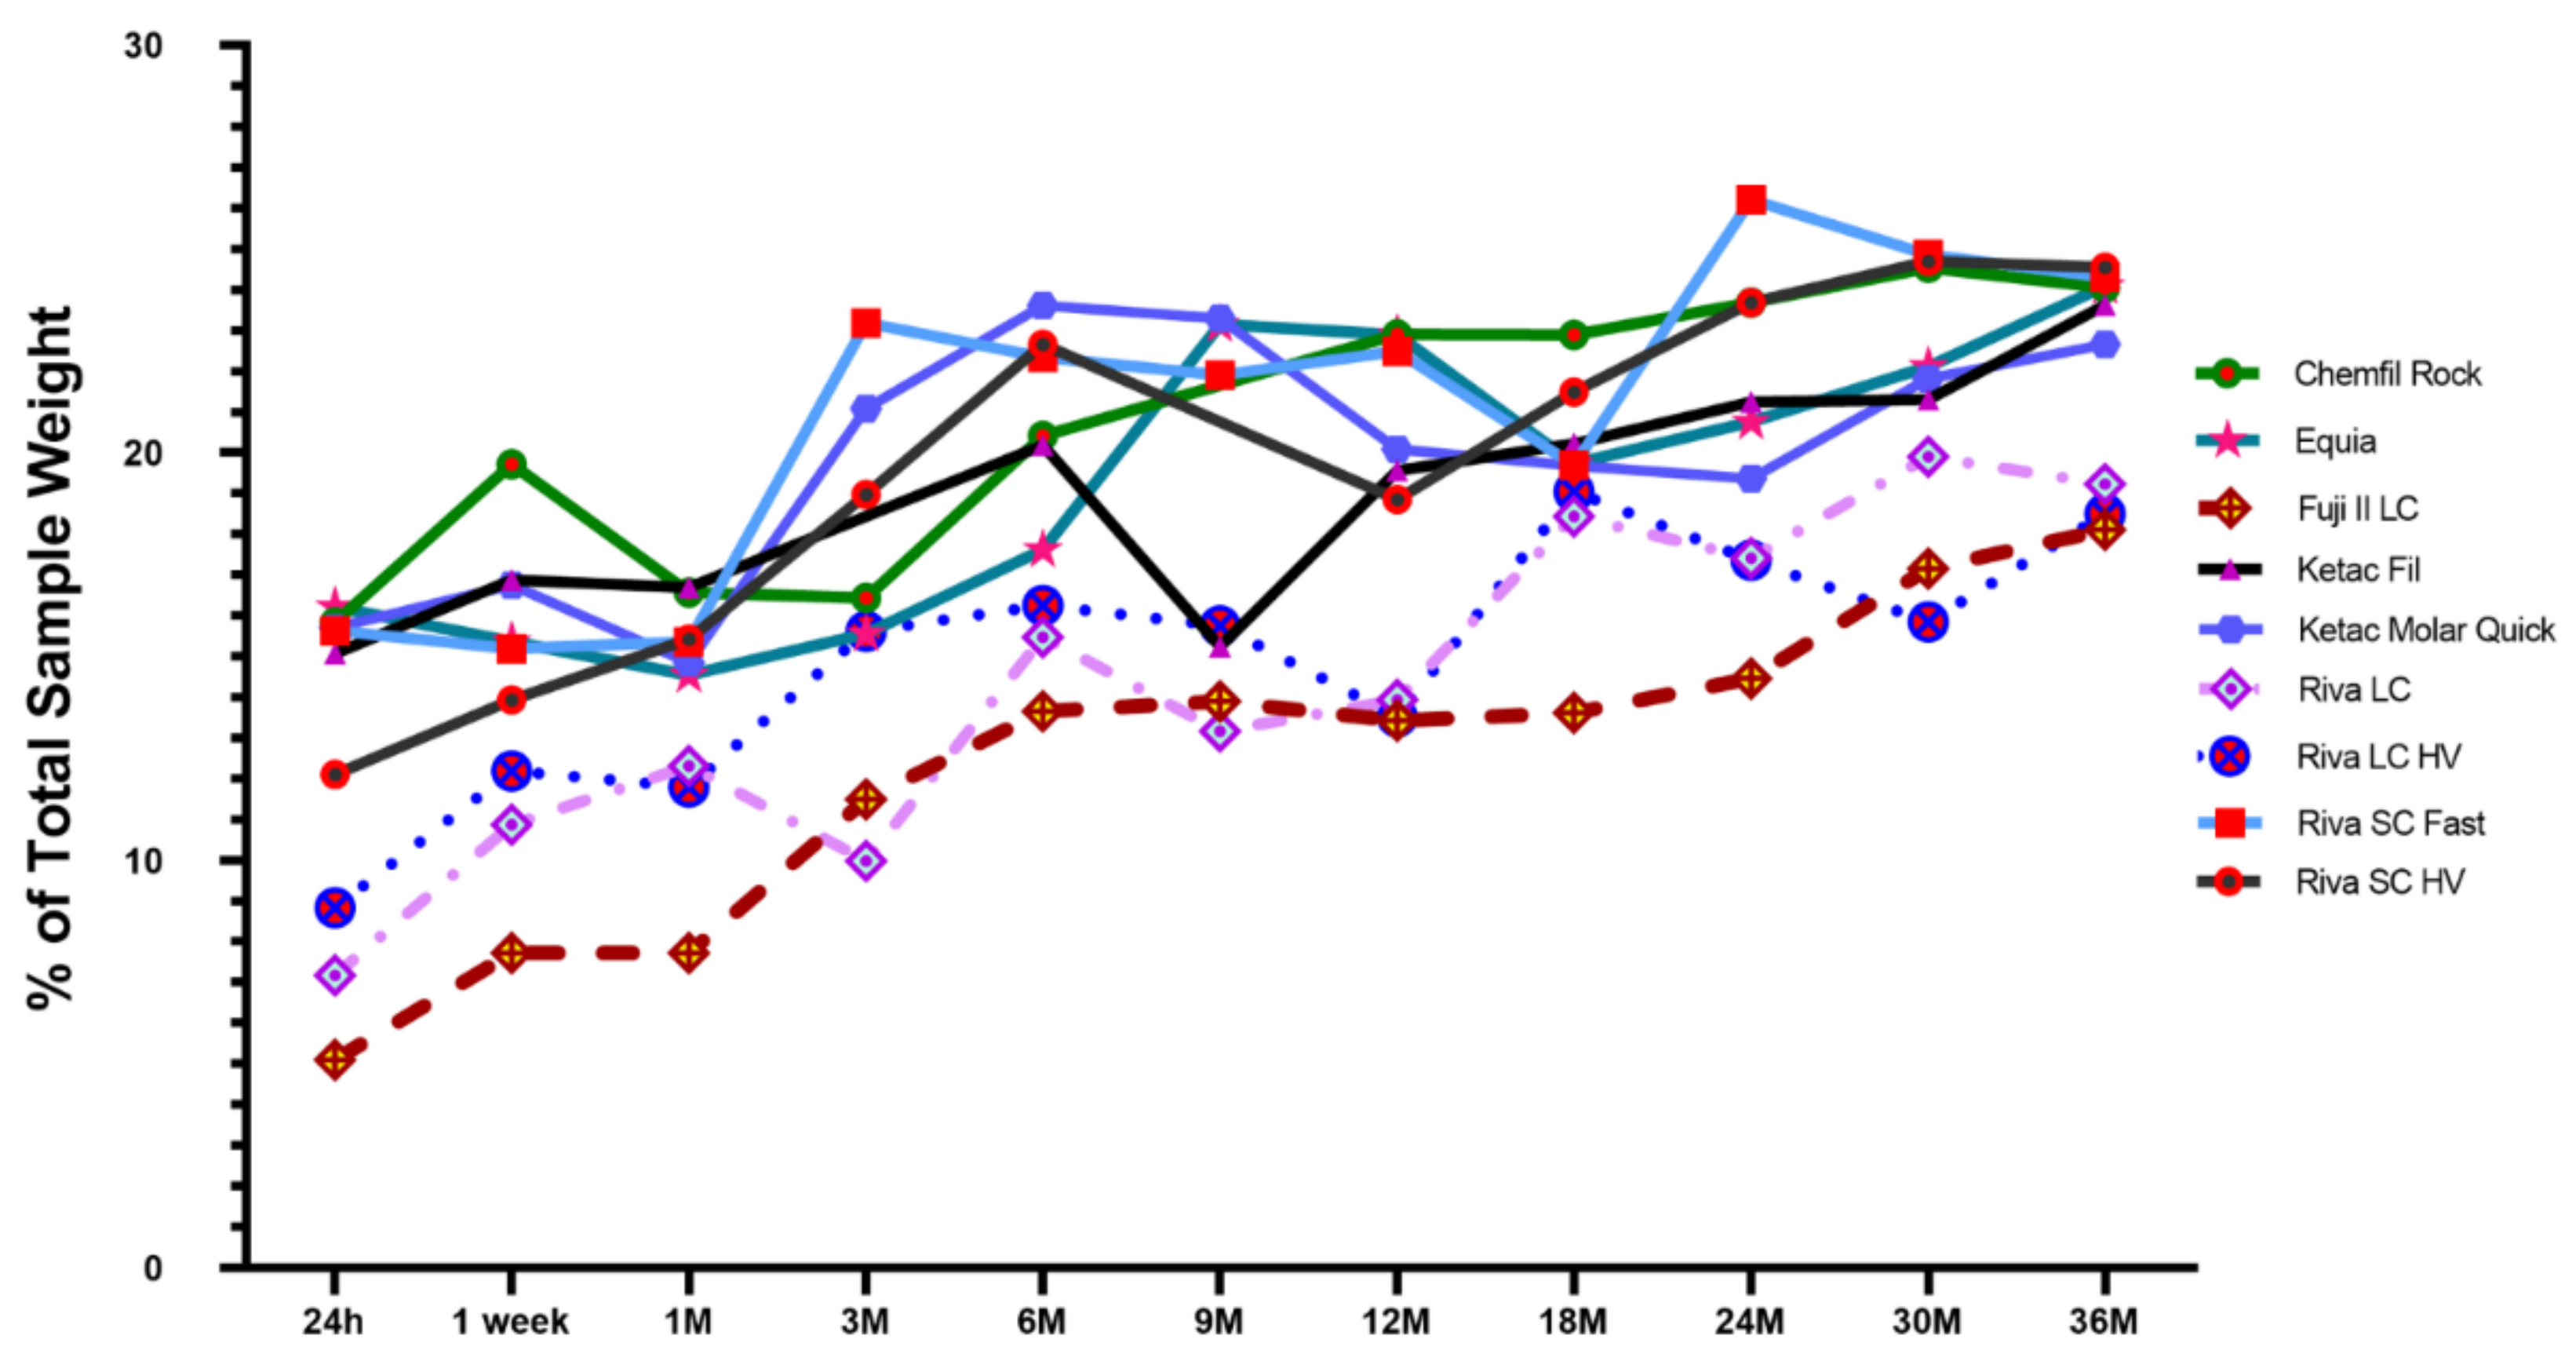
- (1)
- All materials demonstrated a significant increase in percentage of unbound water content over the evaluation period. The time that the unbound water content stabilized was material dependent, with the RMGI products reaching stability at three months and the conventional GIC products maintaining stability at six months. However, unbound water loss is still possible and protective coating placement and reevaluation is advised to maintain unbound water content.
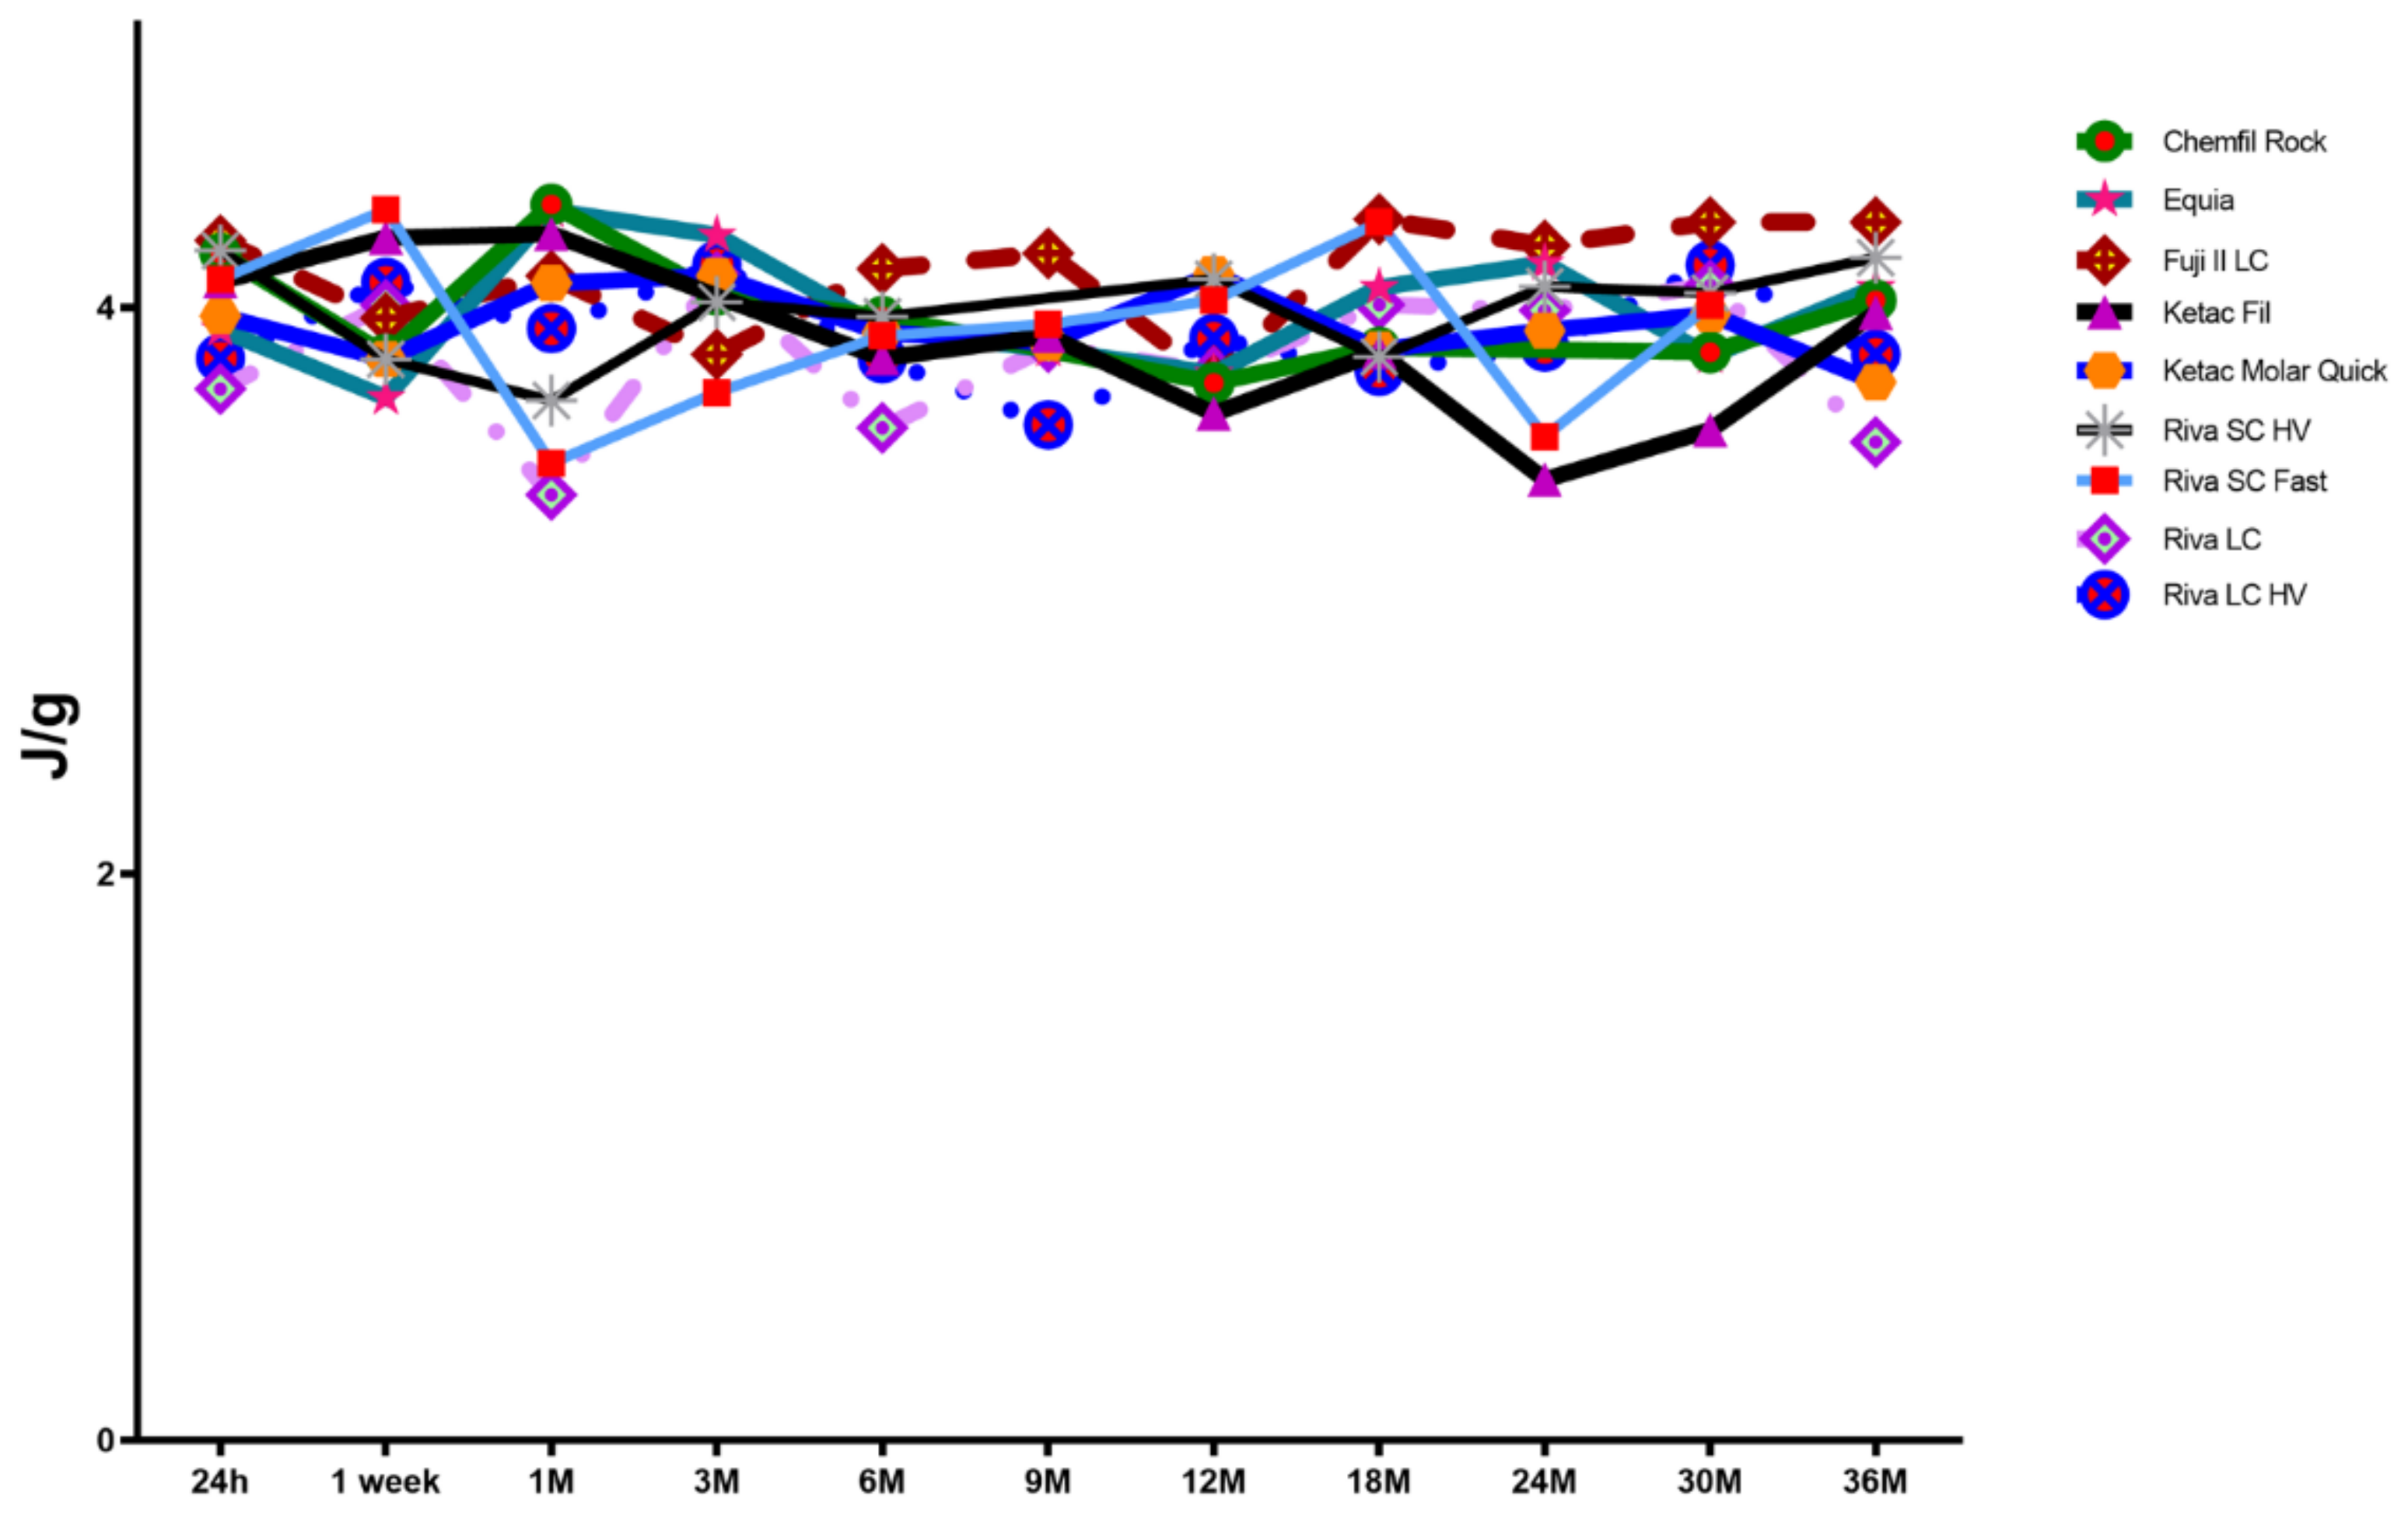
- (2)
- The conventional GIC products required no significant increase in enthalpy to remove the unbound water between 24 h and 36 months. Contrastingly, RMGI products demonstrated significant enthalpy increases required to remove unbound water.
- (3)
- When considered as a percentage of total sample weight, there was no significant increase in bound water content as well as the enthalpy requirement to remove the bound water content past 24 h.
Author Contributions
Funding
Institutional Review Board Statement
Informed Consent Statement
Data Availability Statement
Conflicts of Interest
References
- Da Mata, C.; McKenna, G.; Anweigi, L.; Hayes, M.; Cronin, M.; Woods, N.; O’Mahony, D.; Allen, P.F. An RCT of atraumatic restorative treatment for older adults: 5 year results. J. Dent. 2019, 83, 95–99. [Google Scholar] [CrossRef]
- Frencken, J.E.; Leal, S.C.; Navarro, M.F. Twenty-five-year atraumatic restorative treatment (ART) approach: A comprehensive overview. Clin. Oral. Investig. 2012, 16, 1337–1346. [Google Scholar] [CrossRef]
- De Amorim, R.G.; Frencken, J.E.; Raggio, D.P.; Chen, X.; Hu, X.; Leal, S.C. Survival percentages of atraumatic restorative treatment (ART) restorations and sealants in posterior teeth: An updated systematic review and meta-analysis. Clin. Oral. Investig. 2018, 22, 2703–2725. [Google Scholar] [CrossRef]
- Heck, K.; Frasheri, I.; Diegritz, C.; Manhart, J.; Hickel, R.; Fotiadou, C. Six-year results of a randomized controlled clinical trial of two glass ionomer cements in class II cavities. J. Dent. 2020, 97, 103333. [Google Scholar] [CrossRef] [PubMed]
- Miletić, I.; Baraba, A.; Basso, M.; Pulcini, M.G.; Marković, D.; Perić, T.; Ozkaya, C.A.; Turkun, L.S. Clinical Performance of a Glass-Hybrid System Compared with a Resin Composite in the Posterior Region: Results of a 2-year Multicenter Study. J. Adhes. Dent. 2020, 22, 235–247. [Google Scholar]
- Gurgan, S.; Kutuk, Z.B.; Yalcin Cakir, F.; Ergin, E. A randomized controlled 10 years follow up of a glass ionomer restorative material in class I and class II cavities. J. Dent. 2020, 94, 103175. [Google Scholar] [CrossRef] [PubMed]
- Wilson, A.D.; Kent, B.E. The glass-ionomer cement, a new translucent dental filling material. J. Appl. Chem. 1971, 21, 313. [Google Scholar] [CrossRef]
- Wilson, A.D.; Batchelor, R.F. Dental silicate cements I. The chemistry of erosion. J. Dent. Res. 1967, 46, 1078–1085. [Google Scholar] [CrossRef] [PubMed]
- Nicholson, J.W. Chemistry of glass-ionomer cements: A review. Biomaterials 1998, 19, 485–494. [Google Scholar] [CrossRef]
- Baig, M.S.; Fleming, G.J.P. Conventional glass-ionomer materials: A review of the developments in glass powder, polyacid liquid and the strategies of reinforcement. J. Dent. 2015, 42, 897–912. [Google Scholar] [CrossRef]
- Khoroushi, M.; Keshani, F. A review of glass-ionomers: From conventional glass-ionomer to bioactive glass-ionomer. Dent. Res. J. 2013, 10, 411–420. [Google Scholar]
- Nicholson, J.W.; Sidhu, S.K.; Czarnecka, B. Enhancing the Mechanical Properties of Glass-Ionomer Dental Cements: A Review. Materials 2020, 13, 2510. [Google Scholar] [CrossRef]
- Najeeb, S.; Khurshid, Z.; Zafar, M.S.; Khan, A.S.; Zohaib, S.; Martí, J.M.; Sauro, S.; Matinlinna, J.P.; Rehman, I.U. Modifications in Glass Ionomer Cements: Nano-Sized Fillers and Bioactive Nanoceramics. Int. J. Mol. Sci. 2016, 17, 1134. [Google Scholar] [CrossRef]
- Tüzüner, T.; Dimkov, A.; Nicholson, J.W. The effect of antimicrobial additives on the properties of dental glass-ionomer cements: A review. Acta. Biomater. Odontol. Scand. 2019, 5, 9–21. [Google Scholar] [CrossRef] [PubMed]
- Kantovitz, K.R.; Fernandes, F.P.; Feitosa, I.V.; Lazzarini, M.O.; Denucci, G.C.; Gomes, O.P.; Giovani, P.A.; Moreira, K.M.S.; Pecorari, V.G.A.; Borges, A.F.S.; et al. TiO2 nanotubes improve physico-mechanical properties of glass ionomer cement. Dent. Mater. 2020, 36, e85–e92. [Google Scholar] [CrossRef]
- Hatton, P.V.; Brook, I.M. Characterization of the ultrastructure of glass-ionomer (poly-alkenoate) cement. Br. Dent. J. 1992, 173, 275–277. [Google Scholar] [CrossRef] [PubMed]
- Cattani-Lovente, M.A.; Godin, C.; Meyer, J.M. Mechanical behavior of glass ionomer cements affected by the long-term storage in water. Dent. Mater. 1994, 10, 37–44. [Google Scholar] [CrossRef]
- Matsuya, S.; Maeda, T.; Ohta, M. IR and NMR analyses of hardening and maturation of glass-ionomer cement. J. Dent. Res. 1996, 75, 1920–1927. [Google Scholar] [CrossRef]
- Mitra, S.B. Adhesion to dentin and physical properties of a light-cured glass-ionomer liner/base. J. Dent. Res. 1991, 70, 72–74. [Google Scholar] [CrossRef]
- Friedl, K.H.; Powers, J.M.; Hiller, K.A. Influence of different factors on bond strength of hybrid ionomers. Oper. Dent. 1995, 20, 74–80. [Google Scholar]
- Agha, A.; Parker, S.; Patel, M. Polymerization shrinkage kinetics and degree of conversion of commercial and experimental resin modified glass ionomer luting cements (RMGICs). Dent. Mater. 2020, 36, 893–904. [Google Scholar] [CrossRef] [PubMed]
- Anstice, H.M.; Nicholson, J.W. Studies in the setting of polyelectrolyte materials—Part II: The effect of organic compounds on a glass poly(alkenoate) cement. J. Mater. Sci. Mater. Med. 1994, 5, 299–302. [Google Scholar] [CrossRef]
- Wan, A.C.; Yap, A.U.; Hastings, G.W. Acid-base complex reactions in resin-modified and conventional glass ionomer cements. J. Biomed. Mater. Res. 1999, 48, 700–704. [Google Scholar] [CrossRef]
- Kakaboura, A.; Eliades, G.; Palaghias, G. An FTIR study on the setting mechanism of resin-modified glass ionomer restoratives. Dent. Mater. 1996, 12, 173–178. [Google Scholar] [CrossRef]
- Berzins, D.W.; Abey, S.; Costache, M.C.; Wilkie, C.A.; Roberts, H.W. Resin-modified glass-ionomer setting reaction competition. J. Dent. Res. 2010, 89, 82–86. [Google Scholar] [CrossRef]
- Roberts, H.W.; Berzins, D.C. Early reaction kinetics of contemporary glass-ionomer restorative materials. J. Adhes. Dent. 2015, 17, 67–75. [Google Scholar] [PubMed]
- Yelamanchili, Y.; Darvell, B.W. Network competition in a resin-modified glass-ionomer cement. Dent. Mater. 2008, 24, 1065–1069. [Google Scholar] [CrossRef] [PubMed]
- Kim, Y.K.; Kim, K.H.; Kwon, T.Y. Setting Reaction of Dental Resin-Modified Glass Ionomer Restoratives as a Function of Curing Depth and Post irradiation Time. J. Spectrosc. 2015, 46, 2687. [Google Scholar]
- Young, A.; Sherpa, G.; Pearson, B.; Schottlander Waters, D.N. Use of Raman Spectroscopy in the Characterisation of the Acid–Base Reaction in Glass-Ionomer Cements. Biomaterials 2000, 21, 1971–1979. [Google Scholar] [CrossRef]
- Stamboulis, A.; Matsuya, S.; Hill, R.G.; Law, R.V.; Udoh, K.; Nakagawa, M. MAS-NMR spectroscopy studies in the setting reaction of glass ionomer cements. J. Dent. 2006, 34, 574–581. [Google Scholar] [CrossRef]
- Šantić, A.; Čalogović, A.M.; Pavić, L.; Gladić, J.; Vučić, Z.; Lovrić, D.; Prskalo, K.; Janković, B.; Tarle, Z.; Moguš-Milanković, A. New Insights into the Setting Processes of Glass Ionomer Cements from Analysis of Dielectric Properties. J. Am. Ceram. Soc. 2015, 98, 3869–3876. [Google Scholar] [CrossRef]
- Wren, A.W.; Kidari, A.; Cummins, N.M.; Towler, M.R. A spectroscopic investigation into the setting and mechanical properties of titanium containing glass polyalkenoate cements. J. Mater. Sci. Mater. Med. 2010, 21, 2355–2364. [Google Scholar] [CrossRef] [PubMed]
- Zainuddin, N.; Karpukhina, N.; Hill, R.G.; Law, R.V. A long-term study on the setting reaction of glass ionomer cements by (27)Al MAS-NMR spectroscopy. Dent. Mater. 2009, 25, 290–295. [Google Scholar] [CrossRef]
- Berg, M.C.; Jacobsen, J.; Momsen, N.C.R.; Benetti, A.R.; Telling, M.T.F.; Seydel, T.; Bordallo, H.N. Water dynamics in glass ionomer cements. Eur. Phys. J. Spec. Top. 2016, 225, 773–777. [Google Scholar] [CrossRef]
- Akashi, A.; Matsuya, Y.; Unemori, M.; Akamine, A. The relationship between water absorption characteristics and the mechanical strength of resin-modified glass-ionomer cements in long-term water storage. Biomaterials 1999, 20, 1573–1578. [Google Scholar] [CrossRef]
- Nicholson, J.W. Maturation processes in glass-ionomer dental cements. Acta Biomater. Odont. Scand. 2018, 4, 63–71. [Google Scholar] [CrossRef] [PubMed]
- Nicholson, J.W.; Czarnecka, B. Kinetic studies of water uptake and loss in glass-ionomer cements. J. Mater. Sci. Mater. Med. 2008, 19, 1723–1727. [Google Scholar] [CrossRef] [PubMed]
- Feilzer, A.J.; Kakaboura, A.I.; de Gee, A.J.; Davidson, C.L. The influence of water sorption on the development of setting shrinkage stress in traditional and resin-modified glass ionomer cements. Dent. Mater. 1995, 11, 186–190. [Google Scholar] [CrossRef]
- Hotta, M.; Hirukawa, H.; Yamamoto, K. Effect of coating materials on restorative glass-ionomer cement surface. Oper. Dent. 1992, 17, 57–61. [Google Scholar]
- Jevnikar, P.; Sersâ, I.; Sepe, A.; Jarh, O.; Funduk, N. Effect of surface coating on water migration into resin-modified glass ionomer cements: A magnetic resonance micro-imaging study. Magn. Reason. Med. 2000, 44, 686–691. [Google Scholar] [CrossRef][Green Version]
- Miyazaki, M.; Moore, B.K.; Onose, H. Effect of surface coatings on flexural properties of glass ionomers. Eur. J. Oral. Sci. 1996, 104, 600–604. [Google Scholar] [CrossRef]
- Aydın, N.; Karaoğlanoğlu, S.; Aybala-Oktay, E.; Çetinkaya, S.; Erdem, O. Investigation of water sorption and aluminum releases from high viscosity and resin modified glass ionomer. J. Clin. Exp. Dent. 2020, 12, e844–e851. [Google Scholar] [CrossRef] [PubMed]
- Gorseta, K.; Glavina, D.; Skrinjaric, T.; Czarnecka, B.; Nicholson, J.W. The effect of petroleum jelly, light-cured varnish and different storage media on the flexural strength of glass ionomer dental cements. Acta Biomater. Odontol. Scand. 2016, 29, 55–59. [Google Scholar] [CrossRef] [PubMed]
- Hornsby, P.R. Dimensional stability of glass-ionomer cements. J. Chem. Technol. Biotechnol. 1980, 30, 595–601. [Google Scholar] [CrossRef]
- Wilson, A.D.; Crisp, S. Ionomer Cements. Br. Polym. J. 1975, 7, 279. [Google Scholar] [CrossRef]
- Wilson, A.D.; Crisp, S.; Paddon, J.M. Hydration of a glass ionomer (ASPA) cement. Brit. Polym. J. 1981, 13, 66–70. [Google Scholar] [CrossRef]
- Van Meerbeck, B.; Yoshida, Y.; Inoue, S.; Munck, J.; Landuyt, K.; Lambrechts, P. Glass ionomer adhesion: The mechanisms at the interface. J. Dent. 2006, 34, 615–617. [Google Scholar]
- Czarnecka, B.; Klos, J.; Nicholson, J.W. The effect of ionic solutions on the uptake and water-binding behaviour of glass-ionomer dental cements. Ceram. Silik. 2015, 59, 102–108. [Google Scholar]
- Faroud, M.A.; Stamboulis, A. Nanoclay addition to conventional glass-ionomer cements: Influence on properties. Eur. Dent. J. 2014, 8, 456–463. [Google Scholar] [CrossRef]
- Tadjiev, D.; Hand, R. Surface hydration and nanoindentation of silicate glasses. J. Non-Cryst. Solids 2010, 356, 195–201. [Google Scholar] [CrossRef]
- ISO. 9917-2: Water Based Cements—Part 2: Resin-Modified Cements; International Organization for Standardization: Geneva, Switzerland, 2017. [Google Scholar]
- Pagano, S.; Chieruzzi, M.; Balloni, S.; Lombardo, G.; Torre, L.; Bodo, M.; Cianetti, S.; Marinucci, L. Biological, thermal and mechanical characterization of modified glass ionomer cements: The role of nanohydroxyapatite, ciprofloxacin and zinc l-carnosine. Mater. Sci. Eng. C. Mater. Biol. Appl. 2019, 94, 76–85. [Google Scholar] [CrossRef]
- Bourke, A.M.; Walls, A.W.; McCabe, J.F. Light-activated glass polyalkenoate (ionomer) cements: The setting reaction. J. Dent. 1992, 20, 115–120. [Google Scholar] [CrossRef]
- Kilpatrick, N.M.; McCabe, J.F.; Murray, J.J. Factors that influence the setting characteristics of encapsulated glass ionomer cements. J. Dent. 1994, 22, 182–187. [Google Scholar] [CrossRef]
- Micelli, F.; Maffezzoli, A.; Terzi, R.; Luprano, V.A. Characterization of the kinetic behavior of resin modified glass-ionomer cements by DSC, TMA and ultrasonic wave propagation. J. Mater. Sci. Mater. Med. 2001, 12, 151–156. [Google Scholar] [CrossRef]
- Khalil, S.K.; Atkins, E.D. Investigation of glass-ionomer cements using differential scanning calorimetry. J. Mater. Sci. Mater. Med. 1998, 9, 529–533. [Google Scholar] [CrossRef]
- Zelmer, C.; Wang, D.K.; Keen, I.; Hill, D.J.; Symons, A.L.; Walsh, L.J.; Rasoul, F. Synthesis and characterization of POSS-(PAA)8 star copolymers and GICs for dental applications. Dent. Mater. 2016, 32, e82–e92. [Google Scholar] [CrossRef] [PubMed]
- McNeill, I.C.; Sadeghi, S.M.T. Thermal stability and degradation mechanisms of poly(acrylic acid) and its salts: Part 1—Poly(-acrylic acid). Polym. Degrad. Stab. 1990, 29, 233–246. [Google Scholar] [CrossRef]
- Pedersen, M.T.; Tian, K.V.; Dobó-Nagy, C.; Chass, G.A.; Greaves, G.N.; Yue, Y. Phase separation in an ionomer glass: Insight from calorimetry and phase transitions. J. Non-Cryst. Solids 2015, 415, 24–29. [Google Scholar] [CrossRef]
- Caárdenas, G.; Munñoz, C.; Carbacho, H. Thermal Properties and TGA−FTIR Studies of Polyacrylic and Polymethacrylic Acid Doped with Metal Clusters. Eur. Polym. J. 2000, 36, 1091–1099. [Google Scholar] [CrossRef]
- Roberts, H.; Berzins, D. Thermal Analysis of Contemporary Glass-Ionomer Restorative Materials. J. Therm. Anal. Calorim. 2013, 115, 2099–2106. [Google Scholar] [CrossRef]
- McNeil, I.C.; Sadeghi, S.M.T. Thermal stability and degradation mechanisms of poly(acrylic acid) and its salts: Part 3—Magnesium and calcium salts. Polym. Degrad. Stab. 1990, 30, 267–282. [Google Scholar] [CrossRef]
- Nicholson, J.W.; Wilson, A.D. Thermal behaviour of films of partially neutralized poly(acrylic acid). 1: Influence of metal ions. Br. Polym. J. 1987, 19, 67–72. [Google Scholar] [CrossRef]
- Ferrante, M.; Petrini, M.; Trentini, P.; Ciavarelli, L.; Spoto, G. Thermal analysis of light curing composites. J. Therm. Anal. Calorim. 2010, 102, 107–111. [Google Scholar] [CrossRef]
- Berg, M.C.; Benetti, A.R.; Telling, M.T.F.; Seydel, T.; Yu, D.; Daemen, L.L.; Bordallo, H.N. Nanoscale Mobility of Aqueous Polyacrylic Acid in Dental Restorative Cements. ACS Appl. Mater. Interfaces 2018, 10, 9904–9915. [Google Scholar] [CrossRef] [PubMed]
- Prosser, H.J.; Wilson, A.D. Litho-ionomer cements and their technological applications. J. Chem. Techol. Biotechnol. 1979, 29, 69–87. [Google Scholar] [CrossRef]
- Wilson, A.D.; Kent, B.E.; Batchelor, R.F.; Scott, B.G.; Lewis, B.G. Dental silicate cements. XII. The role of water. J. Dent. Res. 1970, 49, 307–314. [Google Scholar] [CrossRef] [PubMed]


| Product (Shade) Manufacturer | Type | Water/Powder Ratio | Powder | Liquid |
|---|---|---|---|---|
| Chemfil Rock (A2) Dentsply Sirona, York, PA, USA | GIC | 0.442/0.12 (g/g) B | Polycarboxylic acid * 10–25% Tartaric acid 0–2.5% | Butanedioic acid, 2-methylene-, polymer with 2-propenoic acid 10–25% Tartaric acid 3–10% (**) |
| Equia Fil (A2) GC America, Alsip, IL, USA | GIC | 0.40/0.12 (g/g) | poly(acrylic acid) 2–5% | polybasic carboxylic acid* 5–10% |
| Fuji II LC (A2) GC America | RMGI | 0.33/0.10 (g/g) | * | HEMA;* basic carboxylic acid* UDMA * |
| Ketac Fil Aplicap (A2) 3M Oral Care, St. Paul, MN, USA | GIC | 3.6:1 C | Glass Powder >99% * | Water 40–60% * Copolymer acrylic-maleic acid 30–50% * Tartaric acid 5–15% * |
| Ketac Molar Quick (A2) 3M Oral Care | GIC | 3.4:1 | Copolymer of acrylic-maleic acids 1–6% Dichlorodimethylsilane, reaction products with silica <2% | Water 60–65%% * Copolymer acrylic-maleic acid 30–40% * Tartaric acid 5–10% * |
| Riva LC (A2) SDI North America, Itasca, IL, USA. | RMGI | 0.42/0.14 (g/g) | glass powder * 95–100% | HEMA 20–30% acrylic acid homopolymer 15–25% dimethacrylate cross-linker 10–25% acidic monomer 10–20% tartaric acid 1–5% |
| Riva LC HV (A2) SDI North America | RMGI | 0.43/0.13 (g/g) | glass powder * 93–100% | HEMA 15–25% acrylic acid homopolymer 15–25% dimethacrylate cross-linker 10–25% acidic monomer 10–20% tartaric acid 1–5% |
| Riva SC Fast (A2) SDI North America | GIC | 0.42/0.13 (g/g) | fluoro aluminosilicate glass 90–95% | acrylic acid homopolymer 20–30% tartaric acid 10–15% |
| Riva SC HV (A2) SDI North America | GIC | 0.50/0.13 (g/g) | fluoro aluminosilicate glass 90–95% acrylic acid homopolymer 5–10% | acrylic acid homopolymer 20–30% tartaric acid 10–15% |
| 24 h | 1 Week | 1 Month | 3 Months | 6 Months | 9 Months | 12 Months | 18 Months | 24 Months | 30 Months | 36 Months | |
|---|---|---|---|---|---|---|---|---|---|---|---|
| Chemfil Rock | 15.8 (0.4) A a | 19.7 (1.1) A ab | 16.6 (1.7) A a | 16.4 (2.0) AB a | 20.4 (2.7) AB ab | * | 22.9 (2.5) A b | 22.9 (1.7) A b | * | 24.5 (2.4) A b | 24.1 (2.3) A b |
| Equia | 16.2 (2.3) A bc | 15.4 (2.2) ABC bc | 14.6 (1.4) A c | 15.6 (1.9) AB bc | 17.6 (2.1) ABC abc | 23.2 (5.2) A a | 22.9 (3.4) A a | 19.7 (5.2) AB ab | 20.8 (4.4) AB ab | 22.1 (6.5) AB a | 24.1 (5.0) A a |
| Fuji II LC | 5.1 (0.8) C c | 7.7 (0.5) D bc | 7.9 (0.6) B bc | 11.5 (2.8) B abc | 13.7 (2.4) C ab | 13.9 (3.1) B ab | 13.4 (3.1) C ab | 13.6 (2.9) AB ab | 14.5 (2.5) C ab | 17.2 (4.1) B a | 18.1 (3.9) B a |
| Ketac Fil | 15.1 (4.0) AB c | 16.9 (1.4) AB bc | 16.7 (3.5) A bc | * | 20.2 (3.5) AB ab | 15.2 (1.9) B c | 19.6 (2.3) AB ab | 20.2 (3.7) AB abc | 21.2 (2.0) AB ab | 21.3 (3.0) AB ab | 23.6 (4.2) AB a |
| Ketac Molar Quick | 15.7 (1.4) A bc | 16.8 (1.8) AB bc | 14.9 (1.8) A c | 21.1 (4.0) A a | 23.6 (5.1) A a | 23.3 (2.7) A a | 20.1 (2.0) AB ab | 19.7 (2.8) AB ab | 19.4 (2.0) ABC bc | 21.8 (2.6) AB a | 22.7 (3.7) AB a |
| Riva LC | 6.9 (1.9) C c | 12.8 (4.4) CD abc | 8.4 (2.2) AB abc | 13.0 (2.3) B abc | 9.8 (3.0) BC bc | 12.9 (5.3) B abc | 13.1 (3.8) B abc | 15.0 (4.5) BC ab | 12.5 (2.2) BC abc | 14.9 (3.3) AB ab | 17.9 (2.9) B a |
| Riva LC HV | 8.8 (1.3) BC b | 12.2 (3.3) BCD b | 11.8 (1.7) AB ab | 15.6 (3.7) AB a | 16.3 (2.4) BC a | 15.8 (4.4) B a | 13.5 (1.7) B ab | 19.0 (5.4) ABC a | 17.4 (1.2) BC a | 15.9 (1.9) B a | 18.5 (2.1) B a |
| Riva SC Fast | 15.6 (1.1) A bc | 15.2 (1.1) BC c | 19.5 (3.3) A abc | 23.2 (4.1) A a | 22.4 (5.2) A ab | 21.9 (4.2) A abc | 22.5 (3.2) A a | 19.7 (2.0) AB abc | 26.2 (4.6) A a | 24.9 (3.0) A a | 24.3 (2.6) A a |
| Riva SC HV | 12.1 (0.5) AB c | 13.9 (2.2) BCD c | 15.4 (2.0) A bc | 19.0 (2.4) A abc | 22.7 (3.9) A ab | * | 18.9 (1.8) AB bc | 21.5 (2.8) A ab | 23.7 (2.9) A a | 24.7 (2.4) A a | 24.6 (2.1) A a |
| 24 h | 1 Week | 1 Month | 3 Months | 6 Months | 9 Months | 12 Months | 18 Months | 24 Months | 30 Months | 36 Months | |
|---|---|---|---|---|---|---|---|---|---|---|---|
| Chemfil Rock | 17.4 (2.3) A ab | 17.8 (4.7) A ab | 11.3 (2.0) AB c | 13.6 (3.1) A bc | 15.0 (3.1) A abc | * | 11.3 (3.4) A c | 11.4 (3.2) A c | * | 15.6 (2.1) A abc | 19.3 (2.1) A a |
| Equia | 14.4 (3.4) A a | 15.5 (3.0) A a | 12.3 (1.7) AB a | 12.0 (2.5) AB a | 14.1 (2.4) AB a | 14.5 (3.7) AB a | 12.3 (2.9) A a | 16.5 (3.3) A a | 10.7 (3.5) B a | 15.9 (3.2) A a | 14.4 (2.3) B a |
| Fuji II LC | 4.2 (1.5) B c | 6.2 (1.7) B c | * | 10.4 (2.0) AB bc | 9.7 (2.5) B bc | 12.4 (2.5) AB ab | 11.7 (3.6) A ab | 11.7 (3.2) A ab | 11.7 (2.5) AB ab | 17.1 (2.8) A a | 13.2 (2.7) B ab |
| Ketac Fil | 17.2 (2.5) A a | 16.6 (3.0) A a | 17.5 (5.0) A a | * | 15.9 (4.1) A a | 16.5 (3.6) A a | 16.4 (3.7) A a | 12.6 (3.9) A a | 16.6 (3.1) A a | 15.3 (4.5) A a | 16.1 (2.3) AB a |
| Ketac Molar Quick | 17.1 (4.2) A a | 16.6 (3.4) A a | 15.8 (4.2) A ab | 12.8 (3.2) A ab | 9.6 (1.7) B b | 10.1 (2.3) B b | 14.5 (5.6) A ab | 14.4 (4.2) A ab | 15.1 (6.1) AB ab | 12.6 (5.1) A ab | 19.7 (3.8) A a |
| Riva LC | 6.9 (1.9) B b | 12.8 (4.4) AB ab | 8.4 (2.2) B ab | 13.0 (2.3) AB ab | 9.8 (3.0) AB ab | 13.0 (5.3) B ab | 13.1 (3/8) A ab | 15.0,(4.5) A a | 12.5 (2.2) AB ab | 15.0 (3.4) A a | 18.0 (3.0) AB a |
| Riva LC HV | 7.0 (2.5) B b | 5.5 (1.5) B b | 8.7 (1.8) B ab | 10.7 (3.0) AB ab | 10.9 (3.8) AB ab | 13.2 (3.0) AB a | 12.4 (3.4) A a | 13.2 (3.4) A a | 13.0 (3.5) AB a | 13.8 (2.1) A a | 13.2 (3.0) B a |
| Riva SC Fast | 14.7 (2.6) A a | 11.7 (2.3) AB ab | 7.0 (2.0) B b | 8.2 (1.8) B b | 10.8 (3.0) AB ab | 10.3 (2.9) B ab | 15.1 (3.5) A a | 12.8 (4.1) A ab | 11.4 (3.3) B ab | 14.2 (1.9) A a | 16.7 (3.4)AB a |
| Riva SC HV | 12.1 (1.8) AB ab | 8.20 (2.5) A b | 9.30 (2.1) B b | 14.0 (5.0) A ab | 13.2 (3.5) AB ab | * | 12.6 (4.8) A ab | 12.7 (4.0) A ab | 12.4 (3.6) AB ab | 11.7 (4.2) A ab | 16.3 (4.2) AB a |
| 24 h | 1 Week | 1 Month | 3 Months | 6 Months | 9 Months | 12 Months | 18 Months | 24 Months | 30 Months | 36 Months | |
|---|---|---|---|---|---|---|---|---|---|---|---|
| Chemfil Rock | 1.3 (0.2) B a | 1.5 (0.4) B a | 1.6 (0.2) AB a | 1.7 (0.4) AB a | 1.6 (0.2) AB a | * | 1.6 (0.3) B a | 1.6 (0.2) AB a | * | 1.5 (0.6) B a | 1.7 (0.4) B a |
| Equia | 2.3 (0.5) A a | 2.1 (0.3) A a | 1.9 (0.2) A a | 2.0 (0.1) A a | 1.9 (0.1) A | 1.9 (0.2) AB a | 1.9 (0.2) A a | 1.8 (0.1) AB a | 1.8 (0.1) AB a | 2.1 (0.2) A a | 2.1 (0.2) A a |
| Fuji II LC | 1.8 (0.3) AB ab | 1.6 (0.1) AB ab | 1.4 (0.2) B b | 1.4 (0.1) B b | 1.4 (0.1) B b | 1.7 (0.3) AB ab | 2.0 (0.1) A a | 2.1 (0.2) A a | 2.1 (0.1) A a | 1.9 (0.4) AB a | 2.1 (0.3) A a |
| Ketac Fil | 1.7 (0.3) AB ab | 1.9 (0.3) AB a | 2.1 (0.3) A a | * | 2.0 (0.3) A a | 2.1 (0.1) A a | 1.7 (0.3) AB ab | 1.5 (0.3) AB b | 1.7 (0.2) AB ab | 1.7 (0.2) AB ab | 1.6 (0.2) B ab |
| Ketac Molar Quick | 1.1 (0.1) B a | 1.3 (0.2) B a | 1.2 (0.1) B a | 1.4 (0.4) B a | 1.3 (0.2) B a | 1.4 (0.2) B a | 1.4 (0.1) B a | 1.3 (0.3) B a | 1.3 (0.1) B a | 1.3 (0.1) B a | 1.3 (0.1) B a |
| Riva LC | 2.0 (0.2) AB a | 1.7 (0.3) AB a | * | 1.9 (0.3) AB a | 1.6 (0.3) AB a | 2.0 (0.2) A a | 1.9 (0.1) A a | 2.0 (0.3) A a | 2.0 (0.2) A a | 2.1 (0.2) A a | 2.1 (0.1) A a |
| Riva LC HV | 1.7 (0.3) AB a | 1.9 (0.3) AB a | 2.0 (0.2) A a | 2.0 (0.1) A a | 1.9 (0.2) A a | 2.0 (0.1) A a | 2.1 (0.1) A a | 2.1 (0.2) A a | 2.1 (0.1) A a | 2.1 (0.2) A a | 2.1 (0.4) A a |
| Riva SC Fast | 1.8 (0.3) AB a | 2.1 (0.3) A a | * | 1.7 (0.3) AB a | 1.8 (0.2) AB a | 1.6 (0.2) AB a | 1.8 (0.4) AB a | 2.0 (0.2) A a | 1.9 (0.3) AB a | 1.8 (0.3) AB a | 1.9 (0.1) A a |
| Riva SC HV | 1.6 (0.4) AB a | 1.6 (0.1) AB a | 1.8 (0.3) AB a | 1.6 (0.3) AB a | 1.8 (0.2) AB a | * | 2.1 (0.2) A a | 1.8 (0.1) AB a | 1.7 (0.3) AB a | * | 1.8 (0.2) AB a |
| 24 h | 1 Week | 1 Month | 3 Months | 6 Months | 9 Months | 12 Months | 18 Months | 24 Months | 30 Months | 36 Months | |
|---|---|---|---|---|---|---|---|---|---|---|---|
| Chemfil Rock | 4.19 (1.1) A a | 3.83 (0.84) A a | 4.36 (1.2) A a | 4.0 (1.1) A a | 4.0 (0.9) A a | * | 3.73 (0.9) A a | 3.85 (0.7) A a | * | 3.84 (1.1) A a | 4.02 (0.7) A a |
| Equia | 3.92 (0.4) A a | 3.68 (0.8) A a | 4.34 (0.5) A a | 4.25 (1.8) A a | 3.92 (0.7) A a | 3.85 (1.3) A a | 3.76 (0.5) A a | 4.07 (0.8) A a | 4.15 (0.6) A a | 3.82 (1.1) a | 4.07 (0.8) A a |
| Fuji II LC | 4.23 (1.2) A a | 4.0 (0.8) A a | * | 3.83 (1.4) A a | 4.1 (1.0) A a | 4.20 (0.6) A a | 3.74 (1.2) A a | 4.31 (1.0) A a | 4.2 (1.4) A a | 4.30 (1.5) A a | 4.31 (1.0) A a |
| Ketac Fil | 4.10 (0.9) A a | 4.24 (1.2) A a | 4.26 (2.1) A a | * | 3.82 (0.5) A a | 3.90 (1.1) A a | 3.62 (1.1) A a | 3.84 (0.8) A a | 3.40 (0.5) A a | 3.56 (0.4) A a | 3.98 (0.9) A a |
| Ketac Molar Quick | 3.97 (0.5) A a | 3.81 (0.4) A a | 4.1 (0.5) A a | 4.1 (1.3) A a | 3.91 (1.0) A a | 3.87 (0.6) A a | 4.12 (1.4) A a | 3.85 (1.1) A a | 3.91 (0.5) A a | 4.0 (0.8) A a | 3.73 (2.1) A a |
| Riva LC | 3.71 (0.8) A a | 4.01 (1.1) A a | 3.33 (1.3) A a | 4.11 (1.3) A a | 3.57 (1.3) A a | 3.86 (1.0) A a | 3.77 (1.1) A a | 4.00 (0.9) A a | 4.1 (1.4) A a | 4.07 (1.3) A a | 3.52 (0.9) A a |
| Riva LC HV | 3.82 (1.4) A a | 4.08 (1.5) A a | 3.92 (0.8) A a | 4.15 (0.2) A a | 3.81 (0.7) A a | 3.58 (0.5) A a | 3.90 (0.9) A a | 3.77 (1.2) A a | 3.86 (1.0) A a | 4.15 (1.0) A a | 3.83 (0.9) A a |
| Riva SC Fast | 4.10 (0.8) A a | 4.34 (0.4) A a | 3.45 (0.5) A a | 3.70 (0.6) A a | 3.9 (1.5) A a | 3.94 (1.4) A a | 4.02 (1.2) A a | 4.30 (1.5) A a | 3.54 (1.2) A a | 4.00 (1.4) A a | 4.10 (0.8) A a |
| Riva SC HV | 4.20 (1.1) A a | 3.82 (0.7) A a | 3.67 (0.9) A a | 4.01 (1.1) A a | 4.00 (0.6) A a | * | 4.10 (0.5) A a | 3.82 (0.6) A a | 4.07 (0.9) A a | 4.05 (0.9) A a | 4.17 (1.0) A a |
Publisher’s Note: MDPI stays neutral with regard to jurisdictional claims in published maps and institutional affiliations. |
© 2022 by the authors. Licensee MDPI, Basel, Switzerland. This article is an open access article distributed under the terms and conditions of the Creative Commons Attribution (CC BY) license (https://creativecommons.org/licenses/by/4.0/).
Share and Cite
Roberts, H.; Berzins, D.; Nicholson, J. Long-Term Water Balance Evaluation in Glass Ionomer Restorative Materials. Materials 2022, 15, 807. https://doi.org/10.3390/ma15030807
Roberts H, Berzins D, Nicholson J. Long-Term Water Balance Evaluation in Glass Ionomer Restorative Materials. Materials. 2022; 15(3):807. https://doi.org/10.3390/ma15030807
Chicago/Turabian StyleRoberts, Howard, David Berzins, and John Nicholson. 2022. "Long-Term Water Balance Evaluation in Glass Ionomer Restorative Materials" Materials 15, no. 3: 807. https://doi.org/10.3390/ma15030807
APA StyleRoberts, H., Berzins, D., & Nicholson, J. (2022). Long-Term Water Balance Evaluation in Glass Ionomer Restorative Materials. Materials, 15(3), 807. https://doi.org/10.3390/ma15030807