Article

Effects of Moisture on NHCapture Using Activated Carbon and Acidic Porous Polymer Modified by Impregnation with H3PO4: Sorbent Material Characterized by Synchrotron XRPD and FT-IR

1
Department of Safety, Health and Environmental Engineering, National Yunlin University Science and Technology, Douliu 640301, Taiwan
2
Department of Chemical Engineering, National Chung Cheng University, Chia-Yi 621301, Taiwan
*
Author to whom correspondence should be addressed.
Materials 2022, 15(3), 784; https://doi.org/10.3390/ma15030784
Submission received: 13 December 2021 / Revised: 8 January 2022 / Accepted: 17 January 2022 / Published: 20 January 2022
(This article belongs to the Special Issue Novel Inorganic Adsorbents for Environmental Purification)

Abstract

:
The performances of reactive adsorbents, H3PO4/C (activated carbon) and H3PO4/A (Amberlyst 35), in removing NH3 from a waste-gas stream were investigated using a breakthrough column. Accelerated aging tests investigated the effects of the water content on the performance of the adsorbents. Results of breakthrough tests show that the adsorption capacity greatly decreased with the drying time of H3PO4/C preparation. Synchrotron XRPD indicated increased amorphous phosphorus species formation with drying time. Nitrogen adsorption-desorption isotherms results further suggested that the evaporation of water accommodated in macropores decreases adsorption capacity besides the formation of the amorphous species. Introducing water moisture to the NH3 stream increases the adsorption capacity concomitant with the conversion of some NH4H2PO4 to (NH4)2HPO4. Due to the larger pore of cylindrical type and more hydrophilic for acidic porous polymer support, as opposed to slit-type for the activated carbon, the adsorption capacity of H3PO4/A is about 3.4 times that of H3PO4/C. XRPD results suggested that NH3 reacts with aqueous H3PO4 to form NH4H2PO4, and no significant macropore-water evaporation was observed when acidic porous polymer support was used, as evidenced by N2 isotherms characterizing used H3PO4/A.

1. Introduction

Ammonia is a hazardous gas. Besides its high flammability, ammonia at 50 ppm can irritate the eyes, throat, and nose and the detection threshold for humans is between 5 and 18 ppm [1,2]. Atmospheric NH3 produced by the biogenic decomposition of organic material, biomass burning, and fertilizer production has been the main contributor to ammonia emission [3,4,5]. Ammonia emission from agricultural and nonagricultural usually is less than 100 ppm [1,2]. The others are contributed from the use and the production of synthetic nitrogen fertilizer, waste treatment, and fuel combustion [5,6]. Many techniques have been developed to abate NH3 emission from livestock farming, such as absorption in solution by acid scrubber, biodegradation in a biotrickling filter, and adsorption by porous solids. Among these techniques, NH3 removal efficiency for biotrickling filters is relatively lower at high NH3 concentrations because of the inhibition of nitrifying bacteria [7,8]. Wet acid scrubbing is an effective and inexpensive process, but the utilization of acid scrubber has to suffer scaling inside the scrubber and corrosion of the equipment [9,10].
Adsorption of NH3 on porous solids, such as alumina or alumina-bound-zeolite pellets, seems a promising approach due to its simplicity and economy in configuration and operation [11,12]. Zeolites, silica-alumina, and alumina can be excellent adsorbents for ammonia removal when they are used in treating dry waste gas. However, with the presence of water moisture, the gradual reaction of NH4OH with alumina erodes the solid pellets, resulting in increased pressure drop of the adsorption bed, which increases the difficulty in operation. Moreover, the great quantity of used adsorbent has to be disposed of by using costly landfills. The erosion problem under wet conditions may be eased by using activated carbon-supported mineral acid [13,14,15,16], and mesoporous silica-supported N-halamines [17].
Compared with zeolite, silica-alumina, and alumina pellets, mesoporous silica has higher hydrothermal stability [17]. Granular activated carbon, however, not only exhibits high surface area but has high acid and alkaline resistance, allowing the impregnation of acid or base solutions without damaging supports [10,13]. The instantaneous reaction of the acid solution and N-halamines impregnants with NH3 significantly increases the NH3 removal capacity [17].
Activated carbon impregnated with H2SO4 (H2SO4/C) has been prepared for the removal of NH3 in dry [15] and wet waste gas streams [10,18]. Impregnants, H2SO4, on the sorbent H2SO4/C, react with NH3 in the waste gas stream to form stable (NH4)2SO4 salts. The NH3 removal capacity of H2SO4/C is more than that of the activated-carbon adsorbents. In addition, the used H2SO4/C can be rejuvenated by washing (NH4)2SO4 salts with low-pressure steam and then re-soaking H2SO4 solutions [10]. However, H2SO4 is a highly corrosive strong mineral acid. In re-soaking H2SO4 on the active carbon, the adsorption column is gradually corroded by the stagnant H2SO4 solution. Moreover, H2SO4 is a strong oxidizer and dehydrating agent. Because of its strong oxidizing power, H2SO4 acid may react violently with organic compounds formed from biodegradation of livestock waste, resulting in gas evolution and potential pressure buildup in the adsorption column.
The structure of phosphoric acid, H3PO4, is similar to that of H2SO4, whereas H3PO4 tends to be much less acidic and corrosive and has less oxidizing power. The potential hazardous of H3PO4 is much less weak than that of H2SO4. Hence, activated carbon impregnated with H3PO4 (H3PO4/C) samples were prepared in this study to remedy the drawbacks of H2SO4/C. Like H2SO4/C, the spent H3PO4/C can also be regenerated by flowing low-pressure steam through the adsorbent bed and the regeneration byproduct (NH4)xH3-xPO4 [19] can be used as agricultural fertilizer.
Although activated carbon exhibits excellent adsorption properties due to its high surface area, the pores of impregnated activated carbon (IAC) may easily be blocked by salts formed from the reaction of a noxious-gas adsorbate with the impregnated H3PO4 due to quick evaporation of water [10]. This study also used functionalized porous polymer (FPP) for H3PO4 impregnation besides activated carbon to decrease the water evaporation rate. The motivation for using FPP is that the pore structure and surface functional group of FPP can be tuned by using monomers of various sizes, shapes and by linking functional moieties to them [20,21,22]. Ambelyst 35 was chosen in this study because the average pore of this material is about 300 Å, and the resin abounds with sulfonic acid sites, which minimize the pore plugging in the NH3 removal process and facilitate the adsorption of NH3 on the surface due to its high water-retaining capacity.

2. Experimental

2.1. Sample Preparation

The carbon-supported reactive adsorbent, H3PO4/C (noted as PC), was prepared by impregnating activated carbon (GAC 830) with a 7 M H3PO4 solution. The same procedure was used to prepare H3PO4/A adsorbent with Amberlyst 35 support (noted as PA). The activated carbon (GAC 830 of particle size, 2 to 5 mm; surface area, 1050 m2/g; pore volume, 0.85 mL/g; iodine No., 75 mg/g minimum and apparent density, 0.54 g/mL) was purchased from Norit Americas Inc., Atlanta, GA, USA. The acidic porous polymer (Amberlyst 35 of particle size, 0.30 to 0.85 mm; surface area, 50 m2/g; pore volume, 0.35 mL/g; and apparent density, 0.56 g/mL) support was purchased from Rohm and Haas company. In preparing the reactive adsorbents, the activated carbon or the acidic porous polymer were dried at 120 °C by passing through air to remove physically adsorbed water. The dried supports of 120 g were brought into contact with 180 g phosphoric acid solution. Upon soaking for 30 min, the reactor for the preparation was purged with N2 for 60 min. The resulting material was noted as H3PO4/C and H3PO4/A, respectively, for GAC830 and Amberlyst 35 supports. H3PO4/C and H3PO4/A samples were then exposed to dry air for 24 h. These samples were noted as PC0 and PA0. In order to study the water effects, PC0 was dried in an air environment at 120 °C for 4, 8, and 24 h. (the samples are noted as PC4, PC8, and PC24), while PA0 was dried for 14 h (PA14) for comparison.

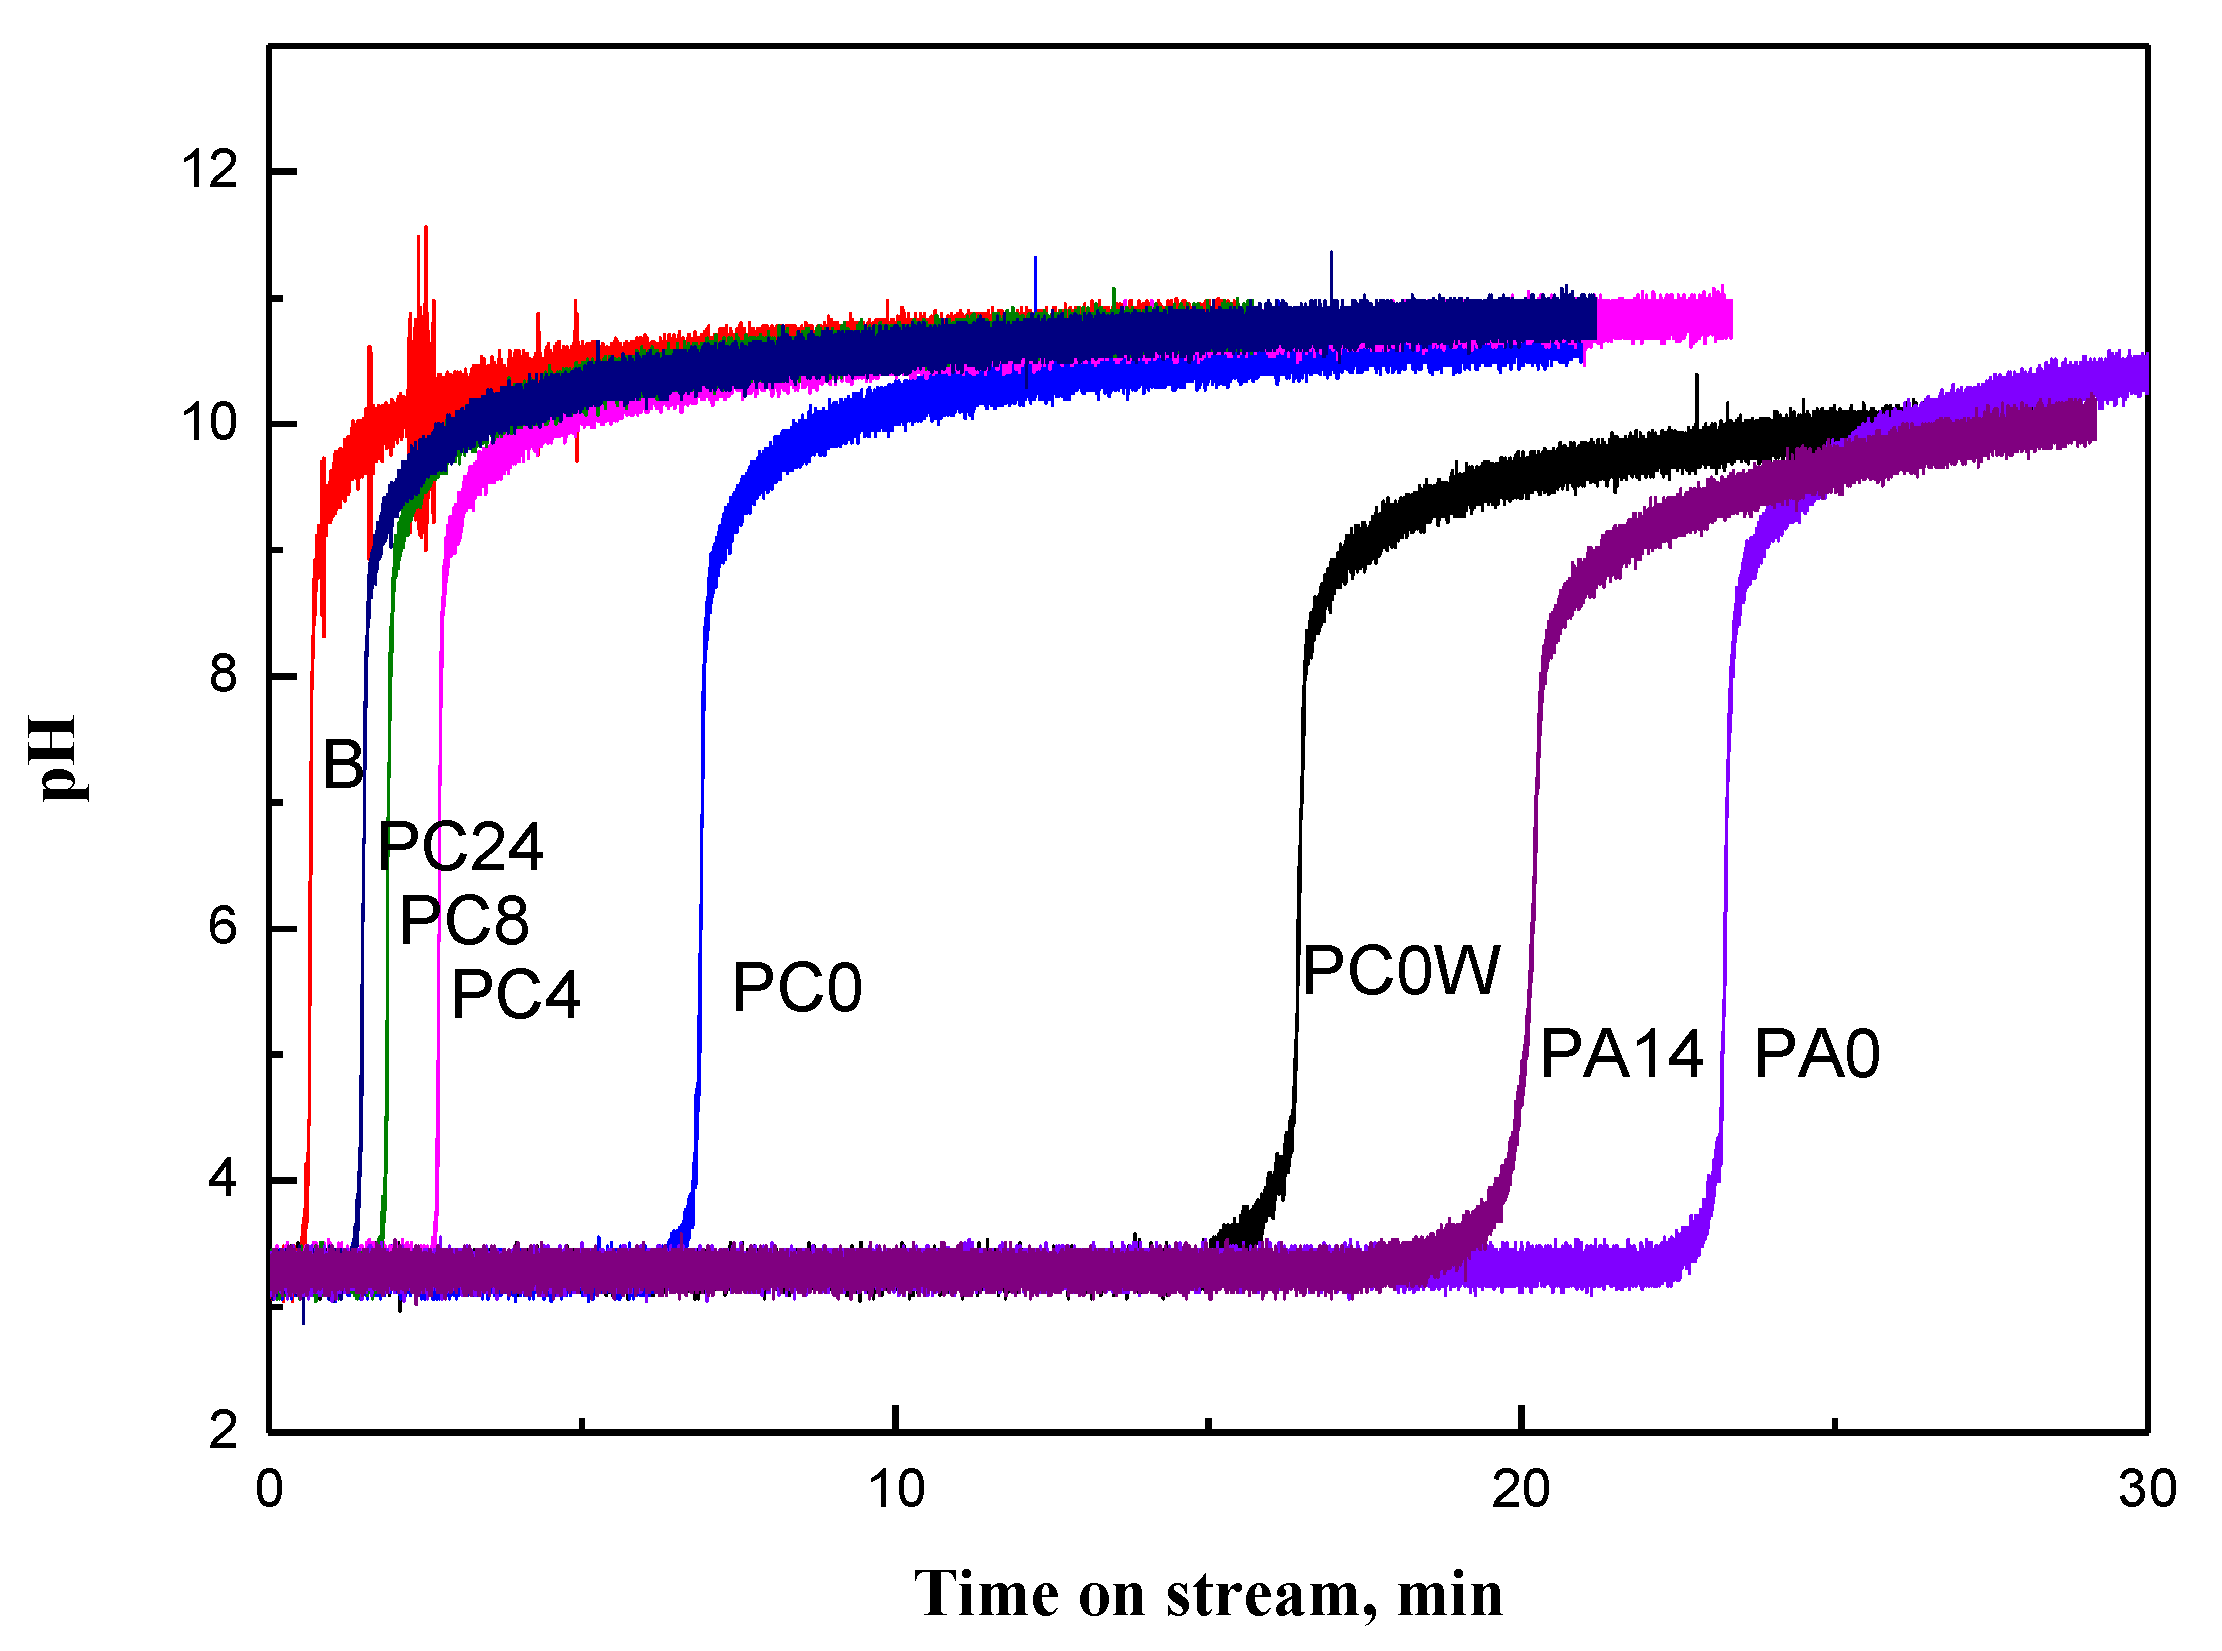
2.2. Breakthrough Curve Tests

The adsorption capacity under dynamic conditions for ammonia removal was carried out in a stainless-steel fixed bed adsorption-regeneration column of 2.2 inside diameter and 45 cm length. The column was packed with 10.0 g of H3PO4/C or H3PO4/A with inert ceramic (sphere of about 2.0–5.0 mm diameter) in a ratio of 1:10 by volume. The diluent was used to minimize channeling effects. Typically, the performance tests used an ammonia concentration of 8.4 mole % NH3 in the air stream (0.76 L/min). The effluent gas was passed through an HCl solution scrubber to remove the unremoved NH3. Mass flow controllers were used for controlling the NH3 and total flow rate. The NH3 absorbed in the scrubber was monitored by a pH meter, and a breakthrough curve was plotted by plotting the pH value with time. The total amount of NH3 removal was calculated from the breakthrough curve. For studying the performance of PC0 for moisture-containing waste gas, noted as PC0 (wet), the airstream was humidified by passing through a water reservoir before mixing with NH3.

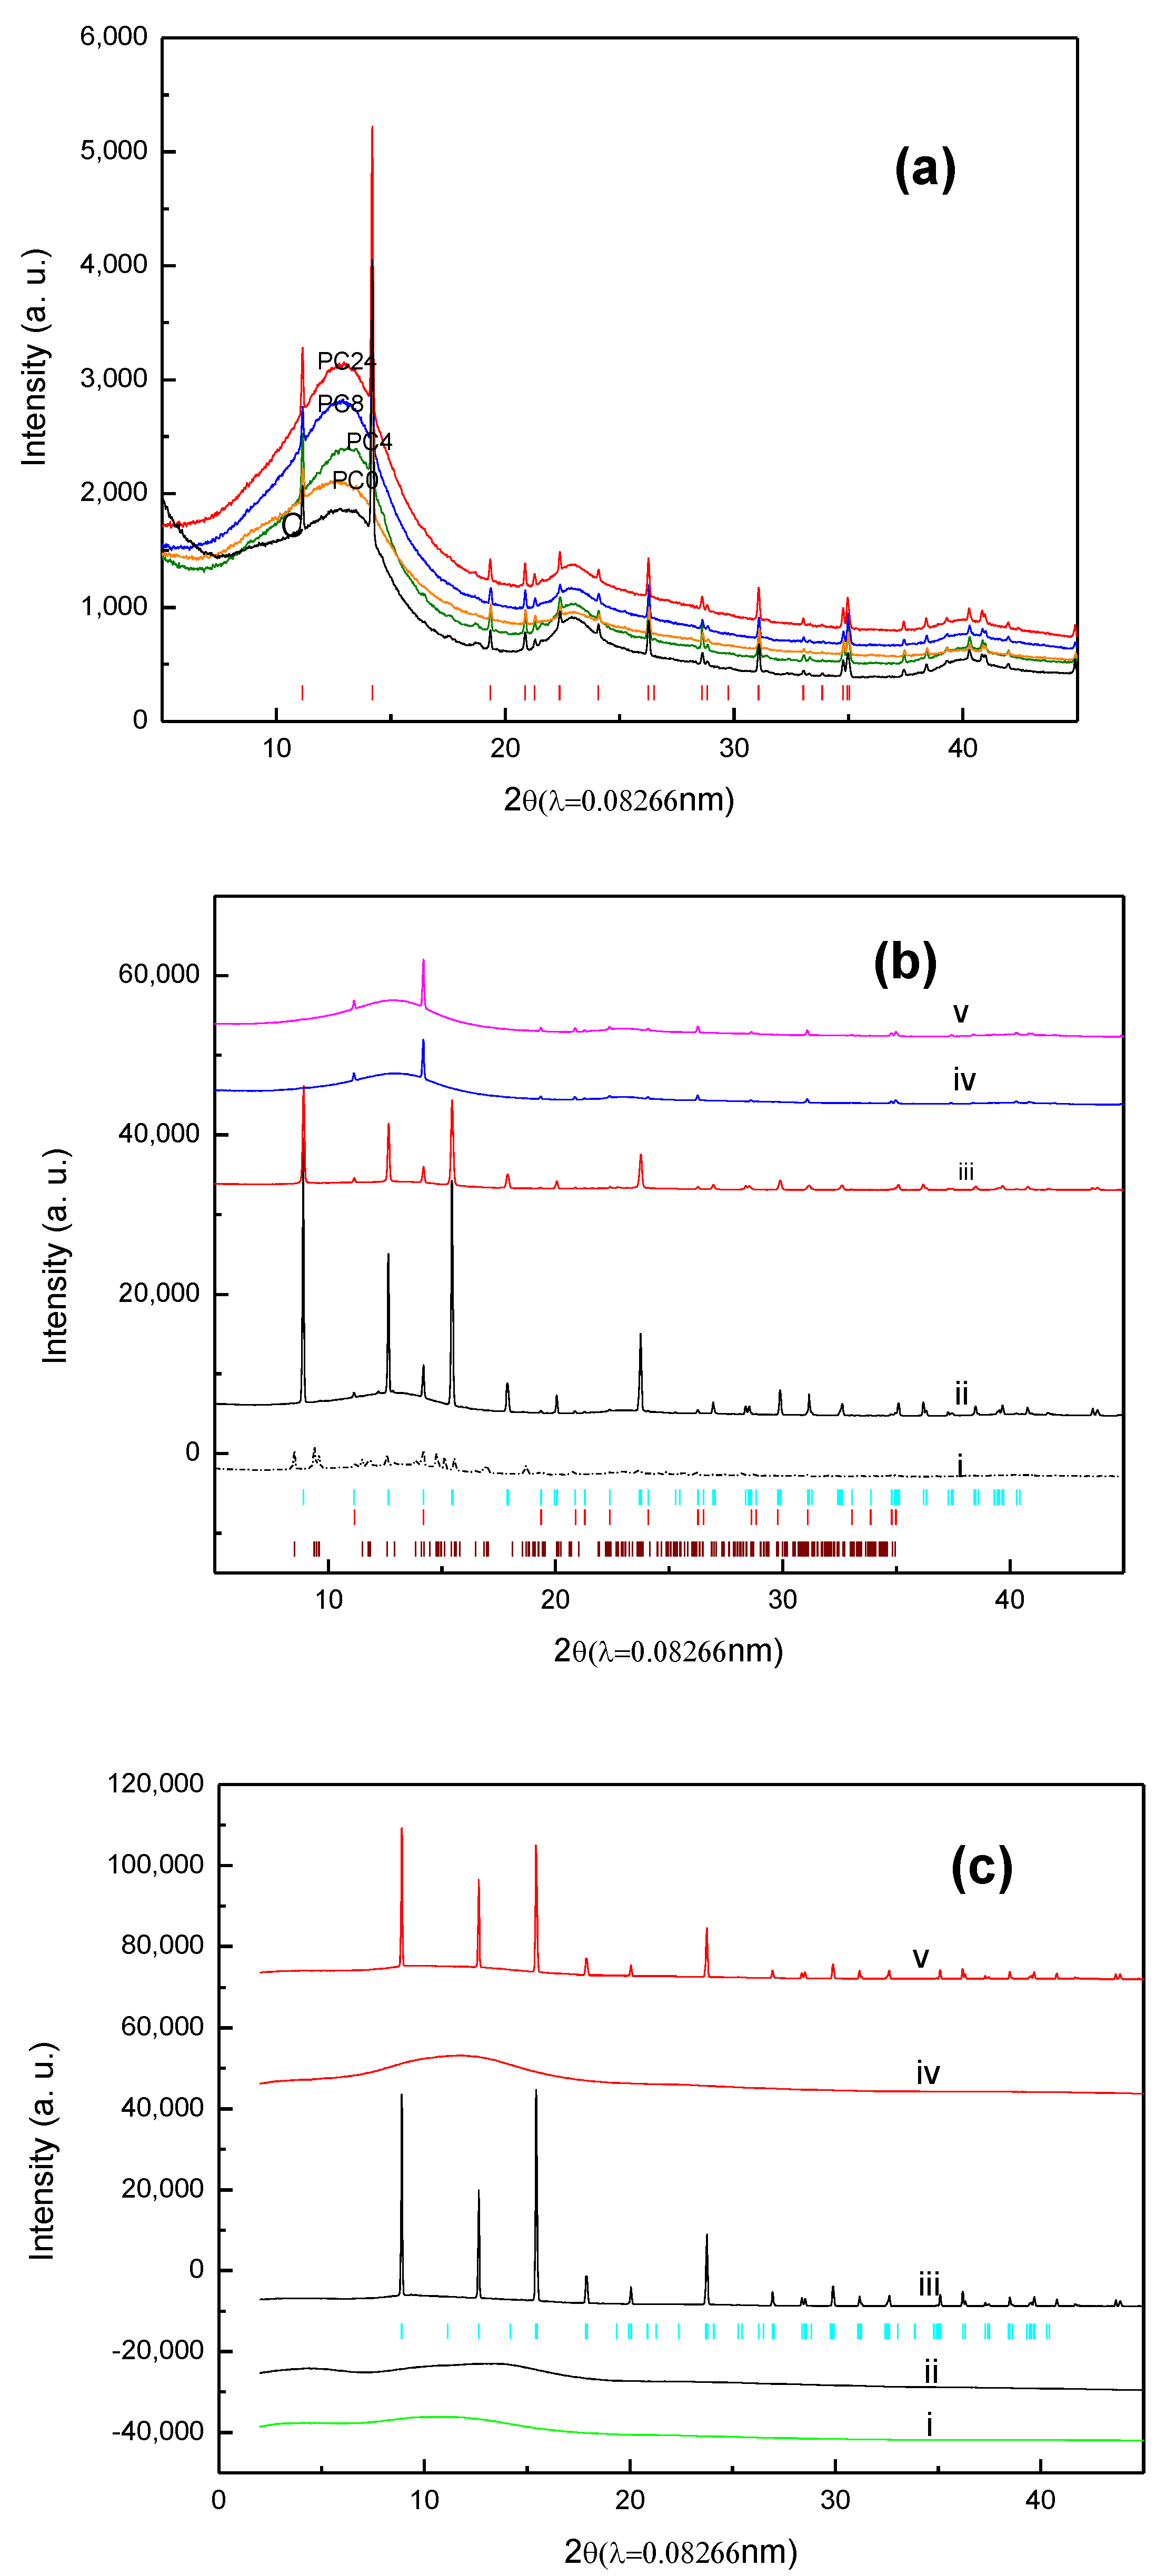
2.3. Synchrotron XRPD

X-ray powder diffraction (XRPD) was performed at the BL01C2 beamline of the National Synchrotron Radiation Research Center (NSRRC) (Hsinchu, Taiwan). The X-ray source of BL01C2 is a 5.0 T superconducting wavelength shift magnet which provided 8 to 33 keV X-rays. Wavelength λ = 0.08266 nm (15.0 keV) was chosen for the XRPD measurements. After a pre-focus mirror, a Si (111) double monochromator was used to select monochromator beams. Diffraction angle was calibrated with silver behenate and Si powders (NBS640b) standards according to their Bragg positions.
The samples were sealed in a glass capillary. The sample was fast spinning during the data collection to increase random orientations. Two-dimensional powder diffraction patterns were recorded by a Mar345 imaging plate and converted to a one-dimensional profile using the Fit2D V12.012 program (European Synchrotron Radiation Facility, Grenoble, France) [23]. Crystal structure parameters were refined with the Rietveld method [24] using the graphical interface package EXPGUI for GSAS program (Los Alamos, NM, USA) [25]. The calculated diffraction profiles were refined based on Pseudo–Voigt (Gaussian plus Lorentzian) profile function, and the broad background was fitted with a 22-parameter shifted-Chebyschev polynomial function. Since the occupancy and thermal parameters are highly correlated, the parameters of these two factors were refined alternatively with positional parameters.

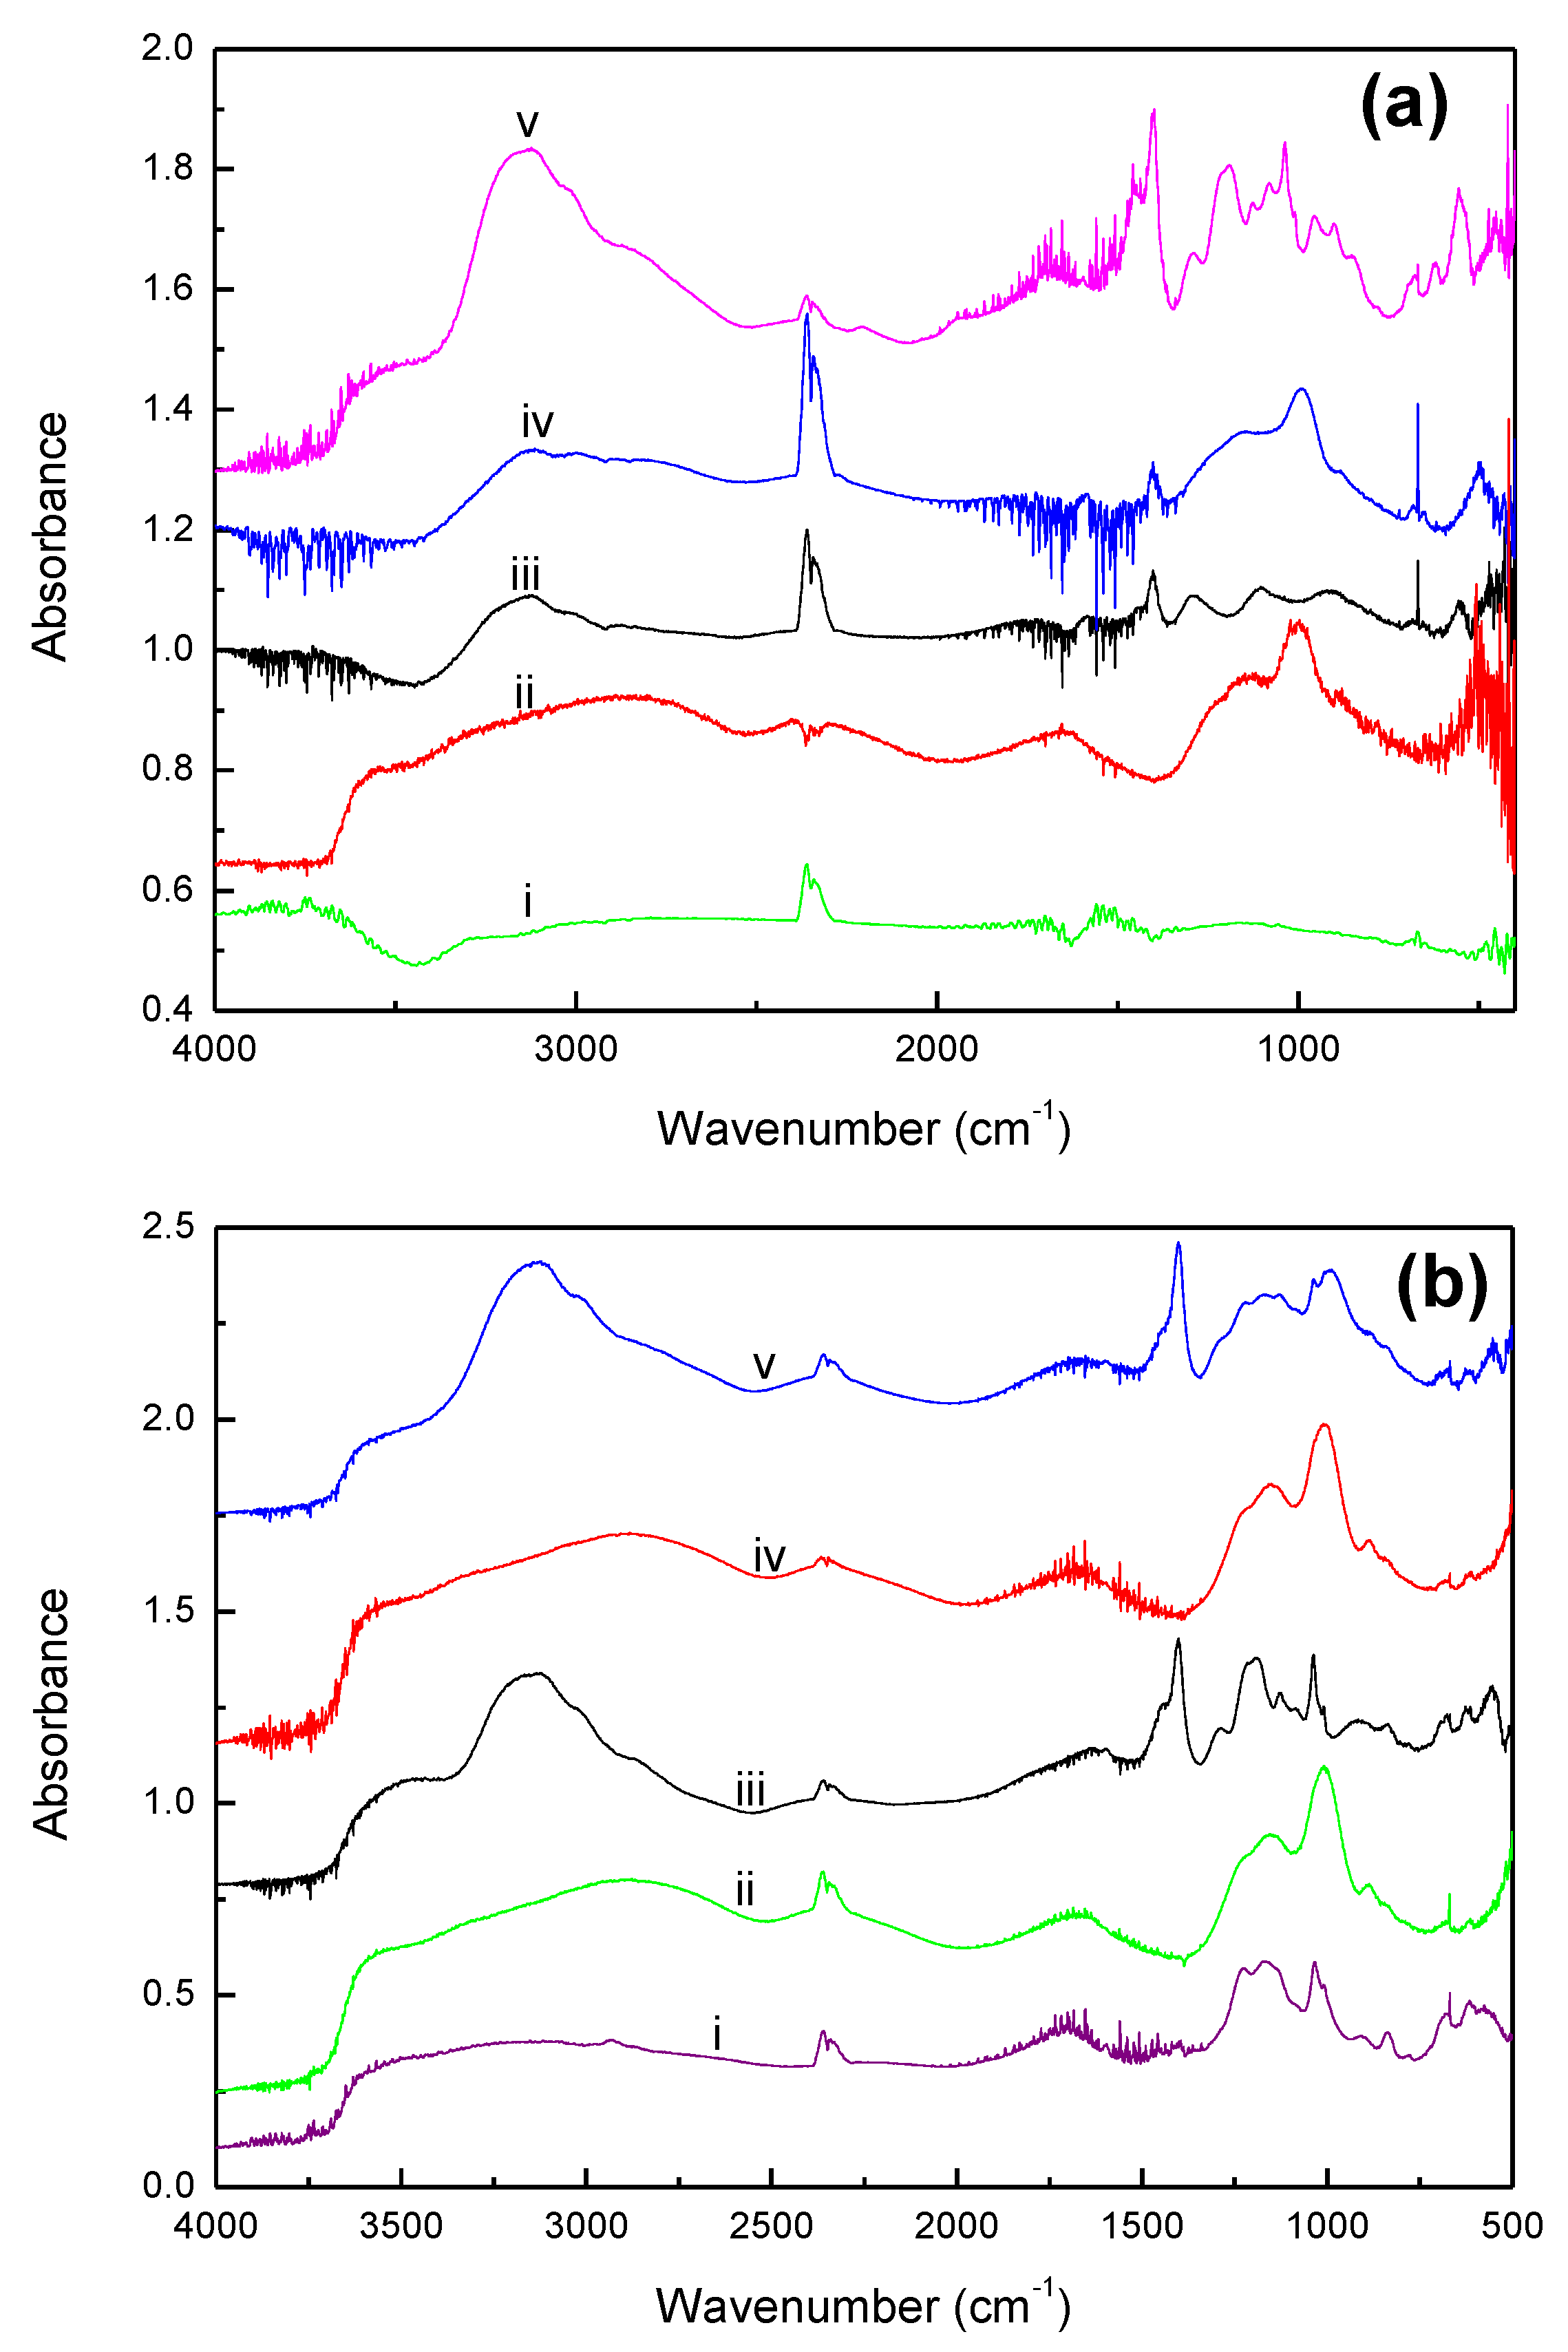
2.4. FT-IR Spectroscopy
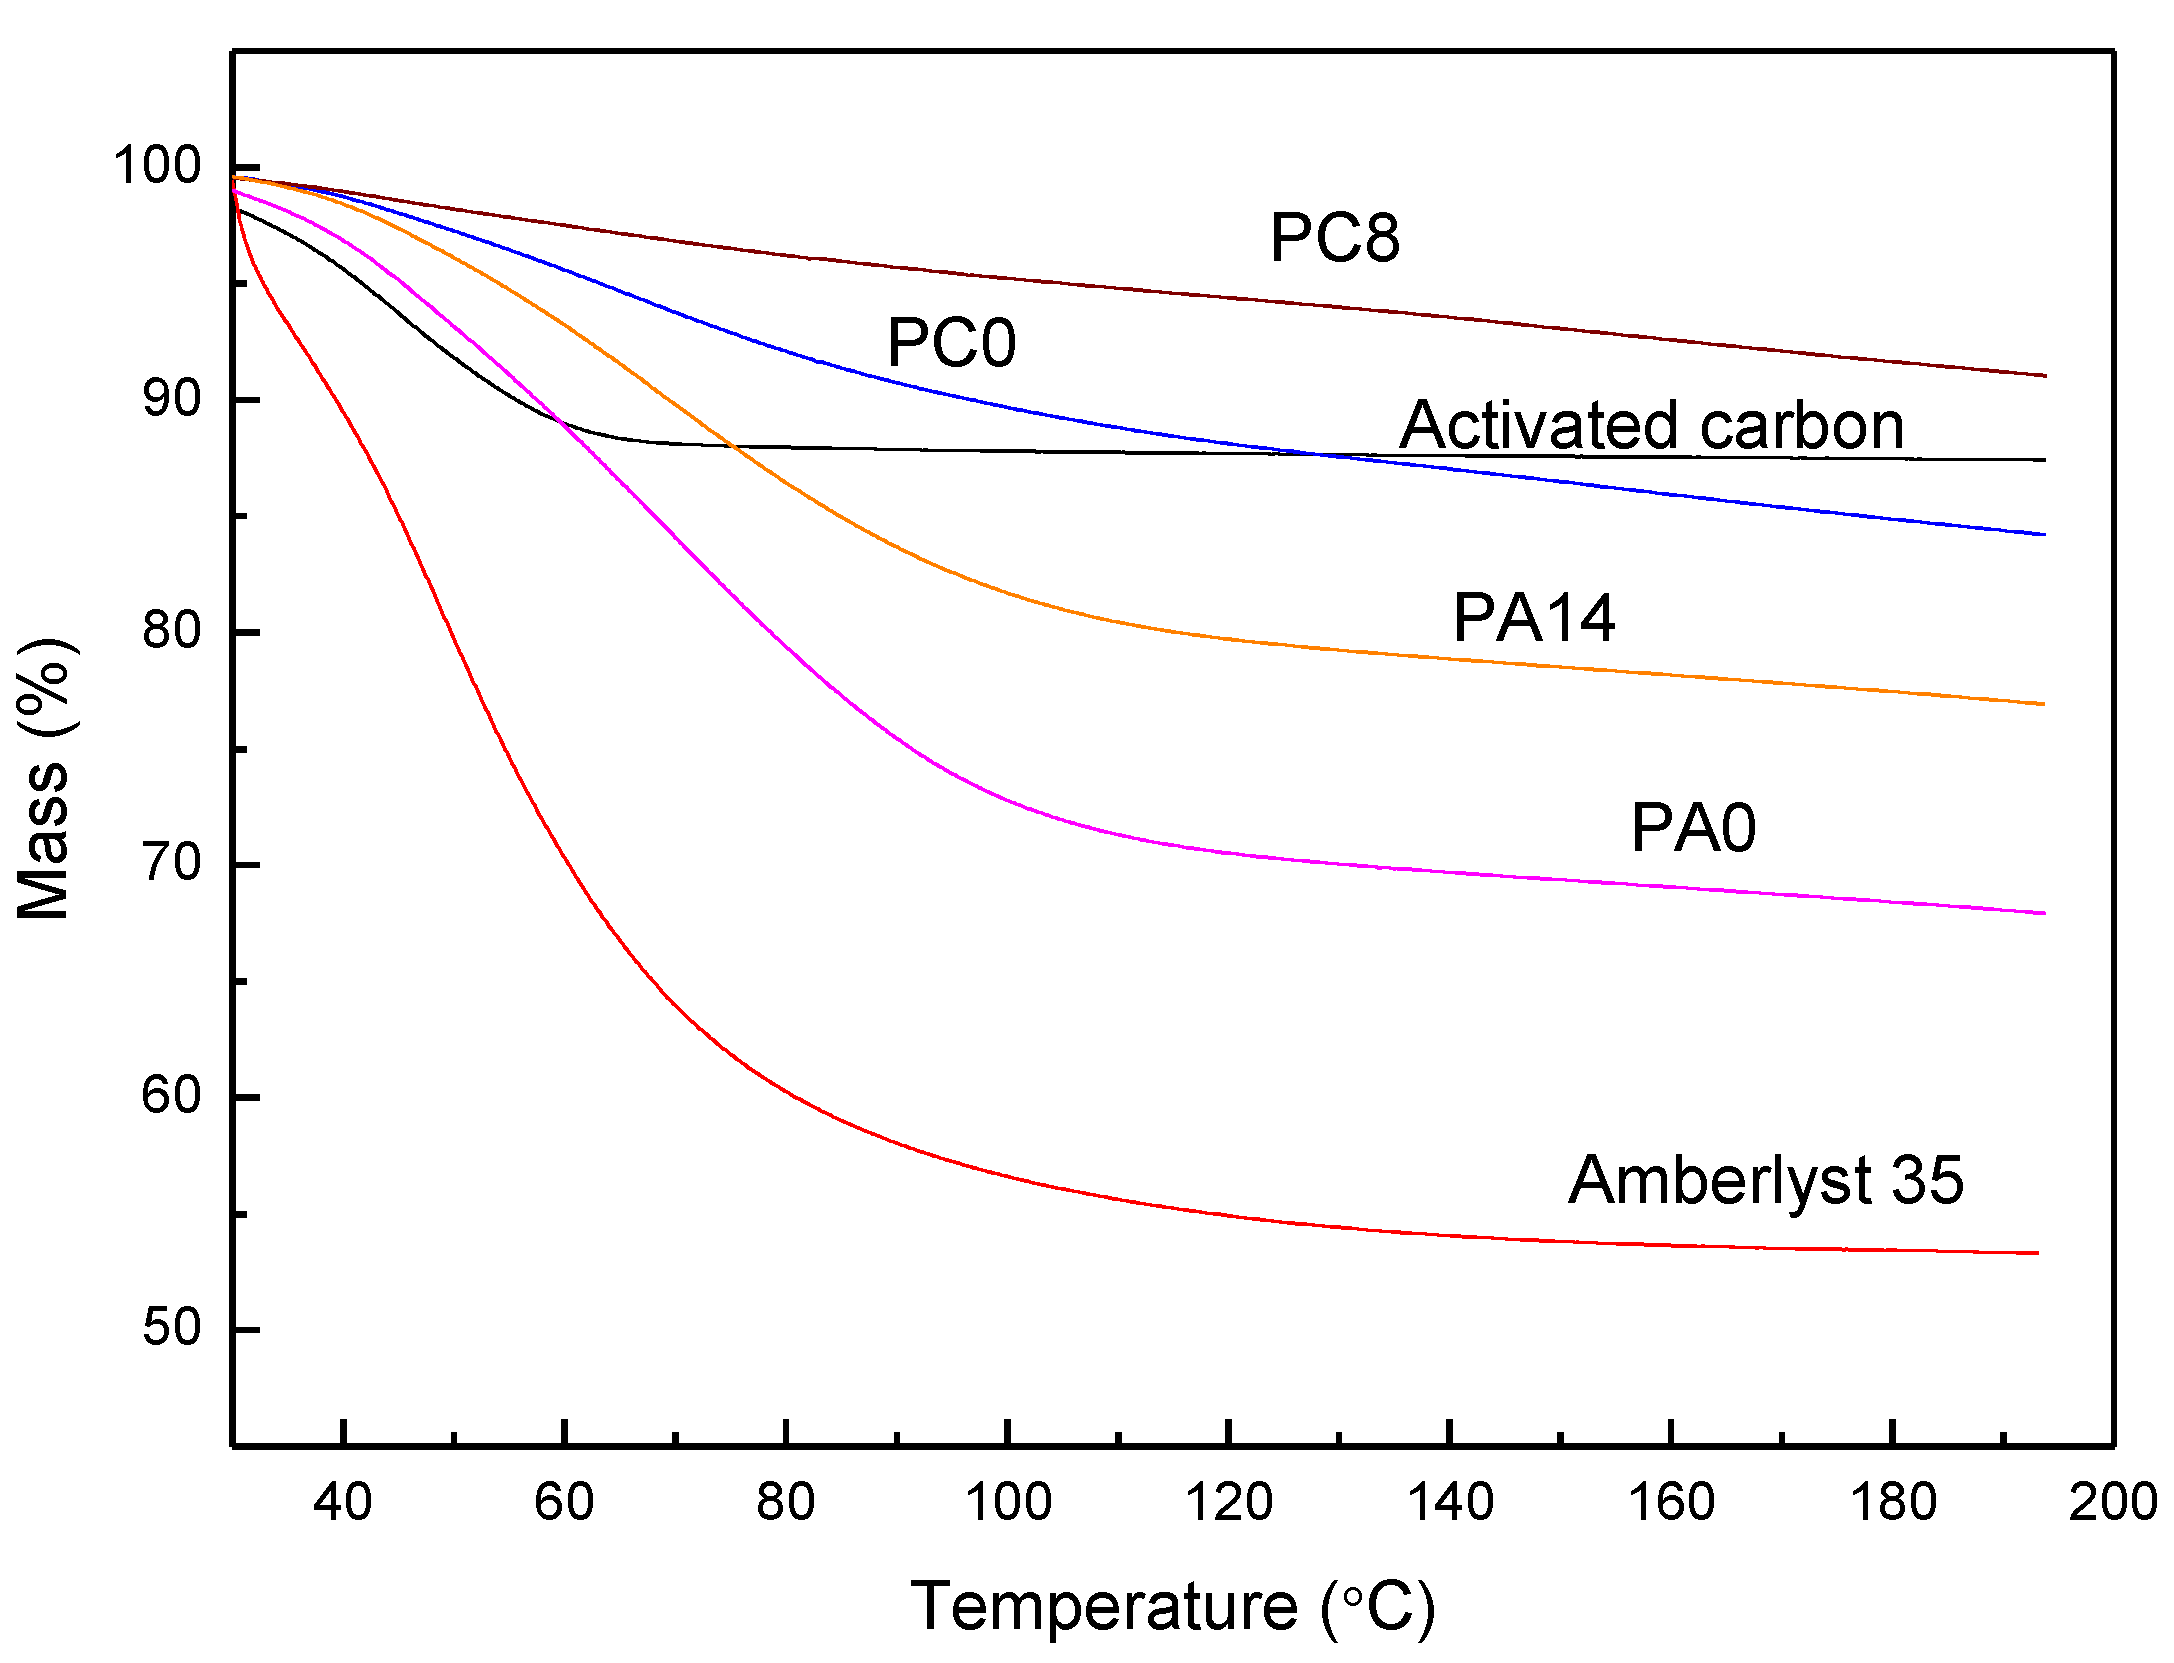
Diffuse reflectance infrared Fourier transform spectra (DRIFT) of PC0 and PA0 samples were recorded with Shimadzu FT-IR, Prestige-21, with a deuterated triglycine sulfate (DTGS) detector. The spectra have a resolution of 2 cm−1. Before measurement, the samples were pulverized to powder. After taking the background KBr IR spectra, the powder samples were diluted with KBr and loaded into an in situ IR cell. NH3 in dry or wet air then was introduced into the IR cell and maintained for about 20 min for equilibrium. The cell was then purged with dry air for a few mins to remove free NH3, and IR spectra were recorded.

2.5. TGA Analysis

Thermogravimetric profile characterizing H2O containing in PC and PA were performed with a Q50 TGA (TA Instruments). The temperature control system includes a circular environment chamber, a sample pan furnace, and a purge gas supply system. In the testing, samples were heated up in the environmental chamber, which provides a stable temperature environment. Purging gas was provided from horizontal (60 mL/min air) and vertical (40 mL/min N2) directions. About 15 mg of gently ground samples were spread out in 100 μL Pt pans. The percent of weight loss as a function of temperature was determined at a heating rate of 5 °C/min.

3. Results and Discussion

3.1. Performance of H3PO4/C and H3PO4/A Characterized by Accelerated Aging Tests

To quickly evaluate the performance of H3PO4/C and H3PO4/A and obtain used sorbents for structure characterization, an accelerated aging test method has been developed and justified to save the test time [10,13].
A blank test was conducted with an empty adsorption reactor packed with an inert ceramic diluent before the performance tests. As shown in Figure 1, the experimental results indicated that the experimental apparatus and diluent did not adsorb NH3 gas significantly, suggesting that the accelerating test would not be influenced by the adsorption and/or deposition of NH3 on the reactor and the diluent.
Our previous paper reported that the NH3 removal capacity for impregnated activated carbon (IAC), H2SO4/C, is about seven times that for HY zeolite (0.01 g NH3/g HY) [10]. Unlike adsorption of NH3 on activated carbon and zeolite, H2SO4/C removes NH3 in the waste gas by acid/base neutralization [10,15]. For H3PO4/C, NH3 in the waste gas can be removed by both neutralization and chemisorption.
The NH3 removal process consists of three steps in series: 1, NH3 transport from the gas stream to the surface of H3PO4/C (PC) and was adsorbed on the external surface; 2, the adsorbed NH3 associated with water and diffuse or directly diffuse inside PC pores without water association; and 3, the reaction of NH4OH(aq) or NH3 with H3PO4(aq) to form mono-ammonium phosphate (MAP), di-ammonium hydrogen phosphate (DAP), and tri-ammonium phosphate (TAP), or the adsorption of NH3 inside pores of the sorbents.
The breakthrough curves characterizing the effects of drying time on PC’s performance for NH3 removal are shown in Figure 1. The time at which a significant concentration of NH3 breaks through the bed (breakpoint) is decreased with the drying time. Moreover, in contrast to the breakthrough profile of air-dried PC, a relatively gradual slope on the breakthrough curve has been observed for the PC sample without air drying (PC0). These results suggested that mass transfer resistance for air-dried samples, PC4, PC8, and PC24, is less than the resistance for PC0. The dissolution of NH3 in water could cause an increase in mass transfer resistance for PC0, whereas it increases NH3 removal capacity due to the reaction of NH4OH with H3PO4.
For zeolite or active carbon adsorbents, moisture competes strongly with adsorbates, significantly reducing adsorption capacity [12]. However, comparing breakthrough profiles for PC with and without drying (Figure 1) suggests moisture is a necessary component in the process because, concomitant with the neutralization reaction, water in PC pores was removed by dry air. When water moisture is present in a waste gas stream, ammonia is dissolved in water before adsorption or reaction. Water is known to have a great affinity for adsorption in very small pores [26]; consequently, relatively more water is adsorbed on microporous pores of carbon than on mesoporous pores [26]. It has been reported that relatively more ammonia is adsorbed via dissolution in water present on the surface of the microporous carbon [27,28]. For waste gas containing sufficient moisture, such as effluent gas from the biological degradation of animal urine, the water content in PC is in equilibrium with gas humidity. Comparing the breakthrough profiles between PC0 and PC0(wet) demonstrates the advantage of water in the gas stream; the NH3 removal capacity for PC0(wet) is about 2.3 times that for PC0 (Figure 1).
H3PO4/A (PA) is more suitable for treating non-biological degradation ammonia emissions with low moisture, such as incineration of solid waste and the nitrogen fertilizer industry. As shown in Figure 1, the NH3 treatment capacity for PA0 is about three times that of PC0. Moreover, it could be that water in the acidic porous polymer is less easy to remove in the treatment process, as opposed to the activated carbon; the adsorption capacity decreased about 15% for PA14 from PA0, in contrast to about 70% from PC0 for PC8.

3.2. Structure of H3PO4/C and H3PO4/A Characterized by X-ray Diffraction (XRPD)

XRPD patterns characterizing the species on the fresh PC, used PC, combined fresh and used PA were shown in Figure 2a–c, respectively. The crystalline substances of the samples having long-range order lead to the appearance of Bragg peaks in X-ray diffraction. These substances can be identified by matching the XRPD pattern with reference patterns of pure substances. For amorphous solids and liquids, their structures lack periodicity. So, the diffraction from them does not show sharp Bragg peaks. Instead, X-rays will be scattered in many directions of these substances from tightly packed atoms leading to one or two broad maxima of the XRPD pattern [29].
Both broad backgrounds produced by carbon and sharp Bragg peaks by crystalline phase of SiO2 were present for activated carbon (GAC830), the raw material of PCs (Figure 2a). Comparing PCs with GAC850, the Bragg peaks of SiO2 remained intact, whereas the background intensity increased with drying time and the peak shift from 13.2 to 12.7 degree of 2θ. Since the H3PO4 solution for impregnation was prepared by dissolving P2O5 in water, the additional noncrystalline intensity contributions [24,29] could be due to the formation of amorphous P2O5 and/or H3PO4 in drying.
After the aging test, XRD peaks characterizing DAP [(NH4)2HPO4] were observed for the moisture-containing waste gas, in contrast to MAP [NH4 H2PO4] for dry NH3 waste gas (Figure 2b). The intensity of the MAP peaks is decreased with the drying time; after 8 h of drying, almost no significant MAP characteristic peaks were observed. These results suggest: (1) NH3 in the dry gas stream can be removed by PC with sufficient water containing via both adsorption and neutralization reaction, (2) NH3 is removed by adsorption for PC without sufficient water; and (3) when NH3 in the wet gas stream, MAP is converted to DAP during the tests.
The Rietveld refinement results confirm the formation of MAP for PC0, PC4, AC0, and AC8 in the dry gas stream and DAP on PC0 in the wet gas stream. Besides confirming the phase assignment of XRPD patterns, crystallinity, unit cell parameters, and the presence of preferred orientation can be further quantified using Rietveld refinement [24]. The final Rietveld refine results are shown in Figure 3, and the refined crystal parameters were summarized in Table 1.
No preferred orientation was detected in the XRPD patterns, suggesting the formation of a spherical crystal. The crystalline grain sizes were obtained from the commonly used Scherrer’s equation, t = /Bcosθ, with the crystal grain size t, shape correction constant k = 0.95 for spherical particle, and B = FWHM of the related Bragg peaks [26]. The estimated crystal size is also shown in Table 1.
The relative MAP or DAP crystal formed on PCx, ACx, to that formed on PC0 calculated from Bragg peaks and NH3 removal capacity are shown in Table 2.

3.3. Mechanism of NH3 Removal Using PC and PA

The IR spectra characterizing GAC830, fresh PC0, PC0 after in situ dry (PC0id) and wet NH3 air testing (PC0iw), and PC8 after dry testing (PC8id) are shown in Figure 4a.
The characteristics of O-H stretching (νOH) and bending vibration (δOH) bands at 3600 and 1665 cm−1 were observed for fresh PC0 and PC0iw. Compared with liquid water (νOH = 3400, δOH = 1640 cm−1) [30], the blue shift of O-H bands to higher frequency suggests that the water molecules are chemisorbed on the sorbents, dissociated to proton and hydroxyl group, and then bonded to the acid sites of the sorbents [30]: the phosphate of H3PO4. The characteristic peaks of PO4 for PC0 and PC8id showed at about 1200 (νasPO), 850 (νsPO), and 1010 (νPO-H) cm−1, while the OH group bonded to PO4 showed at 3150 cm−1 [31,32]. For AC8id, the disappearance of 3600 and 1665 cm−1 peaks suggests water evaporation during the tests. The appearance of the NH4+ deformation band at 1400 cm−1 [30,33] concomitant to water desorption could be due to the onset of MAP formation; MAP could be formed by NH3 adsorption followed by surface reaction.
It could be because of more water on PC0id than on PC8id, crystal MAP formed on PC0. MAP formation is evidenced by the absorption band appearing at 1290 cm−1, which is a combination of the asymmetric Stretching vibration of PO4 with lattice [33]. The NH4 of MAP is characterized by the peak appearing at 1400 cm−1NH) and the peaks at 3140, 3000, and 2850 cm−1NH). The peaks at 1100 and 900 cm−1 are attributed to P-O vibrations and P-O-H (νPO-H) of PO4 [33].
When wet air was introduced, the appearance of bands at 3600 and 1670 cm−1 indicate the association of water with PC0 [30]. Moreover, the appearance of peaks at 1450 (δNH), 1190 (νPO-H), and 1060 cm−1PO-H) suggest the presence of NH4+, H2PO4, and HPO42− [30,34,35].
Based on XRPD and FT-IR results, the chemistry involved in the NH3 removal process is formulated as the following equations:
P2O5(s) + 3H2O(l) ⇌ 2H3PO4(aq)
H3PO4(aq) ⇌ H3PO4⋯H2O(s,gel) + P2O5(s) + H2O(g)
H3PO4⋯H2O(s,gel) + NH3(g) → (NH4)H2PO4(s,gel) + H2O(g)
(NH4)H2PO4(s,gel) + NH4OH(aq) → (NH4)2HPO4(s) + 2H2O(g)
The subscript s, l, g, gel, and aq are noted in the equations above as solid, liquid, gas, gelation, and aqueous phase.
In the first step of PC preparation (Equation (1)), the viscosity of 7M (37 %) H3PO4(aq) for impregnation preparation of H3PO4/C is 7.8 cp (10−3 Kg/m.s). During the drying step (Equation (2)), H3PO4(aq) viscosity increases concomitantly with the evaporation of water molecules on the adsorbents, leading to gel-like substances. For PC0, H3PO4(aq) concentration in the sorbents is about 85%. At room temperature, the measured viscosity of 85% H3PO4(aq) is about 97 cp. After drying by flowing air at 120 °C for more than 4 h, some of the H3PO4 were even converted to amorphous P2O5.
During dry air testing, NH3(g) is transported from the waste gas stream to the external surface of the PC and reacted with H3PO4⋯H2O to form (NH4)H2PO4(s) (Equation (3)). When sufficient water molecules were present on PC, such as PC0, (NH4)H2PO4(s) were crystallized to form crystals. These crystals of size about 30 nm (Table 2) could block mesopores of PC for the further reaction of H3PO4⋯H2O with NH3. On the other hand, when insufficient water molecules on PC, such as PC08, amorphous P2O5 formed in the drying step block the diffusion of NH3 inside PC pores. Hence, only an external pellet surface can adsorb NH3 for reaction.
In wet air testing, the reaction mainly occurs in the aqueous phase. The water vapor scrubbed from a water reservoir is condensed on the reactive adsorption bed. The aqueous NH4OH then react with MAP to form DAP (Equation (4)).
Using active carbon, zeolite as adsorbents for NH3 removal, moisture competes with NH3 for adsorption, leading to a reduction of adsorption. However, when H3PO4 impregnated adsorbents (PIA) are used, moisture is necessary to increase NH3 removal capacity. In removing ammonia from waste gas with low moisture by PIA, water evaporation from the support surface is inevitable. To keep the NH3 removal efficacy, the IPA needs support having high moisture-retaining capability. Amberlyst 35 was used as the support because it has 52 to 57% retention capacity due to its surface sulfuric acid functional groups. As shown in Figure 5, characterized by TGA, the water contained in PC0, PC8, PA0, PA14 is 16.0, 9.0, 32.1, and 23.4%, respectively (Table 2). For PC8, the water content is lower than the stoichiometric calculation of % water in H3PO4/C (about 10% water). The results indicate that some H3PO4 were dehydrated to P2O5, consistent with the inference from XRPD patterns.
The characteristics of the water species on PA0 and PA14 are similar to PC0; peaks at 3600 and 1665 cm−1 suggest water associated with H3PO4 (H3PO4⋯H2O). As expected, due to higher water retention capacity, MAP is formed by neutralization in the aqueous phase. Besides crystal MAP, the presence of aqueous MAP is evidenced by the presence IR absorption band for NH4+ at 1445 and 1033 cm−1, and H2PO4 at 1190 cm−1. Moreover, the presence of IR peaks at 3600 and 1650 cm−1 for PA0 and PA14 (Figure 4b) suggests water was unlikely to be desorbed in the NH3 capture process by using Amberlyst 35 support.
As shown in Figure 6, the N2 isotherm for activated carbon (GAC830) is concave to x (P/P0) axis in the range of P/P0 = 0.0 to 0.40 and the isotherm is then convex to the x-axis. The sample is assigned as IV(a) type isotherm. For acidic porous polymer (Amberlyst 35), the N2 isotherm only has a slight convex to the x-axis in the range of P/P0 = 0.0 to 0.20. The sample is assigned as mixed IV(a) and V type [36,37].
The shape of the hysteresis loop is related to the shape of the pores. With the loop of upward curvature at a relative pressure (P/P0) between 0.8 and 0.98 (H1 hysteresis loop), the pore of the acidic porous polymer is of cylindrical type. In contrast, with a slow jump in the H4 hysteresis loop at 0.45–0.95 P/P0 region, the activated carbon is a mesoporous material with slit-type porosity [37].
Compared with acidic porous polymer, the activated carbon comprises a much smaller pore diameter and larger surface area. If the NH3 removal process is dominated by adsorption, activated carbon is expected to have a higher NH3 removal capacity. However, the reverse was observed for the experimental data, confirming the neutralization dominates the process.
After impregnating H3PO4 and breakthrough testing, the hysteresis loop changed to H2 type (PC0) (Figure 7). Moreover, the comparison of the pore size distribution for the used PC0 with that for carbon support indicates that phosphorus species were not fully accommodated in the mesopores (>100 Å). Because of the weak affinity of water to the carbon support, water in mesopores is easy to evaporate and diffuse out. Due to higher diffusion resistance and the adsorption on the pore wall, water in the micropores is harder to diffuse out [26]. In contrast, by using acidic porous polymer, because water molecules are strongly bonded by the sulfonic acid group, which promotes the reaction of NH3 with H3PO4, almost all the mesopores of acidic porous polymer were accommodated by the phosphorus species.
In our previous works, H2SO4/C was prepared by impregnating the activated carbon with a 7.9 M sulfuric acid solution. The NH3 removal capacity of H2SO4/C sorbent for wet gas treatment is about 70 g NH3/Kg [10], which is slightly higher than that of H3PO4/C (PC0) for wet gas treatment but lower than H3PO4/A (PA0) for dry gas (Table 2). The comparison demonstrates the merits of using a functionalized porous polymer to prepare sorbents to capture acid or base in the waste gas stream.
The used H2SO4/C sorbent can be reused by washing away the (NH4)2SO4 formed on the activated carbon in the NH3 capture process, followed by drying and resoaking sulfuric solution. In the washing step, low-pressure steam or hot water can be used to dissolve (NH4)2SO4 crystals [10]. Since the solubility of MDP in water is close to that of (NH4)2SO4 [38,39], similar procedures can be used to rejuvenate used H3PO4/C and H3PO4/A. For H2SO4/C, the performance of the rejuvenated one is close to the fresh sorbents [10]. Since H3PO4 tend to be less corrosive than H2SO4, using H3PO4, the damage of the support structure in the NH3 capture process will be less severe. Therefore, the stability maintenance for H3PO4/C is expected to be better than that of H2SO4/C.

4. Conclusions

Capturing NH3 in dry air waste gas and water containing the sorbents shows a significant role in process efficacy. Water facilitates ammonium ions formation. The ions are either bonded to carbon or acidic polymer or react with dihydrogen phosphate ions to form MDP. Due to water evaporation in the process, experimental results indicated that no MAP crystal was observed for water containing H3PO4/C is less than 9% (PC8). MAP crystal was formed for water containing H3PO4/C to reach 16% (PC0), whereas the stoichiometric calculation indicated that essentially not all of the H3PO4 on the activated carbon were reacted with NH3. The results combined with the pore size distribution suggested that at a high concentration of H3PO4, the quick evaporation of the water deposited on the mesopores (>100 Å) hinders ammonium ions’ formation. When the process occurs in wet gas, moisture condensation may partially compensate for water evaporation. Hence, the NH3 removal capacity of PC0 for wet gas treatment is more than two times that for dry gas. The experimental results thus suggest H3PO4/C is more suitable for moisture-containing waste gas. However, the drawbacks of H3PO4/C for capturing NH3 in a dry gas stream can be remedied by using acidic porous polymer supports. Compared with H3PO4/C, water is more likely to be retained on H3PO4/A due to the presence of sulfonic functional groups and cylindrical type pore structure. Experimental results indicated that the adsorption capacity for PA0 used in dry gas is more than three times that of PC0.

Author Contributions

C.-C.H. created and organized this research project. J.-S.T. prepared sorbents samples for characterization and analyzed aging and characterization data. J.-R.C. did Rietveld refinement of XRPD data and wrote the manuscript. All authors have read and agreed to the published version of the manuscript.

Funding

The supports of the Ministry of Science and Technology, ROC (Contract No. MOST-107-2221-E-194-018 and MOST-110-2221-E-194-032).

Institutional Review Board Statement

Not applicable.

Informed Consent Statement

Not applicable.

Data Availability Statement

Not applicable.

Acknowledgments

Chun-Ting Lai prepared some sorbents samples and did preliminary spectroscopy. The supports of Ministry of Science & Technology, R.O.C. (Contract No. MOST-107-2221-E-194-018 and MOST-110-2221-E-194-032), National Synchrotron Radiation Research Center (NSRRC), and Refining & Manufacturing Research Institute, CPC Corporation, Taiwan are acknowledged.

Conflicts of Interest

The authors declare no conflict of interest.

References

  1. Phillips, J. Control and Pollution Prevention Options for Ammonia Emissions; EPA-456/R-95-002; VIGYAN, Inc.: Vienna, Austria, 1995. [Google Scholar]
  2. Goçalves, M.; Sánchez-García, L.; de Oliveira Jardim, E.; Silvestre-Albero, J.; Rodríguez-Reinoso, F. Ammonia Removal Using Activated Carbons: Effect of the Surface Chemistry in Dry and Moist Conditions. Environ. Sci. Technol. 2011, 45, 10605–10610. [Google Scholar] [CrossRef] [Green Version]
  3. Koerkamp, P.W.G.G.; Metz, J.H.M.; Uenk, G.H.; Phillips, V.R.; Holden, M.R.; Sneath, R.W.; Short, J.L.; White, R.P.; Hartung, J.; Seedorf, J.; et al. Concentrations and Emissions of Ammonia in Livestock Buildings in Northern Europe. J. Agric. Eng. Res. 1998, 70, 79–95. [Google Scholar] [CrossRef]
  4. Brinka, C.; Kroezeb, C.; Klimont, Z. Ammonia abatement and its impact on emissions of nitrous oxide and methane-Part 2: Application for Europe. Atmos. Environ. 2001, 35, 6313–6325. [Google Scholar] [CrossRef]
  5. Behera, S.N.; Sharma, M.; Aneja, V.P.; Balasubramanian, R. Ammonia in the atmosphere: A review on emission sources, atmospheric chemistry and deposition on terrestrial bodies. Environ. Sci. Pollut. Res. 2013, 20, 8092–8131. [Google Scholar] [CrossRef]
  6. Chang, Y.H. Non-agricultural ammonia emissions in urban China. Atmos. Chem. Phys. Discuss. 2014, 14, 8495–8531. [Google Scholar]
  7. Melse, R.W.; Ogink, N.W.M. Air scrubbing techniques for ammonia and odor reduction at livestock operations: Review of on-farm research in the Netherlands. Am. Soc. Agric. Eng. 2005, 48, 2303–2313. [Google Scholar] [CrossRef]
  8. Oyarzun, P.; Alarcón, L.; Calabriano, G.; Bejarano, J.; Nuñez, D.; Ruiz-Tagle, N.; Urrutia, H. Trickling filter technology for biotreatment of nitrogenous compounds emitted in exhaust gases from fishmeal plants. J. Environ. Manag. 2019, 232, 165–170. [Google Scholar] [CrossRef] [PubMed]
  9. Cavaseno, V. Industrial Air Pollution Engineering; McGraw-Hill Publication, Co.: New York, NY, USA, 1980; pp. 287–291. [Google Scholar]
  10. Chou, L.-H.; Tsai, R.-I.; Chang, J.-R.; Lee, M.-T. Regenerable adsorbent for removing ammonia evolved from anaerobic reaction of animal urine. J. Environ. Sci. 2006, 18, 1176–1181. [Google Scholar] [CrossRef]
  11. Miysoshi, T.; Boki, K.; Tanada, S. Studies on the Adsorption Removal of Ammonia Gas. Jap. J. Ind. Health 1977, 19, 87–91. [Google Scholar]
  12. Yeh, C.-Y.; Chen, Y.-T.; Chen, N.-Y.; Chang, J.-R. Air Regeneration of Ethanol-Laden Pellet NaY-SiO2 and Pt/NaY-SiO2: Effects of Air Flow Rate on Pt Morphology and Regeneration Efficiency. Catalysts 2018, 8, 288. [Google Scholar] [CrossRef] [Green Version]
  13. Lee, M.-T.; Wang, Z.-Q.; Chang, J.-R. Activated-carbon-supported NaOH for removal of HCl from reformer process streams. Ind. Eng. Chem. Res. 2003, 42, 6166–6170. [Google Scholar] [CrossRef]
  14. Asao, O.; Wang, G.I. Deodorization performance of charcoal particles loaded with orthophosphoric acid against ammonia and trimethylamine. Carbon 2002, 40, 1391–1399. [Google Scholar]
  15. Kim, K.H.; Shin, C.S. Adsorption of Ammonia on the Sulfuric Acid Treated ACF. Carbon Sci. 2001, 2, 109–112. [Google Scholar]
  16. Guo, J.; Xu, W.S.; Chena, Y.L.; Lua, A.C. Adsorption of NH3 onto activated carbon prepared from palm shells impregnated with H2SO4. J. Colloid Interface Sci. 2005, 281, 285–290. [Google Scholar] [CrossRef] [PubMed]
  17. Wang, Y.; Jung, J.; Wen, J.; Ren, X.; Sun, Y. Removal of ammonia from atmosphere by air stripping with mesoporous silica-supported N-halamines. J. Environ. Chem. Eng. 2021, 9, 104900. [Google Scholar] [CrossRef]
  18. Mochida, I.; Kawano, S. Capture of Ammonia by Active Carbon Fibers Further Activated with Sulfuric Acid. Ind. Eng. Chem. Res. 1991, 30, 2322–2327. [Google Scholar] [CrossRef]
  19. Lu, Z.; Hines, J.A.; Rozewicz, D.J.; Hines, M.L. Ammonia Removal from Rodent Habitat Operations in Space Using Phosphoric Acid Treated Activated Carbon. Am. J. Anal. Chem. 2013, 4, 776–780. [Google Scholar] [CrossRef] [Green Version]
  20. Humbeck, J.F.V.; McDonald, T.M.; Jing, X.; Wiers, B.M.; Zhu, G.; Long, J.R. Ammonia Capture in Porous Organic Polymers Densely Functionalized with Brønsted Acid Groups. J. Am. Chem. Soc. 2014, 136, 2432–2440. [Google Scholar] [CrossRef]
  21. Barin, G.; Peterson, G.W.; Crocell, V.; Xu, J.; Colwell, K.A.; Nandy, A.; Reimer, J.A.; Bordiga, S.; Long, J.R. Highly effective ammonia removal in a series of Brønsted acidic porous polymers: Investigation of chemical and structural variations. Chem. Sci. 2017, 8, 4399. [Google Scholar] [CrossRef] [PubMed] [Green Version]
  22. Kang, D.W.; Kang, M.; Kim, D.W.; Kim, H.; Lee, Y.H.; Yun, H.; Choe, J.H.; Hong, C.S. Engineered Removal of Trace NH3 by Porous Organic Polymers Modified via Sequential Post-Sulfonation and Post-Alkylation. Adv. Sustain. Syst. 2020, 5, 2000161. [Google Scholar] [CrossRef]
  23. Hammersley, A.P. FIT2D: A multi-purpose data reduction, analysis and visualization program. J. Appl. Cryst. 2016, 49, 646–652. [Google Scholar] [CrossRef]
  24. Rietveld, H.M. A profile refinement method for nuclear and magnetic structures. J. Appl. Crystallogr. 1969, 2, 65–71, 102–104. [Google Scholar] [CrossRef]
  25. Toby, B.H. EXPGUI, a graphical user interface for GSAS. J. Appl. Crystallogr. 2001, 34, 210–213. [Google Scholar] [CrossRef] [Green Version]
  26. McCallum, C.L.; Bandosz, T.J.; McGrother, S.C.; Müller, E.A.; Gubbins, K.E. A Molecular Model for Adsorption of Water on Activated Carbon: Comparison of Simulation and Experiment. Langmuir 1999, 15, 533–544. [Google Scholar] [CrossRef]
  27. Bandosz, T.J.; Petit, C. On the reactive adsorption of ammonia on activated carbons modified by impregnation with inorganic compounds. J. Colloid Interface Sci. 2009, 338, 329–345. [Google Scholar] [CrossRef]
  28. Le Leuch, L.M.; Bandosz, T.J. The role of water and surface acidity on the reactive adsorption of ammonia on modified activated carbons. Carbon 2007, 45, 568–578. [Google Scholar] [CrossRef]
  29. Cullity, B.D. Elements of X-ray Diffraction, 2nd ed.; Addison-Wesley Publishing Company: Reading, MA, USA, 1978; pp. 99–106, 182–183. [Google Scholar]
  30. Little, L.H. Infrared Spectra of Adsorbed Species; Academic Press: London, UK; New York, NY, USA, 1966; pp. 367–374. [Google Scholar]
  31. Klähn, M.; Mathias, G.; Kötting, C.; Nonella, M.; Schlitter, J.; Gerwert, K.; Tavan, P. IR Spectra of Phosphate Ions in Aqueous Solution: Predictions of a DFT/MM Approach Compared with Observations. J. Phys. Chem. A 2004, 108, 6186–6194. [Google Scholar] [CrossRef]
  32. Arai, Y.; Sparks, D.L. ATR—FTIR Spectroscopic Investigation on Phosphate Adsorption Mechanisms at the Ferrihydrite—Water Interface. J. Colloid Interface Sci. 2001, 241, 317–326. [Google Scholar] [CrossRef] [Green Version]
  33. Renganayaki, V.; Syamala, D.; Sathyamoorthy, R. Growth, Structural and Spectral Studies on pure and doped Ammonium Dihydrogen Phosphate (ADP) single crystals. Arch. Appl. Sci. Res. 2012, 4, 1453–1461. [Google Scholar]
  34. Rudolph, W.W. Raman- and infrared-spectroscopic investigations of dilute aqueous phosphoric acid solutions. Dalton Trans. 2010, 39, 9642–9653. [Google Scholar] [CrossRef]
  35. Sethna, P.P.; Downing, H.D.; Pinkleyt, L.W.; Williams, D. Infrared band intensities in ammonium hydroxide and ammonium salts. J. Opt. Soc. Am. 1978, 68, 429–431. [Google Scholar] [CrossRef]
  36. Condon, J.B. Surface Area and Porposity Determinations by Physisorption: Measurements and Theory; Elservier: Amsterdam, The Netherlands, 2006; pp. 1–28. [Google Scholar]
  37. Bläker, C.; Muthmann, J.; Pasel, C.; Bathen, D. Characterization of Activated Carbon Adsorbents—State of the Art and Novel Approaches. ChemBioEng Rev. 2019, 6, 119–138. [Google Scholar] [CrossRef]
  38. Zhu, Z.; Zhu, Z.; Yin, P. Influence of Solubility of Ammonium Sulfate Caused by Decreasing pH or Adding Fe3+ from (288.15 to 359.15) K. Chem. Eng. Data 2008, 53, 564–565. [Google Scholar] [CrossRef]
  39. Xu, D.; Xiong, X.; Yang, L.; Zhang, Z.; Wang, X. Determination of the Solubility of Ammonium Dihydro gen Phosphate in Water−Ethanol System at Different Temperatures from 283.2 to 343.2 K. Chem. Eng. Data 2016, 61, 78–82. [Google Scholar] [CrossRef]
Figure 1. Breakthrough curve for different sorbents (from left to right: ceramic diluent, PC24, PC8, PC4, PC0, PC0w, PA14, PA0; subscript w: wet gas.
Materials 15 00784 g001
Figure 2. (a). Powder X-ray spectra of activated carbon (black), PC0 (orange), PC4 (green), PC8 (blue), and PC24 (red), red bar denotes SiO2; (b). Powder X-ray spectra of H3PO4/C after breakthrough test: (i) PC0wet (dash-dot line), (ii) PC0dry, (iii) PC4dry, (iv) PC8dry, (v) PC24dry, blue bar denotes diffraction position of MAP, red bar denotes SiO2, and brown bar denotes DAP; subscript wet denotes testing by moisture containing waste gas, dry denotes by dry waste gas; (c). Powder X-ray spectra of H3PO4/A before and after breakthrough test: (i) Amberlyst 35; (ii) PA0; (iii) PA0dry; (iv) PA14; (v) PA14dry. blue bar denotes the diffraction position of MAP.
Materials 15 00784 g002
Figure 3. The Rietveld refinement of PC24dry (a), PC0dry (b) and PC0wet (c). (+) denote experimental data, solid red line denotes simulation curve, green line denotes baseline, blue line denotes residue, blue bar denotes diffraction position of ADP, red bar denotes SiO2, and brown bar denotes MDP.
Materials 15 00784 g003
Figure 4. (a). In situ FT-IR spectra of (i) activated carbon, (ii) PC0, (iii) PC0 after flowing NH3 in dry air, (iv) PC8 after flowing NH3 in dry air, and (v) PC0 after flowing NH3 in wet air; (b). In situ FT-IR spectra of (i) Amberlyst 35, (ii) PA0, (iii) PA0 after flowing NH3 in dry air, (iv) PA14, and (v) PA14 after flowing NH3 in dry air.
Materials 15 00784 g004
Figure 5. TGA profile of activated carbon (black), Amberlyst 35 (red), PA0 (pink), PA14 (orange), PC0 (blue), and PC8 (brown).
Materials 15 00784 g005
Figure 6. Nitrogen adsorption isotherm at 77K for (a) PC0, (b) AC0, (c) used PC0, and (d) used PC0.
Materials 15 00784 g006
Figure 7. Comparison of pore size distribution for the activated carbon (dash line ●), Amberlyst 35 (dash line ♦), used PC0 (solid line ●), used PA0 (solid line ♦).
Materials 15 00784 g007
Table 1. The results of crystal parameters by the Rietveld refinement.
Sample NamePC24dryPC0dryPC0wet
Space group: SiO2P3221(trigonal)P3221 (trigonal)P3221 (trigonal)
H2(NH4)PO4- -
H(NH4)2PO4--P21/C (monoclinic)
Lattice parameters:
H2(NH4)PO4(Å)-a = 7.477, c = 7.528 -
H(NH4)2PO4(Å)--a = 10.959, b = 6.651,
c = 7.967
Lattice parameters:a = 4.918a = 4.899 a = 4.891
SiO2(Å) c = 5.409c = 5.392c = 5.380
wRp0.00940.0380.020
Rp0.00580.0250.014
X20.0820.1060.136
Grain size (nm)
SiO2545342
H2(NH4)PO4-32-
H(NH4)2PO4--39
Table 2. Effects of water content on NH3 removal capacities and the ratio of crystal formed in sorbent x to that in PC0; removal capacities were estimated from breakthrough curves and Crystal(x)/Crystal (PC0) from Rietveld refinement results.
Sorbent xWater % MassP2O5 % Massg (Mole) NH3/
Kg Sorbent
Crystal(x)/
Crytstal(PC0)
PC016.026.328(1.64)1
PC0 (wet)16.026.366(3.88)0.145
PC49.030.911(0.64)0.284
PA032.118.094(5.53)1.574
PA1423.423.978(4.56)1.198
Publisher’s Note: MDPI stays neutral with regard to jurisdictional claims in published maps and institutional affiliations.

