
Prediction Model of Three-Dimensional Machined Potassium Dihydrogen Phosphate Surfaces Based on a Dynamic Response Machining System


Abstract
1. Introduction
2. Experiments and Methods
2.1. Experiments
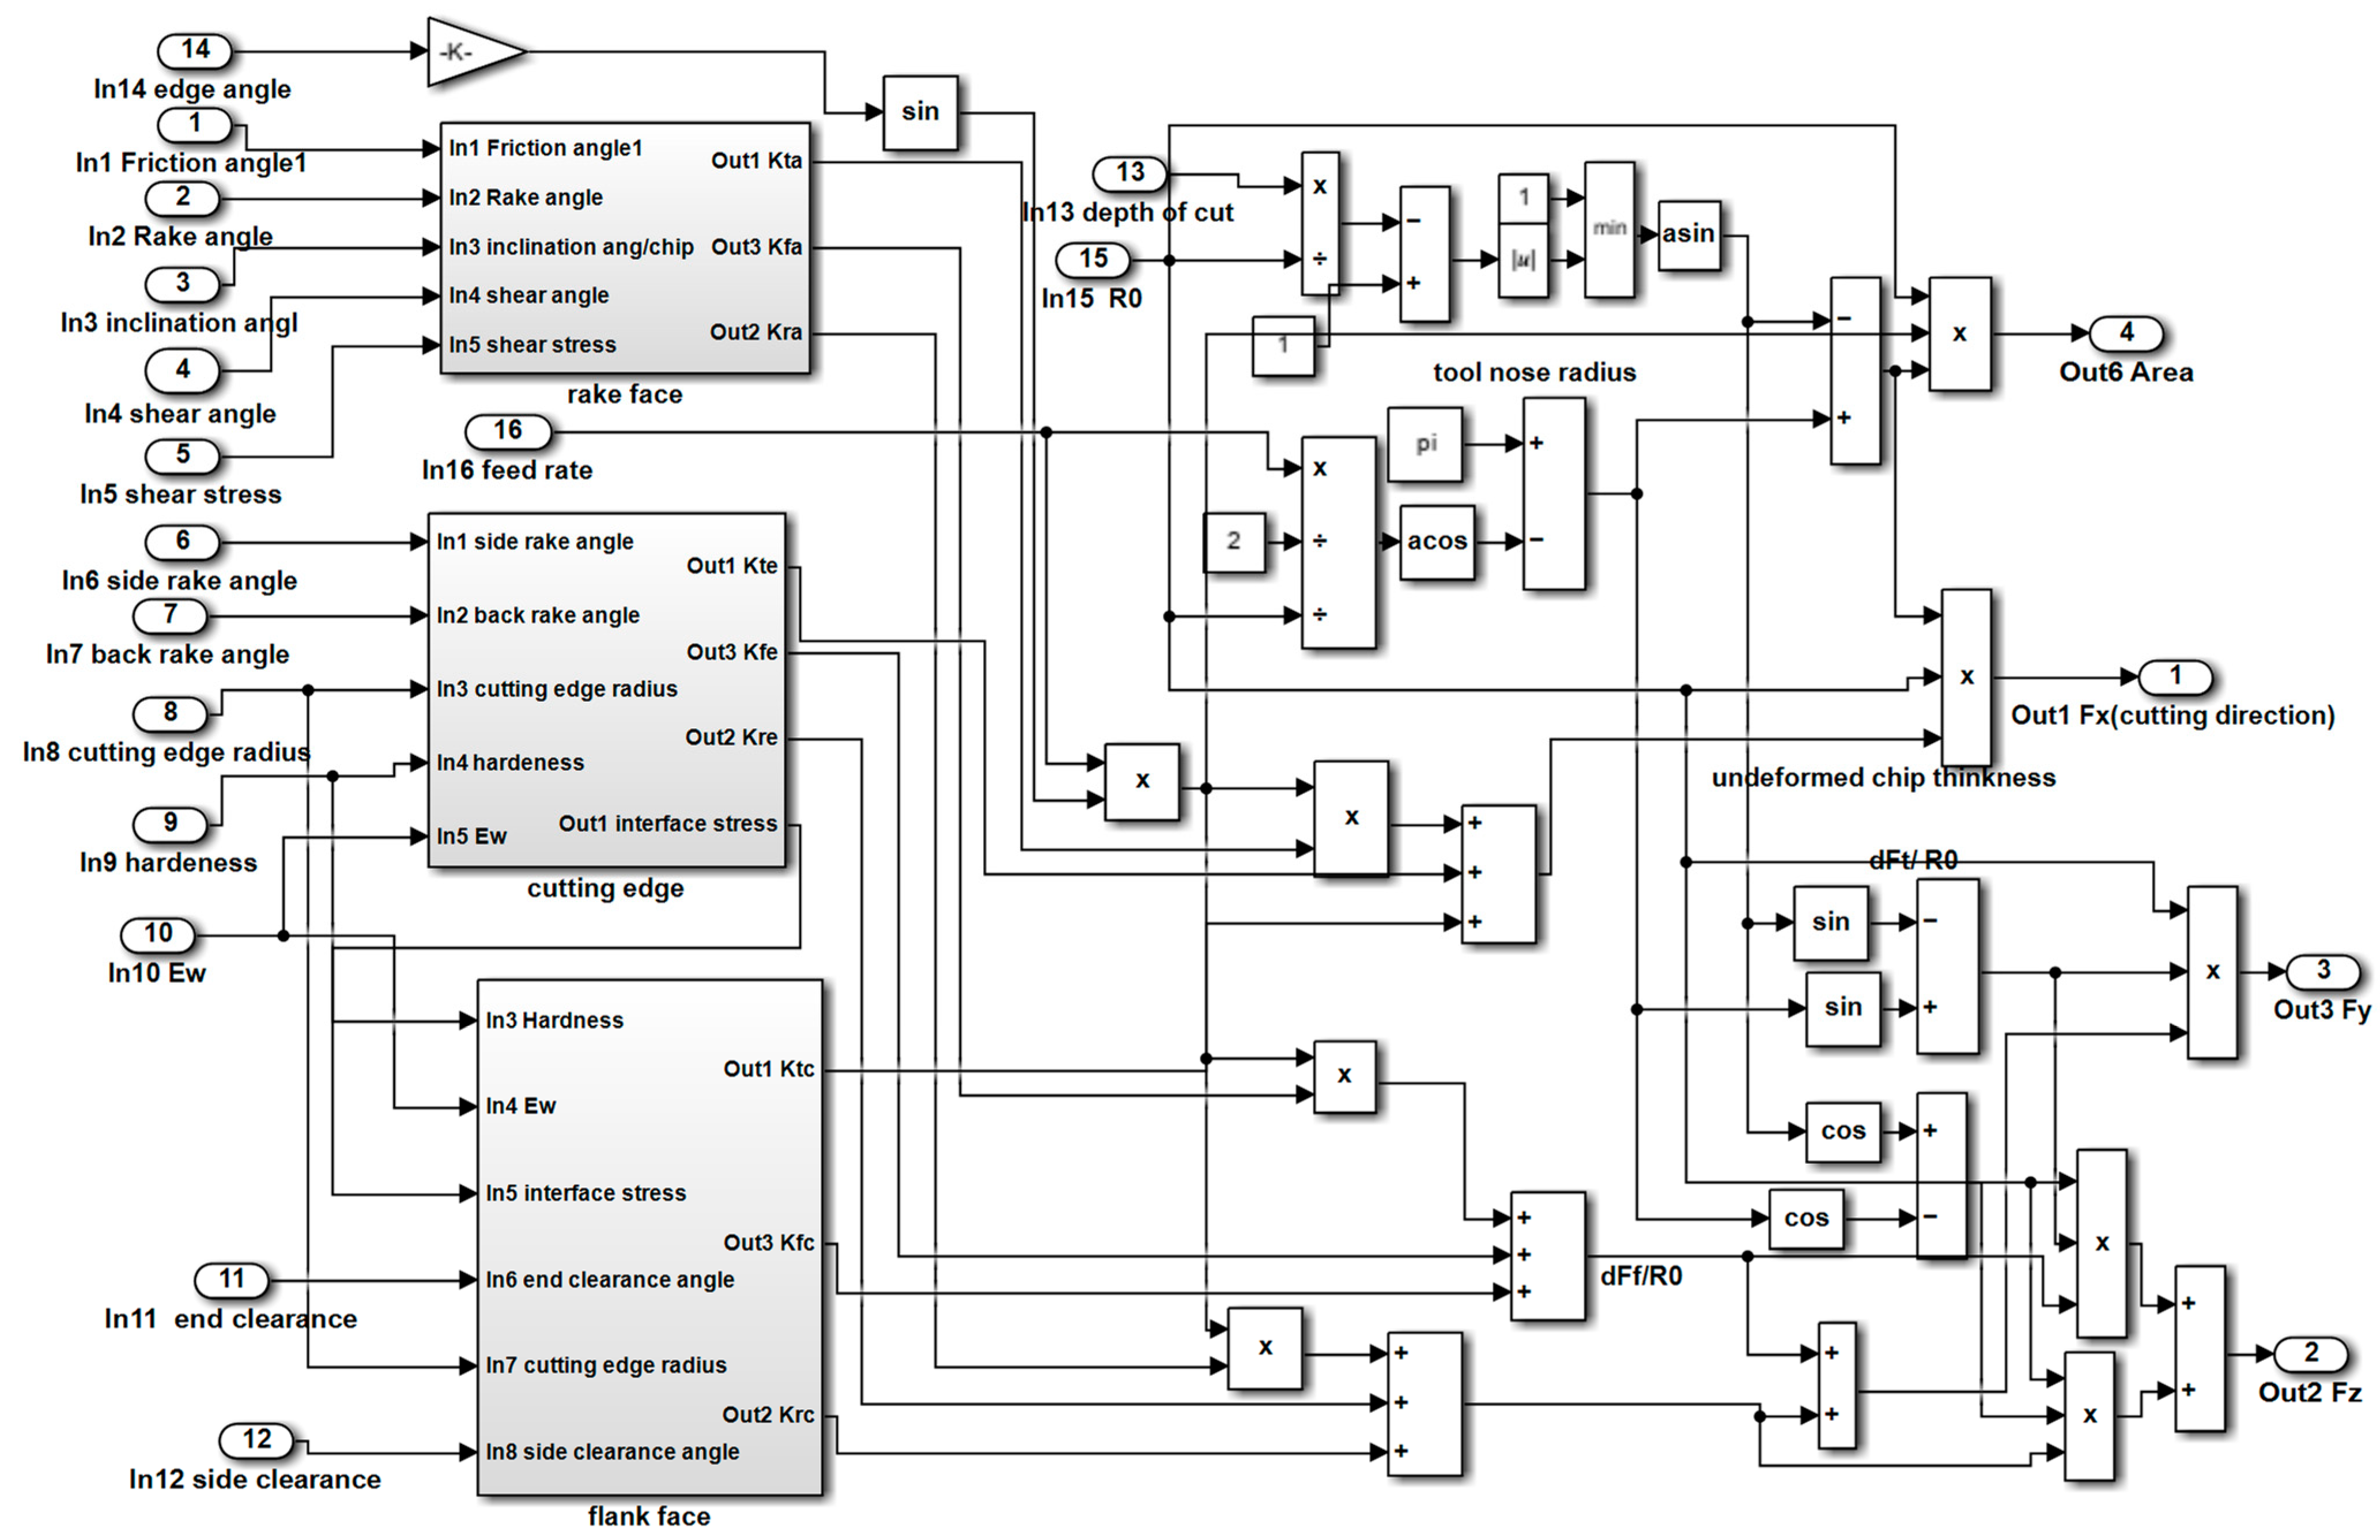
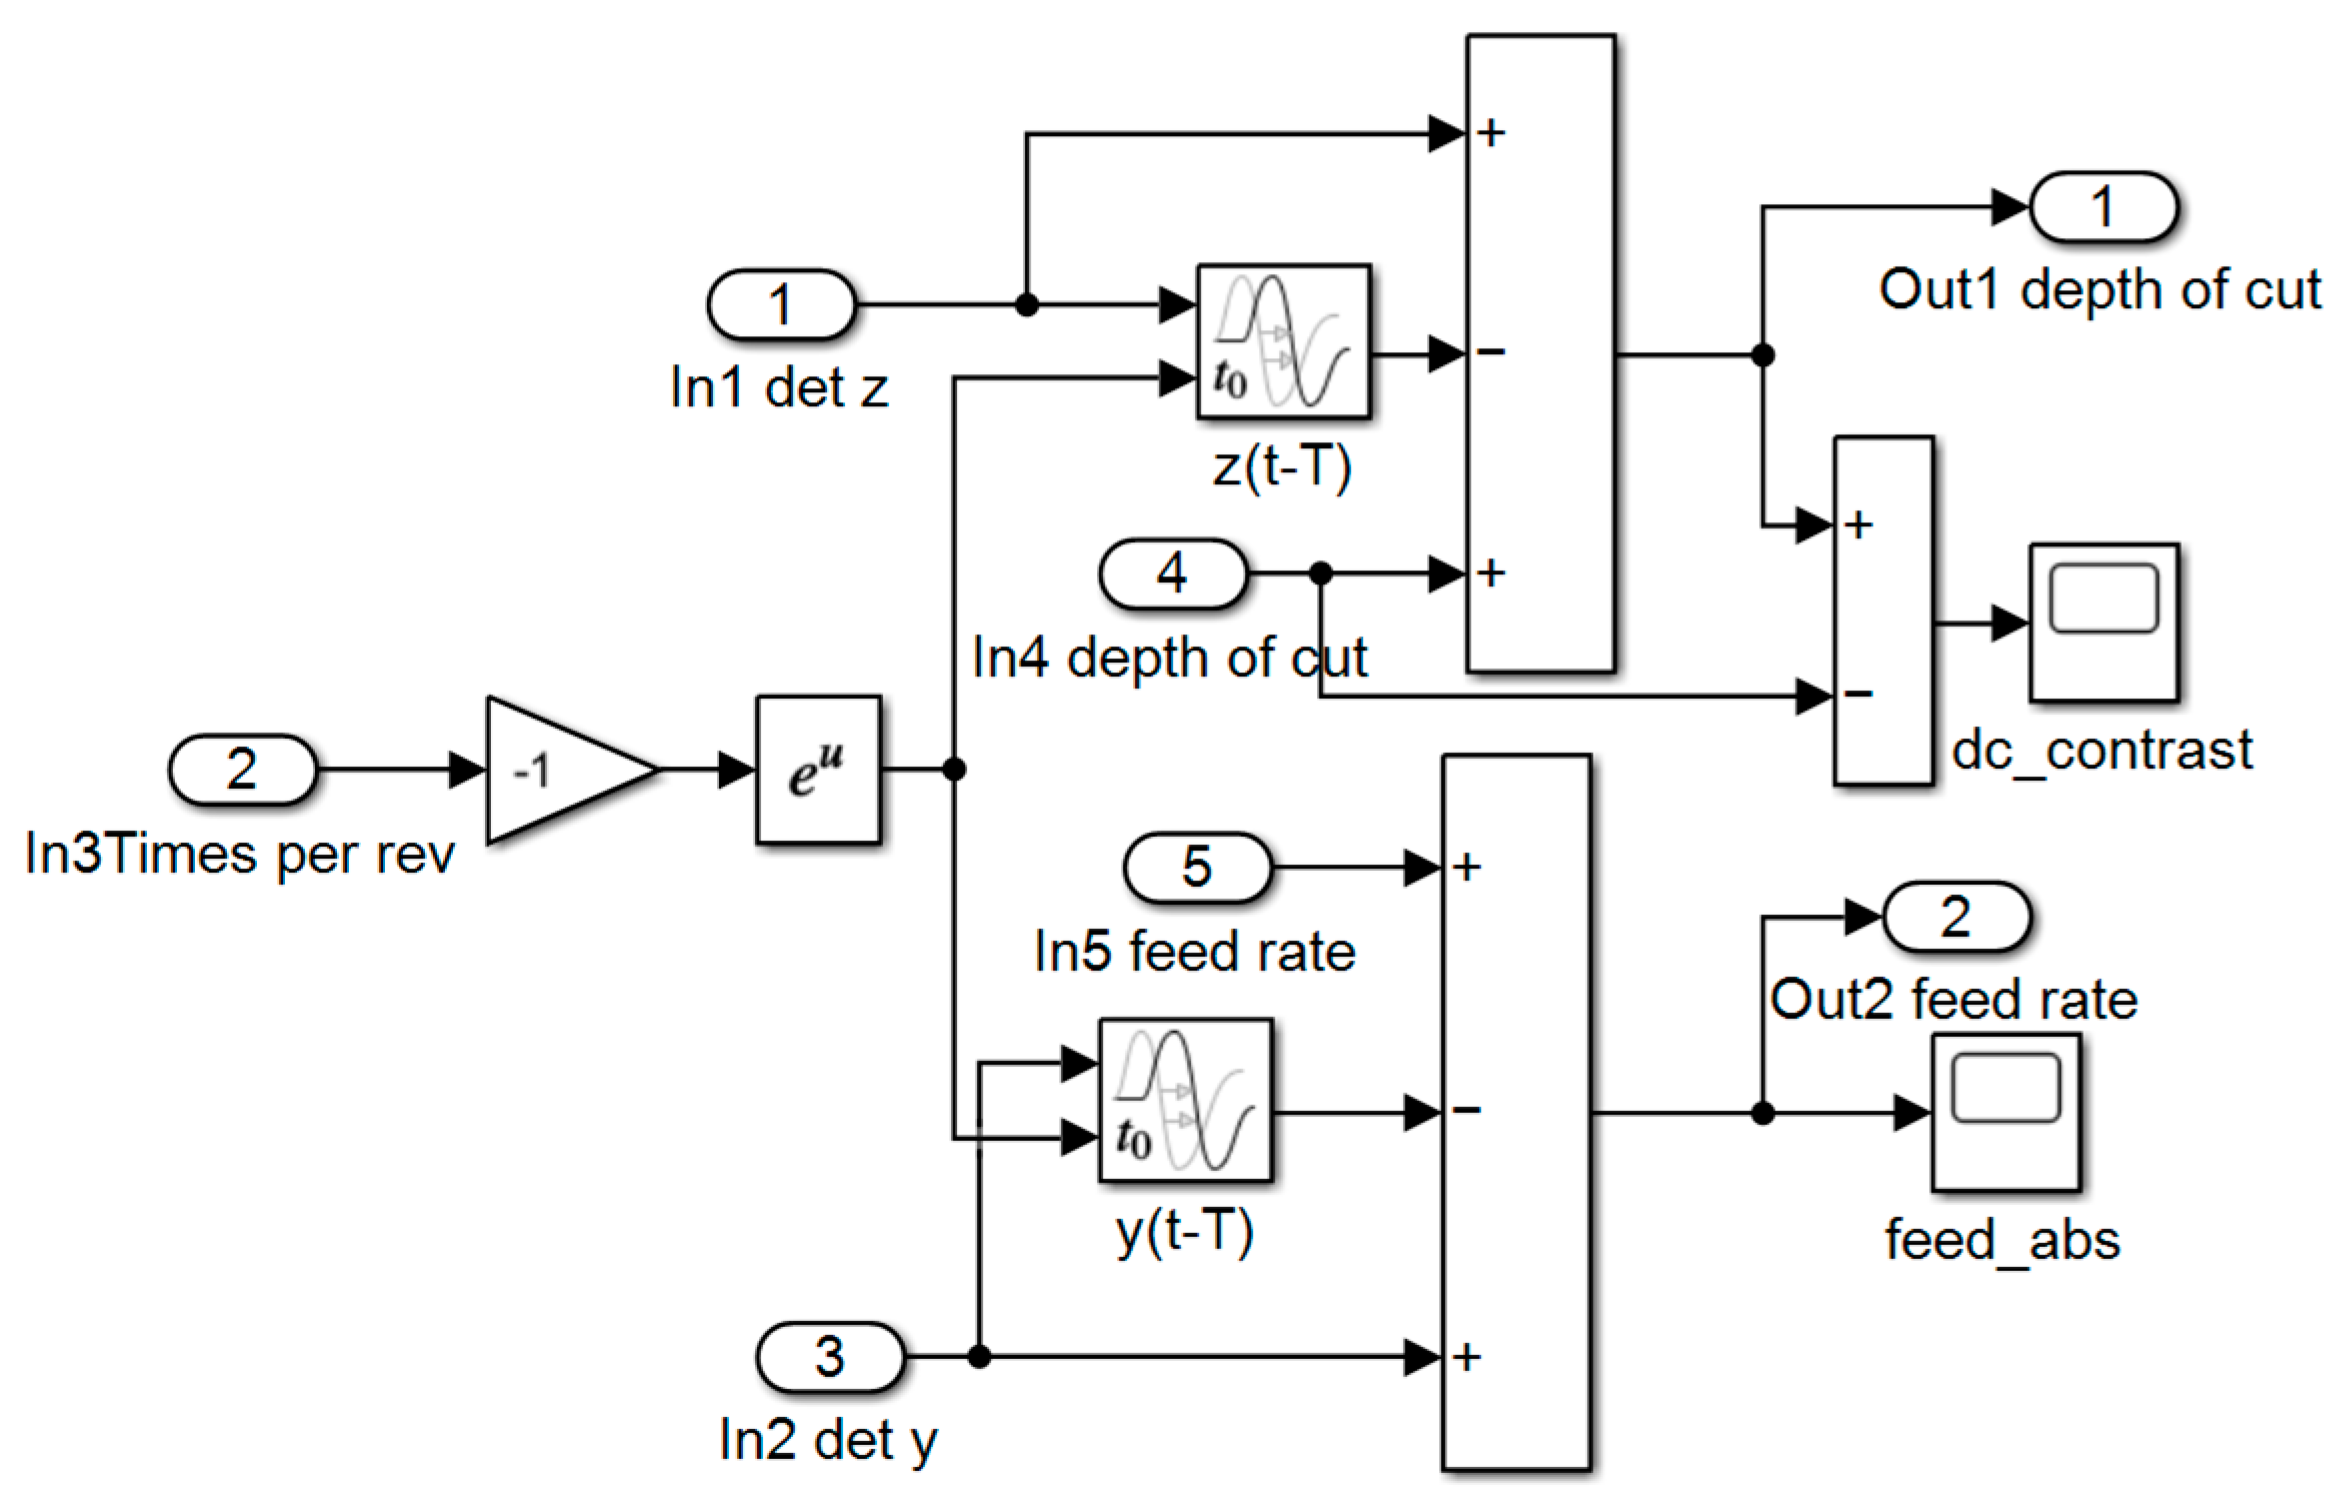
2.2. Simulation Models
3. Results and Discussion
4. Conclusions
- (1)
- In summary, these simulation results show that the dynamic response model built in this study includes almost all machining process factors as the input parameters and can predict the machined KDP surface topography at both macro- and micro-scales. The simulation model presented in this study can also be used to predict the face turning-machined surfaces of other materials when the material parameters are changed.
- (2)
- The obvious waviness textures around the center of the workpiece are distributed in the entire 3D simulation surface. The entire simulation surface can represent the whole machining process of the complete workpiece and reflects the surface roughness and geometric error of machined KDP surfaces; The 3D entire simulation surface maintains the directional features of the machined surfaces.
- (3)
- The amplitudes and wavelengths of 3D spatial frequencies in the local 3D simulated topographies are accordant with those in the experiment surfaces. The differences in sampling position induce the different distribution directions of waviness in the local 3D simulated topographies and experiment surfaces.
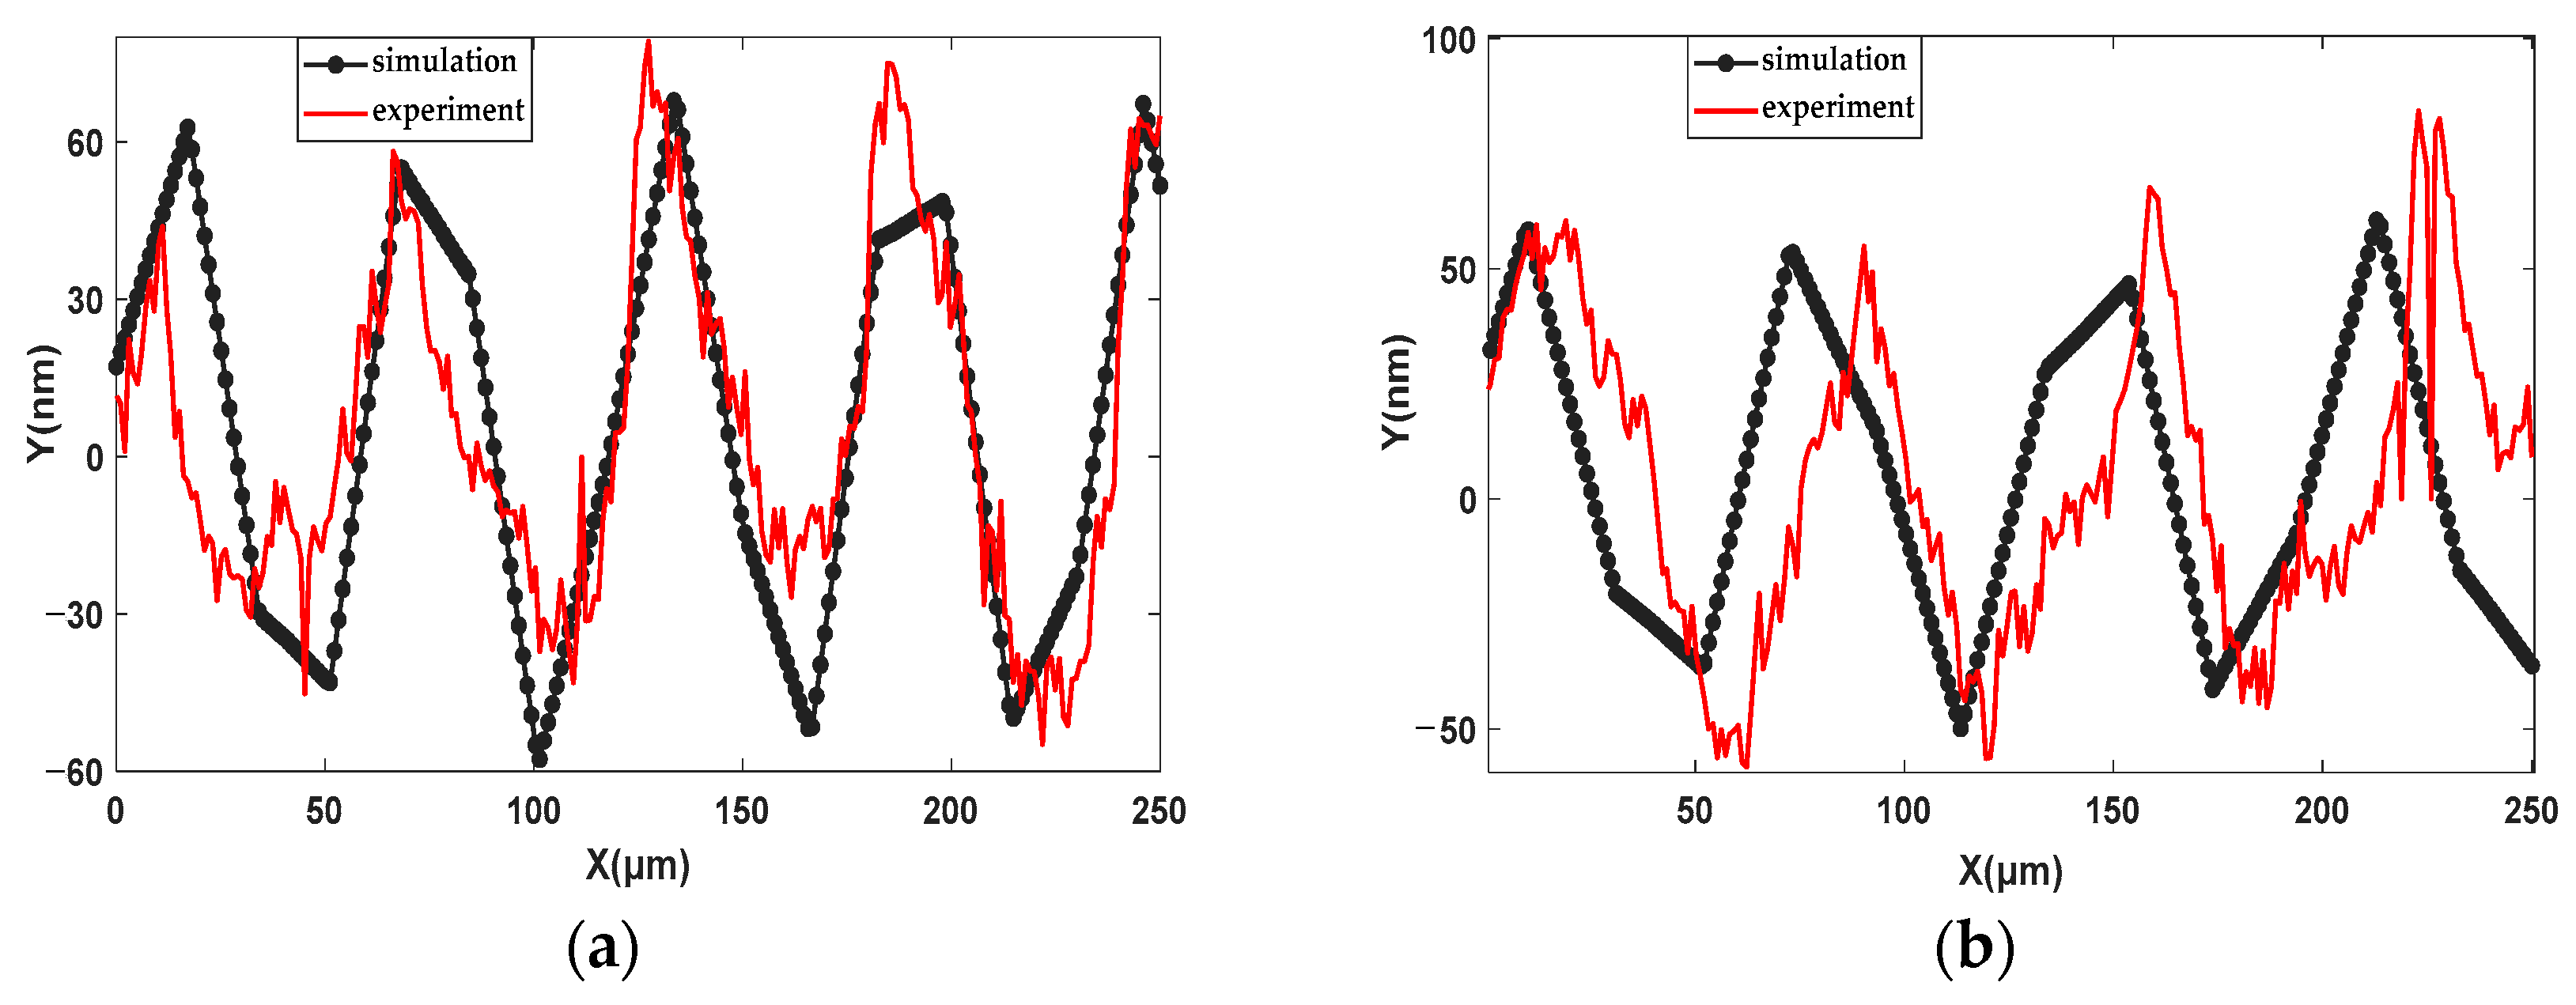
- (4)
- The amplitudes and interval distances of peaks in the simulation profiles are consistent with those in the experiment profiles. The simulation profiles are smoother than the experiment profiles. The micro-waviness that overlaps in the experiment profiles is due to brittle fractures of the KDP crystal and measurement noise.
- (5)
- The simulation and experiment surfaces have the same main frequencies. Their low and high frequencies have slight differences. The reason for this is that the runout of the spindle and output noise of the fast tool servo are not constants and changed with variation in cutting parameters.
Author Contributions
Funding
Institutional Review Board Statement
Informed Consent Statement
Data Availability Statement
Acknowledgments
Conflicts of Interest
References
- Zhang, Z.; Wang, H.; Quan, X.; Pei, G.; Tian, M.; Liu, T.; Long, K.; Li, P.; Rong, Y. Optomechanical analysis and performance optimization of large-aperture KDP frequency converter. Opt. Laser. Technol. 2018, 109, 633–642. [Google Scholar] [CrossRef]
- Spaeth, M.; Manes, K.; Kalantar, D. Description of the NIF Laser. Fusion Sci. Technol. 2016, 69, 25–145. [Google Scholar] [CrossRef]
- Lza, B.; Swa, B.; Hy, C. Study on optical performance and 532 nm laser damage of rapidly grown KDP crystals. Opt. Mater. 2021, 114, 110995. [Google Scholar] [CrossRef]
- Baig, M.; Anis, M.; Muley, G. Comprehensive study on crystal growth, optical and dielectric properties of potassium dihydrogen orthophosphate crystal influenced by organic additive salicylic acid. Optik 2017, 131, 165–170. [Google Scholar] [CrossRef]
- Bei, G.; Ma, C.; Wang, X.; Sun, J.; Ni, X. On the optimal texture shape with the consideration of surface roughness. Sci. Rep. 2022, 12, 14878. [Google Scholar] [CrossRef] [PubMed]
- Bei, G.; Ma, C.; Wang, X.; Sun, J.; Ni, X. Study on Tribological Characteristics of Textured Surface under Convergent Oil Film Gap. Lubricants 2022, 10, 183. [Google Scholar] [CrossRef]
- Adamczak, S.; Zmarzły, P. Influence of raceway waviness on the level of vibration in rolling-element bearings. Bull. Pol. Acad. Sci. Technol. 2017, 65, 541–551. [Google Scholar] [CrossRef]
- Mehmet, E.K.; Munish, K.G.; Mehmet, B.; Nafiz, Y.; Grzegorz, M.K.; Mustafa, G. Influence of duplex jets MQL and nano-MQL cooling system on machining performance of Nimonic 80A. J. Manuf. Process. 2021, 69, 112–114. [Google Scholar] [CrossRef]
- Sen, B.; Mia, M.; Krolczyk, G.M. Eco-Friendly Cutting Fluids in Minimum Quantity Lubrication Assisted Machining: A Review on the Perception of Sustainable Manufacturing. Int. J. Precis. Eng. Manuf. Green Technol. 2021, 8, 249–280. [Google Scholar] [CrossRef]
- Munish, K.G.; Niesłony, P.; Sarikaya, M.; Mehmet, E.K.; Kuntoğlu, M.; Jamil, M. Tool wear patterns and their promoting mechanisms in hybrid cooling assisted machining of titanium Ti-3Al-2.5V/grade 9 alloy. Tribol. Int. 2022, 174, 107773. [Google Scholar] [CrossRef]
- Şap, S.; Usca, Ü.A.; Uzun, M.; Kuntoğlu, M.; Salur, E.; Pimenov, D.Y. Investigation of the effects of cooling and lubricating strategies on tribological characteristics in machining of hybrid composites. Lubricants 2022, 10, 63. [Google Scholar] [CrossRef]
- Emin, S. Understandings the tribological mechanism of Inconel 718 alloy machined under different cooling/lubrication conditions. Tribol. Int. 2022, 174, 107677. [Google Scholar] [CrossRef]
- Yang, H.; Cheng, J.; Liu, Z.; Liu, Q.; Zhao, L.; Wang, J.; Chen, M. Dynamic behavior modeling of laser-induced damage initiated by surface defects on KDP crystals under nanosecond laser irradiation. Sci. Rep. 2020, 10, 500. [Google Scholar] [CrossRef] [PubMed]
- Cheng, J.; Xiao, Y.; Liu, Q.; Yang, H.; Zhao, L.; Chen, M.; Tan, J.; Liao, W.; Chen, J.; Yuan, X. Effect of surface scallop tool marks generated in micro-milling repairing process on the optical performance of potassium dihydrogen phosphate crystal. Mater. Des. 2018, 157, 447–456. [Google Scholar] [CrossRef]
- Miao, J.; Yu, D.; An, C.; Ye, F.; Yao, J. Investigation on the generation of the medium-frequency waviness error in flycutting based on 3D surface topography. Int. J. Adv. Manuf. Technol. 2017, 90, 667–675. [Google Scholar] [CrossRef]
- Xiao, M.; Shen, X.; Ma, Y. Prediction of Surface Roughness and Optimization of Cutting Parameters of Stainless Steel Turning Based on RSM. Math. Probl. Eng. 2018, 2018, 9051084. [Google Scholar] [CrossRef]
- Raj, A.; Wins, K.L.D.; Varadarajan, A.S. Optimization of cutting parameters and prediction of surface roughness during hard turning of H13 steel with minimal vegetable oil based cutting fluid application using response surface methodology. IOP Conf. Ser.: Mater. Sci. Eng. 2019, 577, 012023. [Google Scholar] [CrossRef]
- Zou, L.; Liu, X.; Huang, Y.; Fei, Y. A numerical approach to predict the machined surface topography of abrasive belt flexible grinding. Int. J. Adv. Manuf. Tech. 2019, 104, 2961–2970. [Google Scholar] [CrossRef]
- Zhang, N.; Shetty, D. An effective LS-SVM-based approach for surface roughness prediction in machined surfaces. Neurocomputing 2016, 198, 35–39. [Google Scholar] [CrossRef]
- Liu, H.; Zhang, J.; Xu, B.; Xu, X.; Zhao, W. Prediction of microstructure gradient distribution in machined surface induced by high speed machining through a coupled FE and CA approach. Mater Design 2020, 196, 109133. [Google Scholar] [CrossRef]
- Prabhakar, D.; Kumar, M.; Krishna, G. A Novel Hybrid Transform approach with integration of Fast Fourier, Discrete Wavelet and Discrete Shearlet Transforms for prediction of surface roughness on machined surfaces. Measurement 2020, 164, 108011. [Google Scholar] [CrossRef]
- Dong, Z.; Jiao, L.; Wang, X.; Liang, Z.; Liu, Z.; Yi, J. FEA-based prediction of machined surface errors for dynamic fixture-workpiece system during milling process. Int. J. Adv. Manuf. Tech. 2016, 85, 299–315. [Google Scholar] [CrossRef]
- Jia, X.; Zhou, Y.; Wang, Y. Deformation behavior and constitutive model of 34CrNi3Mo during thermo-mechanical deformation process. Materials 2022, 15, 5220. [Google Scholar] [CrossRef]
- Lin, Y.; Wu, K.; Shih, W.; Hsu, P.; Hung, J. Prediction of surface roughness based on cutting parameters and machining vibration in end milling using regression method and artificial neural network. Appl. Sci. 2020, 11, 3941. [Google Scholar] [CrossRef]
- Yi, Y.; Liu, T.; Yan, Y.; Feng, J.; Ni, Z.; Liu, X. A novel assembly tolerance analysis method considering form errors and partial parallel connections. Int. J. Adv. Manuf. Technol. 2022, 7, 1–22. [Google Scholar] [CrossRef]
- Shao, C.; Ren, J.; Wang, H.; Jin, J.; Hu, S. Improving machined surface shape prediction by integrating multi-task learning with cutting force variation modeling. J. Manuf. Sci. Eng. 2017, 139, 011014. [Google Scholar] [CrossRef]
- Ulas, M.; Aydur, O.; Gurgenc, T.; Ozel, C. Surface roughness prediction of machined aluminum alloy with wire electrical discharge machining by different machine learning algorithms. J. Mater. Res. Technol. 2020, 9, 12512–12524. [Google Scholar] [CrossRef]
- Itoh, T.; Yamauchi, N. Surface morphology characterization of pentacene thin film and its substrate with under-layers by power spectral density using fast Fourier transform algorithms. Appl. Surf. Sci. 2007, 253, 6196–6202. [Google Scholar] [CrossRef]


| Parameters | Values |
|---|---|
| Tool tip radius rε (mm) | 3.2 |
| Tool edge radius rn (nm) | 150 |
| Rake angle γ0 (°) | −10 |
| Clearance angle α0 (°) | 9 |
| Roughness of rake face Ra (nm) | 5.4 |
| Roughness of flank face Ra (nm) | 4.3 |
| Roughness of cutting edge Ra (nm) | 7.6 |
| Cutting Experiment | Cutting Depth ap/μm | Spindle Speed n/(r/min) | Feed Rate f/(μm/r) |
|---|---|---|---|
| 1 | 9 | 1300 | 12 |
| 2 | 6 | 1400 | 14 |
| Parameters | Values |
|---|---|
| Density (kg/m3) | 2338 |
| Elastic modulus (GPa) | 75 |
| Poisson ratio | 0.33 |
| Mohs hardness | 2.5 |
| Yield strength (MPa) | 240 |
| Input Vibration Variables | Amplitude/μm | Frequency/Hz |
|---|---|---|
| environment vibration | 0.01 | 500 |
| radial runout of the spindle | 0.05 | 30 |
| axial runout of the spindle | 0.05 | 30 |
| output noise of fast tool servo | 0.02 | 125 |
| Input Variable | Error in the Z Direction/μm | Error in the Z Direction/μm |
|---|---|---|
| motion error of guide | 15 | 40 |
| Parameters | Tool System | Workpiece System | ||||
|---|---|---|---|---|---|---|
| X | Y | Z | X | Y | Z | |
| equivalent mass (Kg) | 74.3 | 1045.4 | ||||
| static stiffness (N/μm) | 164 | 143 | 167 | 135 | 124 | 156 |
| damping ratio | 0.82 | 0.74 | 0.85 | 0.64 | 0.56 | 0.68 |
Publisher’s Note: MDPI stays neutral with regard to jurisdictional claims in published maps and institutional affiliations. |
© 2022 by the authors. Licensee MDPI, Basel, Switzerland. This article is an open access article distributed under the terms and conditions of the Creative Commons Attribution (CC BY) license (https://creativecommons.org/licenses/by/4.0/).
Share and Cite
Pang, Q.; Xiong, J. Prediction Model of Three-Dimensional Machined Potassium Dihydrogen Phosphate Surfaces Based on a Dynamic Response Machining System. Materials 2022, 15, 9068. https://doi.org/10.3390/ma15249068
Pang Q, Xiong J. Prediction Model of Three-Dimensional Machined Potassium Dihydrogen Phosphate Surfaces Based on a Dynamic Response Machining System. Materials. 2022; 15(24):9068. https://doi.org/10.3390/ma15249068
Chicago/Turabian StylePang, Qilong, and Jianlong Xiong. 2022. "Prediction Model of Three-Dimensional Machined Potassium Dihydrogen Phosphate Surfaces Based on a Dynamic Response Machining System" Materials 15, no. 24: 9068. https://doi.org/10.3390/ma15249068
APA StylePang, Q., & Xiong, J. (2022). Prediction Model of Three-Dimensional Machined Potassium Dihydrogen Phosphate Surfaces Based on a Dynamic Response Machining System. Materials, 15(24), 9068. https://doi.org/10.3390/ma15249068