
Effect of Waste Glass as Fine Aggregate on Properties of Mortar


Abstract
1. Introduction
2. Materials and Methods
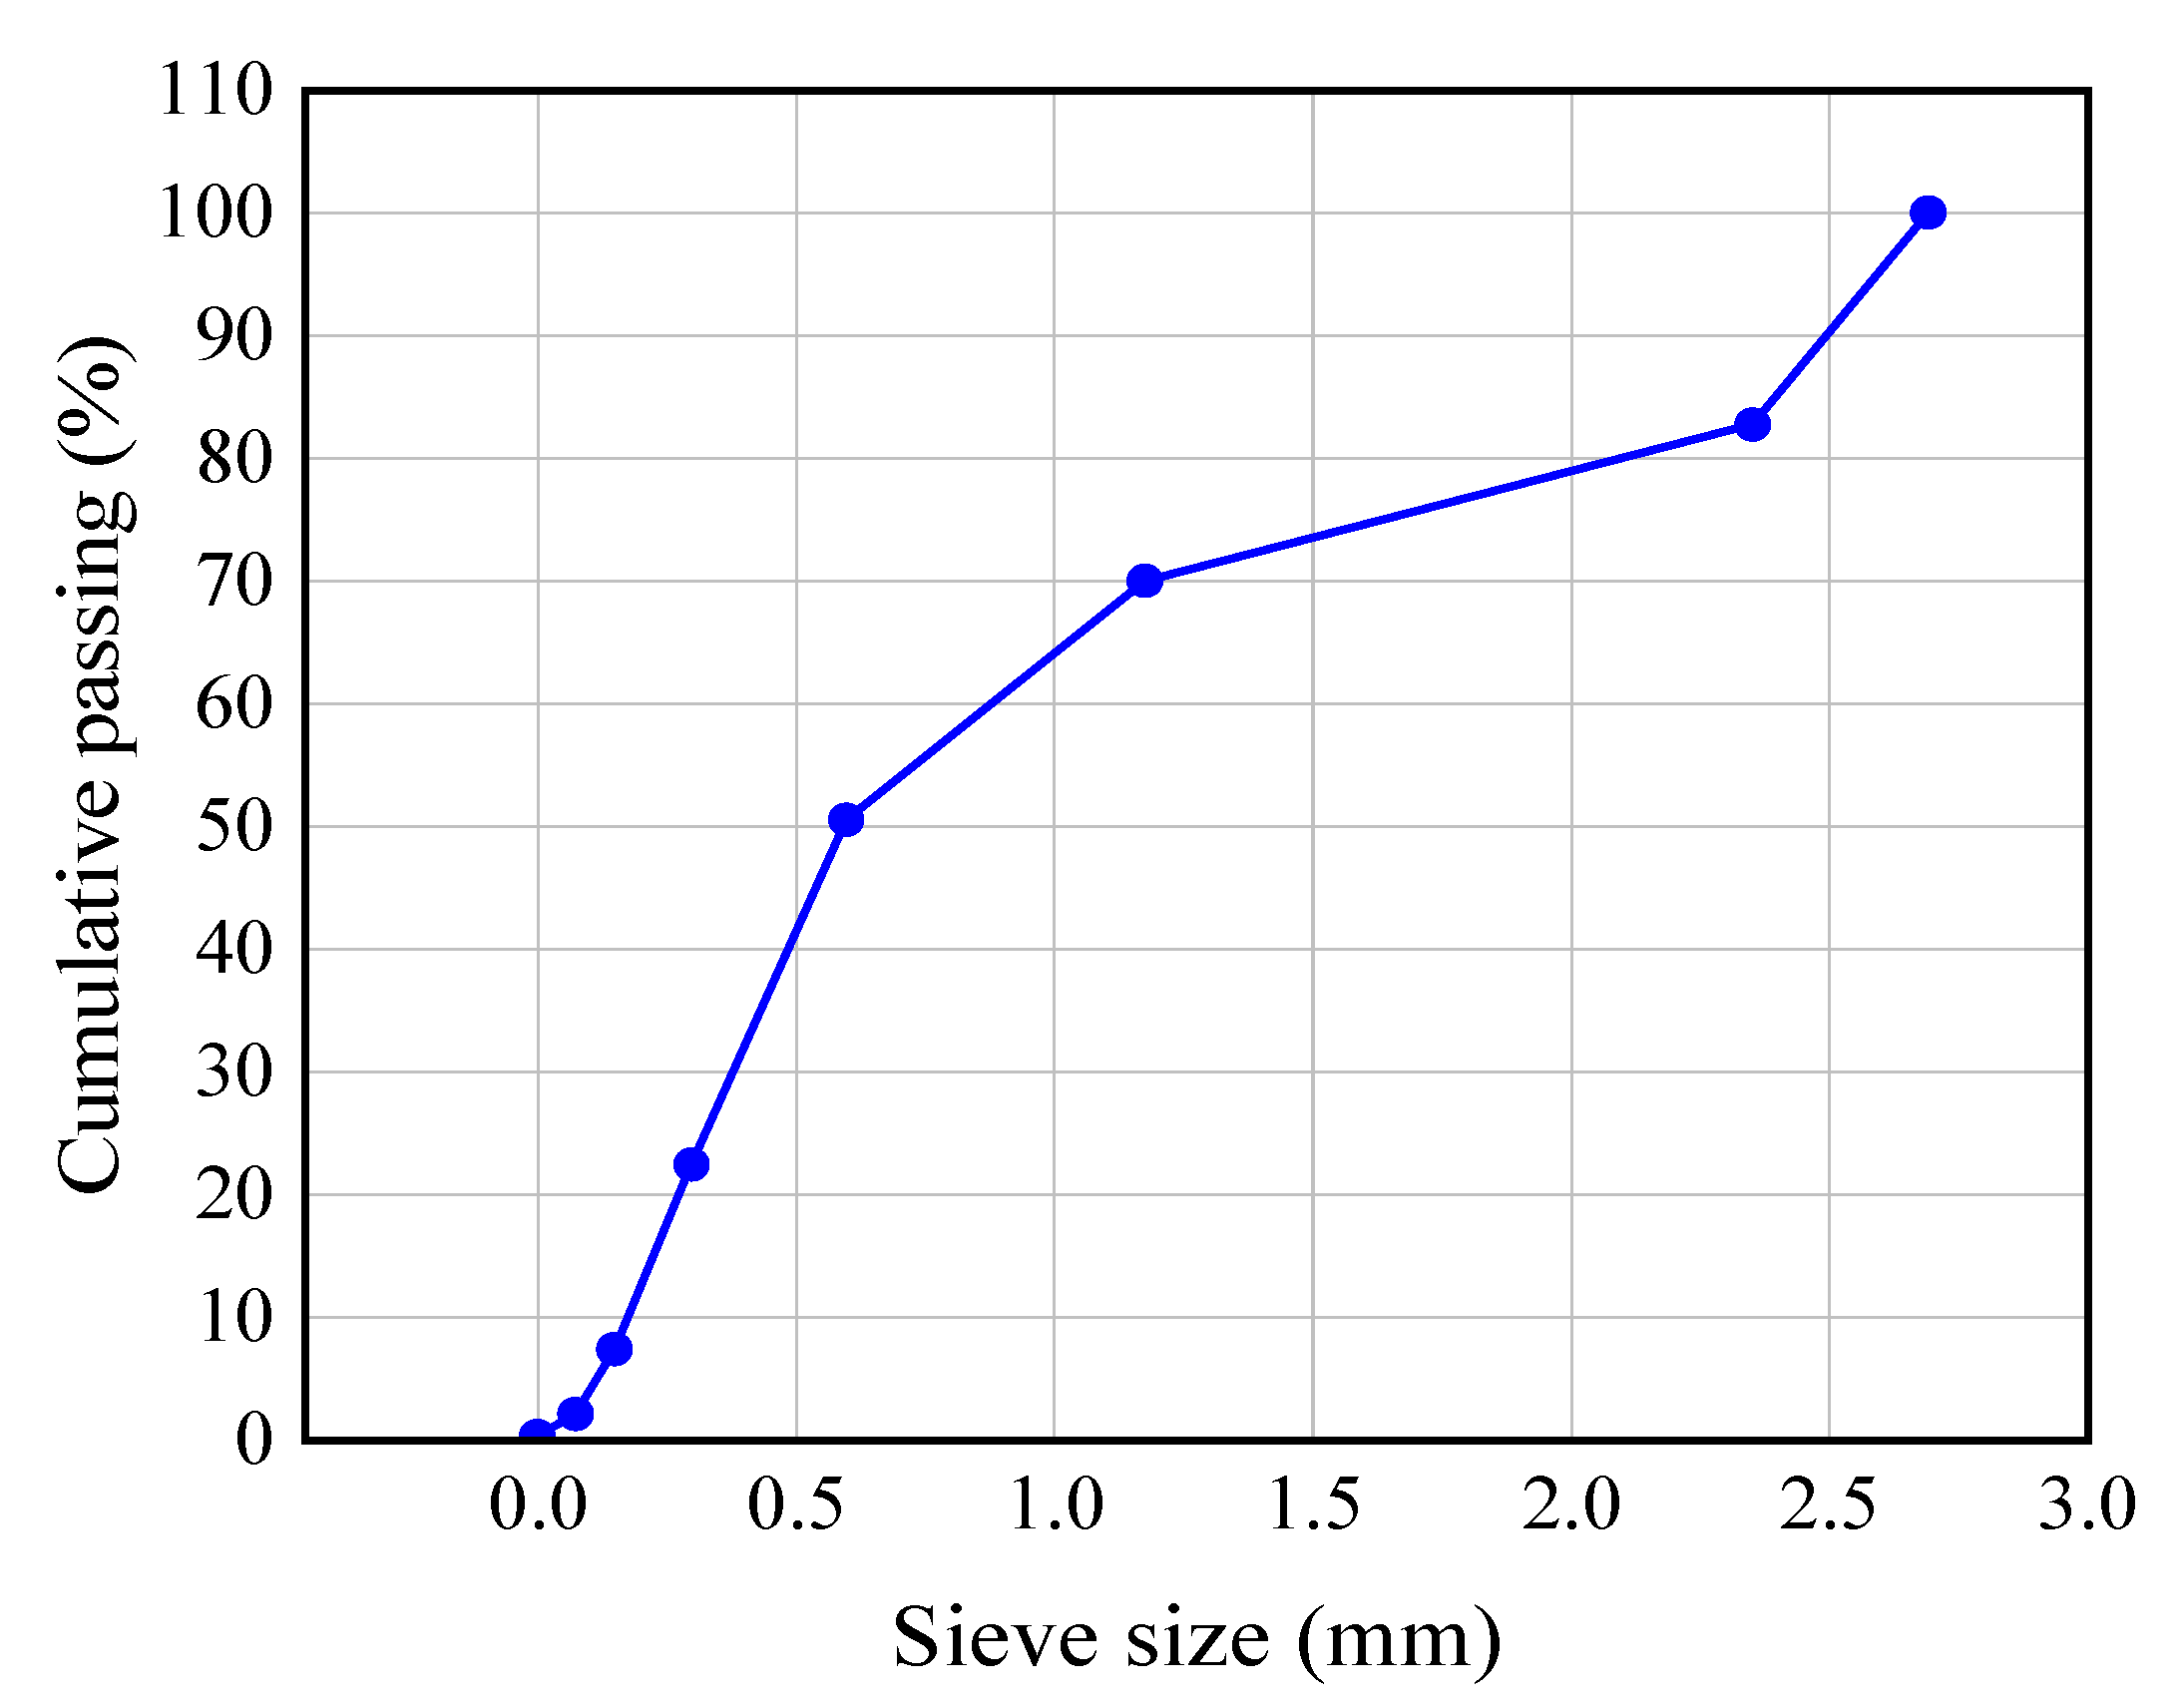
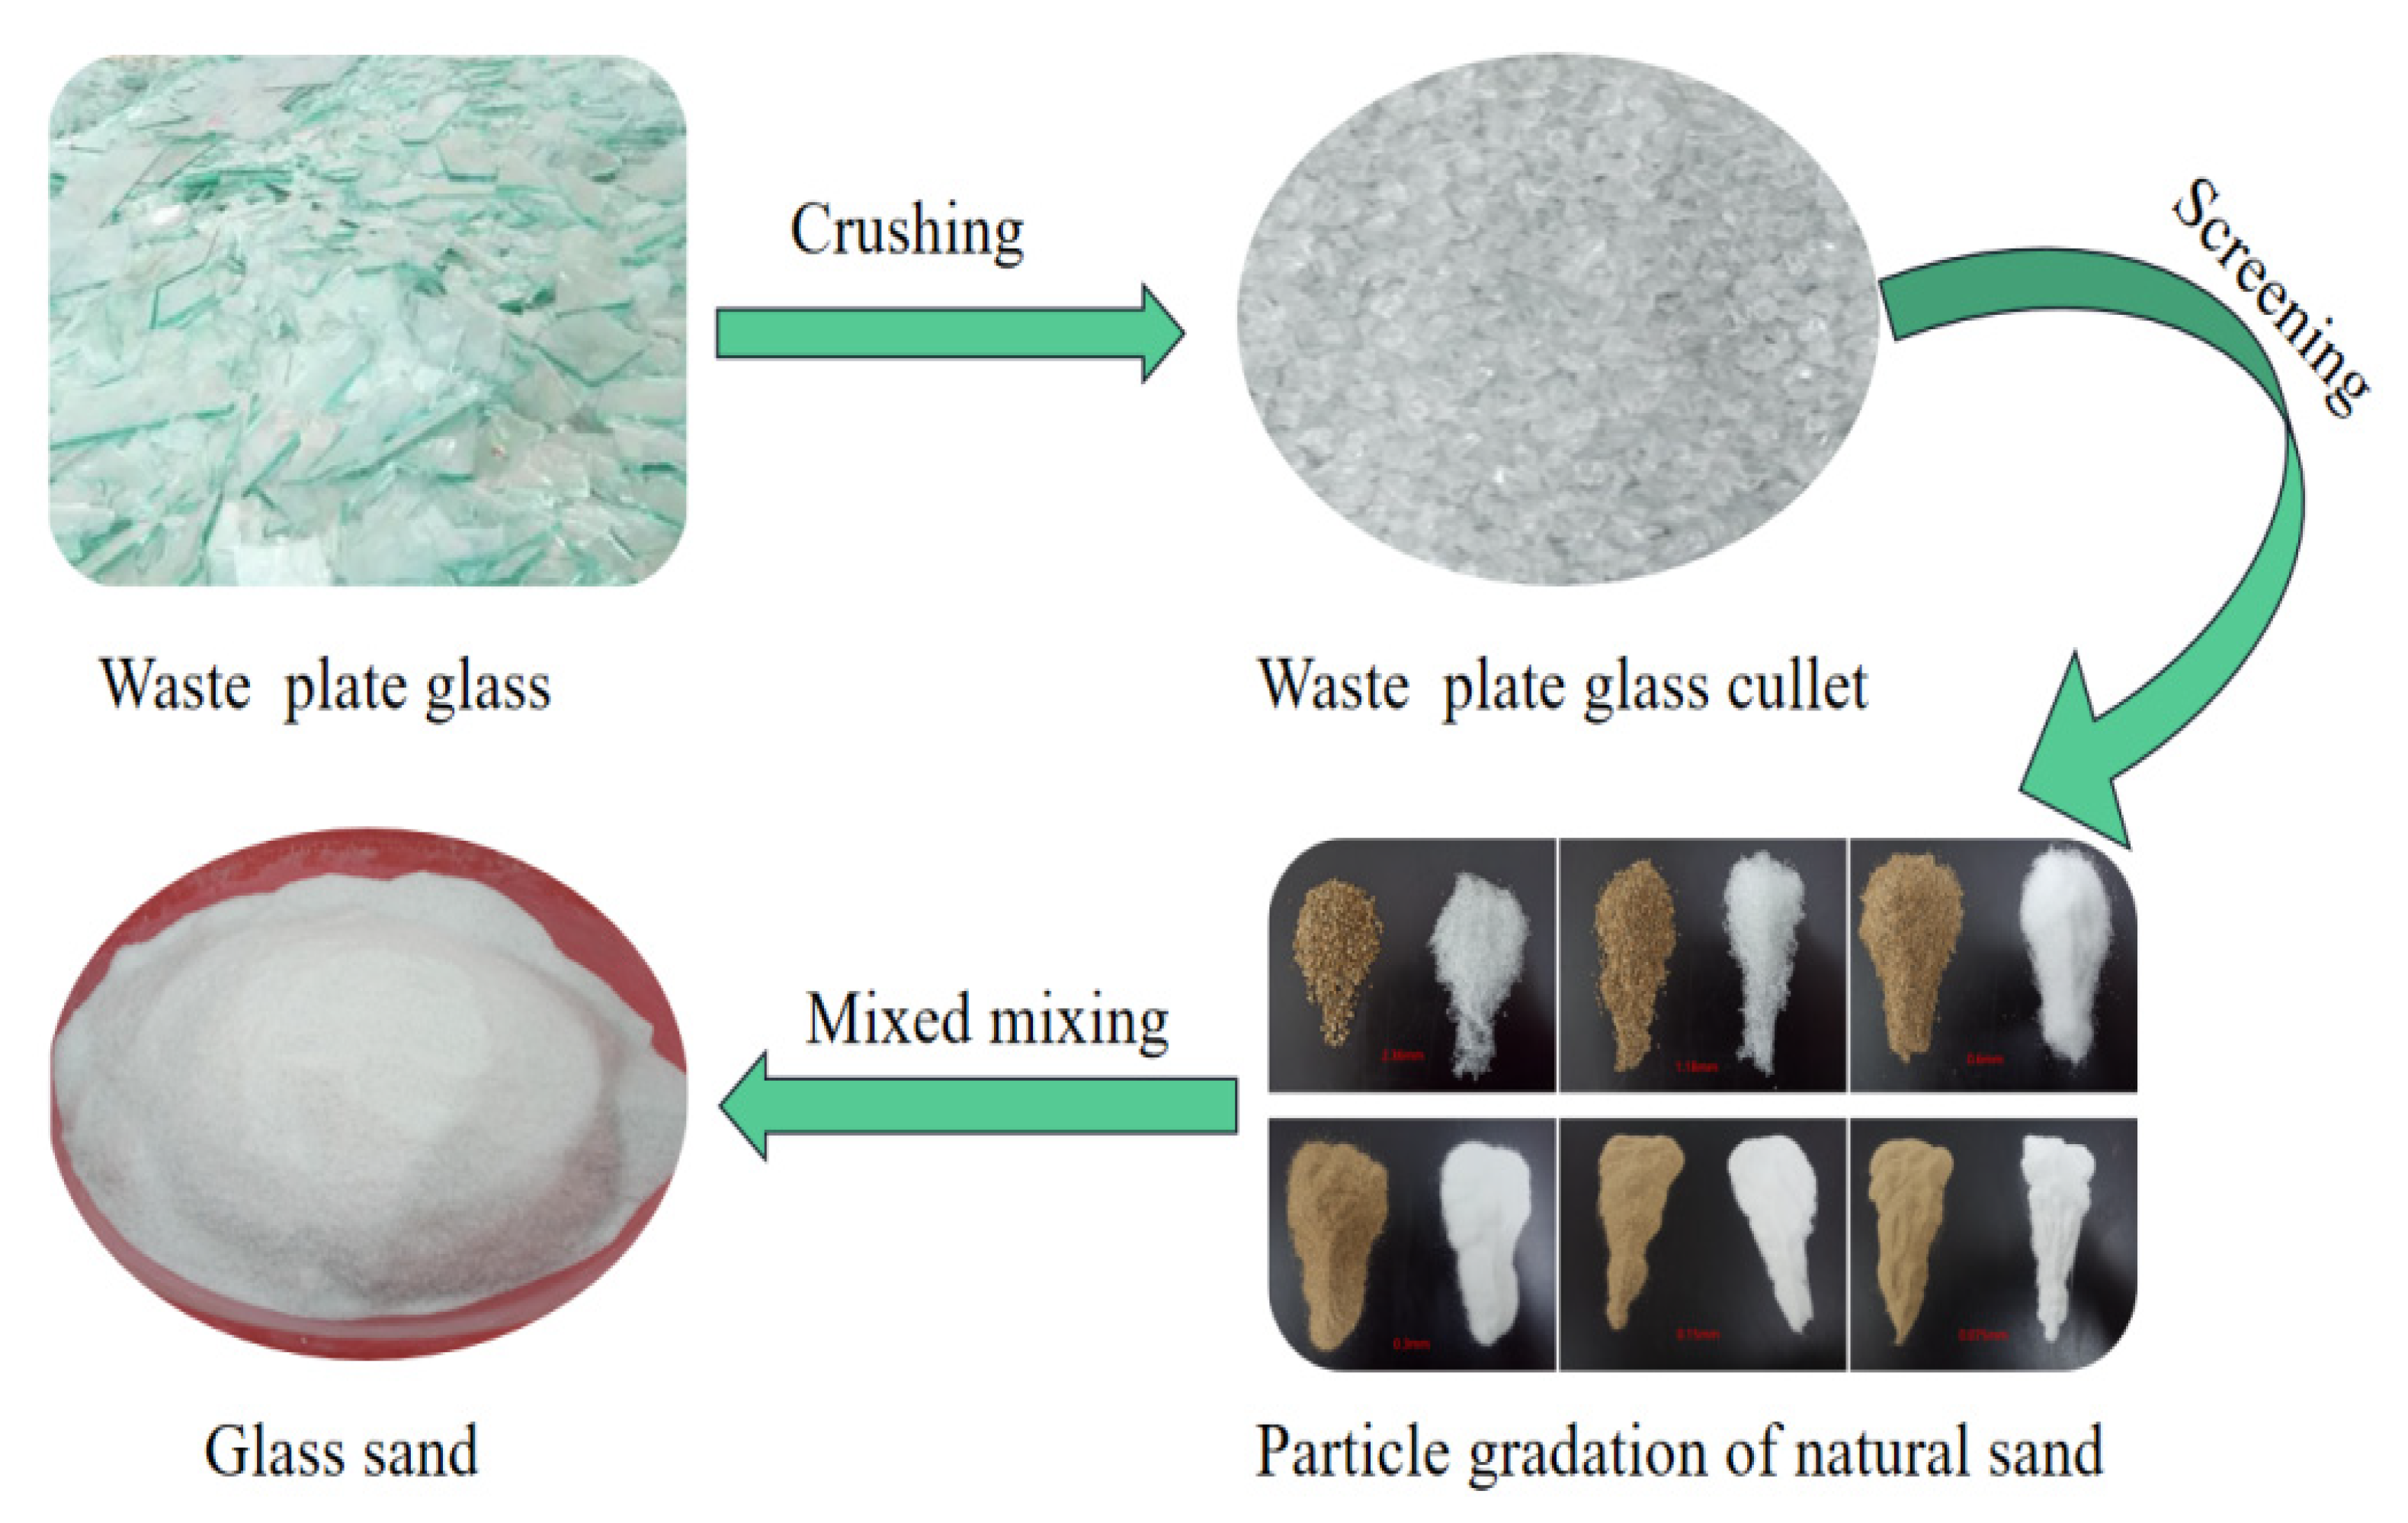
2.1. Raw Materials and Specimen Preparation
2.2. Testing Methods
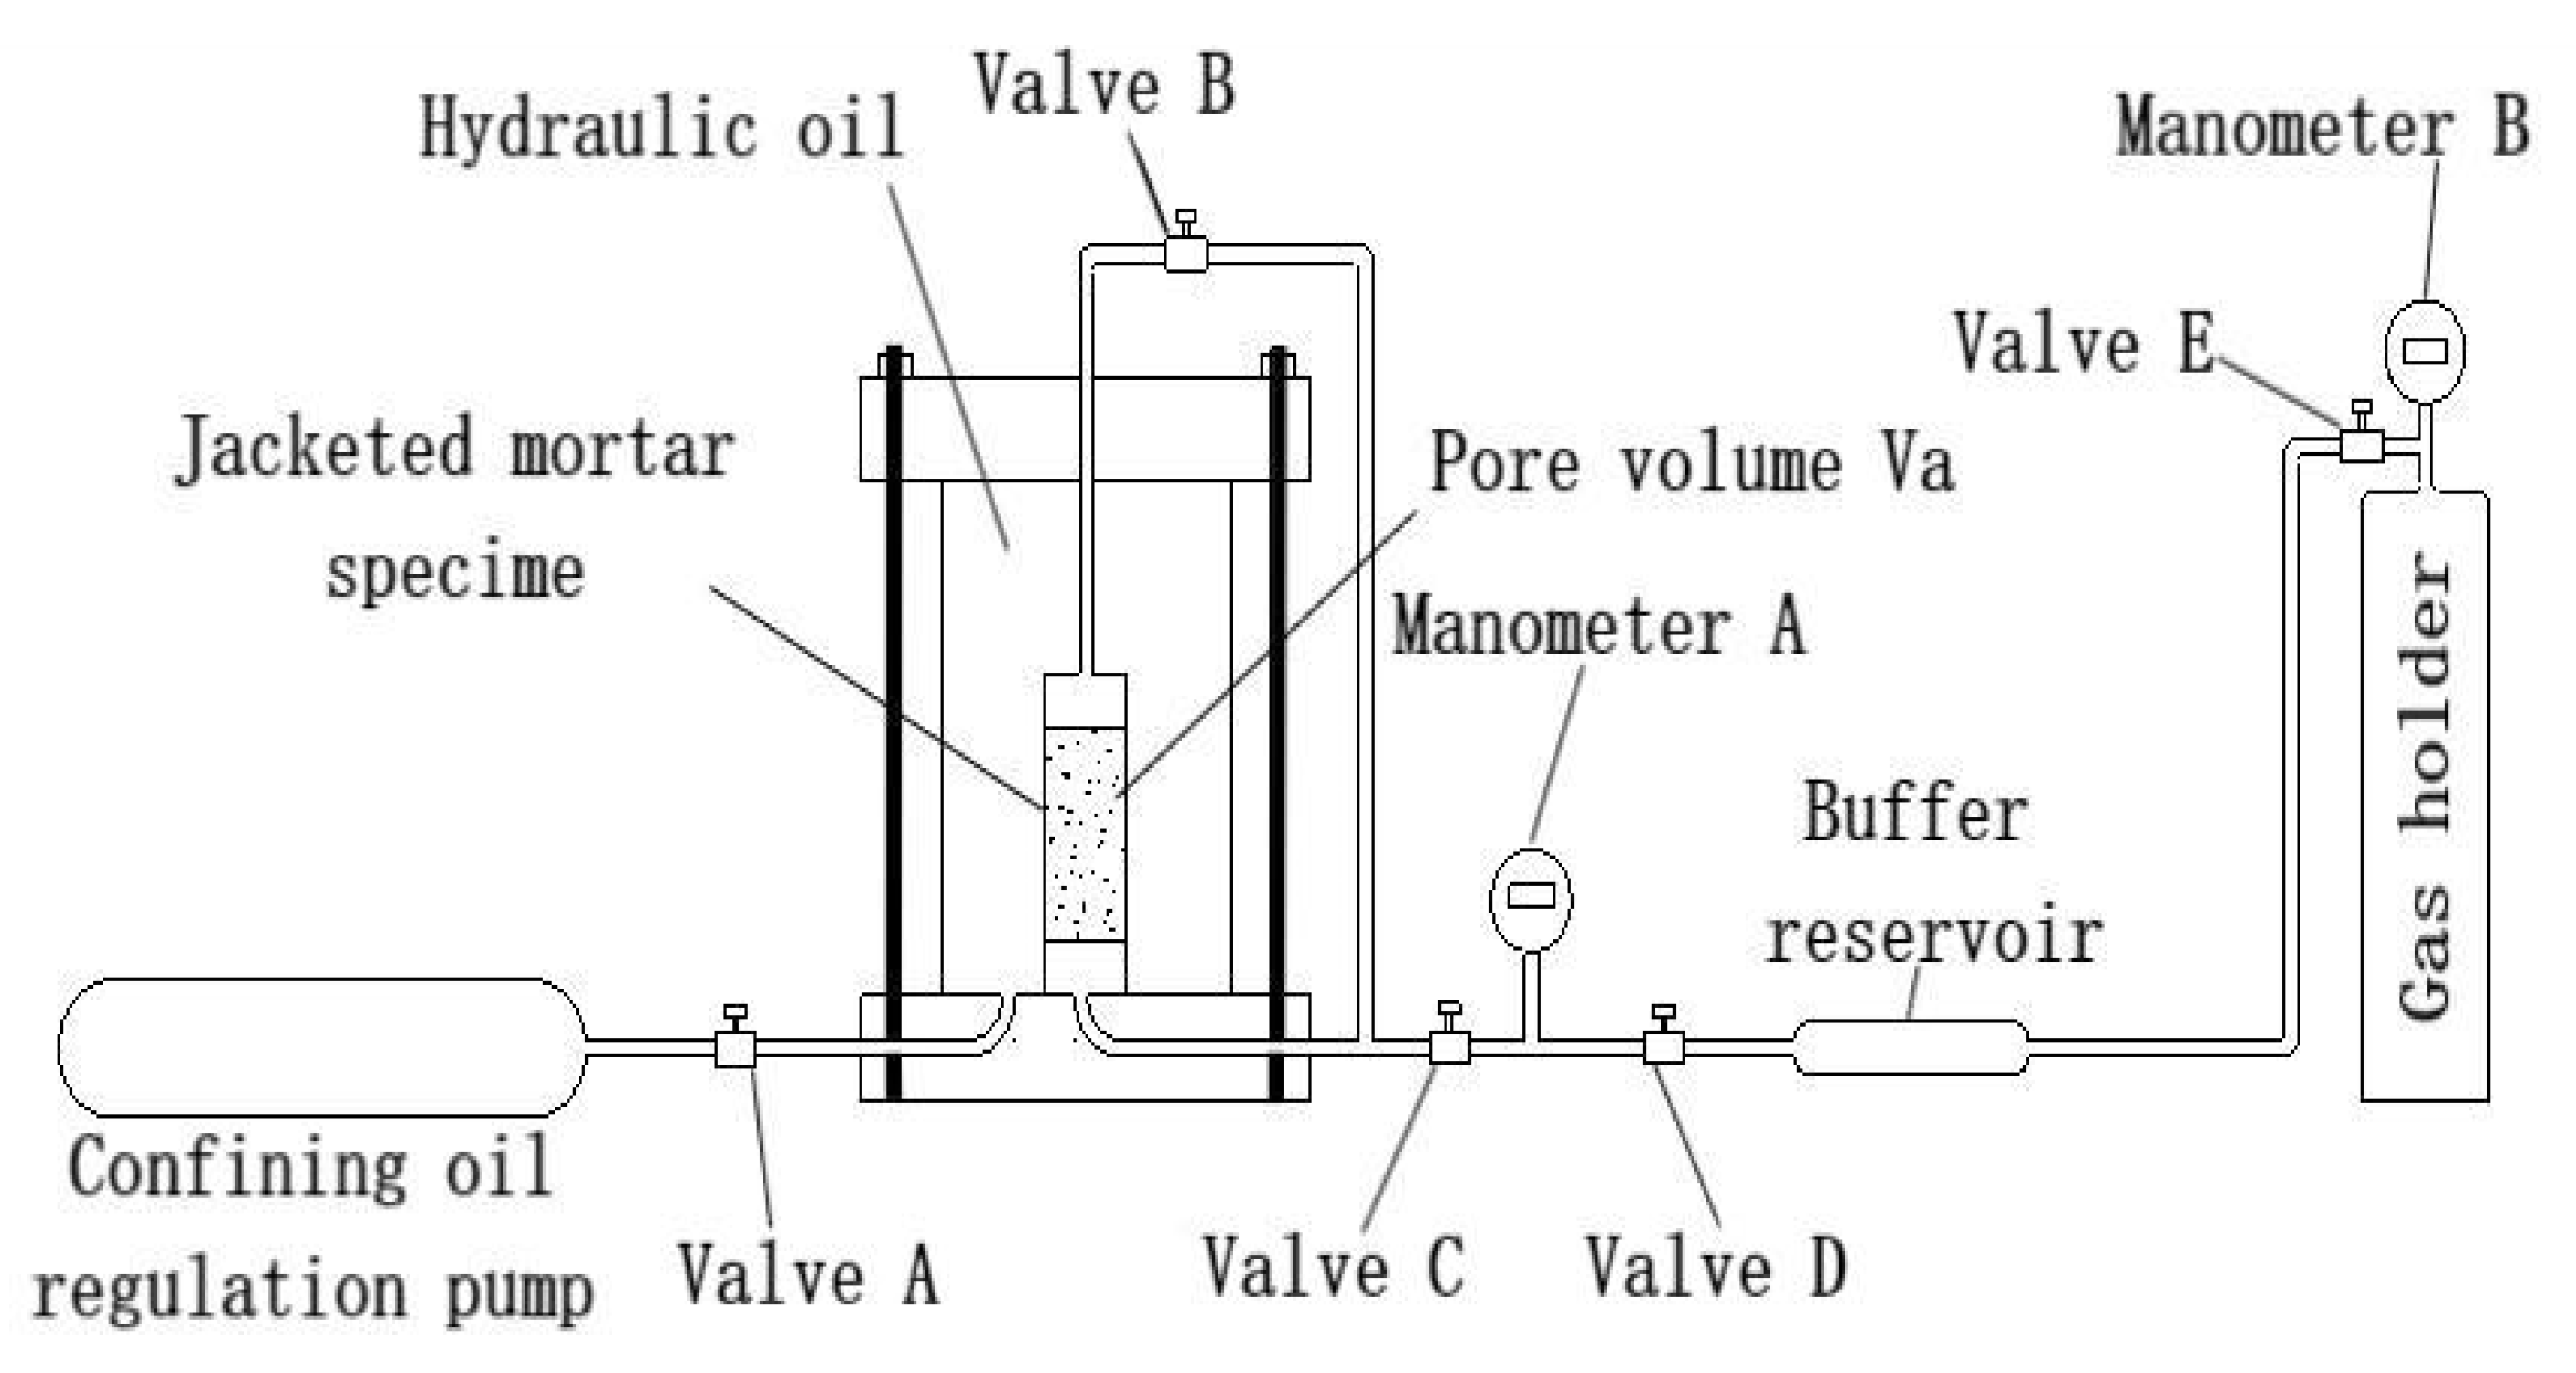
2.2.1. Gas Permeability Test
2.2.2. Compressive Strength Test
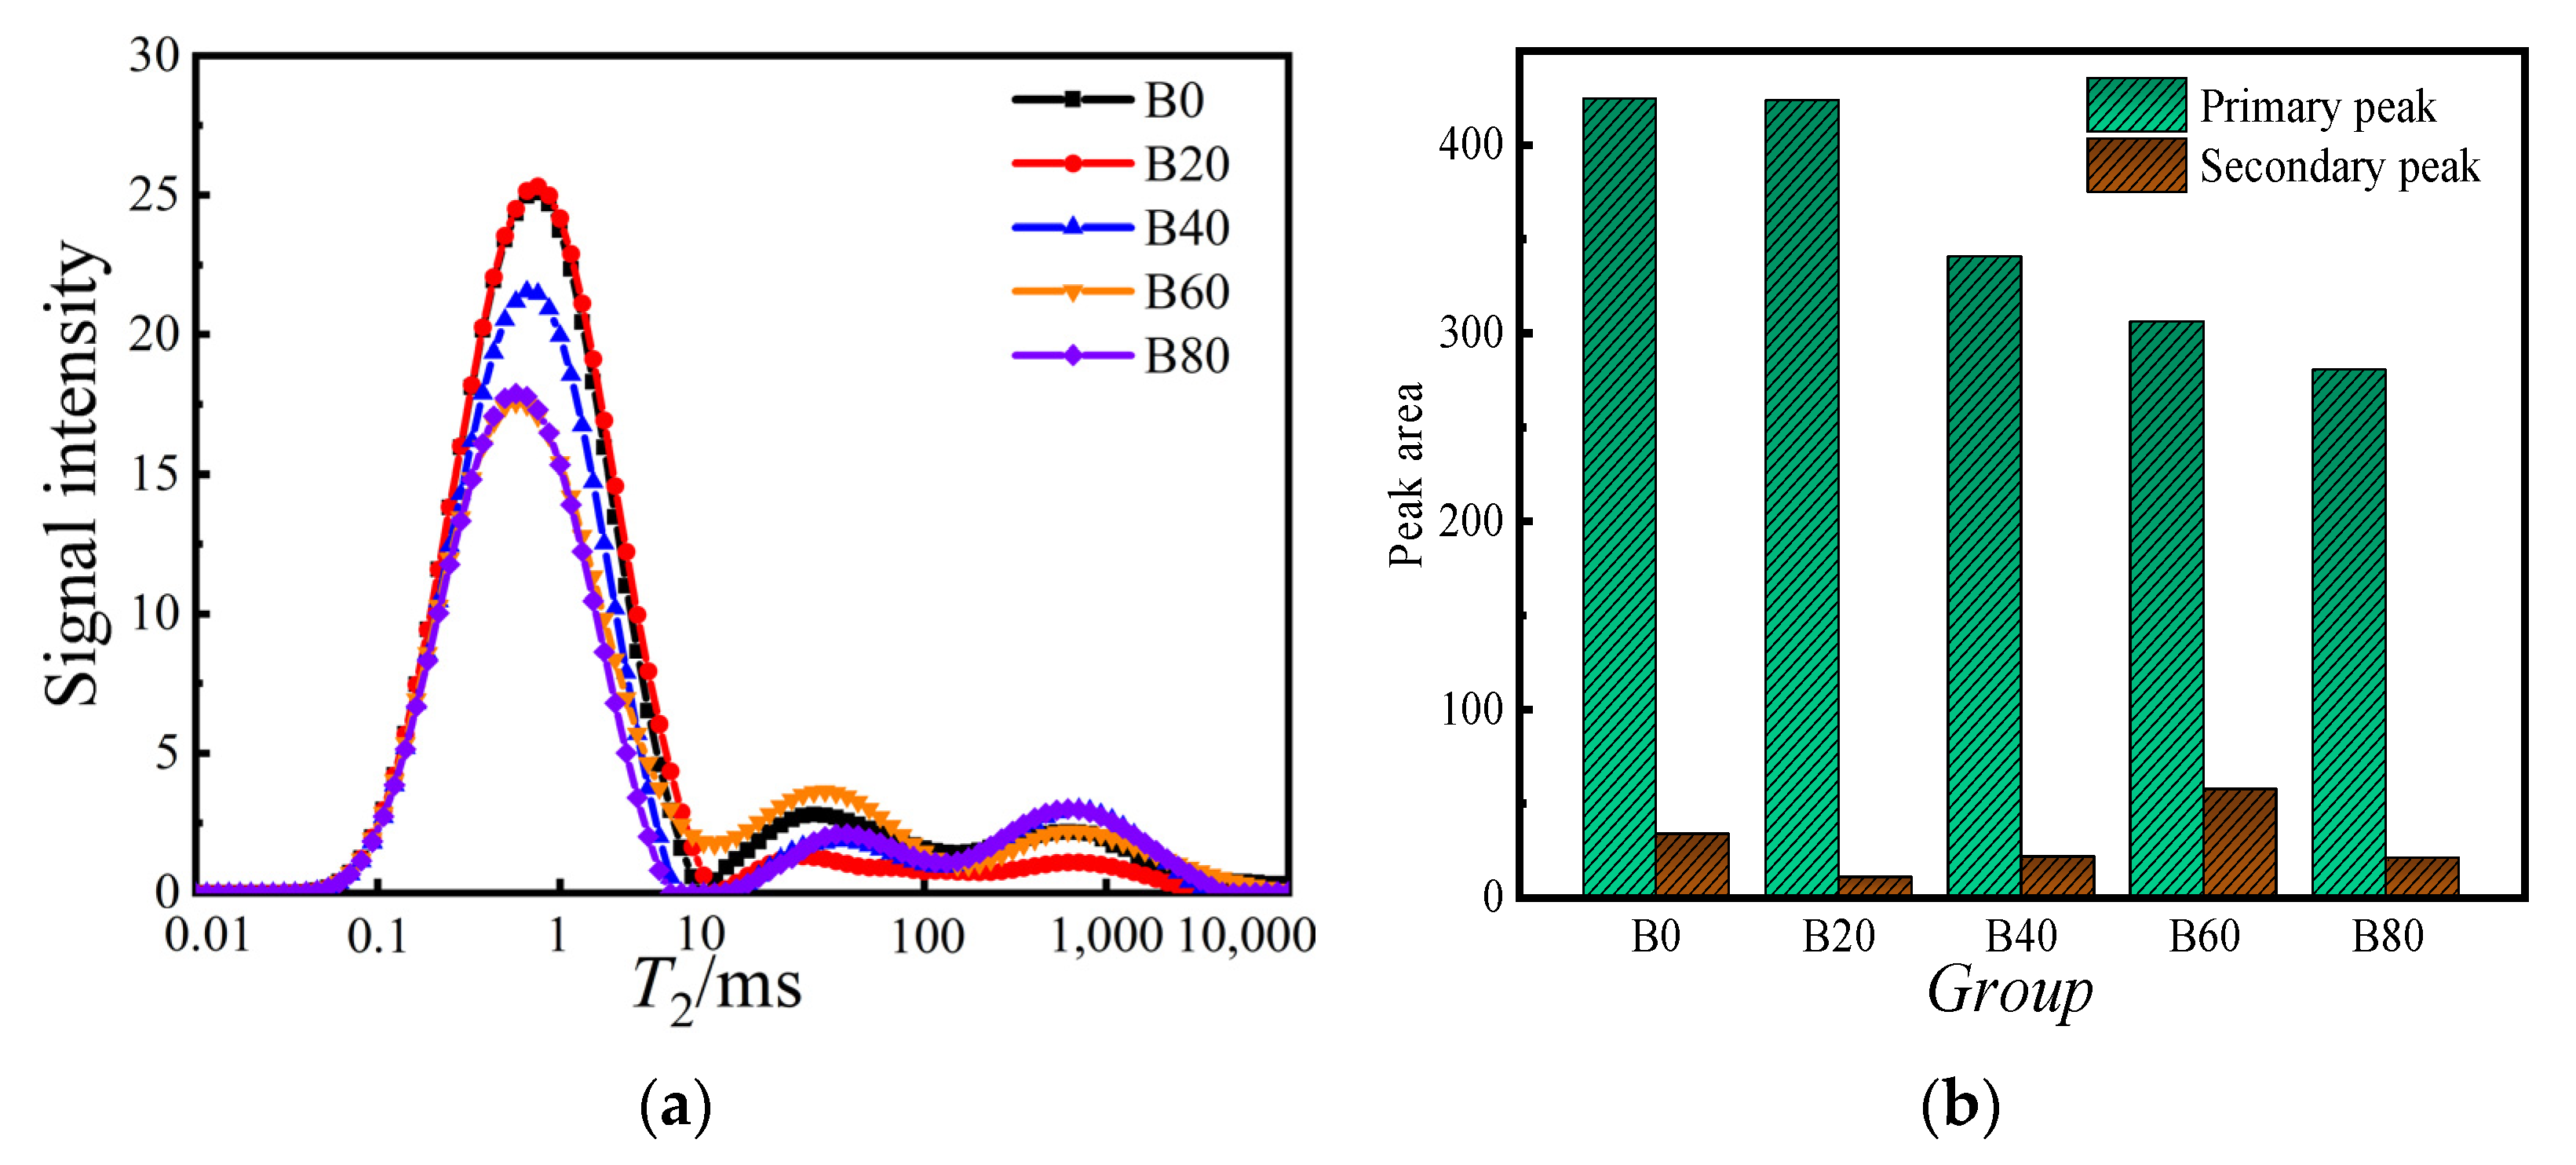
2.2.3. Nuclear Magnetic Resonance Test
2.2.4. X-ray Diffraction Test
2.2.5. Scanning Electron Microscope Test
3. Results and Discussion
3.1. Gas Permeability
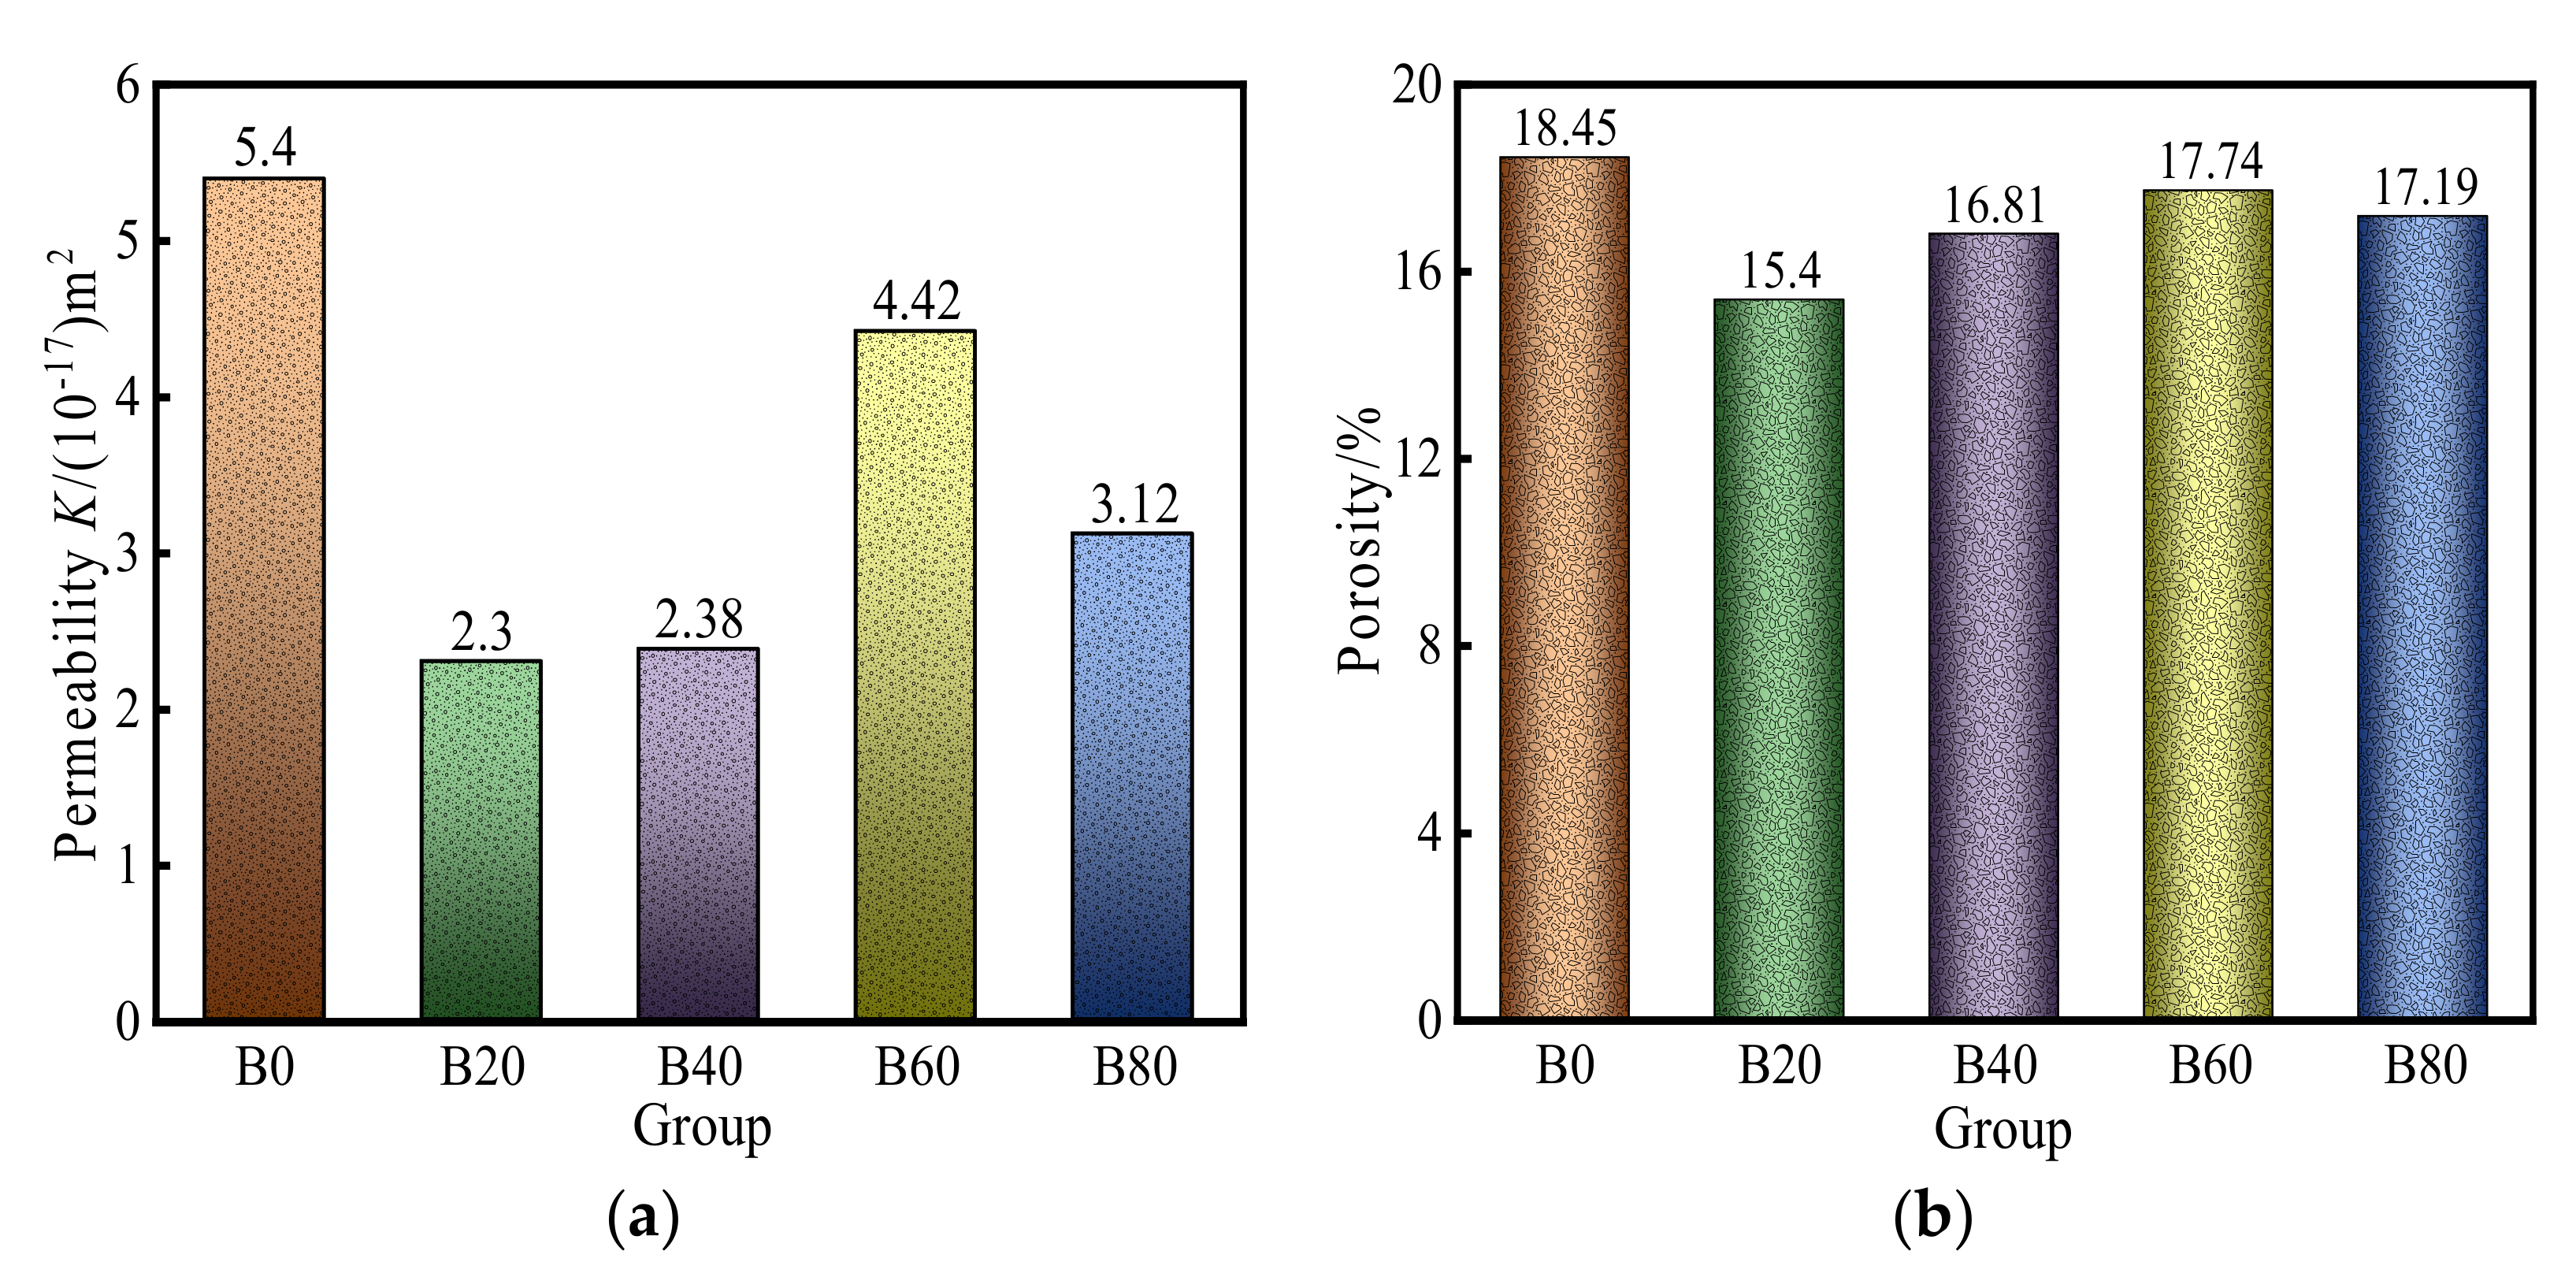
3.1.1. Initial Gas Permeability and Porosity
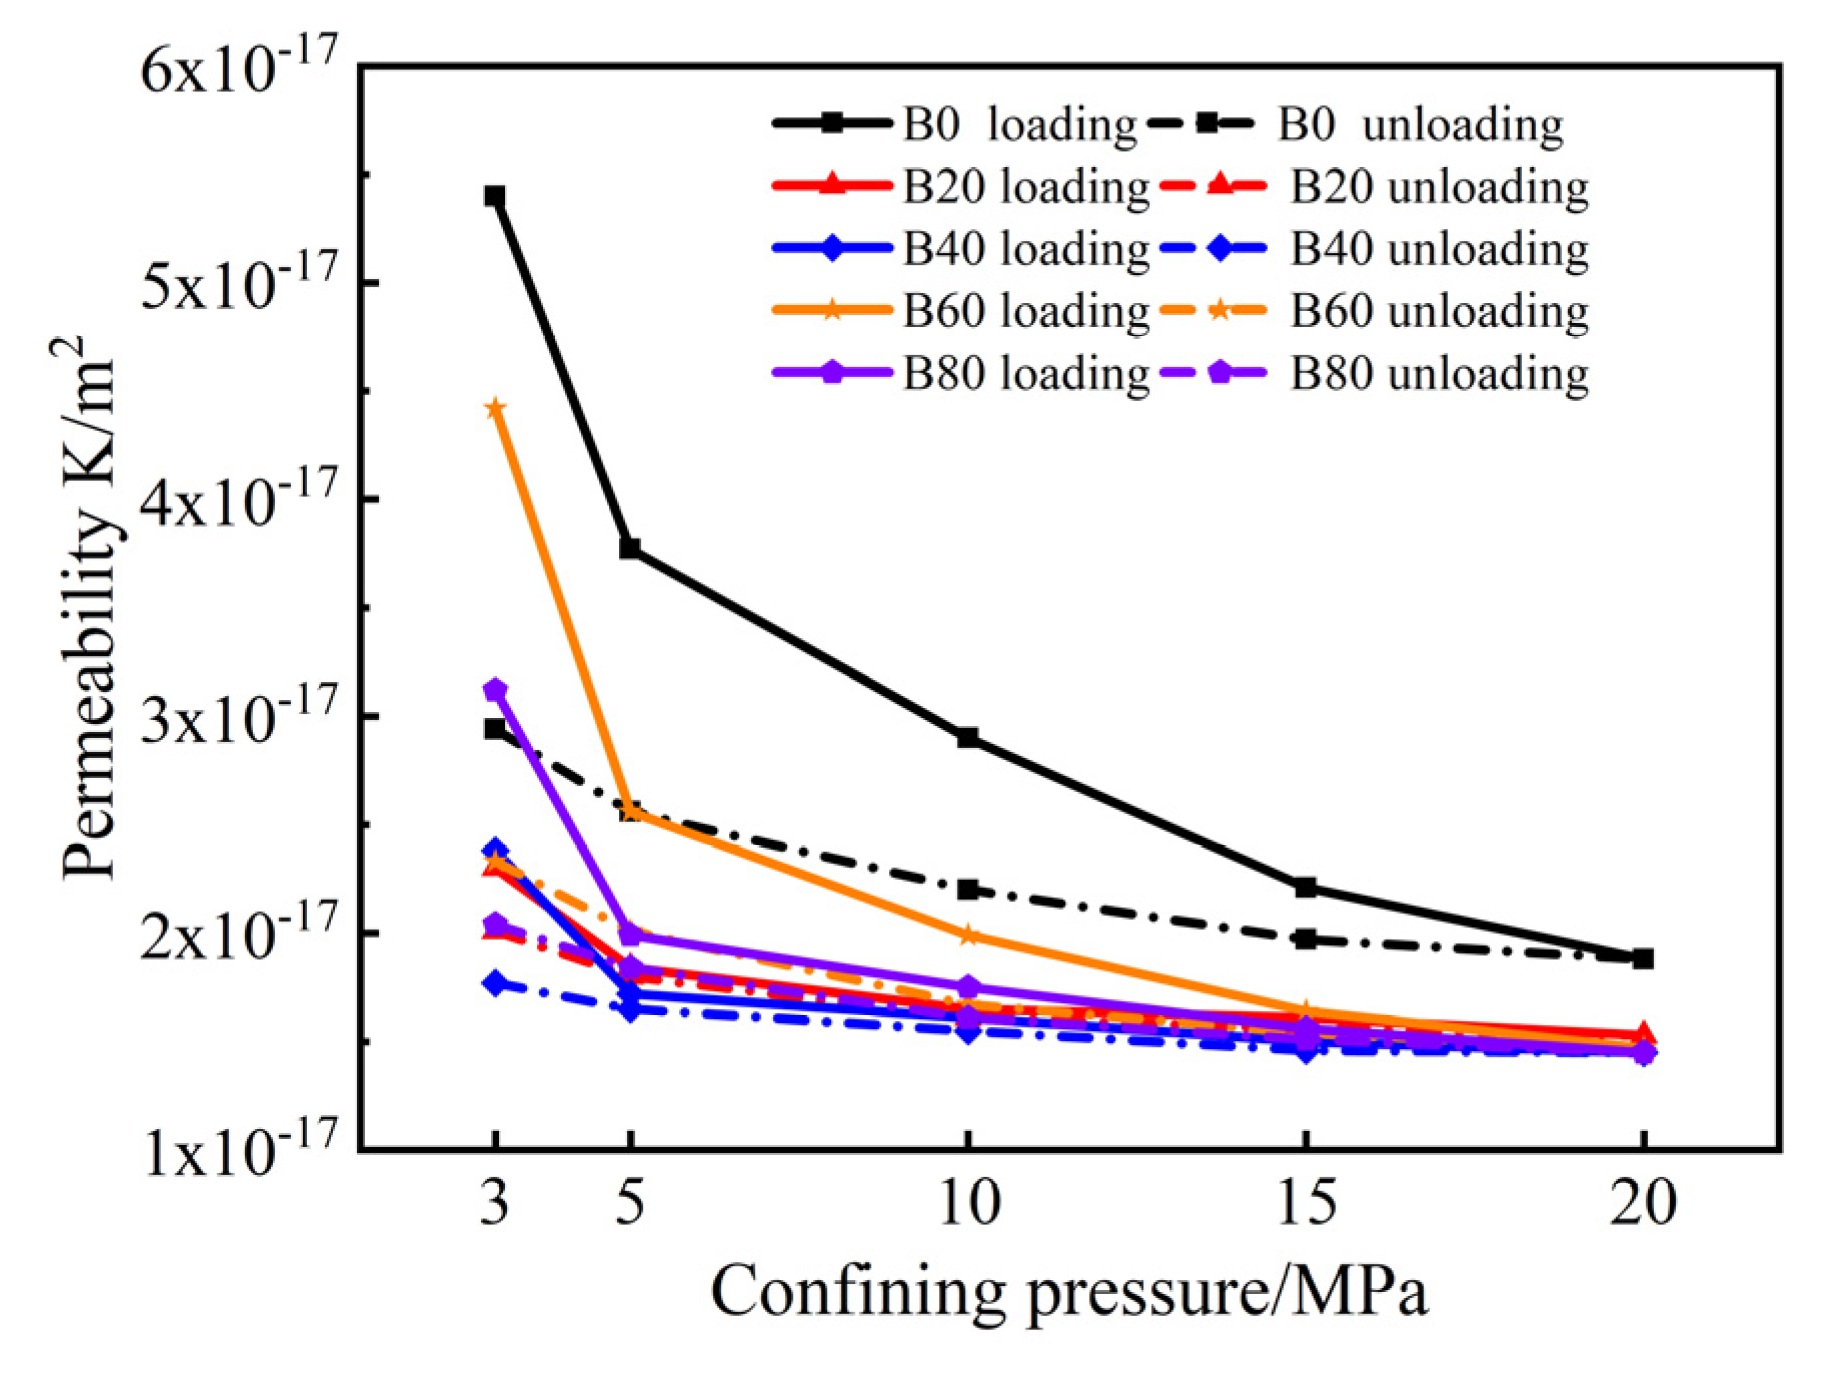
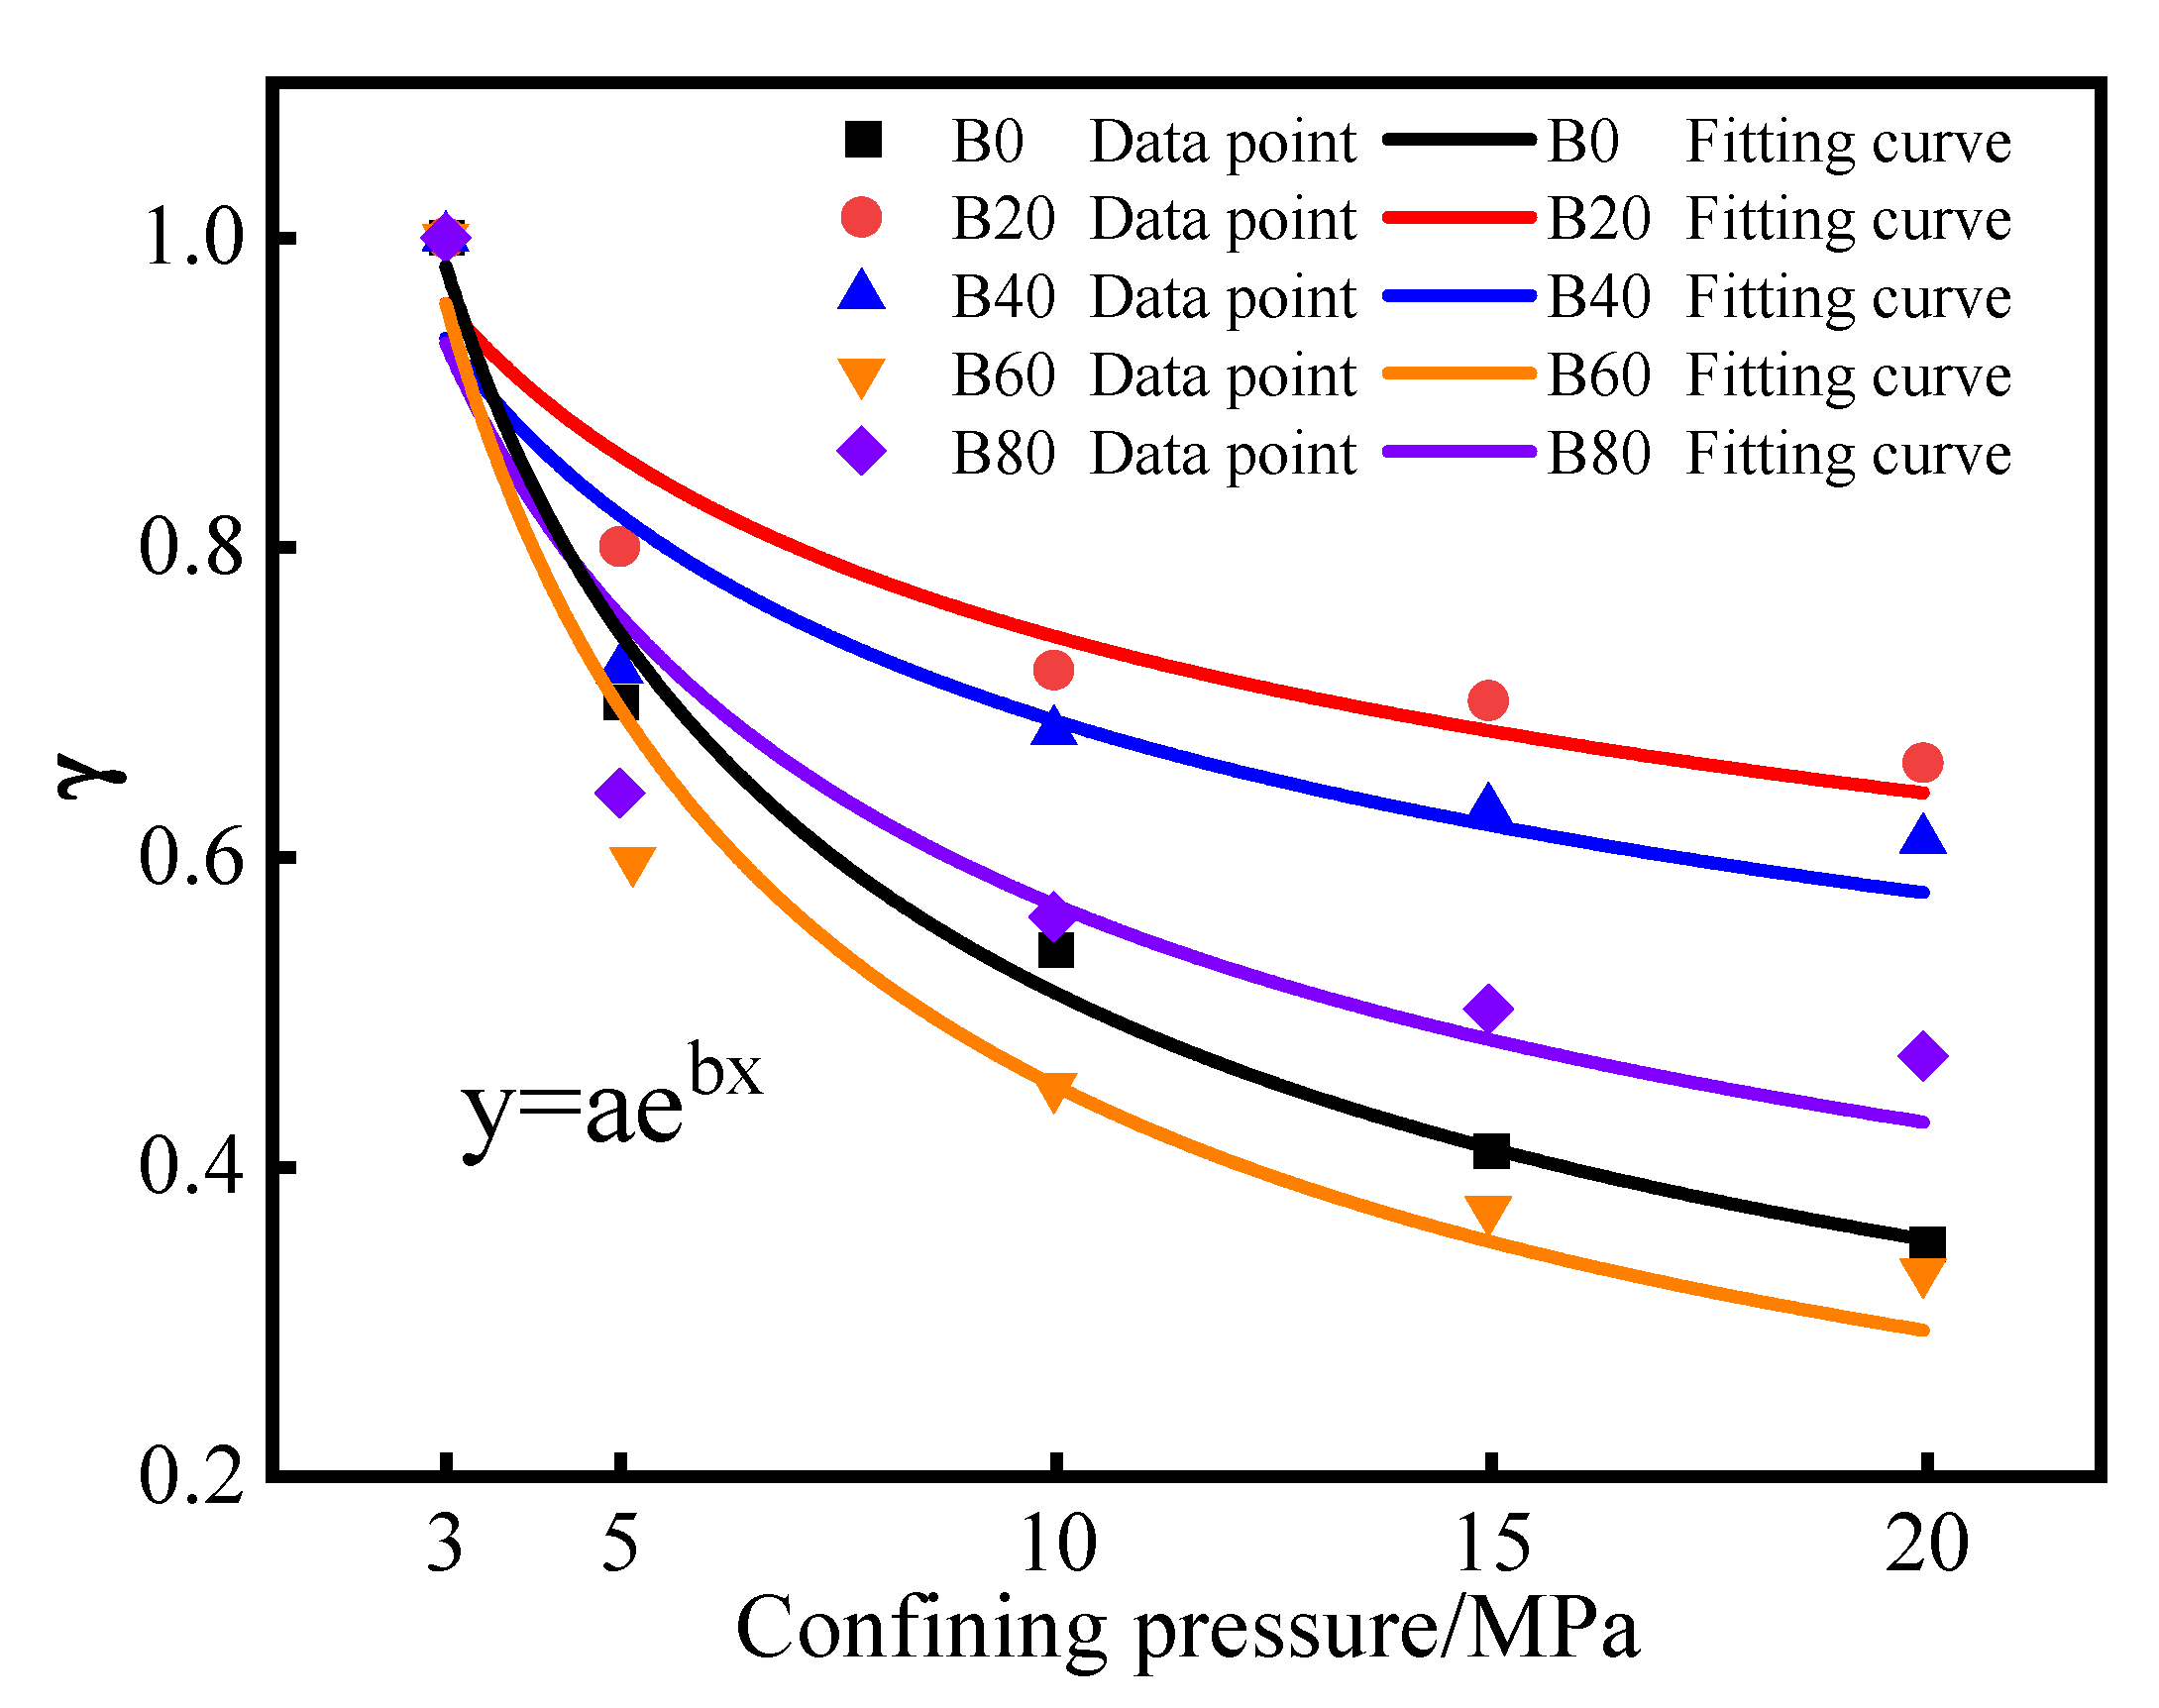
3.1.2. Effect of Confining Pressure on Gas Permeability
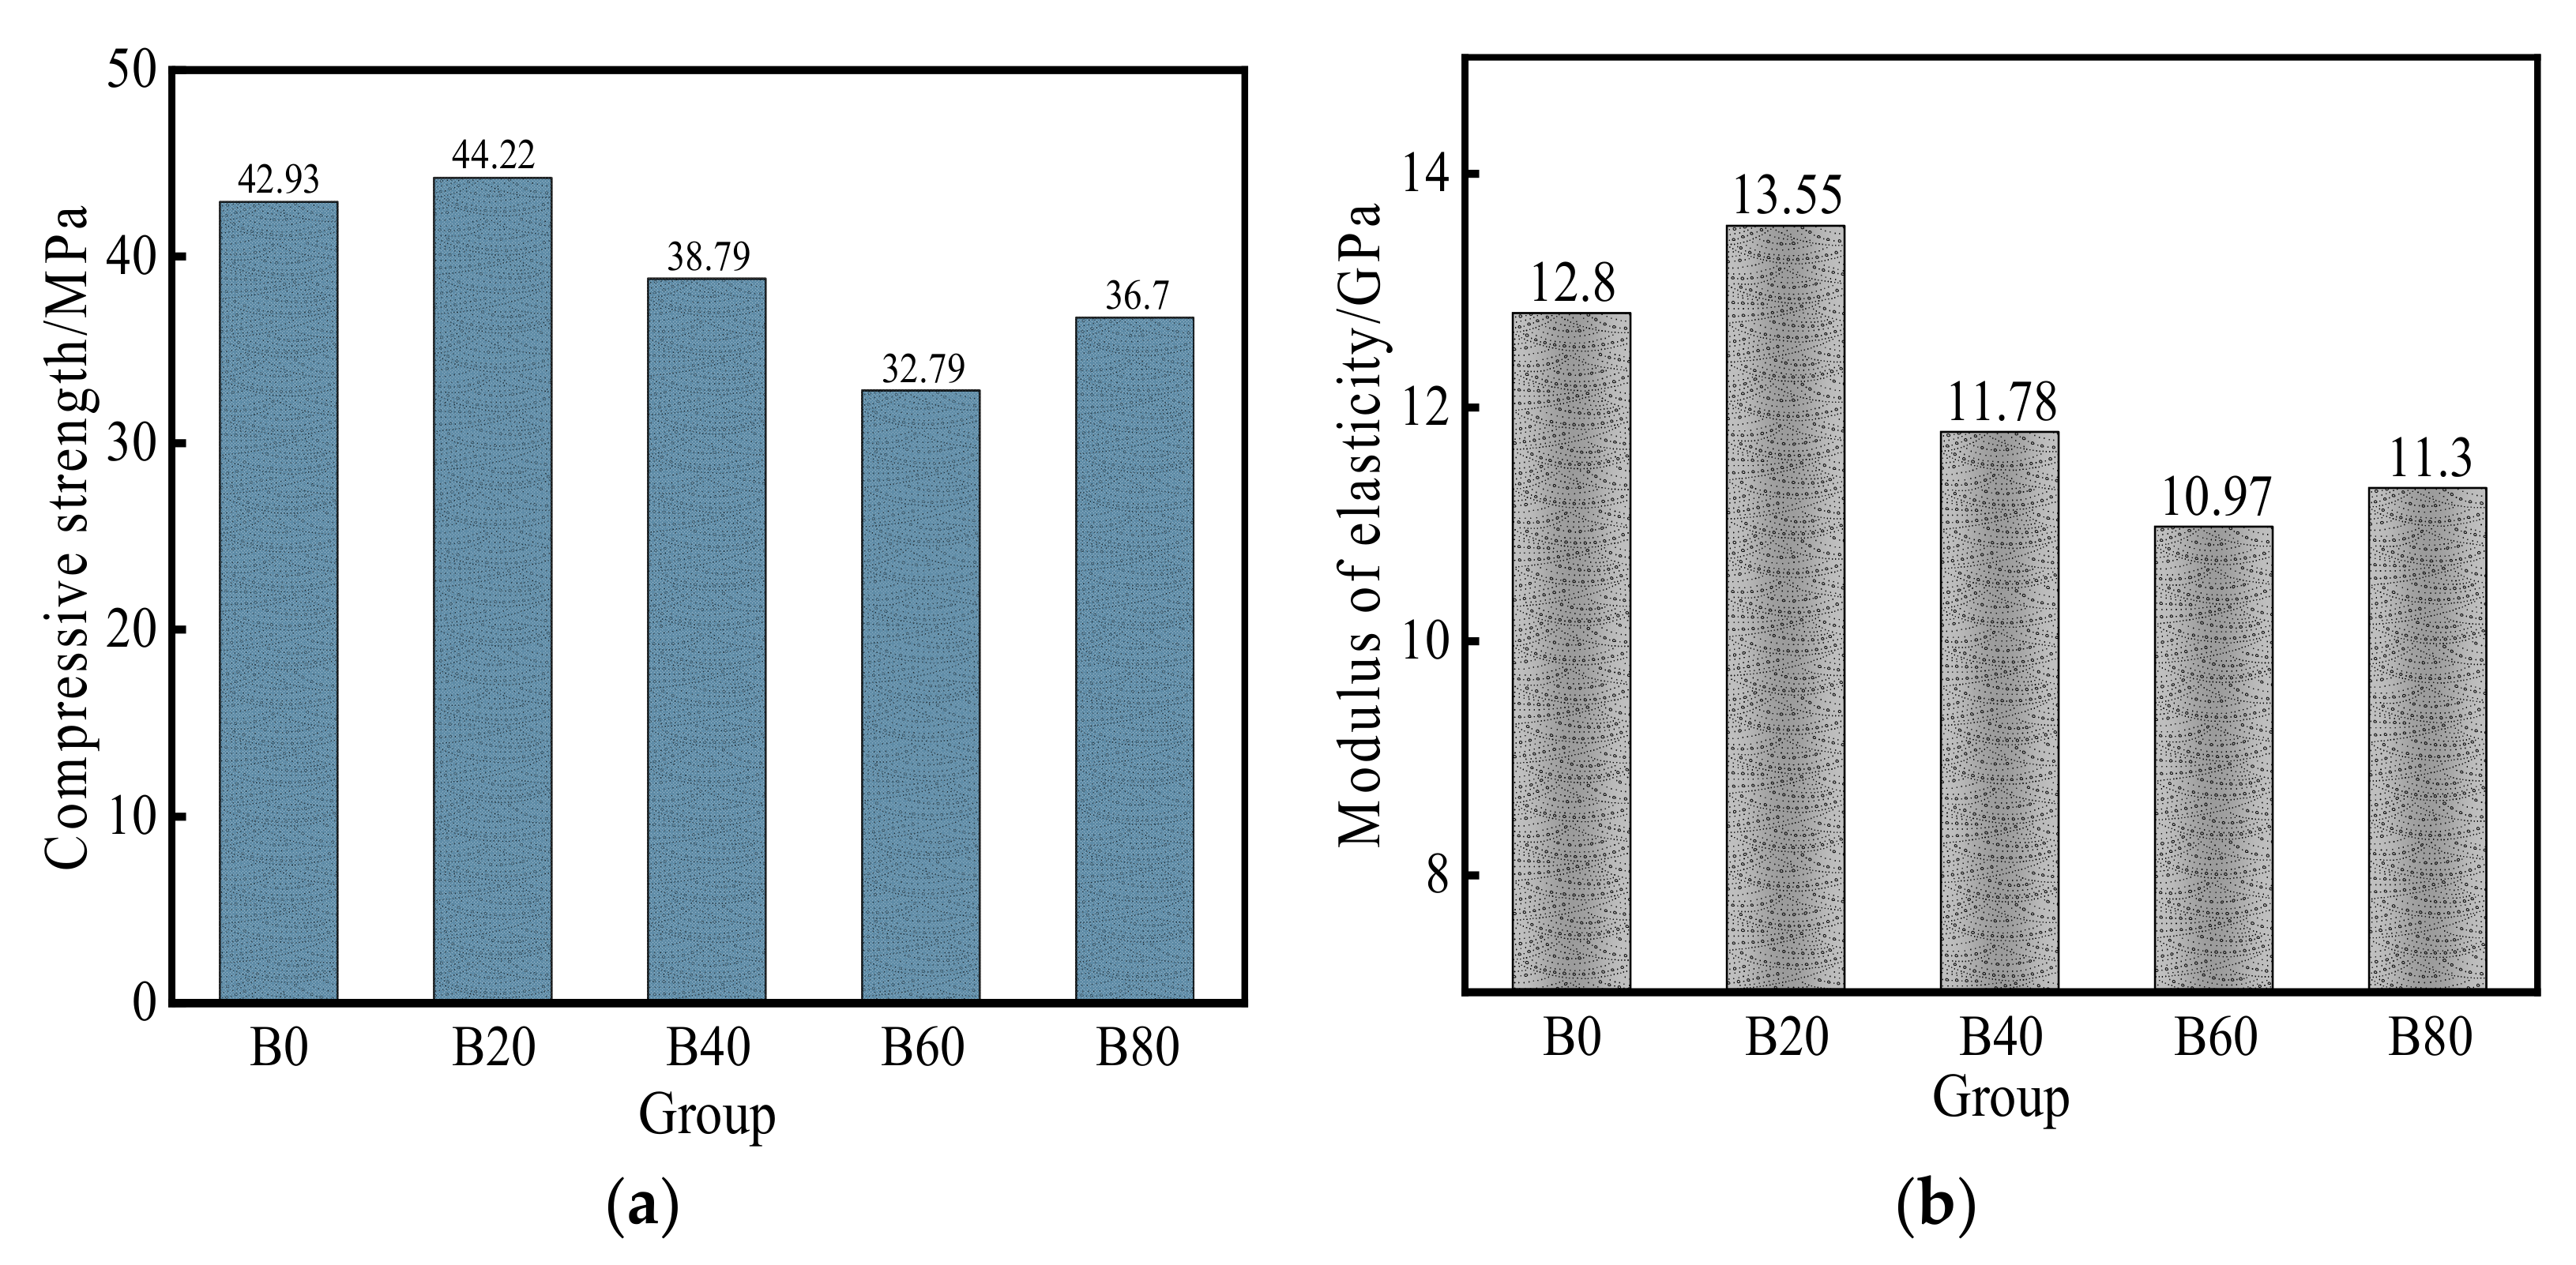
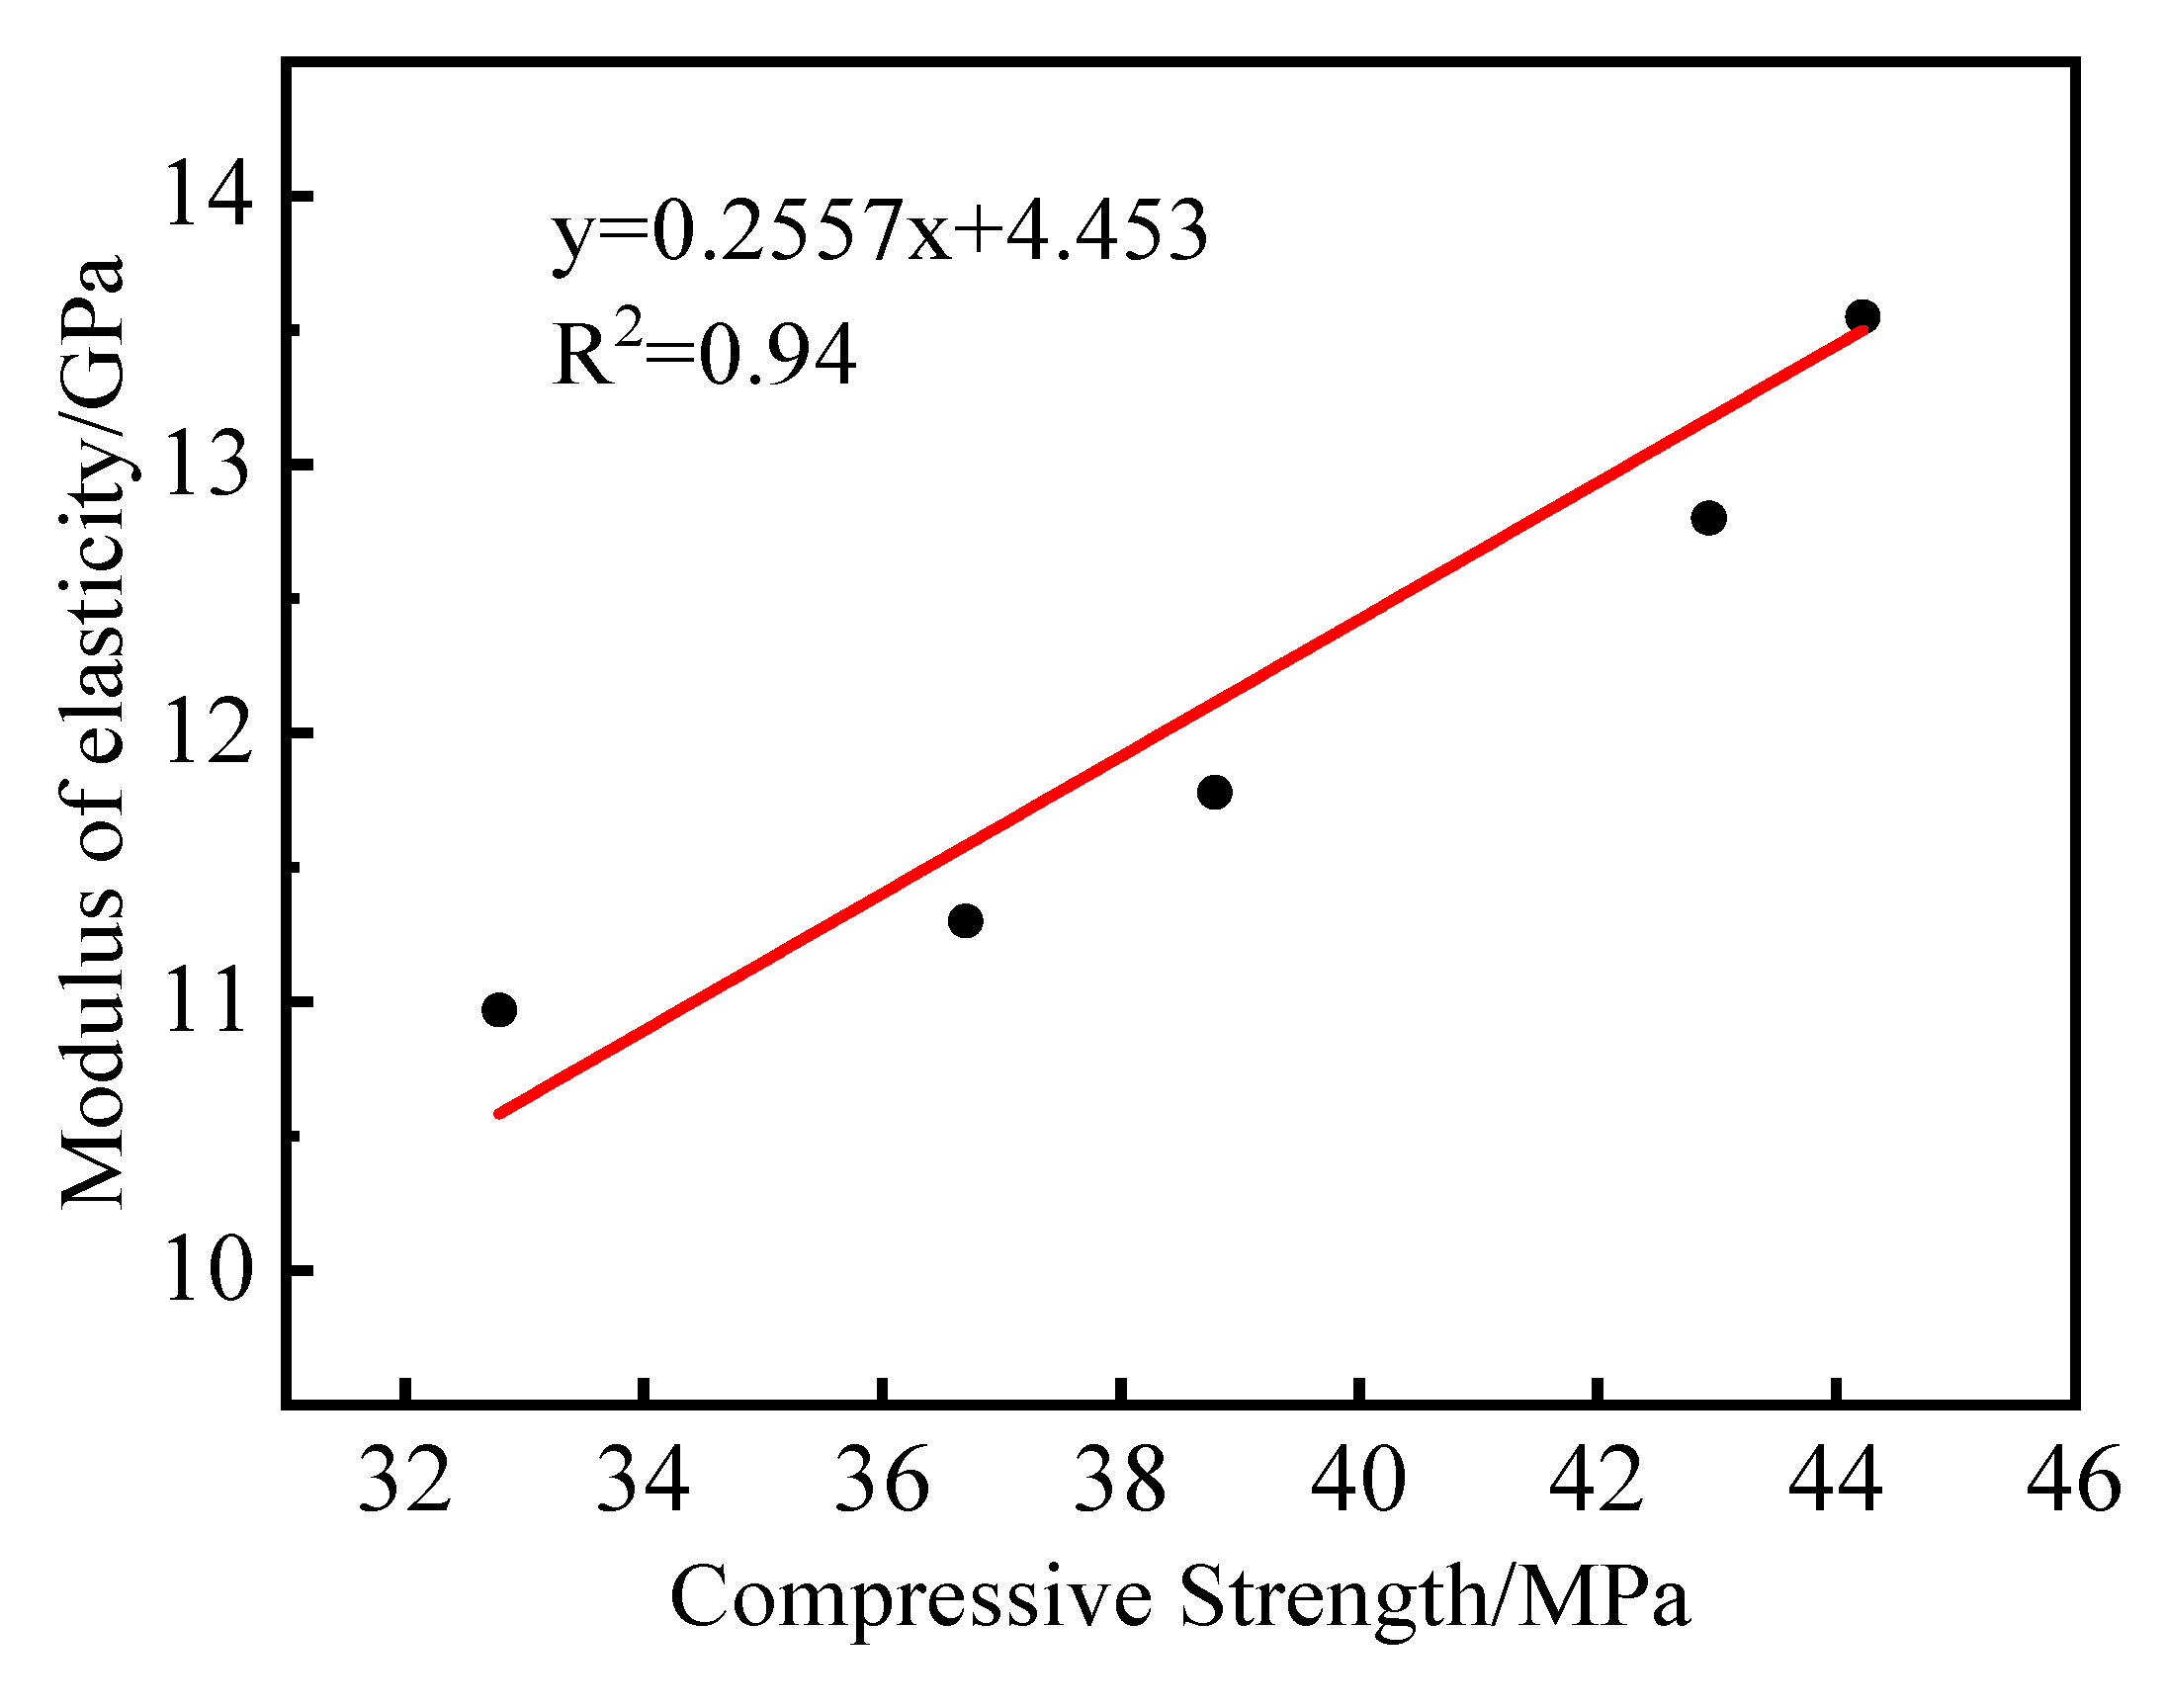
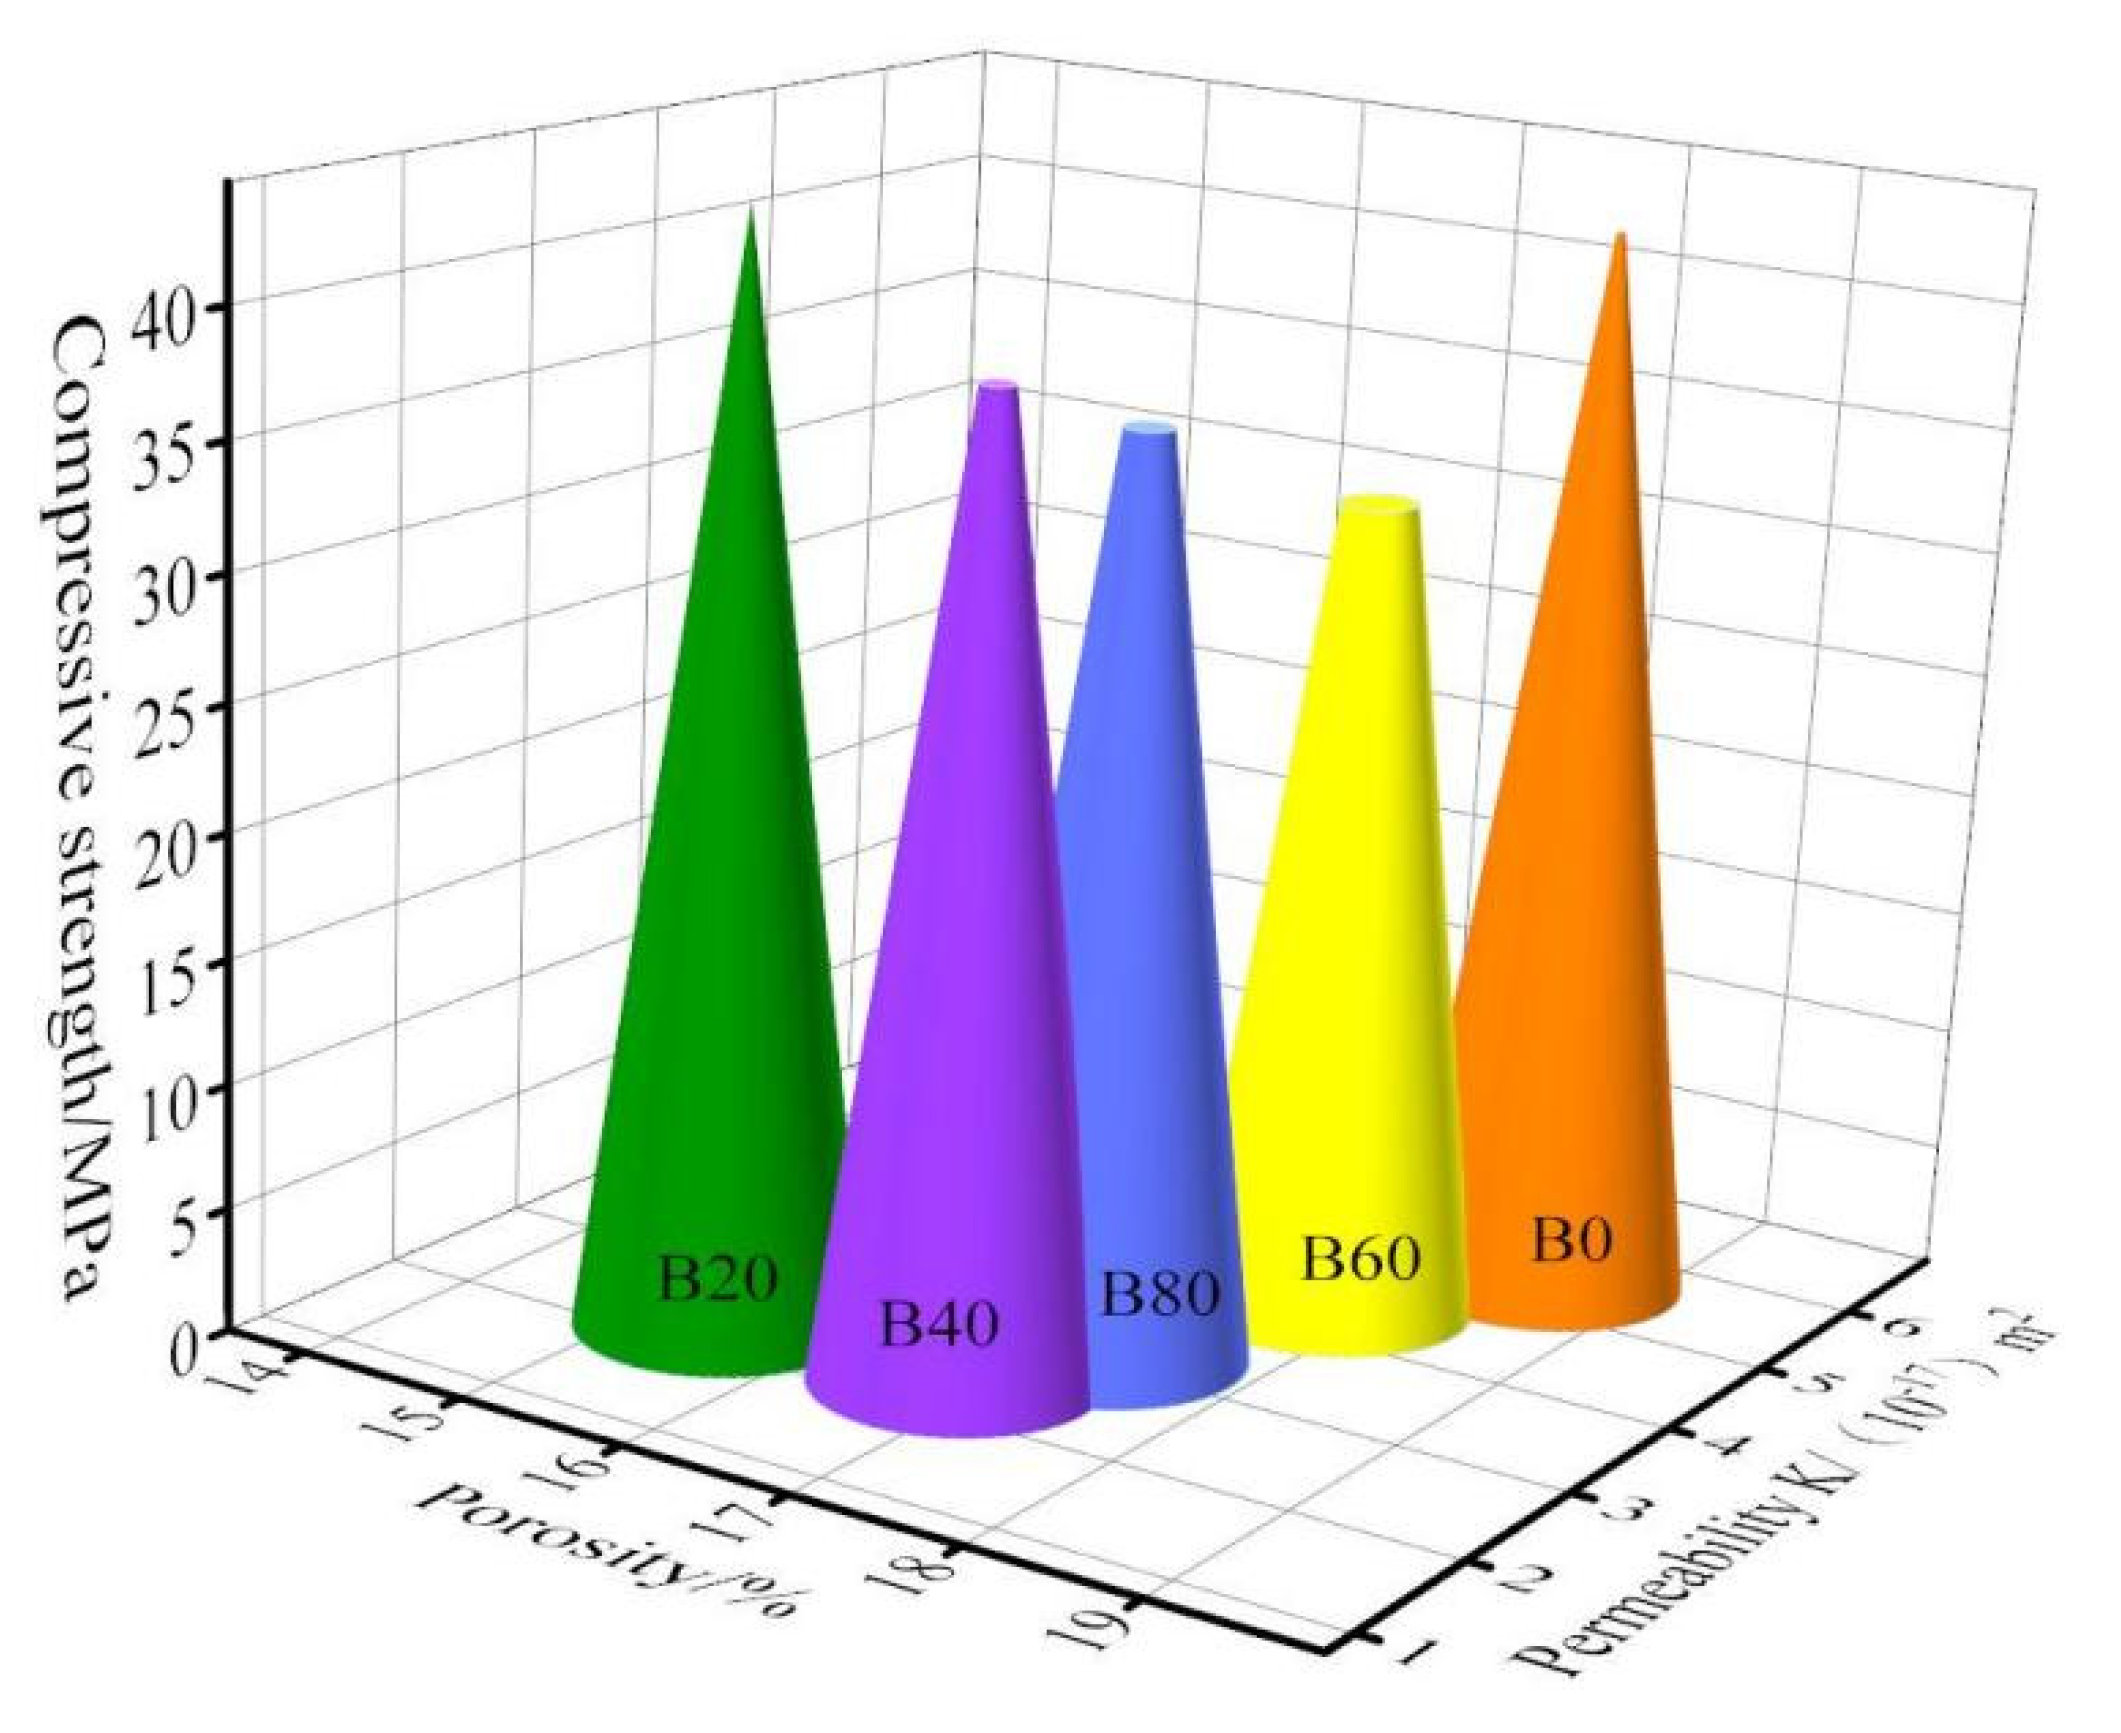
3.2. Mechanical Property Analysis
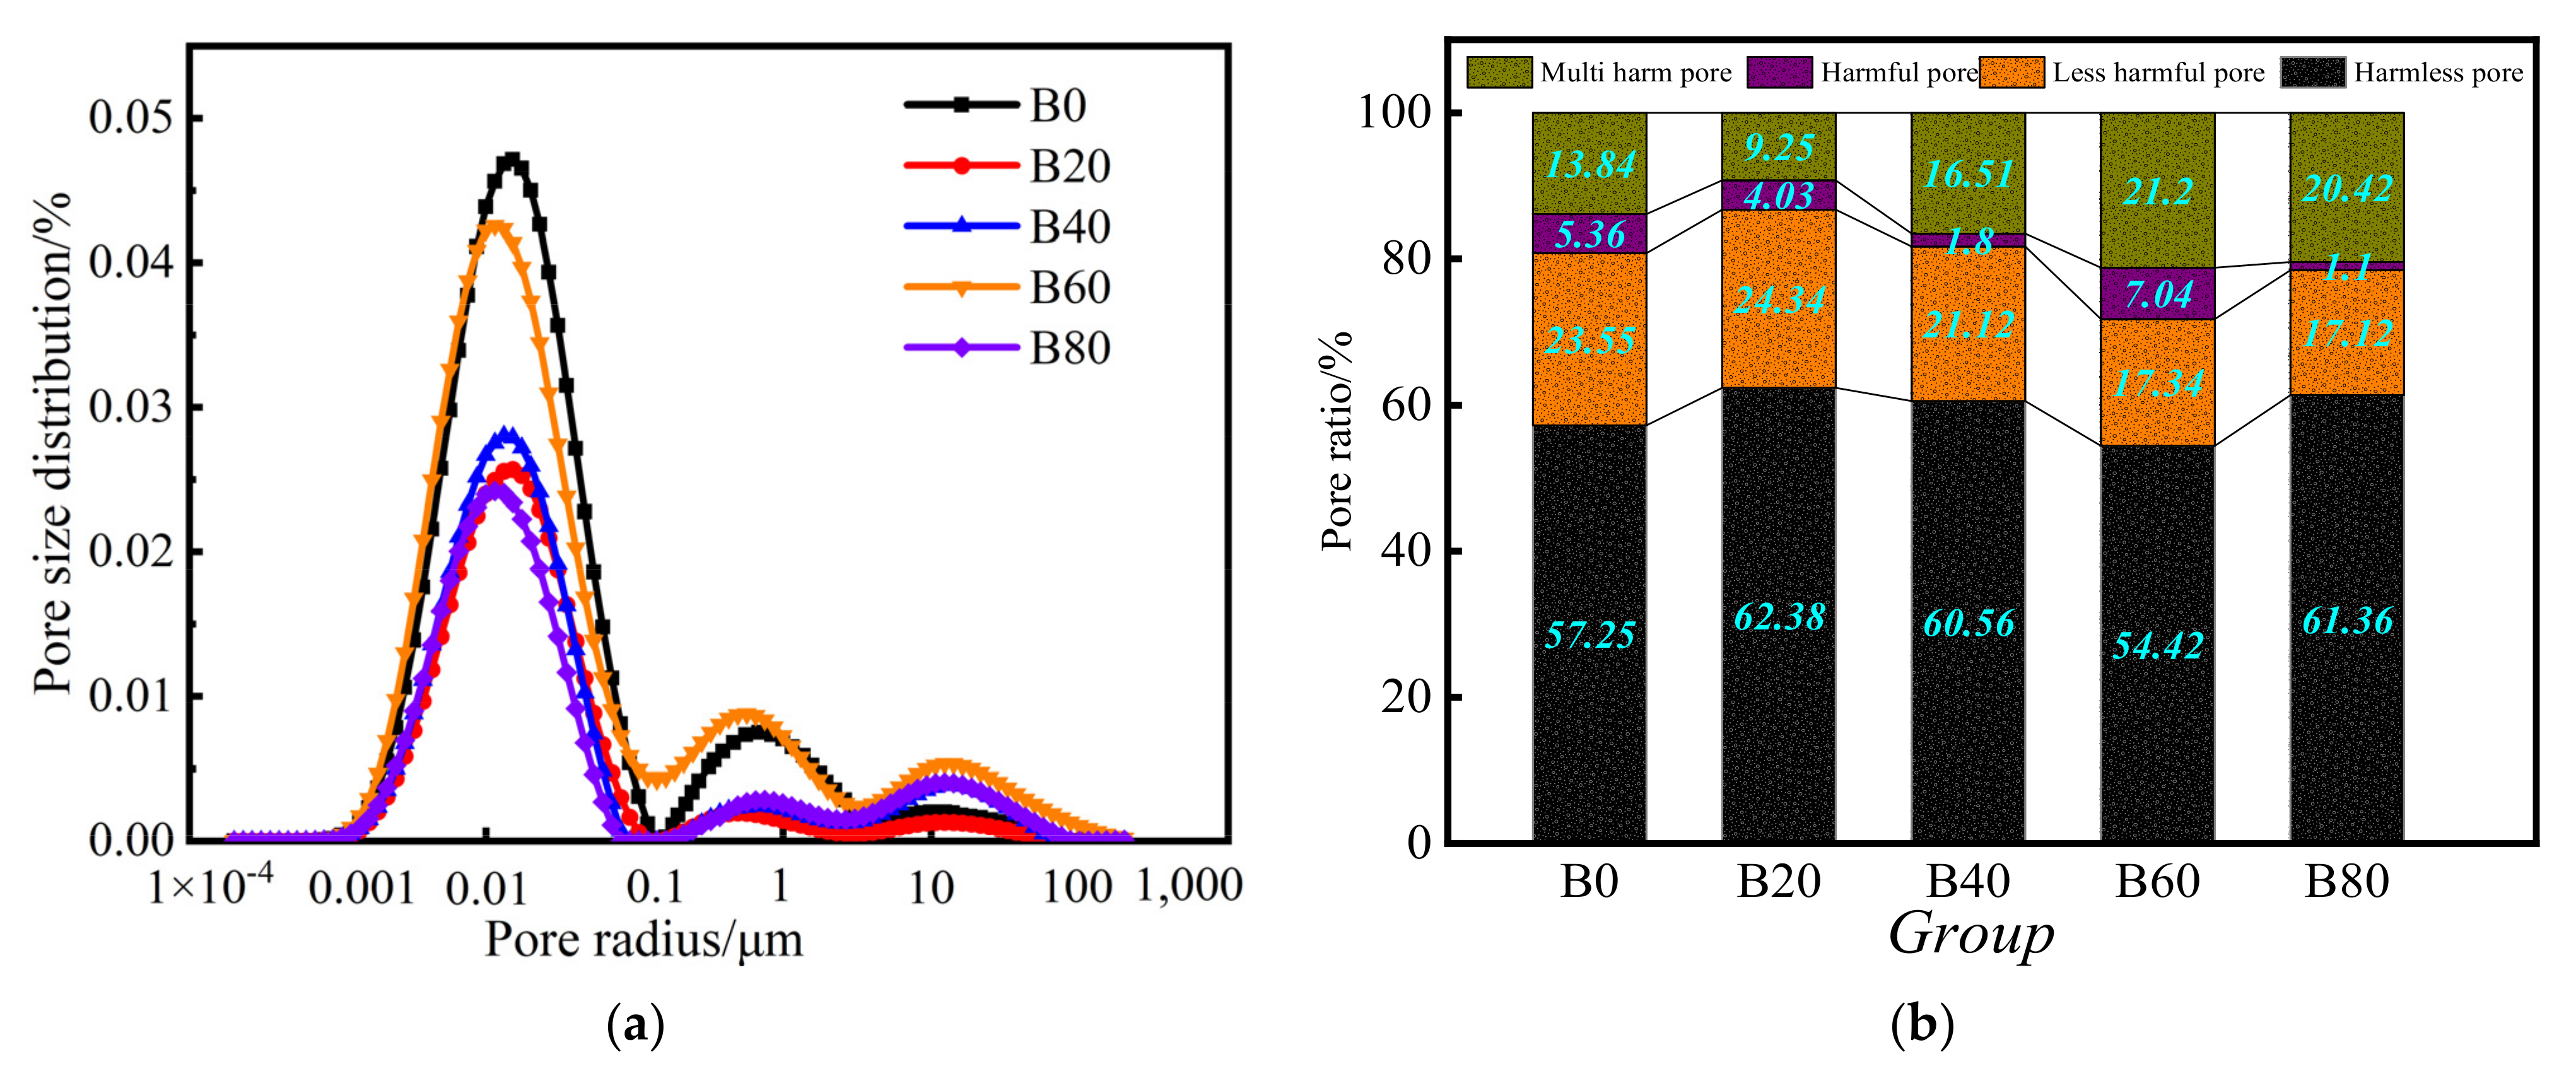
3.3. Pore Structure Analysis of Mortars
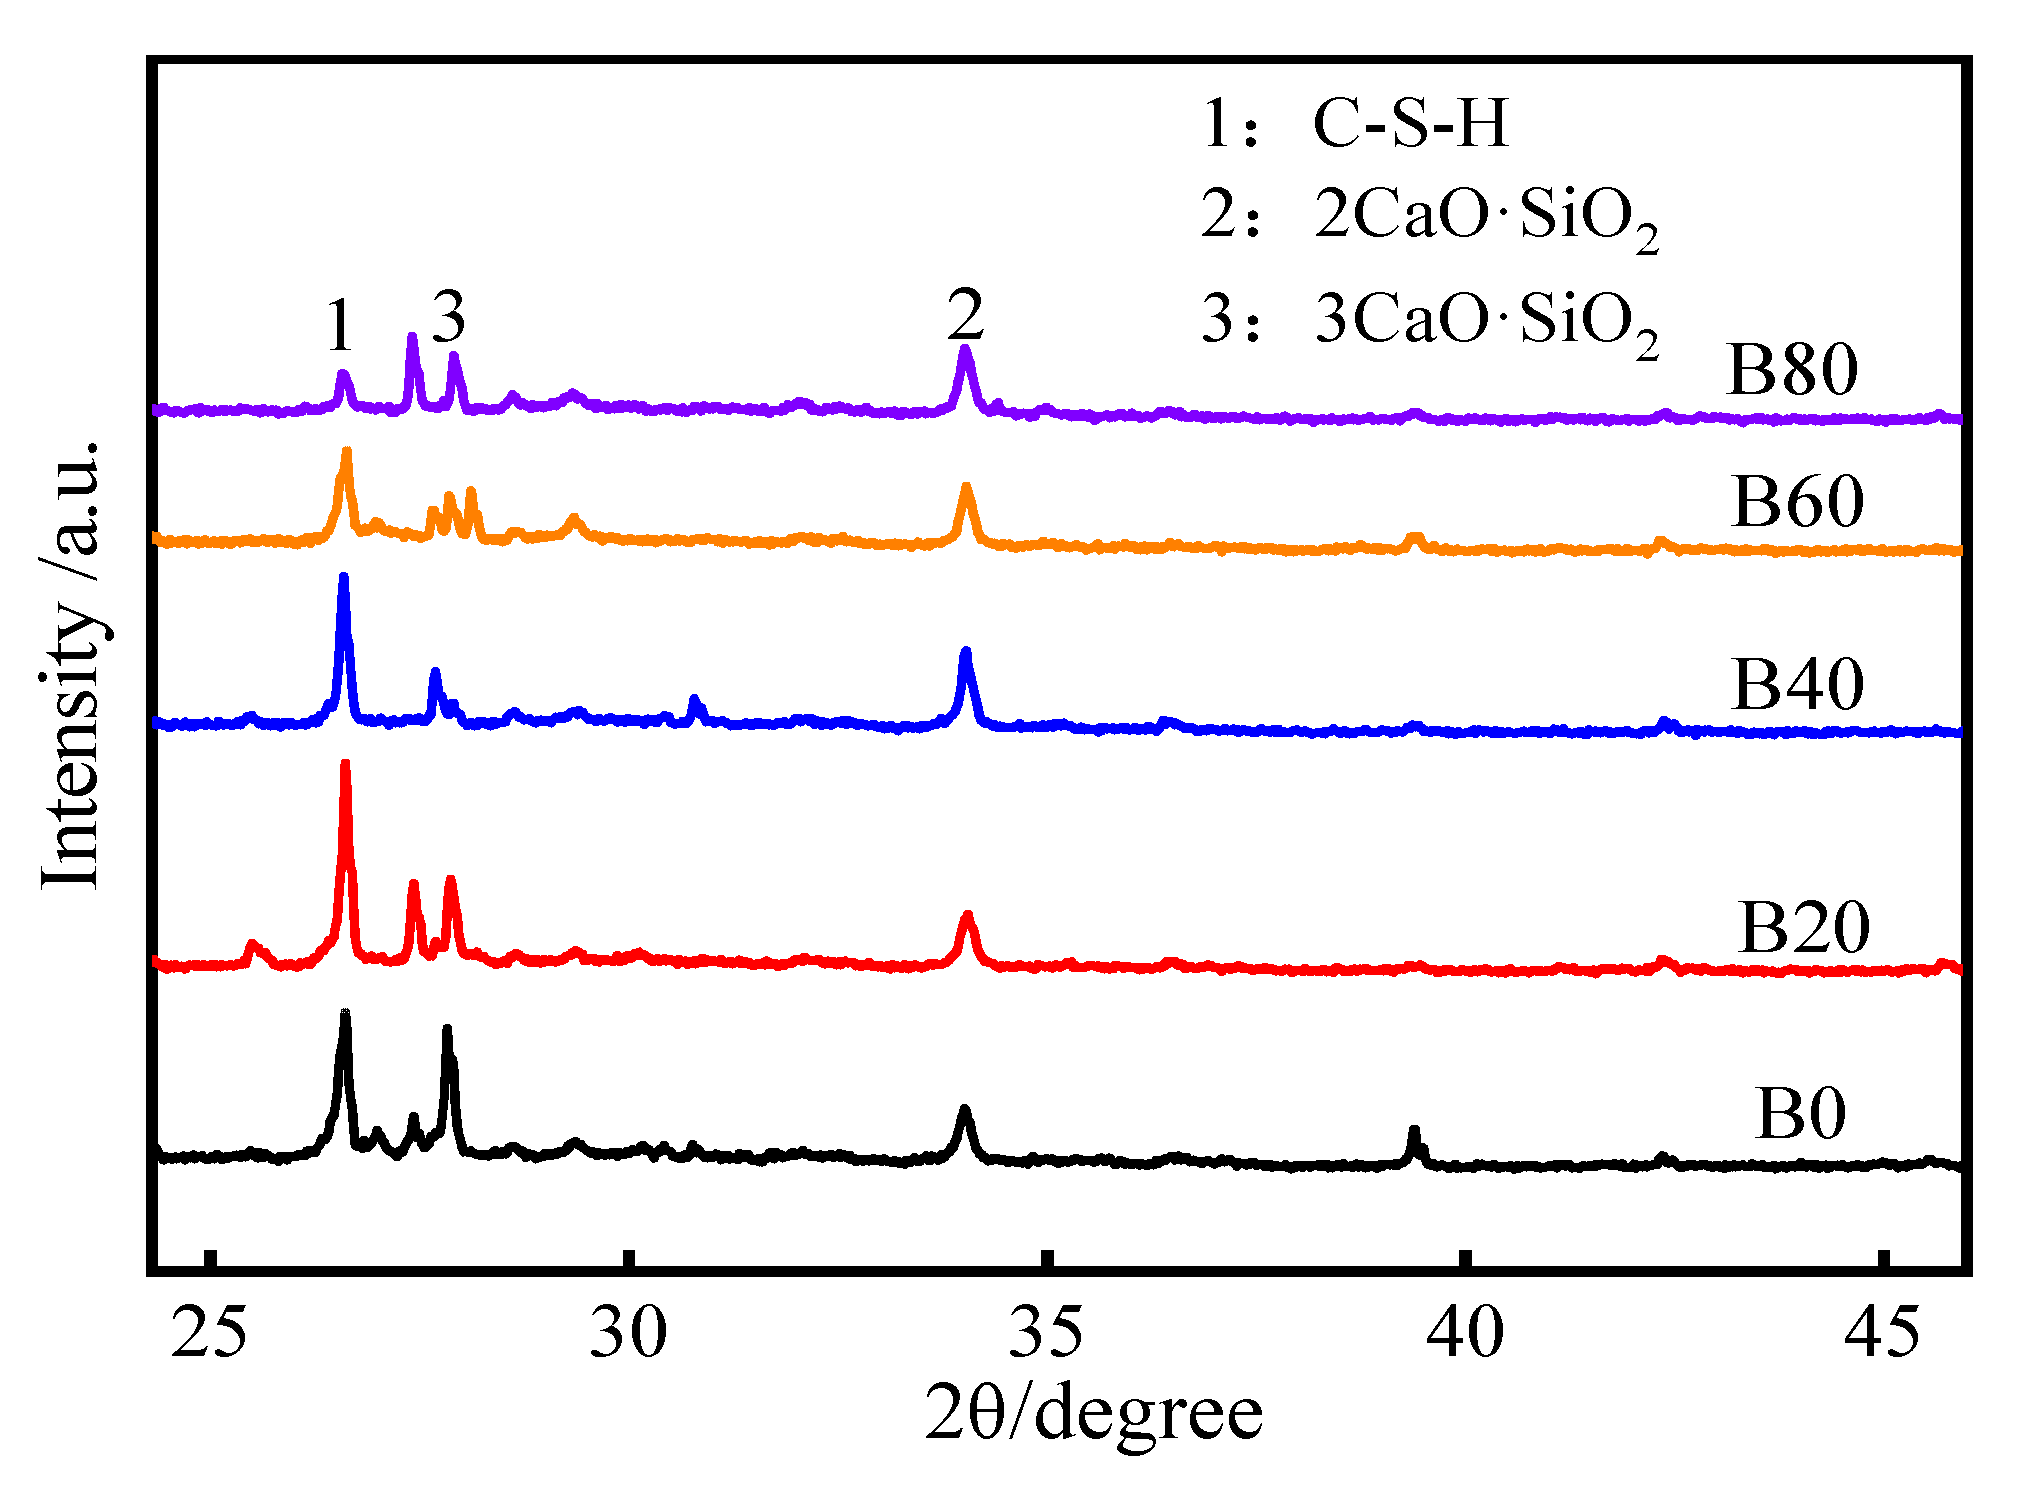
3.4. XRD Analysis
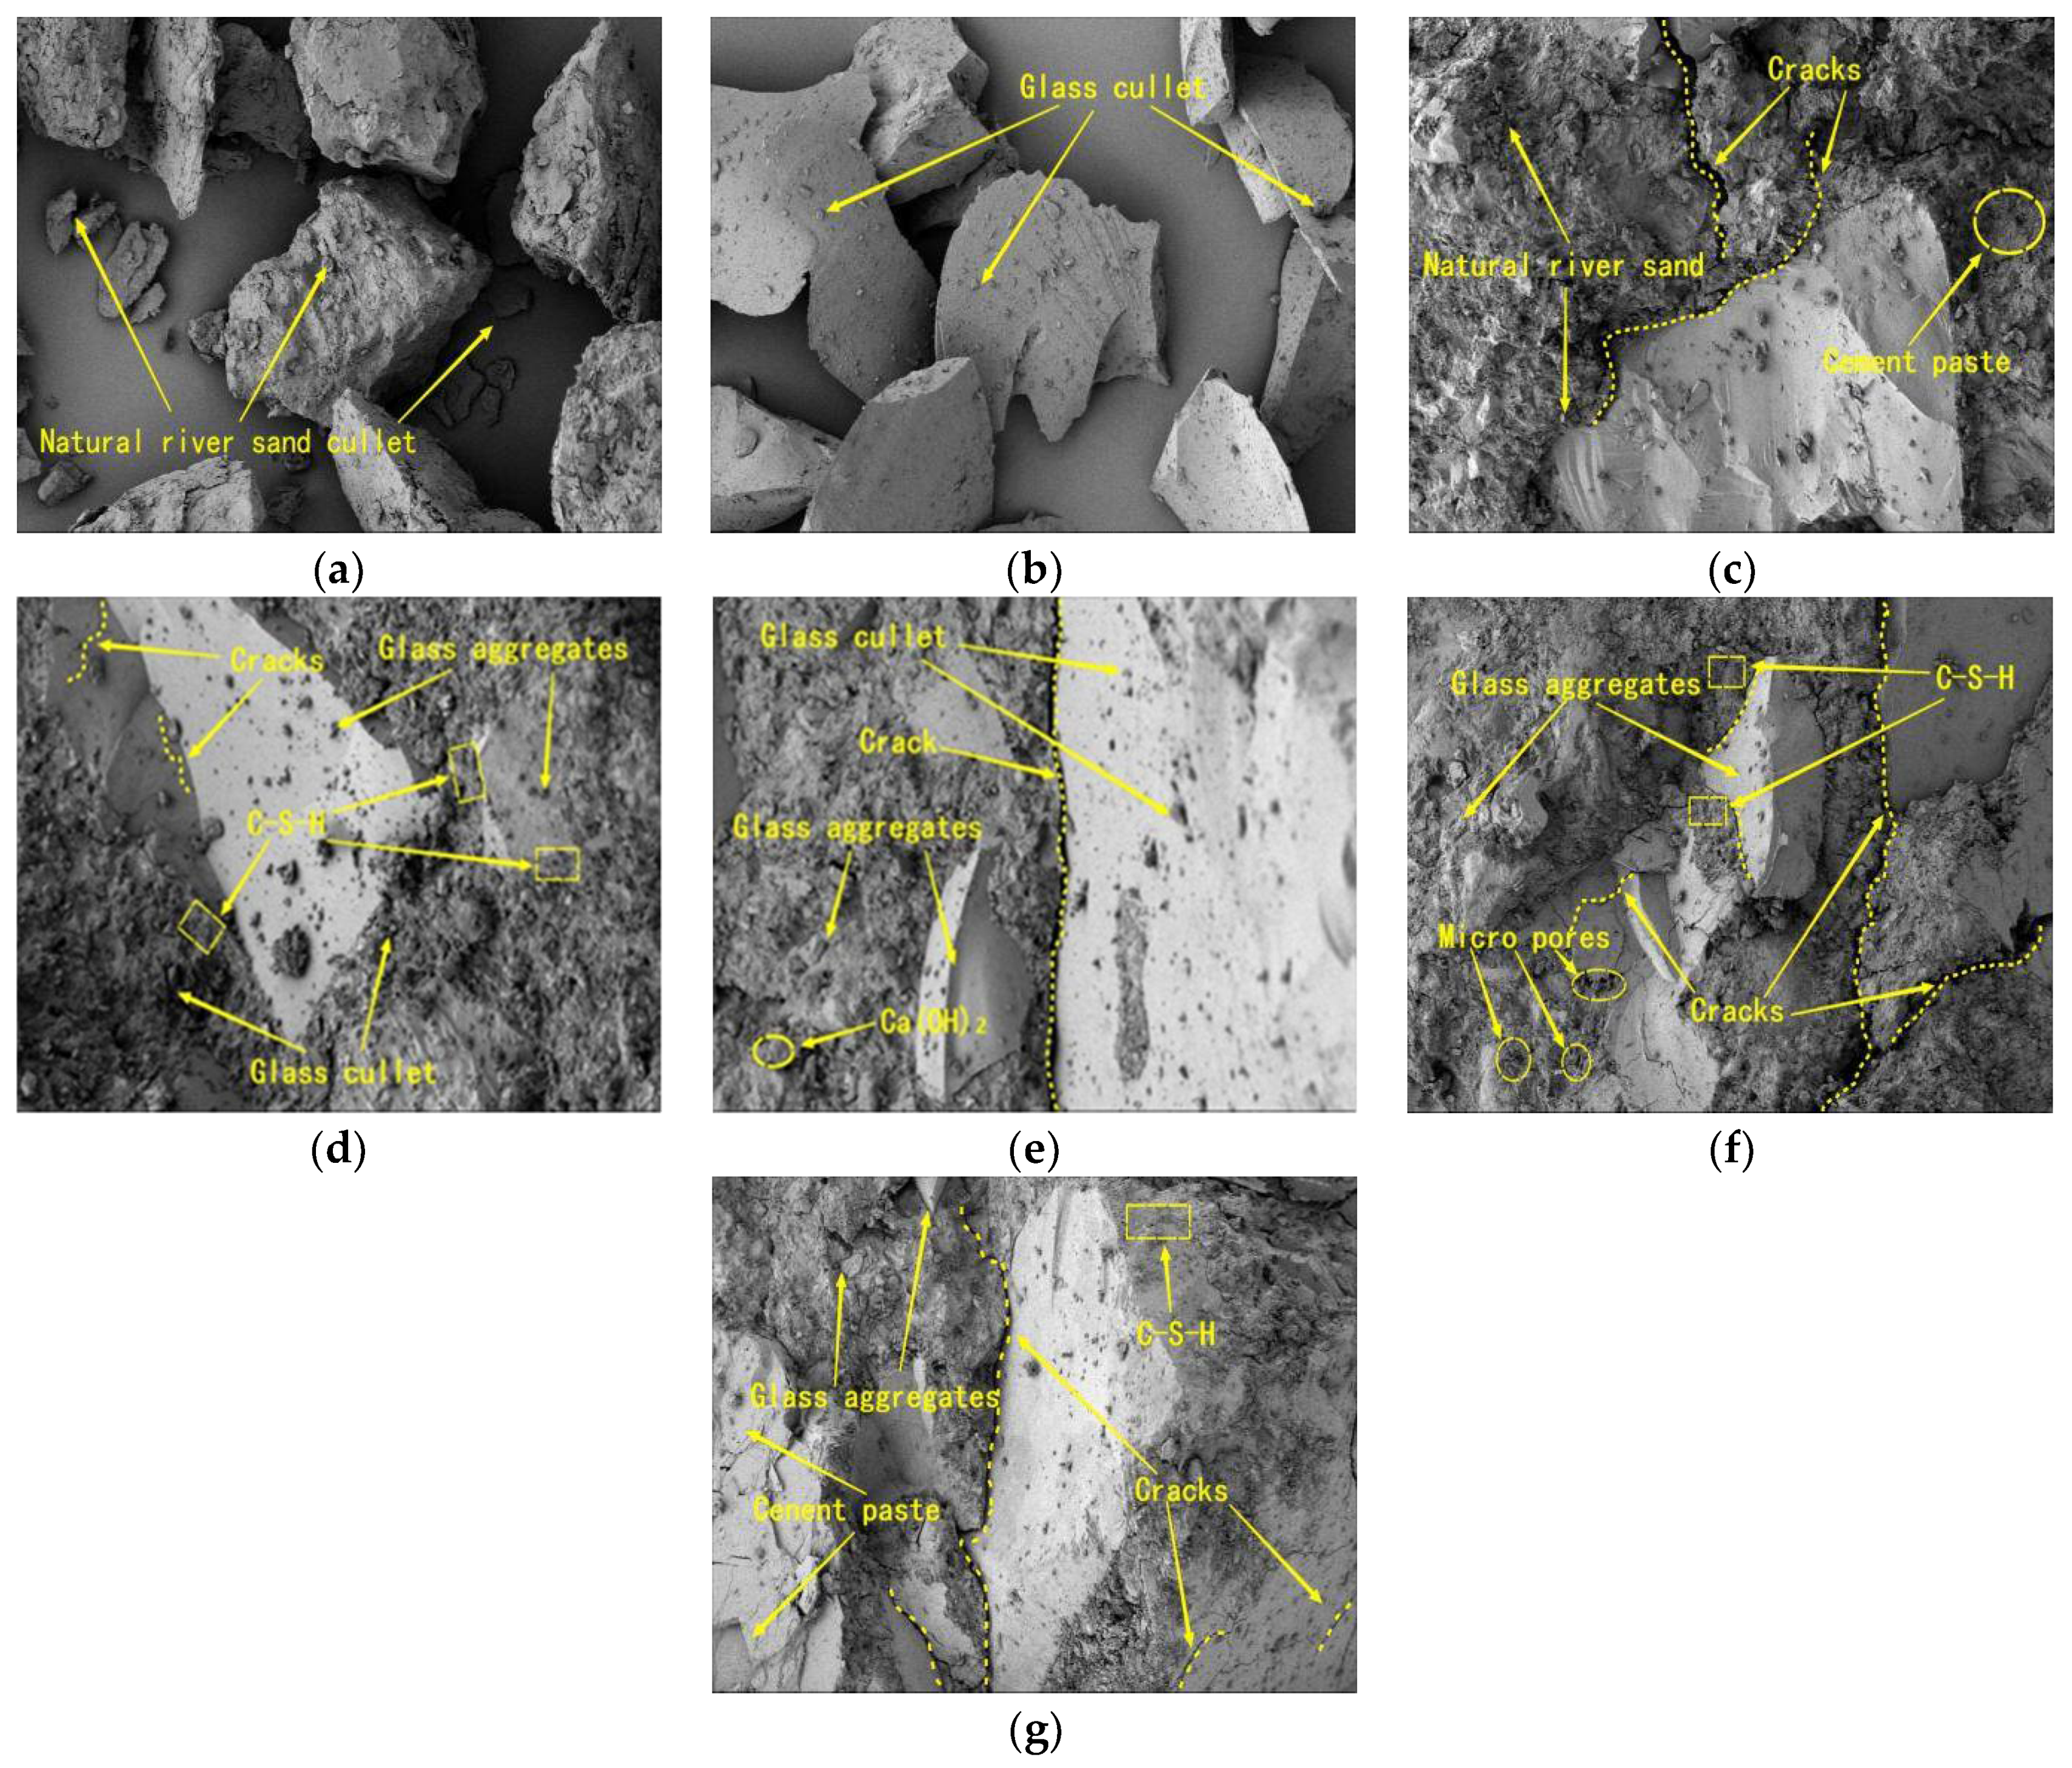
3.5. SEM Analysis
4. Conclusions
- When the replacement rate of waste glass sand is 20%, the permeability of mortar is the smallest, 57.4% lower than that of natural mortar. This replacement of waste glass sand and natural river sand worked together to achieve more satisfactory results. This replacement of mortar internal seepage paths was lower and narrower. The sensitivity of the mortar to changes in the confining pressure was minimized at 20%.
- The mechanical properties of waste-glass-mixed mortar declined by 10–25% compared to the control mortar when the natural fine aggregate was partially replaced by using glass fine aggregate. However, the 20% waste glass sand replacement of natural sand increases the impermeable pore density inside the mortar, which increases the compressive strength of the mortar by 3%. To achieve a better result waste glass sand, replacement with fine aggregate by 20% can be used.
- From the NMR test, it can be seen that, with the increase of waste glass sand replacement, the tiny internal pores and the medium and large pores of the mortar were reduced. The 20% replacement mortar had the lowest number of harmful pores; this replacement mortar’s pore structure was the densest and the best.
- The microscopic XRD pattern and the SEM analysis of the mortar showed that more C–S–H gels were produced in the mortar with 20% replacement and that 2CaO-SiO2/3CaO-SiO2 was relatively lower. The compactness and microstructure of the mortar were optimized, which improved the waste glass sand mortar’s compressive strength and gas permeability.
Author Contributions
Funding
Data Availability Statement
Conflicts of Interest
References
- Jurczak, R.; Szmatuła, F.; Rudnicki, T.; Korentz, J. Effect of ground waste glass addition on the strength and durability of low strength concrete mixes. Materials 2021, 14, 190. [Google Scholar] [CrossRef] [PubMed]
- Kim, I.S.; Choi, S.Y.; Yang, E.I. Evaluation of durability of concrete substituted heavyweight waste glass as fine aggregate. Constr. Build. Mater. 2018, 184, 269–277. [Google Scholar] [CrossRef]
- Abdelli, H.E.; Mokrani, L.; Kennouche, S.; de Aguiar, J.B. Utilization of waste glass in the improvement of concrete performance: A mini review. Waste Manag. Res. 2020, 38, 1204–1213. [Google Scholar] [CrossRef] [PubMed]
- Guo, P.; Meng, W.; Nassif, H.; Gou, H.; Bao, Y. New perspectives on recycling waste glass in manufacturing concrete for sustainable civil infrastructure. Constr. Build Mater. 2020, 257, 119579. [Google Scholar] [CrossRef]
- Arivalagan, S.; Sethuraman, V. Experimental study on the mechanical properties of concrete by partial replacement of glass powder as fine aggregate: An environmental friendly approach. Mater. Today Proc. 2021, 45, 6035–6041. [Google Scholar] [CrossRef]
- Omoding, N.; Cunningham, L.S.; Lane-Serff, G.F. Effect of using recycled waste glass coarse aggregates on the hydrodynamic abrasion resistance of concrete. Constr. Build. Mater. 2021, 268, 121177. [Google Scholar] [CrossRef]
- Mohammadinia, A.; Wong, Y.C.; Arulrajah, A.; Horpibulsuk, S. Strength evaluation of utilizing recycled plastic waste and recycled crushed glass in concrete footpaths. Constr. Build. Mater. 2019, 197, 489–496. [Google Scholar] [CrossRef]
- Wong, Y.C.; Perera, S.; Zhang, Z.; Arulrajah, A.; Mohammadinia, A. Field study on concrete footpath with recycled plastic and crushed glass as filler materials. Constr. Build. Mater. 2020, 243, 118277. [Google Scholar] [CrossRef]
- Ting, G.H.A.; Tay, Y.W.D.; Qian, Y.; Tan, M.J. Utilization of recycled glass for 3D concrete printing: Rheological and mechanical properties. J. Mater. Cycles Waste Manag. 2019, 21, 994–1003. [Google Scholar] [CrossRef]
- Szeląg, M.; Zegardło, B.; Andrzejuk, W. The use of fragmented, worn-out car side windows as an aggregate for cementitious composites. Materials 2019, 12, 1467. [Google Scholar] [CrossRef]
- Samadi, M.; Shah, K.W.; Huseien, G.F.; Lim, N.H.A.S. Influence of glass silica waste nano powder on the mechanical and microstructure properties of alkali-activated mortars. Nanomaterials 2020, 10, 324. [Google Scholar] [CrossRef]
- Małek, M.; Jackowski, M.; Łasica, W.; Kadela, M.; Wachowski, M. Mechanical and material properties of mortar reinforced with glass fiber: An experimental study. Materials 2021, 14, 698. [Google Scholar] [CrossRef] [PubMed]
- Jing, G.; Huang, G.; Zhu, W. An experimental study on water permeability of architectural mortar using waste glass as fine aggregate. Materials 2020, 13, 1110. [Google Scholar] [CrossRef]
- Saccani, A.; Manzi, S.; Lancellotti, I.; Barbieri, L. Manufacturing and durability of alkali activated mortars containing different types of glass waste as aggregates valorisation. Constr. Build. Mater. 2020, 237, 117733. [Google Scholar] [CrossRef]
- Nasry, O.; Samaouali, A.; Belarouf, S.; Moufakkir, A.; Sghiouri El Idrissi, H.; Soulami, H.; El Rhaffari, Y.; Hraita, M.; Fertahi, S.E.D.; Hafidi-Alaoui, A. Thermophysical properties of cement mortar containing waste glass powder. Crystals 2021, 11, 488. [Google Scholar] [CrossRef]
- Kim, I.S.; Choi, Y.S.; Choi, S.Y.; Yang, E.I. Evaluation of durability and radiation shielding property of heavyweight filling material for application in radioactive disposal facilities. Ann. Nucl. Energy 2019, 133, 750–761. [Google Scholar] [CrossRef]
- Zhang, B.; He, P.; Poon, C.S. Optimizing the use of recycled glass materials in alkali activated cement (AAC) based mortars. J. Clean. Prod. 2020, 255, 120228. [Google Scholar] [CrossRef]
- Kim, S.K.; Yang, H.J. Utilization of liquid crystal display (LCD) waste glass powder as cementitious binder in mortar for enhancing neutron shielding performance. Constr. Build. Mater. 2021, 270, 121859. [Google Scholar] [CrossRef]
- Choi, S.Y.; Choi, Y.S.; Yang, E.I. Characteristics of volume change and heavy metal leaching in mortar specimens recycled heavyweight waste glass as fine aggregate. Constr. Build. Mater. 2018, 165, 424–433. [Google Scholar] [CrossRef]
- Khan, M.; Newaz, N.; Sarker, P.K. Alkali silica reaction of waste glass aggregate in alkali activated fly ash and GGBFS mortars. Mater. Struct. 2019, 52, 1–17. [Google Scholar] [CrossRef]
- Lu, J.-X.; Poon, C.S. Use of waste glass in alkali activated cement mortar. Constr. Build. Mater. 2018, 160, 399–407. [Google Scholar] [CrossRef]
- Małek, M.; Łasica, W.; Jackowski, M.; Kadela, M. Effect of waste glass addition as a replacement for fine aggregate on properties of mortar. Materials 2020, 13, 3189. [Google Scholar] [CrossRef] [PubMed]
- Hou, S.; Duan, Z.; Ma, Z.; Singh, A. Improvement on the properties of waste glass mortar with nanomaterials. Constr. Build. Mater. 2020, 254, 118973. [Google Scholar] [CrossRef]
- Liu, G.; Florea, M.; Brouwers, H. Performance evaluation of sustainable high strength mortars incorporating high volume waste glass as binder. Constr. Build. Mater. 2019, 202, 574–588. [Google Scholar] [CrossRef]
- Zhang, B.; He, P.; Poon, C.S. Improving the high temperature mechanical properties of alkali activated cement (AAC) mortars using recycled glass as aggregates. Cem. Concr. Compos. 2020, 112, 103654. [Google Scholar] [CrossRef]
- Khan, M.N.N.; Sarker, P.K. Effect of waste glass fine aggregate on the strength, durability and high temperature resistance of alkali-activated fly ash and GGBFS blended mortar. Constr. Build. Mater. 2020, 263, 120177. [Google Scholar] [CrossRef]
- Yang, S.; Lu, J.-X.; Poon, C.S. Recycling of waste glass in dry-mixed concrete blocks: Evaluation of alkali-silica reaction (ASR) by accelerated laboratory tests and long-term field monitoring. Constr. Build. Mater. 2020, 262, 120865. [Google Scholar] [CrossRef]
- Cai, Y.; Xuan, D.; Poon, C.S. Effects of nano-SiO2 and glass powder on mitigating alkali-silica reaction of cement glass mortars. Constr. Build. Mater. 2019, 201, 295–302. [Google Scholar] [CrossRef]
- Tamanna, N.; Tuladhar, R.; Sivakugan, N. Performance of recycled waste glass sand as partial replacement of sand in concrete. Constr. Build. Mater. 2020, 239, 117804. [Google Scholar] [CrossRef]
- Jin, L.; Yu, H.; Wang, Z.; Fan, T. Effect of crack and damaged zone on chloride penetration in recycled aggregate concrete: A seven-phase mesoscale numerical method. Constr. Build. Mater. 2021, 291, 123383. [Google Scholar] [CrossRef]
- Wang, C.; Kong, F.; Pan, L. Effects of polycarboxylate superplasticizers with different side-chain lengths on the resistance of concrete to chloride penetration and sulfate attack. J. Build. Eng. 2021, 43, 102817. [Google Scholar] [CrossRef]
- Xiao, L.; Chen, D.; Jiang, M.; Xiao, L.; Mei, G. Experimental and numerical analysis of chloride transport in finite concrete under reverse water pressure. Constr. Build. Mater. 2021, 304, 124576. [Google Scholar] [CrossRef]
- Chalangaran, N.; Jabbari, M.M. Experimental Investigation into Sound Transmission Loss through Concrete Containing Recycled Rubber. Amirkabir J. Mech. Eng. 2019, 51, 131–140. [Google Scholar]
- Chalangaran, N.; Farzampour, A.; Paslar, N. Nano Silica and Metakaolin Effects on the Behavior of Concrete Containing Rubber Crumbs. CivilEng 2020, 1, 264–274. [Google Scholar] [CrossRef]
- Iman, M.; Shahheidari, F.S.; Hashemi, S.; Farzampour, A. Investigation of steel fiber effects on concrete abrasion resistance. Adv. Con. Constr. 2020, 9, 367–374. [Google Scholar]
- Farzampour, A. Compressive Behavior of Concrete under Environmental Effects. In Compressive Strength of Concrete; IntechOpen: London, UK, 2019. [Google Scholar]
- Farzampour, A. Temperature and humidity effects on behavior of grouts. Adv. Con. Constr. 2017, 5, 659. [Google Scholar]
- Chen, W.; Han, Y.; Agostini, F.; Skoczylas, F.; Corbeel, D. Permeability of a Macro-Cracked Concrete Effect of Confining Pressure and Modelling. Materials 2021, 14, 862. [Google Scholar] [CrossRef]
- Chen, W.; Liu, Y.; Sheng, M.; Zhang, H.; Liang, Y.; Skoczylas, F. Heating Rate Effect on Gas Permeability and Pore Structure of Mortar under High Temperature. Materials 2022, 15, 6505. [Google Scholar] [CrossRef]
- Frías, M.; Martínez-Ramírez, S.; de la Villa, R.V.; Fernández-Carrasco, L.; García, R. Reactivity in cement pastes bearing fine fraction concrete and glass from construction and demolition waste: Microstructural analysis of viability. Cem. Concr. Res. 2021, 148, 106531. [Google Scholar] [CrossRef]
- Bouchikhi, A.; Mamindy-Pajany, Y.; Maherzi, W.; Albert-Mercier, C.; El-Moueden, H.; Benzerzour, M.; Peys, A.; Abriak, N.-E. Use of residual waste glass in an alkali-activated binder–Structural characterization, environmental leaching behavior and comparison of reactivity. J. Build. Eng. 2021, 34, 101903. [Google Scholar] [CrossRef]
- Borek, K.; Czapik, P.; Dachowski, R. Recycled glass as a substitute for quartz sand in silicate products. Materials 2020, 13, 1030. [Google Scholar] [CrossRef] [PubMed]
- Lu, J.-X.; Zheng, H.; Yang, S.; He, P.; Poon, C.S. Co-utilization of waste glass cullet and glass powder in precast concrete products. Constr. Build. Mater. 2019, 223, 210–220. [Google Scholar] [CrossRef]
- Bisht, K.; Ramana, P. Sustainable production of concrete containing discarded beverage glass as fine aggregate. Constr. Build. Mater. 2018, 177, 116–124. [Google Scholar] [CrossRef]
- He, P.; Zhang, B.; Lu, J.-X.; Poon, C.S. ASR expansion of alkali-activated cement glass aggregate mortars. Constr. Build. Mater. 2020, 261, 119925. [Google Scholar] [CrossRef]


| Group | Water (kg/m3) | Cement (kg/m3) | Natural Sand (kg/m3) | Waste Glass Sand (kg/m3) | Weight Replacement |
|---|---|---|---|---|---|
| B0 | 225 | 450 | 1350 | 0 | 0% |
| B20 | 225 | 450 | 1080 | 270 | 20% |
| B40 | 225 | 450 | 810 | 540 | 40% |
| B60 | 225 | 450 | 540 | 810 | 60% |
| B80 | 225 | 450 | 270 | 1080 | 80% |
| Group | a | b | R2 |
|---|---|---|---|
| B0 | 1.779 | −0.542 | 0.989 |
| B20 | 1.208 | −0.212 | 0.910 |
| B40 | 1.238 | −0.256 | 0.903 |
| B60 | 1.902 | −0.625 | 0.963 |
| B80 | 1.464 | −0.411 | 0.910 |
Publisher’s Note: MDPI stays neutral with regard to jurisdictional claims in published maps and institutional affiliations. |
© 2022 by the authors. Licensee MDPI, Basel, Switzerland. This article is an open access article distributed under the terms and conditions of the Creative Commons Attribution (CC BY) license (https://creativecommons.org/licenses/by/4.0/).
Share and Cite
Chen, W.; Dong, S.; Liu, Y.; Liang, Y.; Skoczylas, F. Effect of Waste Glass as Fine Aggregate on Properties of Mortar. Materials 2022, 15, 8499. https://doi.org/10.3390/ma15238499
Chen W, Dong S, Liu Y, Liang Y, Skoczylas F. Effect of Waste Glass as Fine Aggregate on Properties of Mortar. Materials. 2022; 15(23):8499. https://doi.org/10.3390/ma15238499
Chicago/Turabian StyleChen, Wei, Song Dong, Yuehan Liu, Yue Liang, and Frederic Skoczylas. 2022. "Effect of Waste Glass as Fine Aggregate on Properties of Mortar" Materials 15, no. 23: 8499. https://doi.org/10.3390/ma15238499
APA StyleChen, W., Dong, S., Liu, Y., Liang, Y., & Skoczylas, F. (2022). Effect of Waste Glass as Fine Aggregate on Properties of Mortar. Materials, 15(23), 8499. https://doi.org/10.3390/ma15238499