
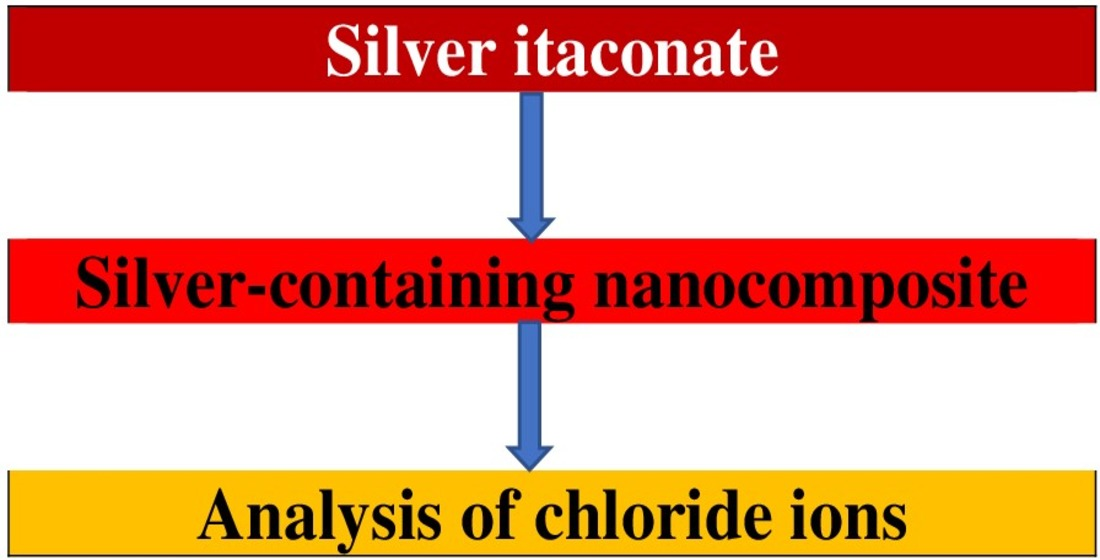
Silver Itaconate as Single-Source Precursor of Nanocomposites for the Analysis of Chloride Ions

 and
and
Abstract
:
1. Introduction
2. Materials and Methods
2.1. Starting Materials
2.2. Synthesis of Silver Itaconate
2.3. Characterization Techniques
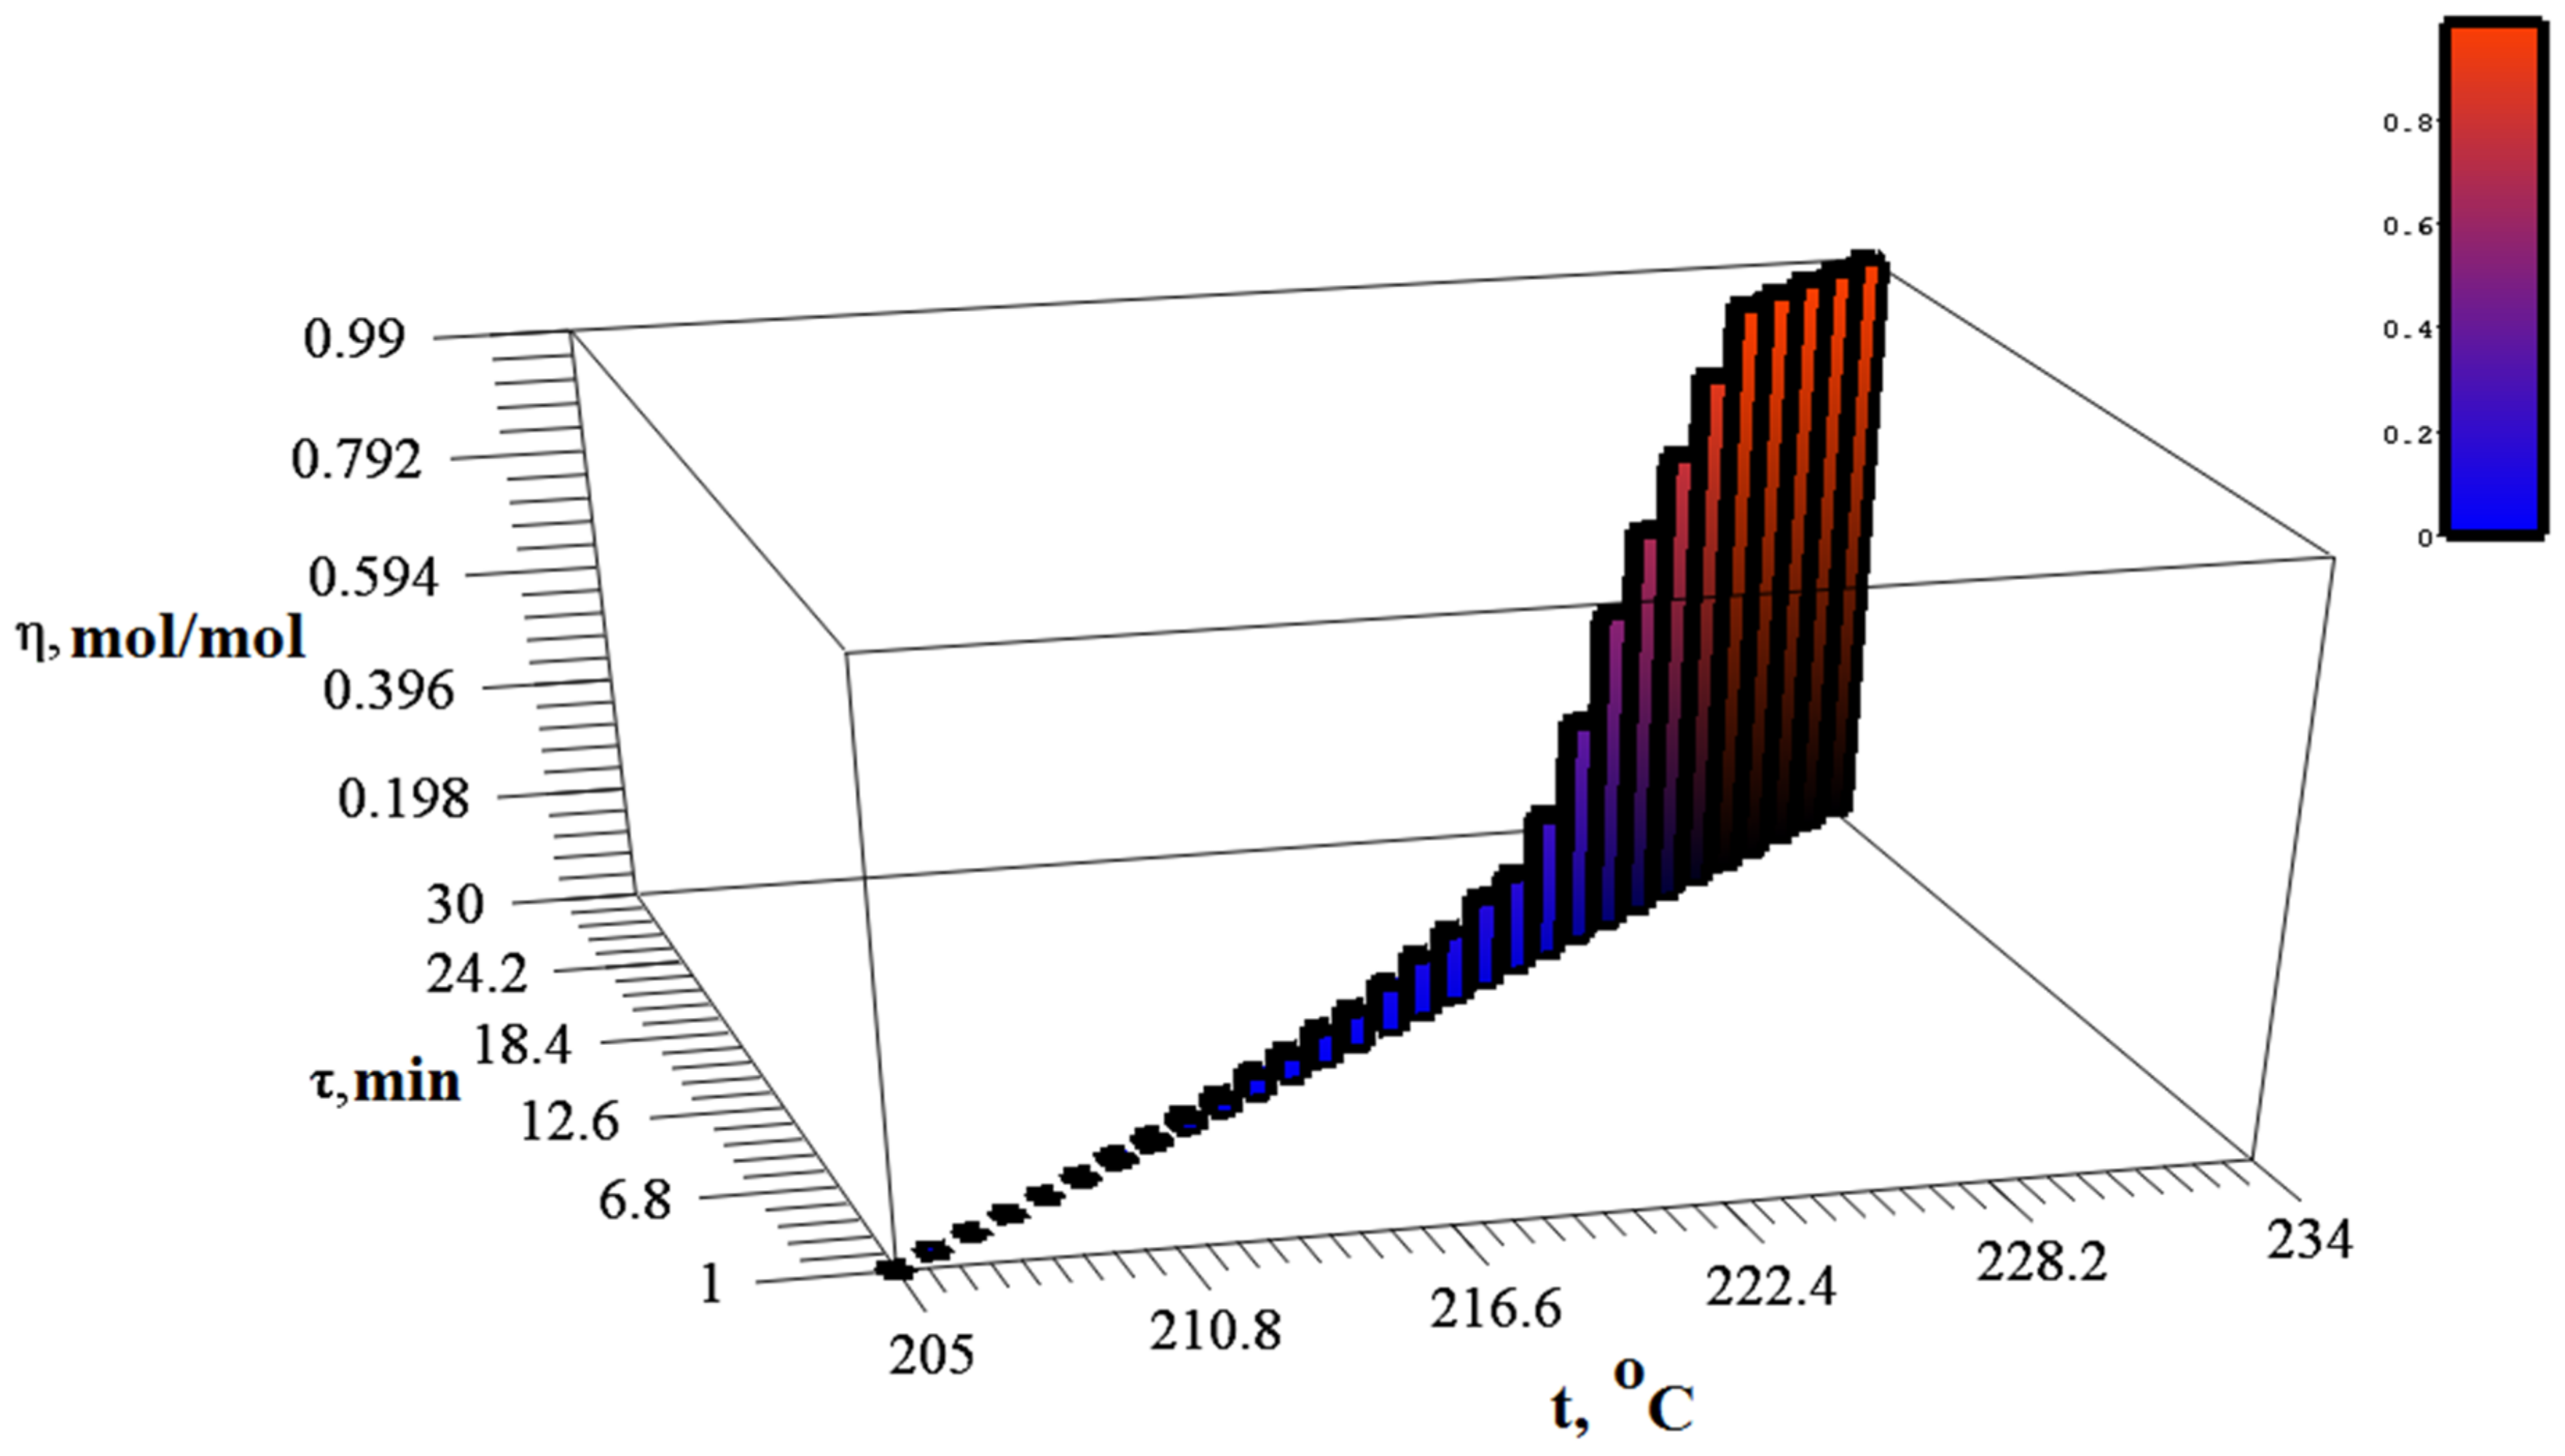
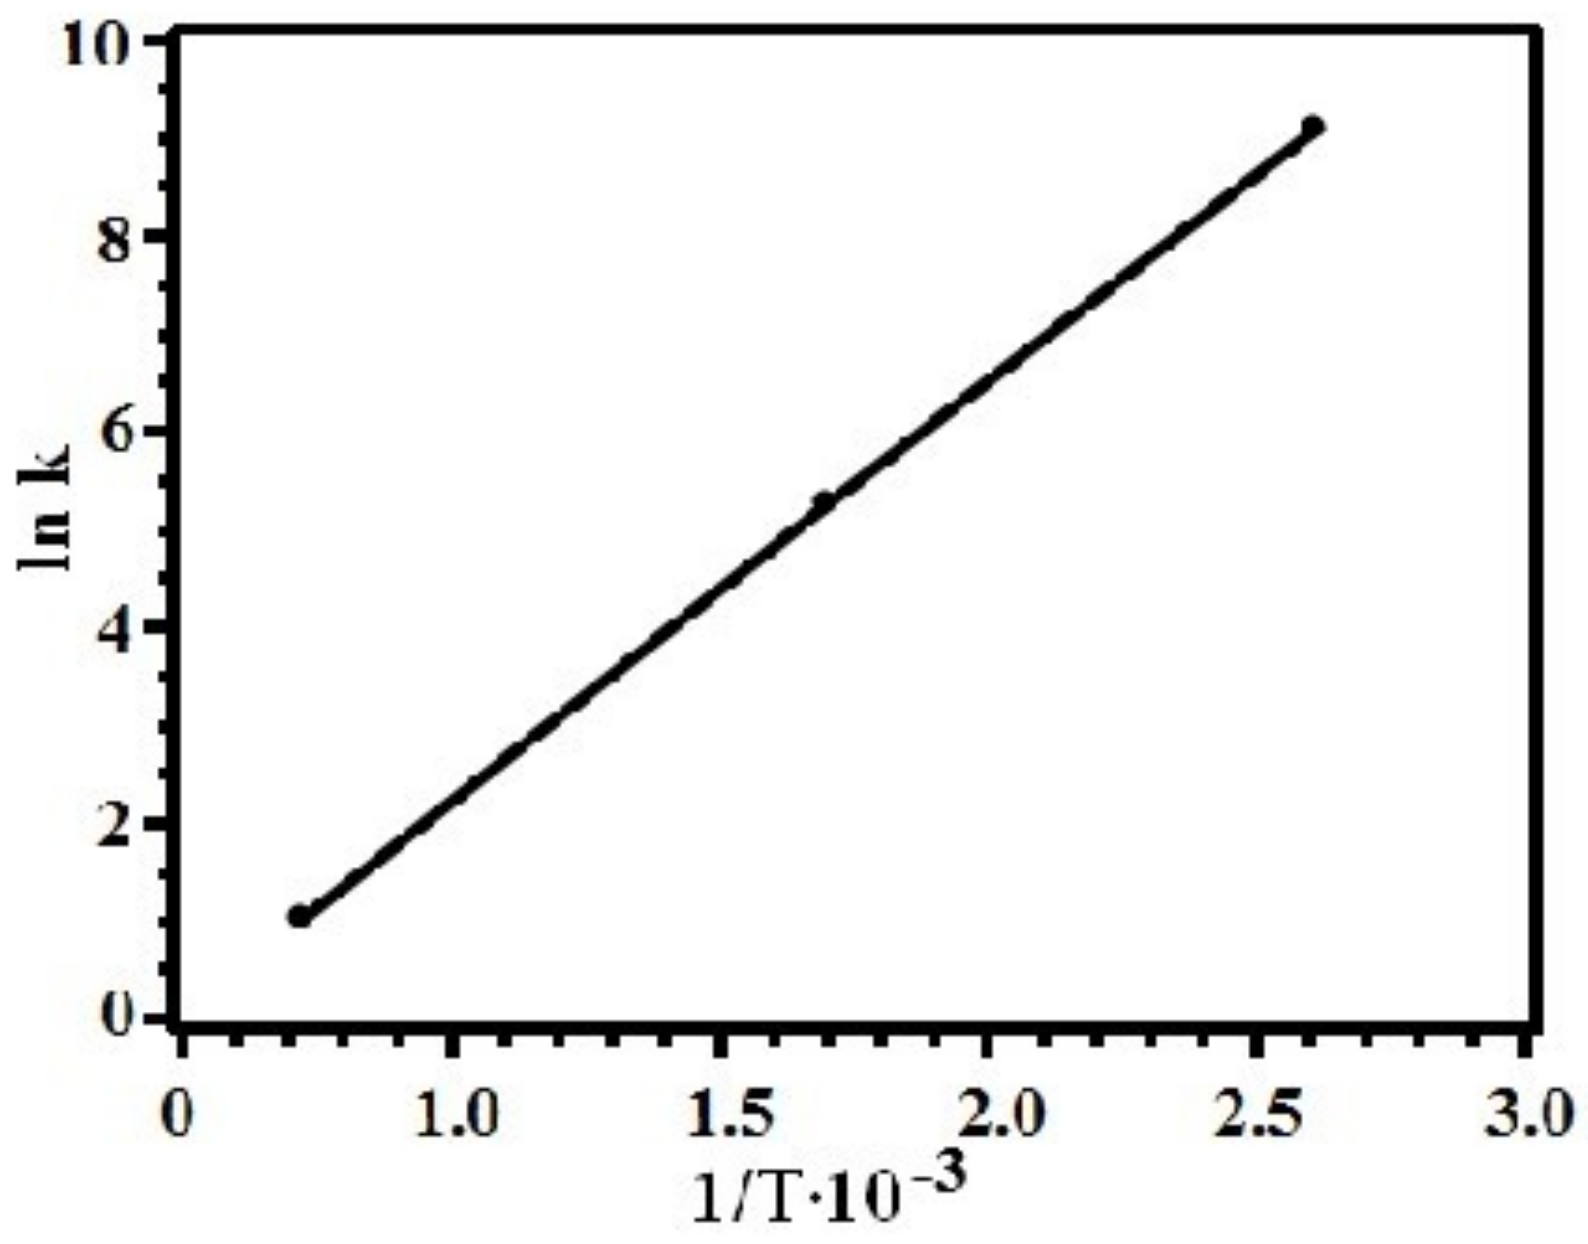
2.4. Study of Thermolysis Kinetics
2.5. Preparation of the Nanocomposites
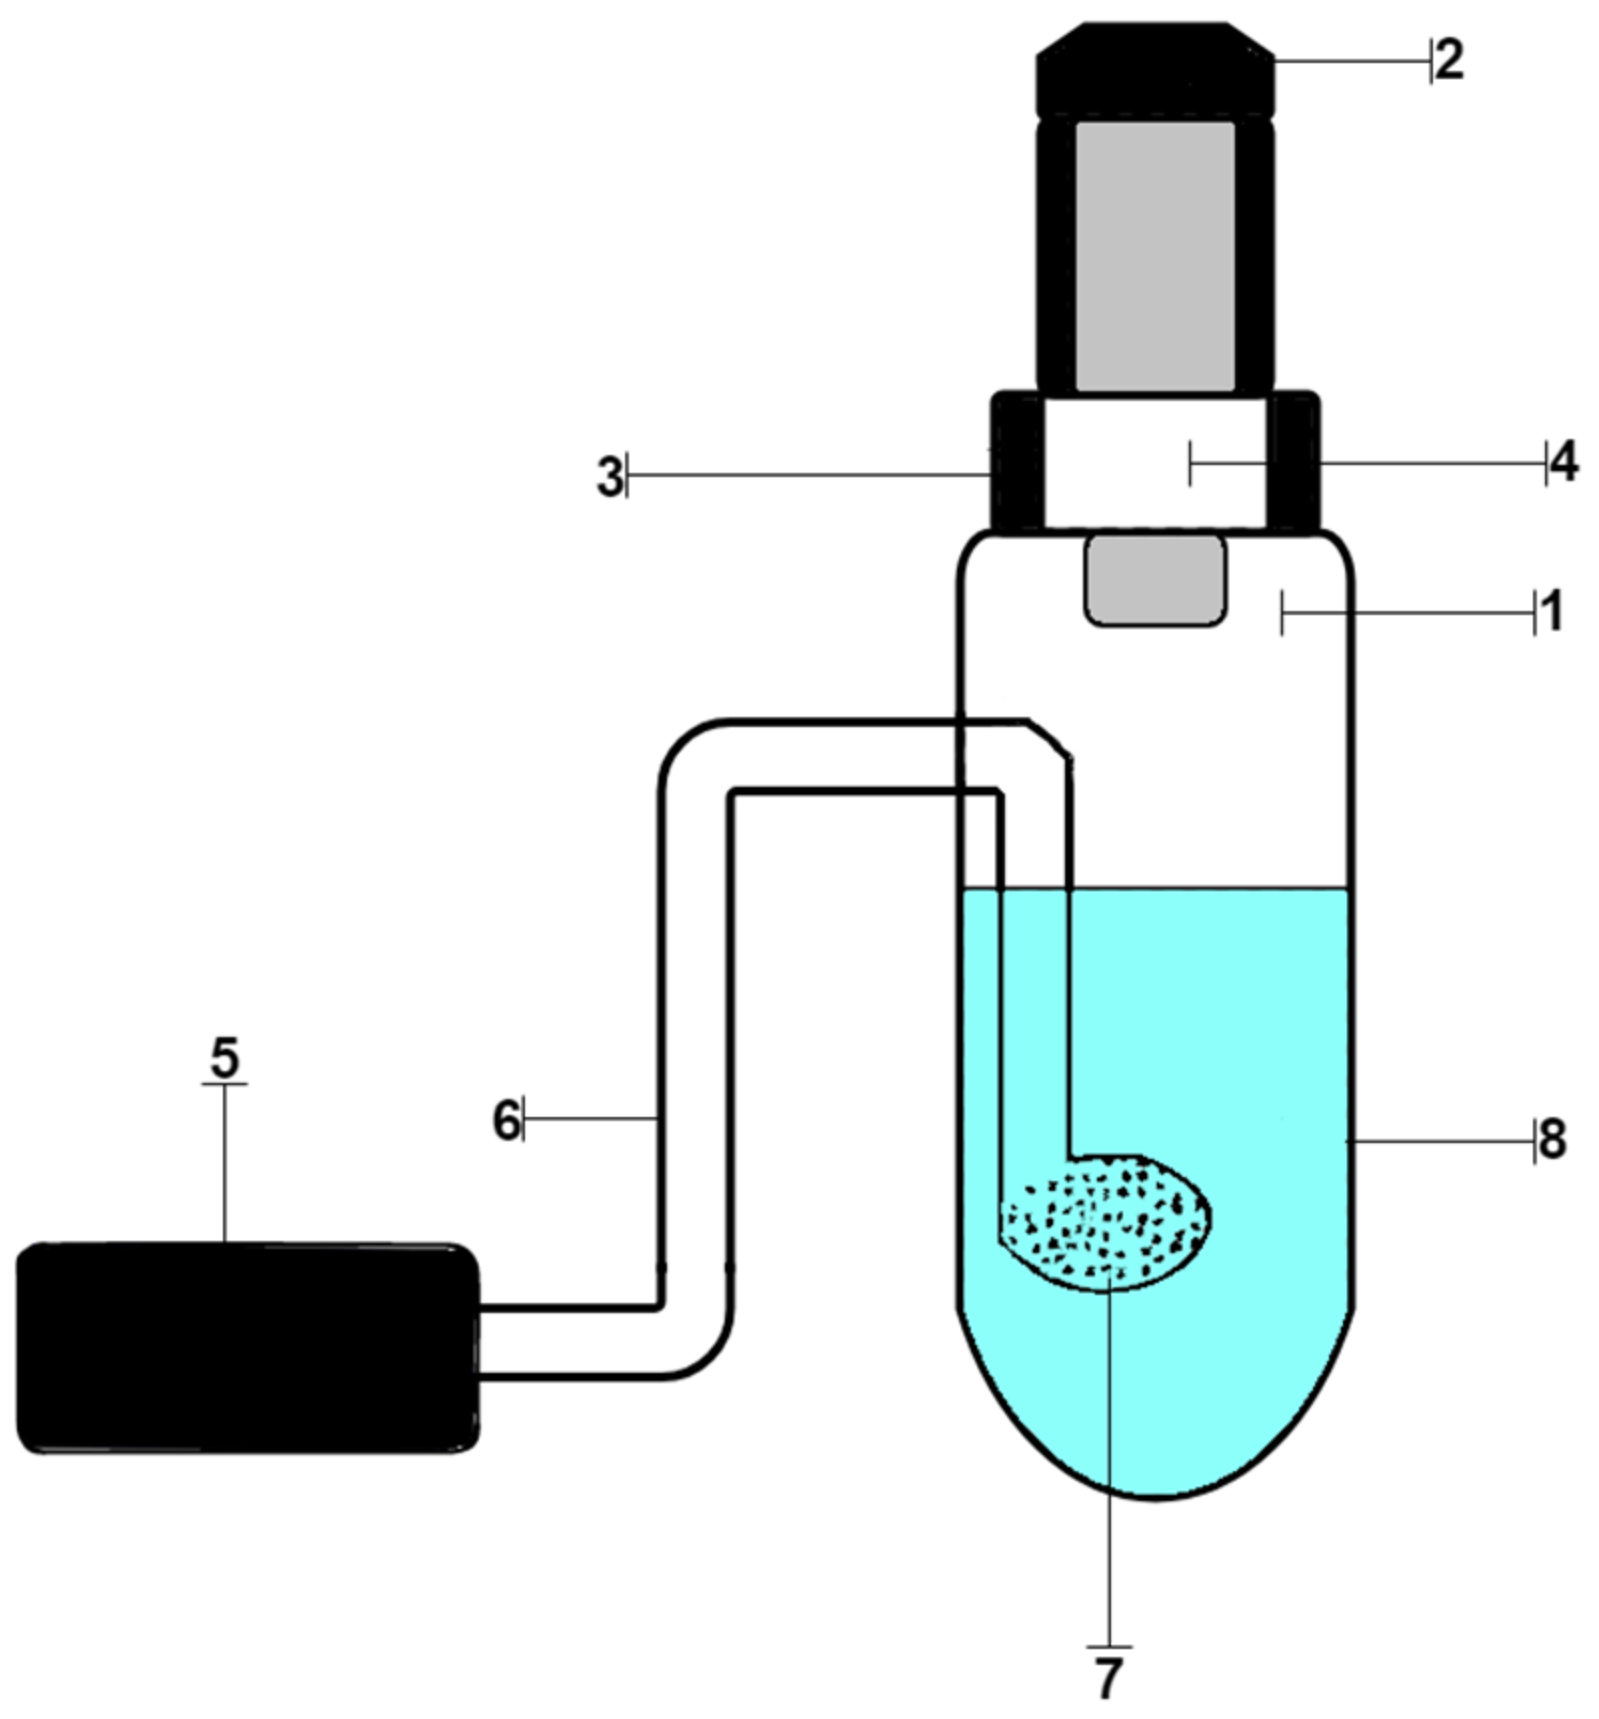
2.6. Procedure of Analysis of Chloride Ions
2.7. Preparation of Paper Test Strips Modified with Ag NPs
2.8. Calibration
2.9. Analysis of Samples of Natural Water
2.10. Use of Silver Itaconate Thermolysis Product for Adsorption of Chloride Ions
3. Results and Discussion
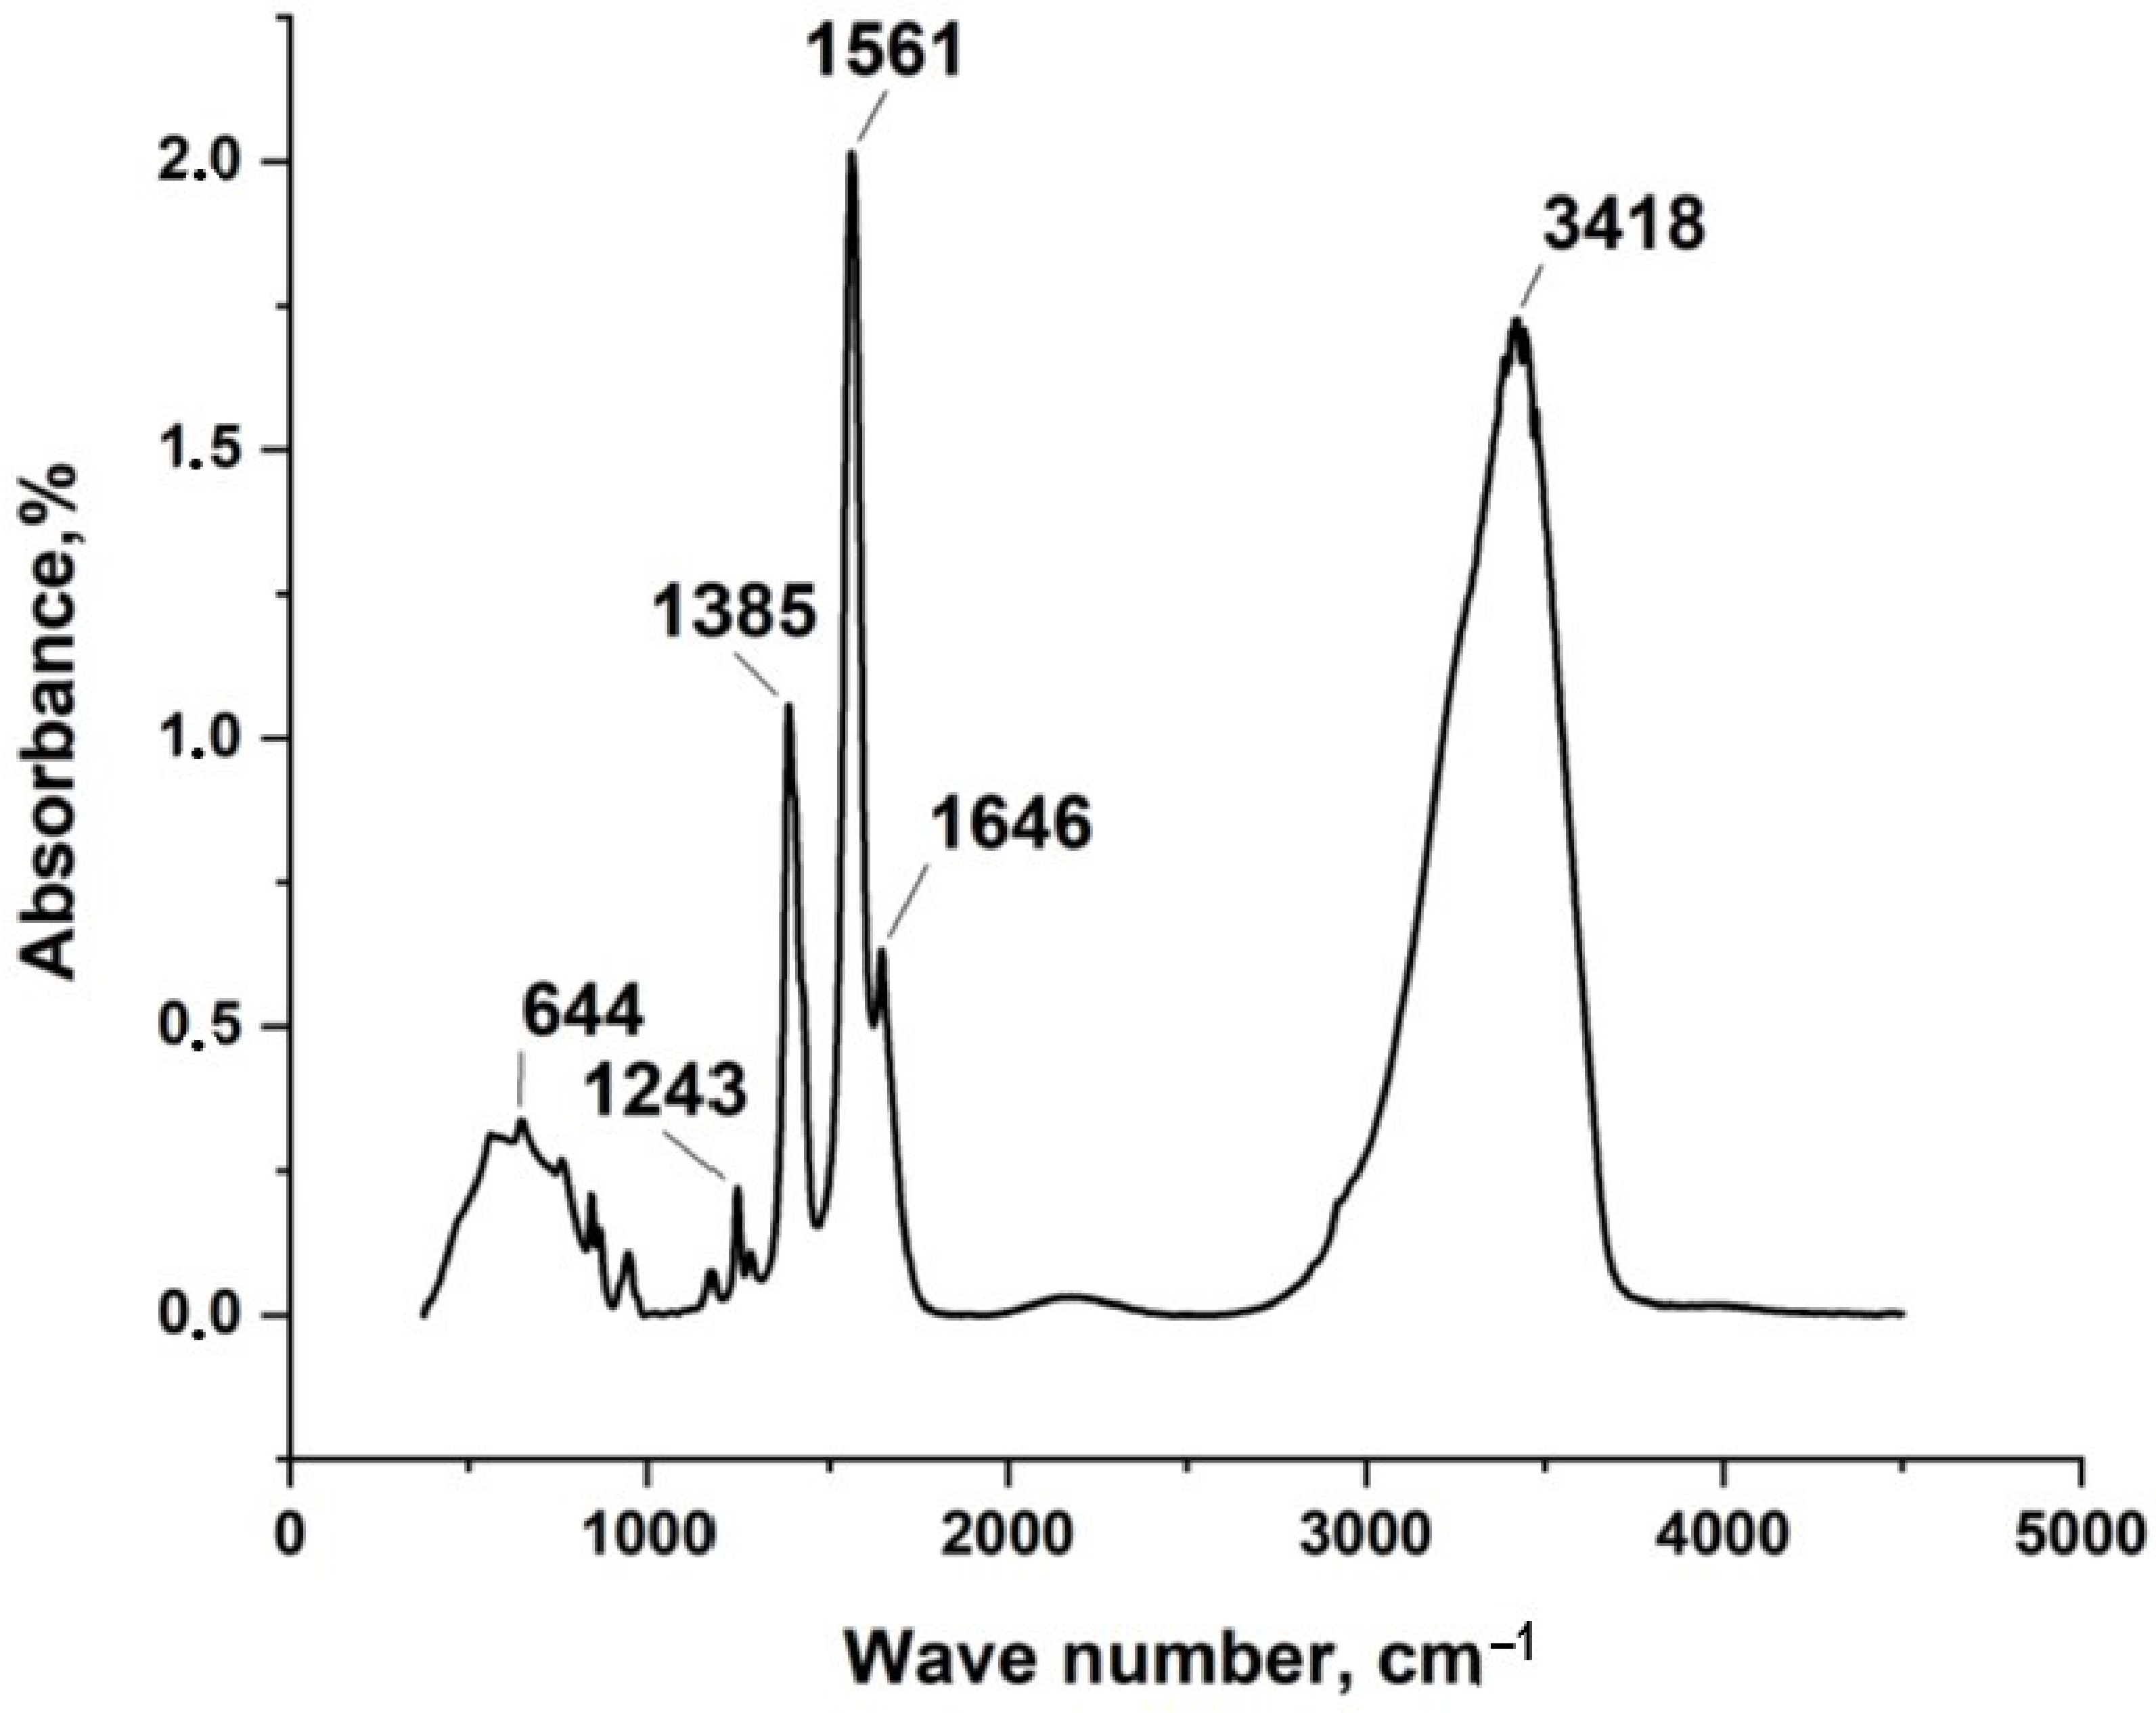
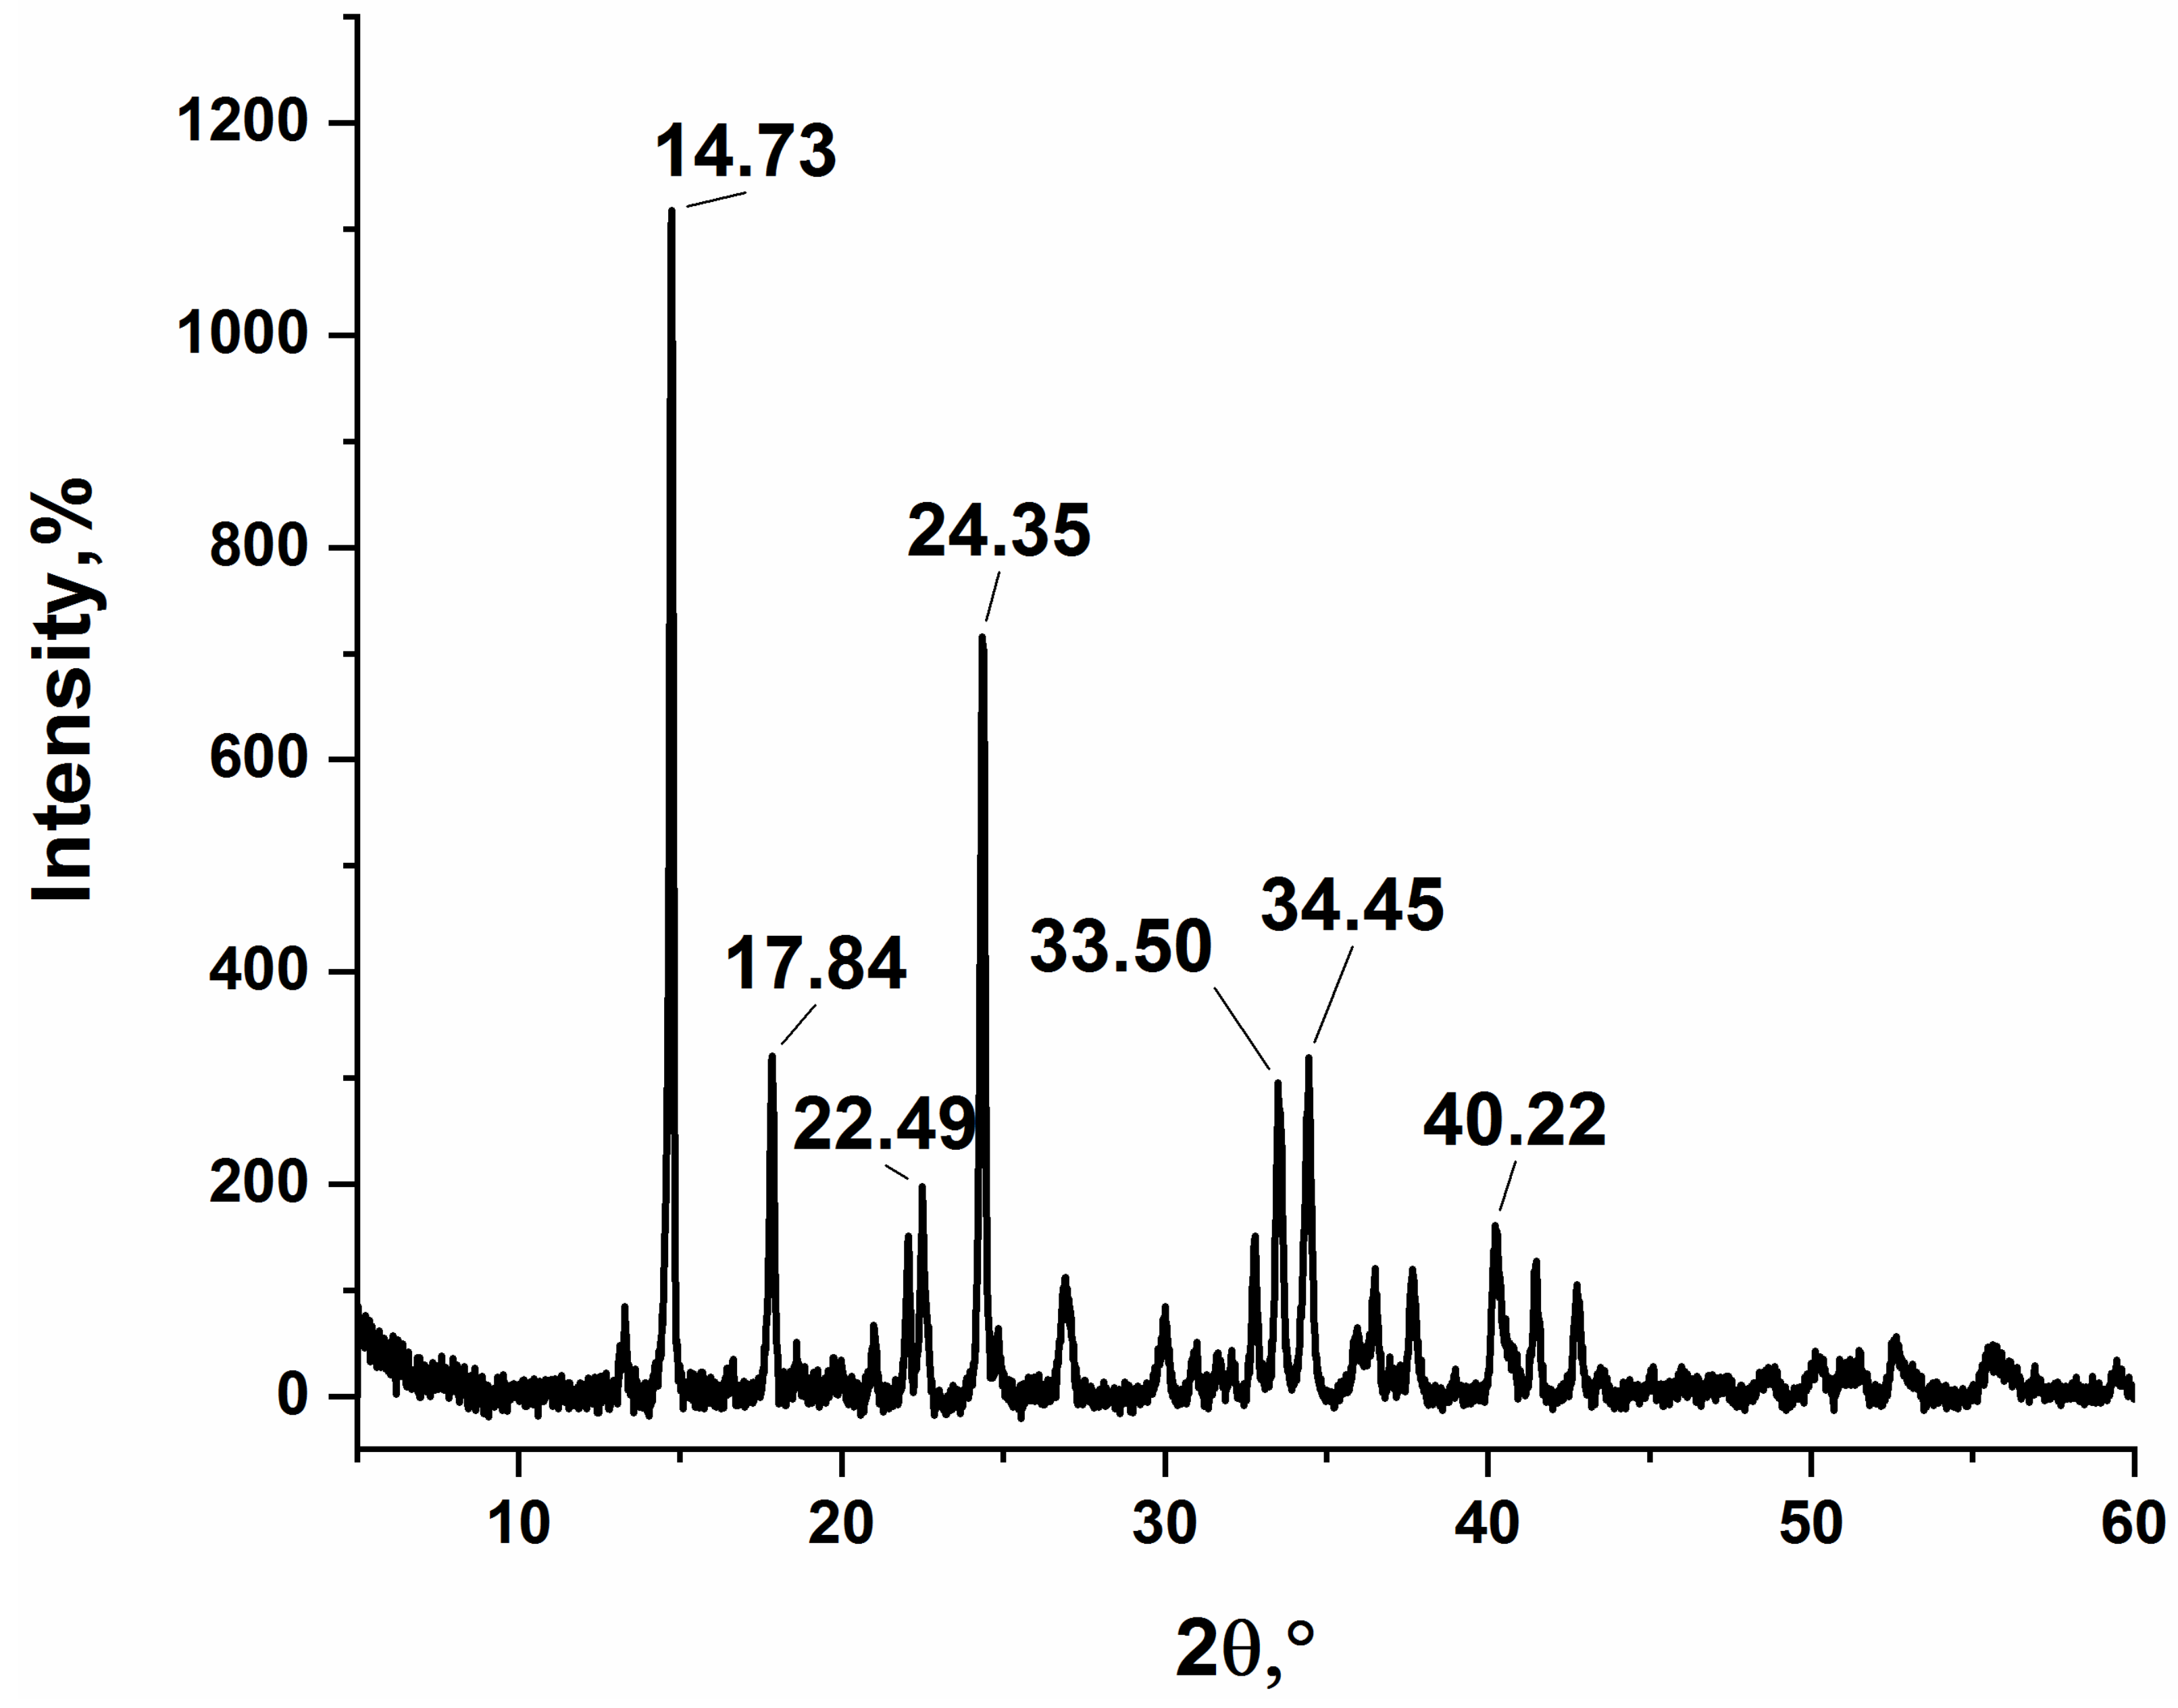
3.1. Synthesis and Characterization of Silver Itaconate
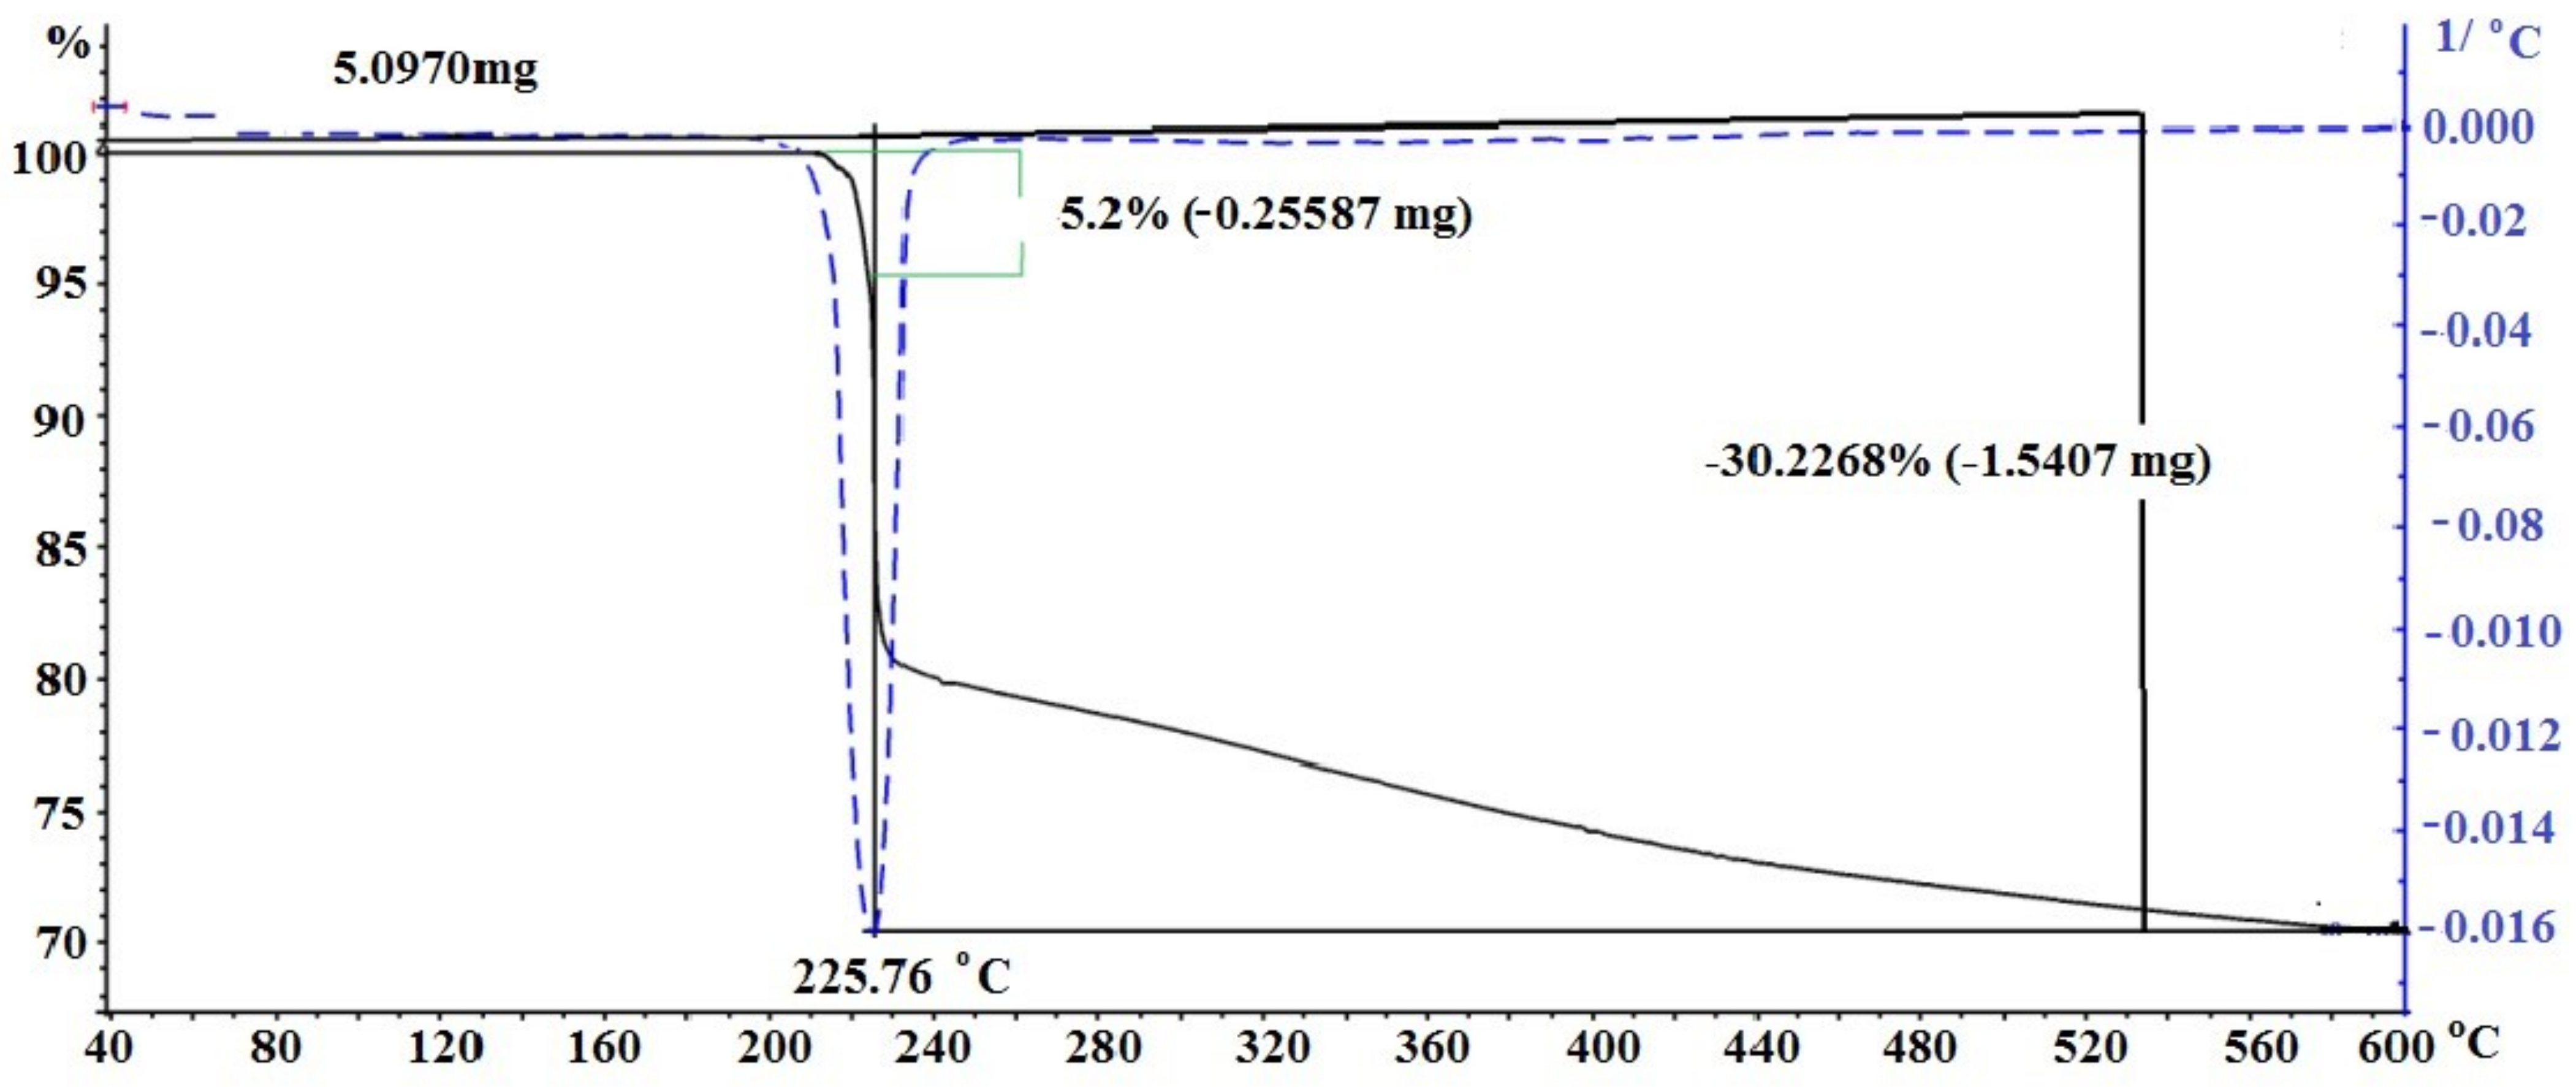
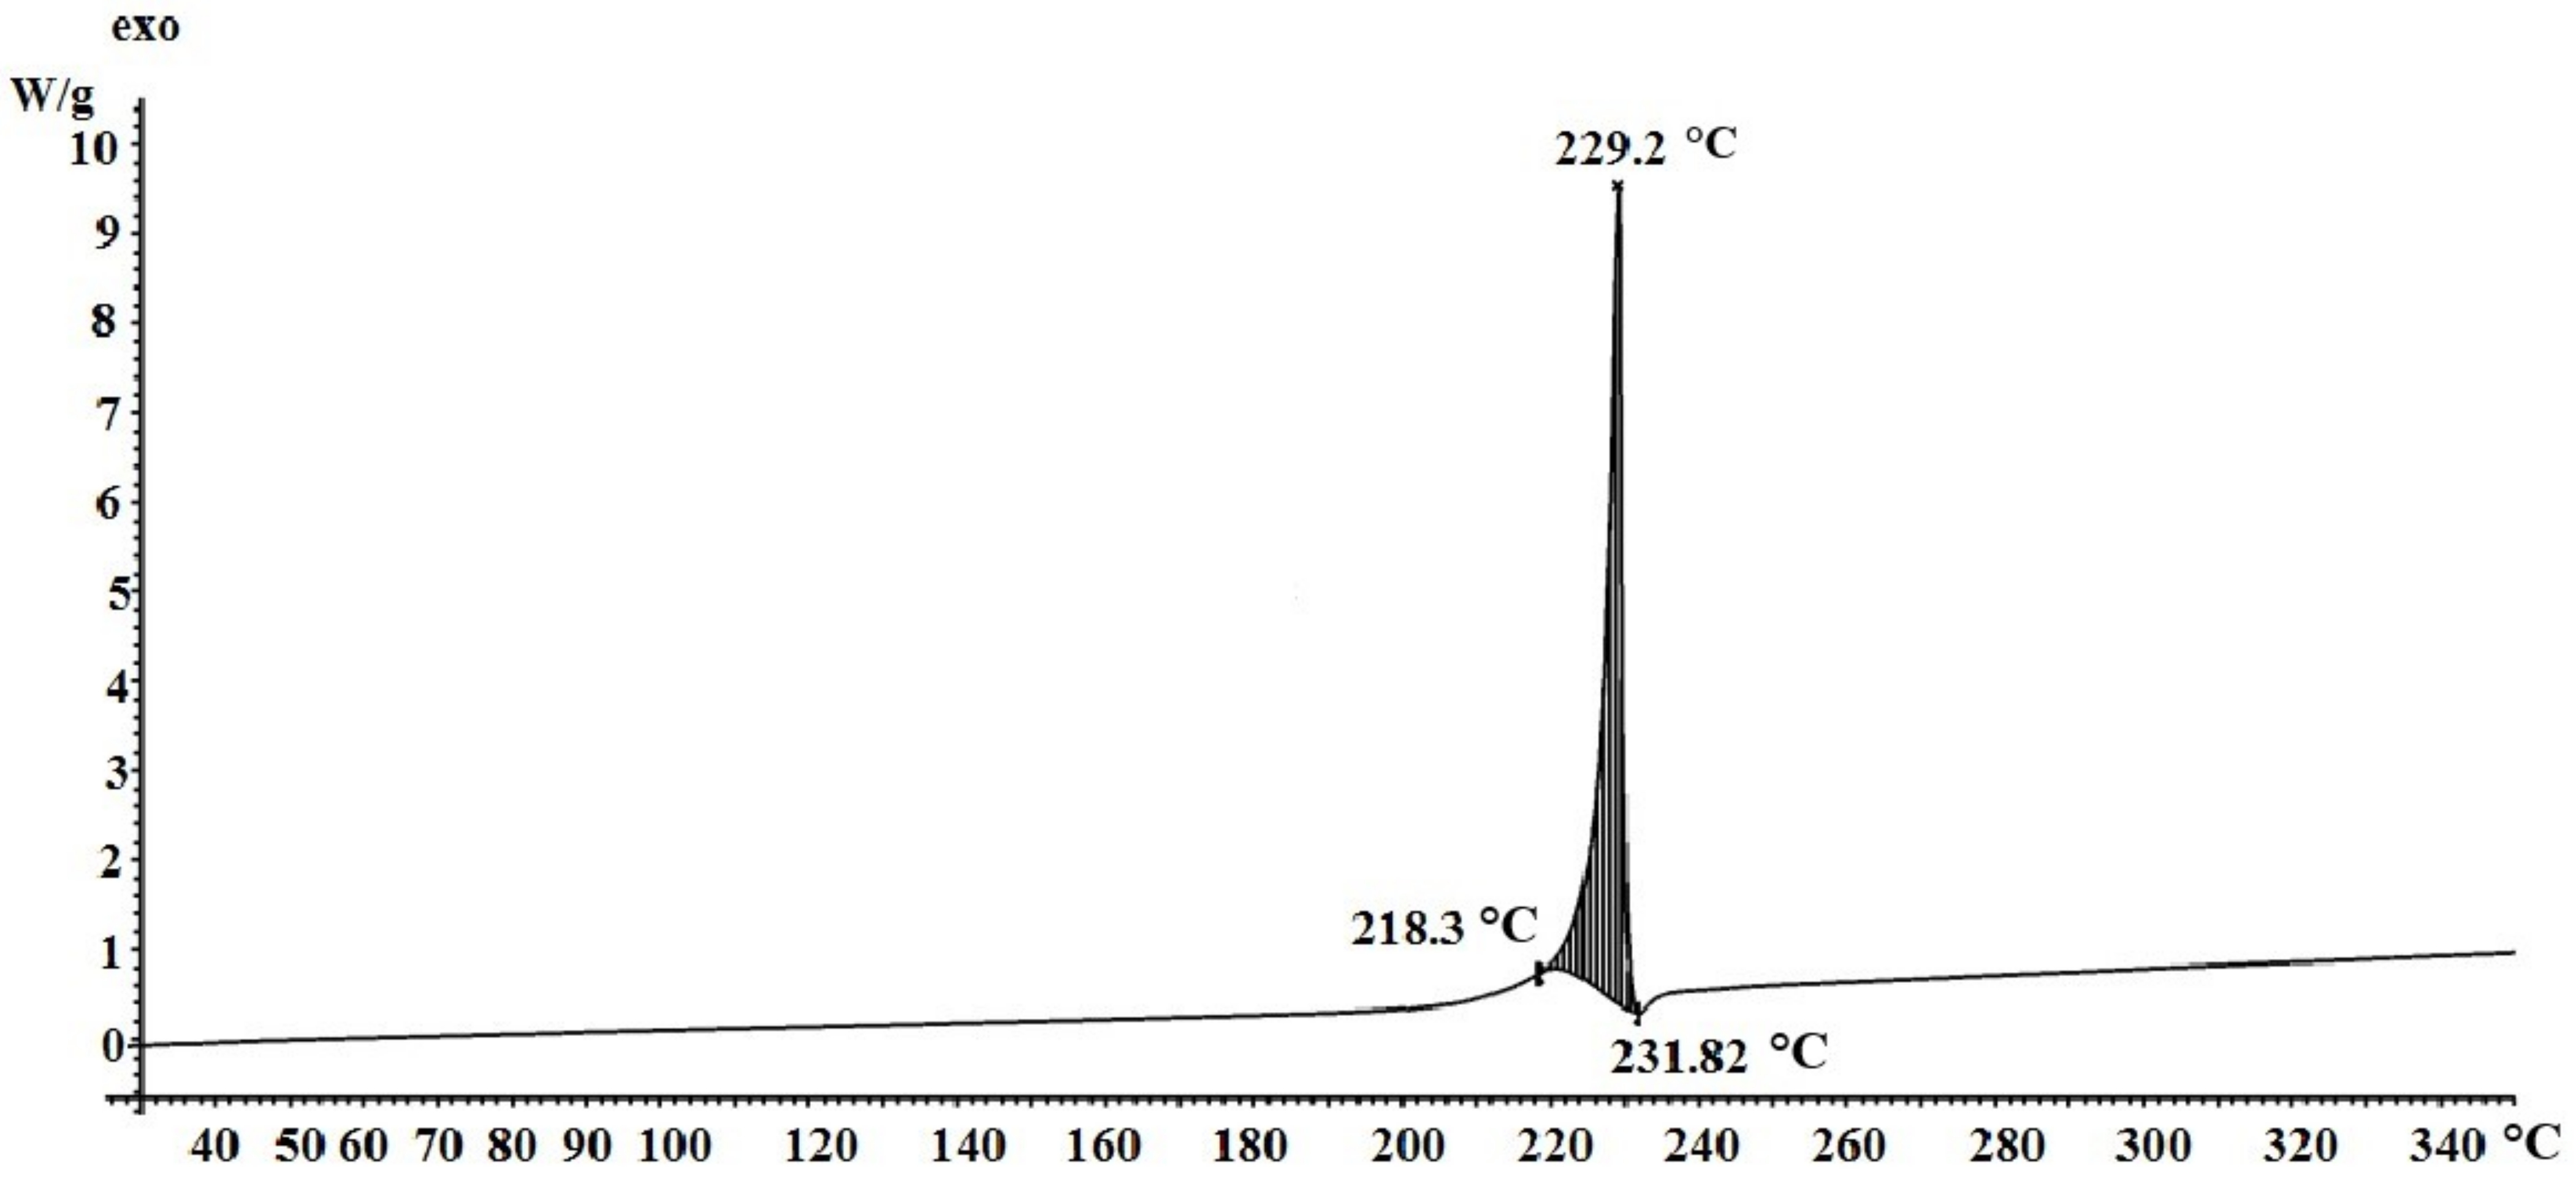
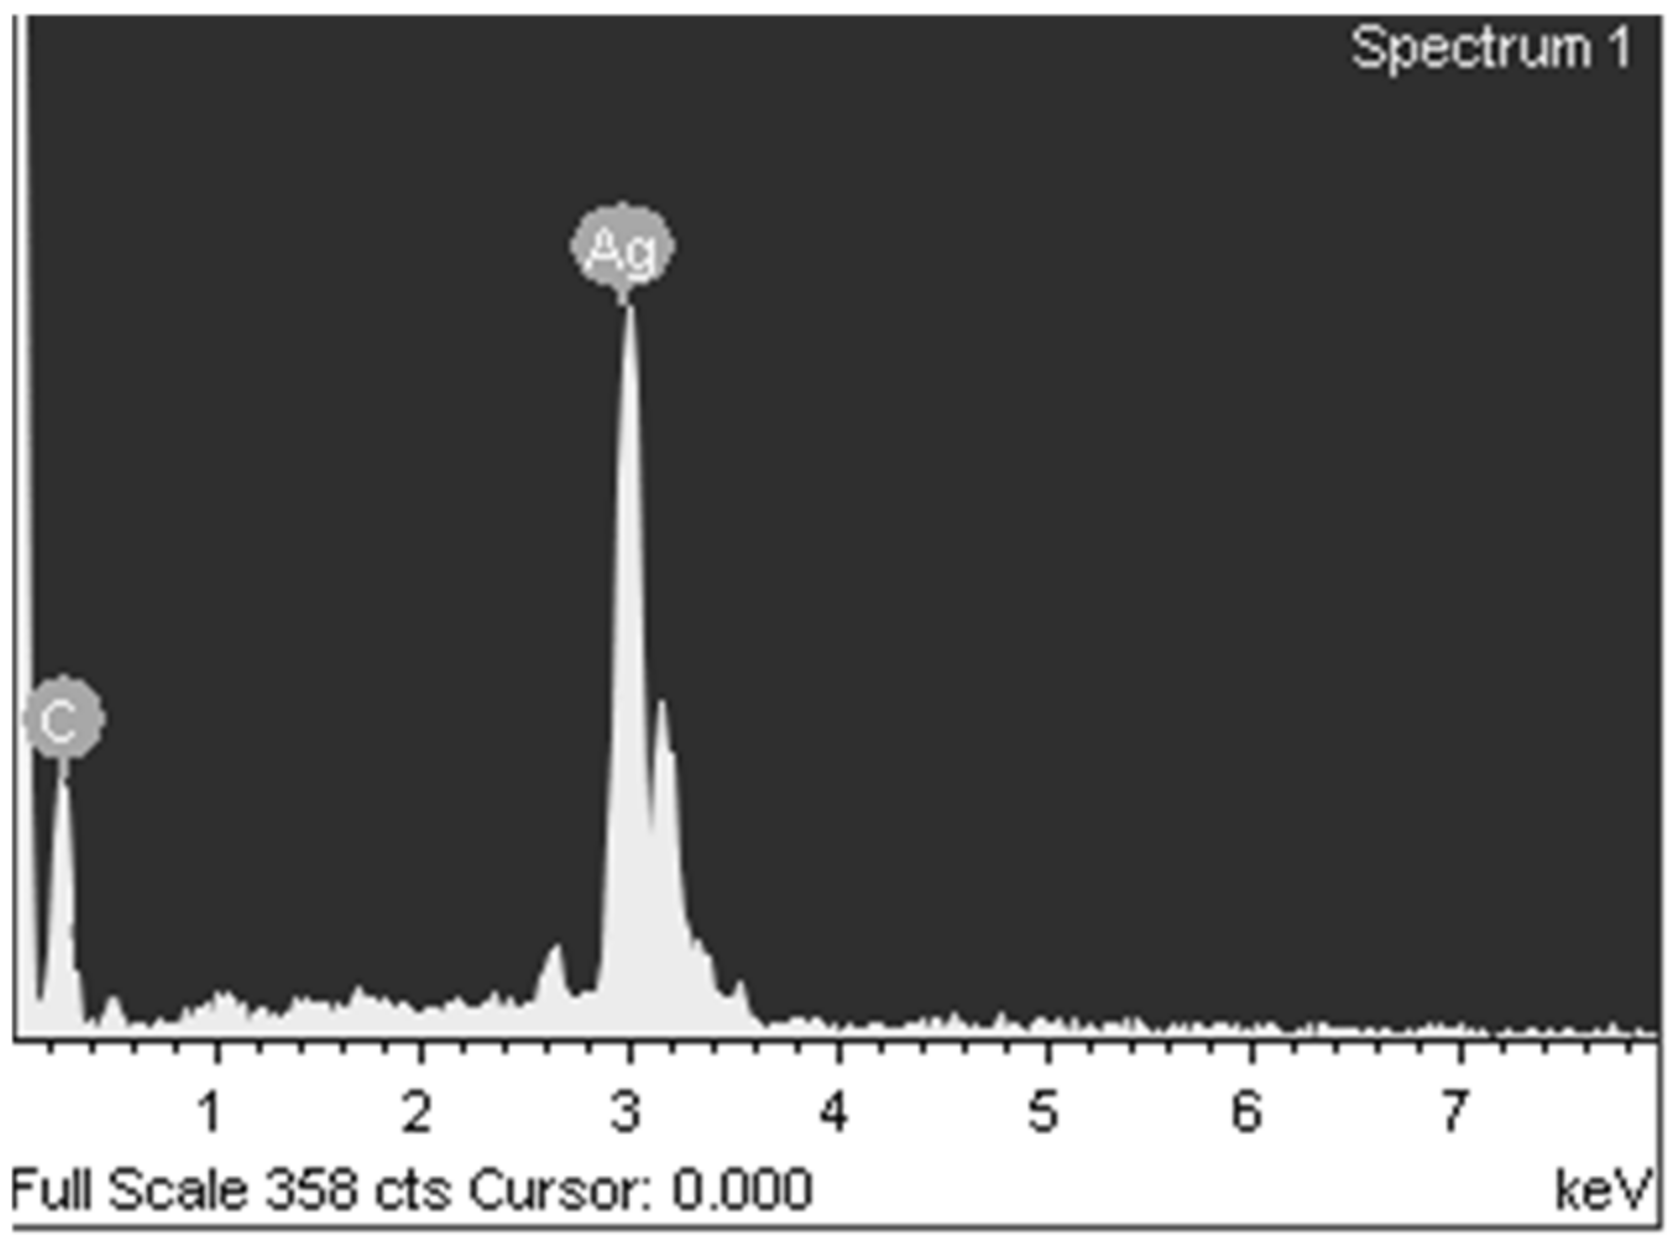
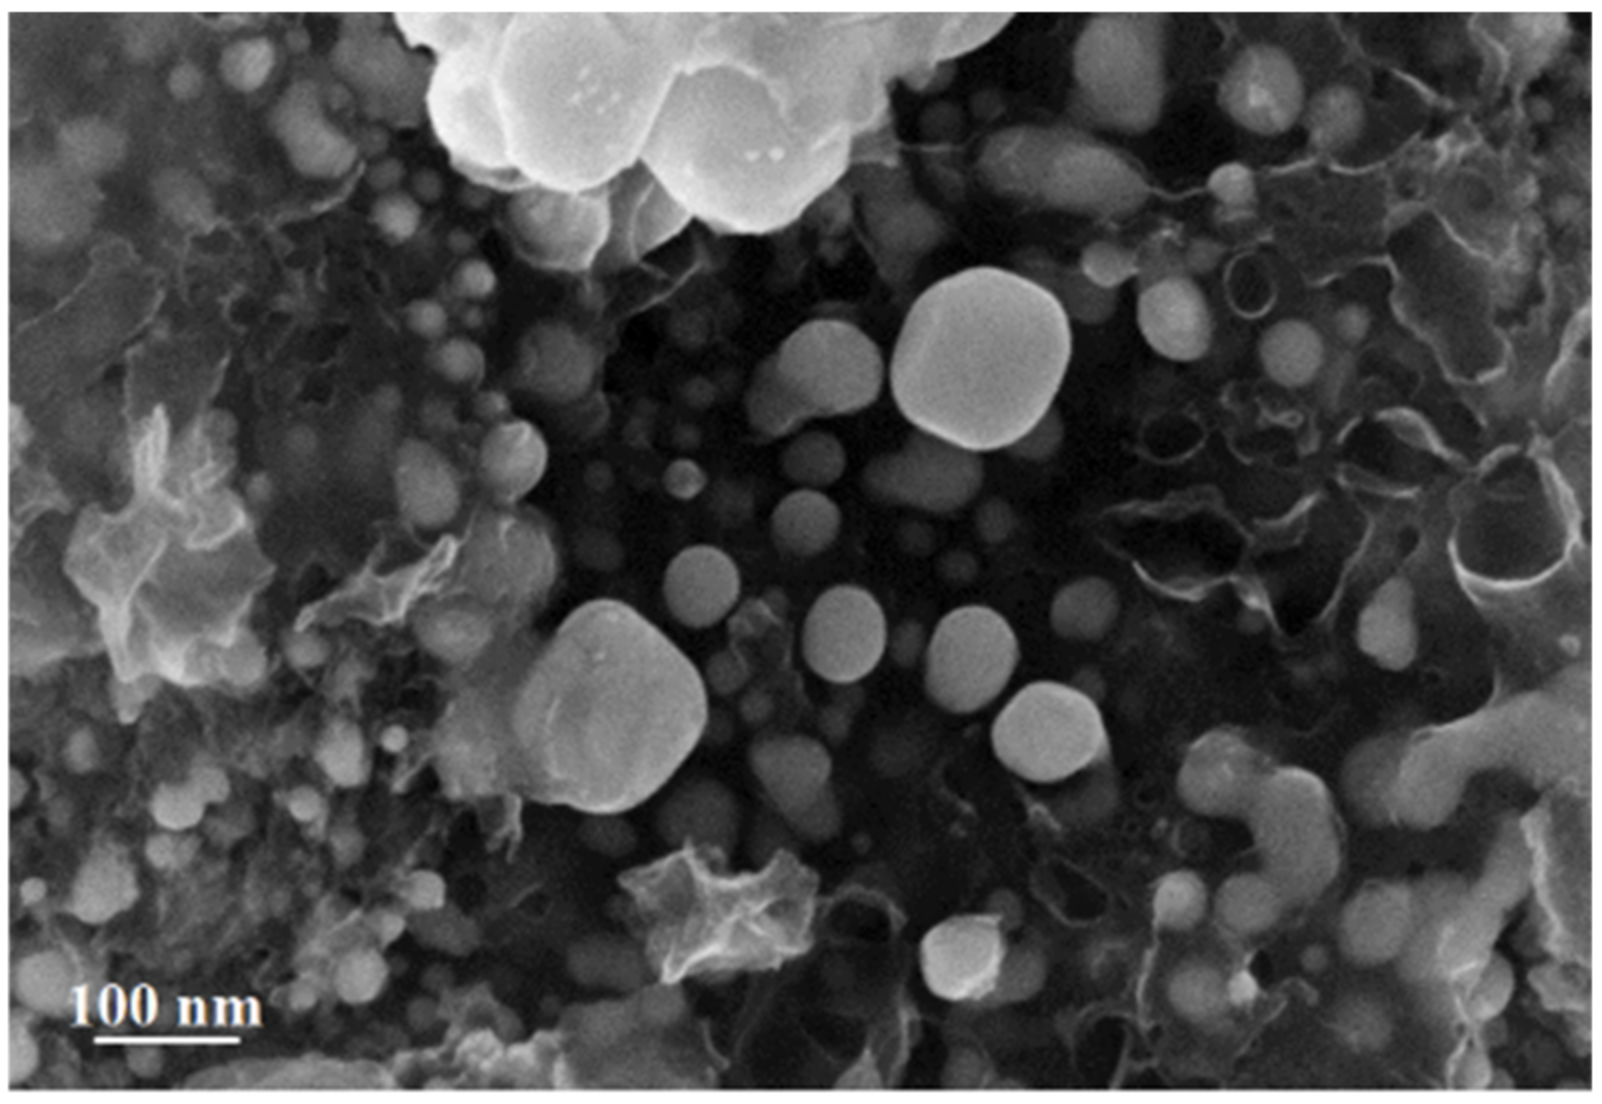
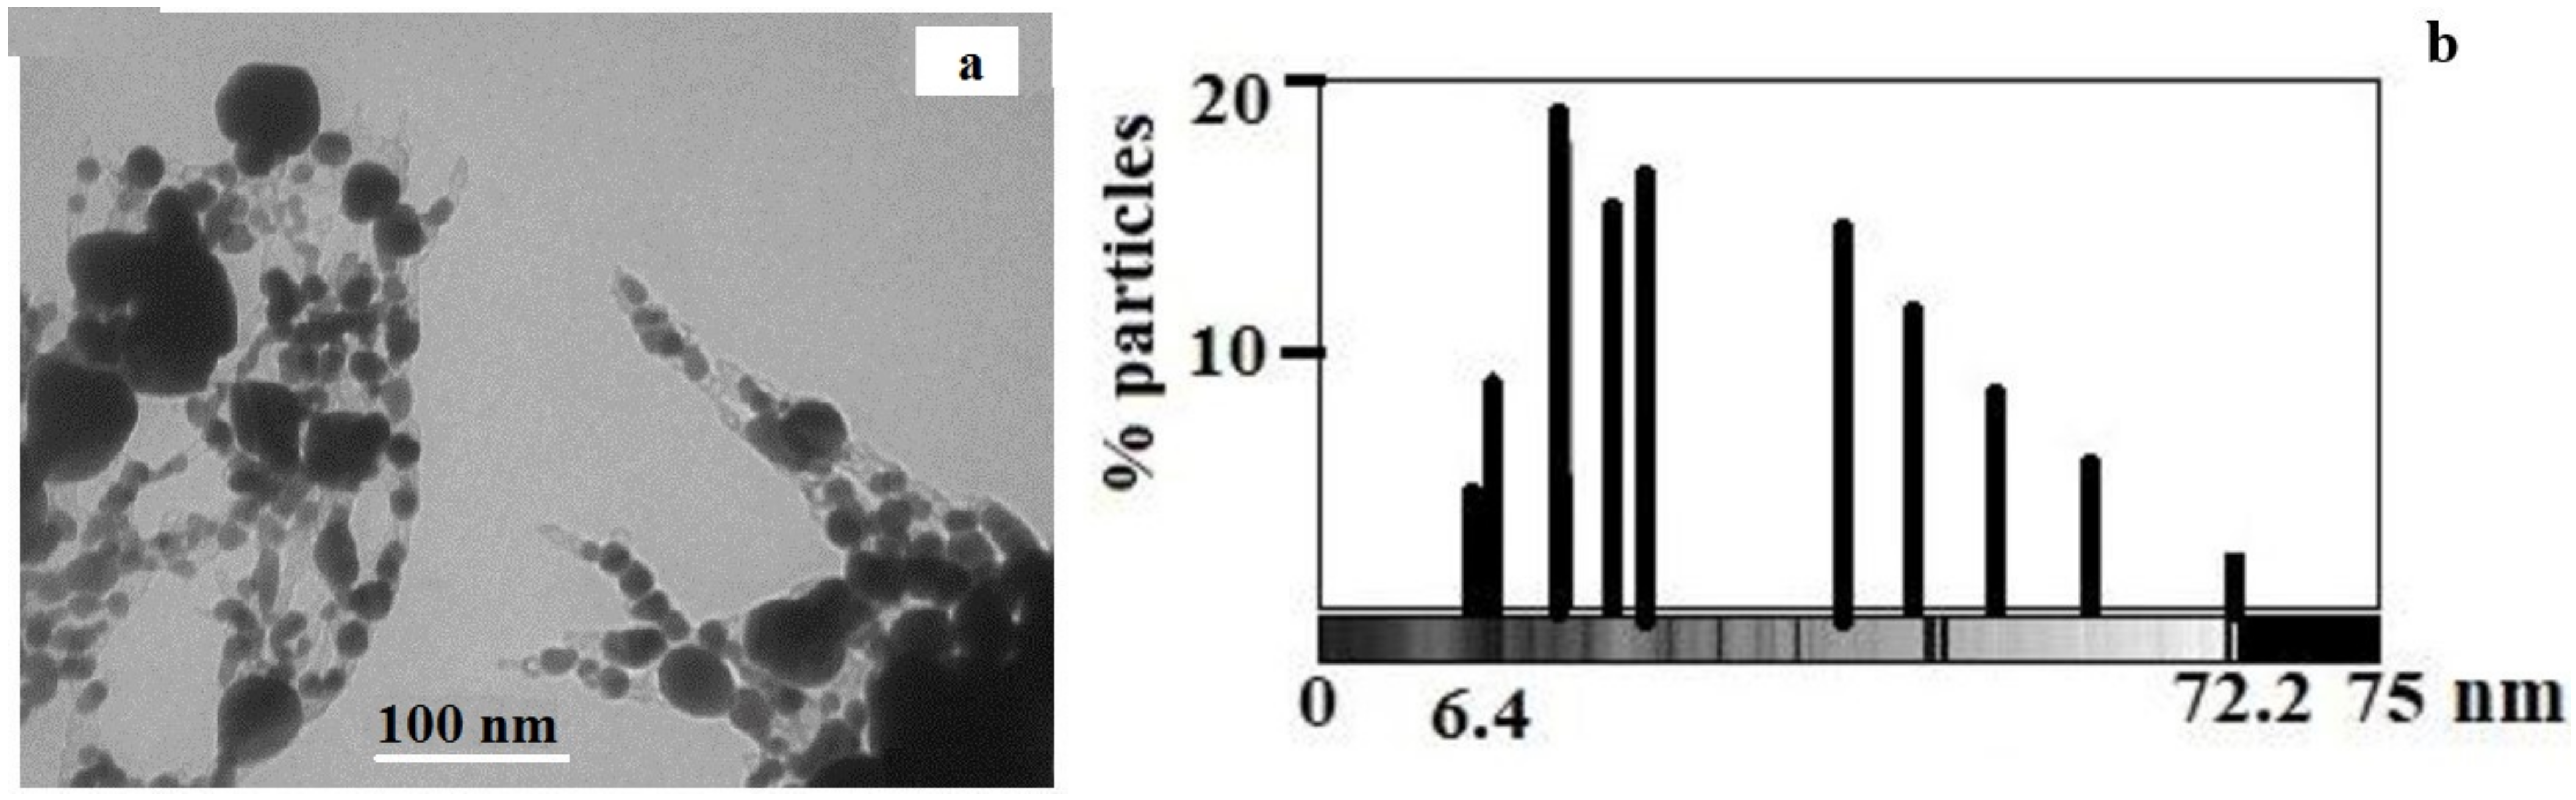
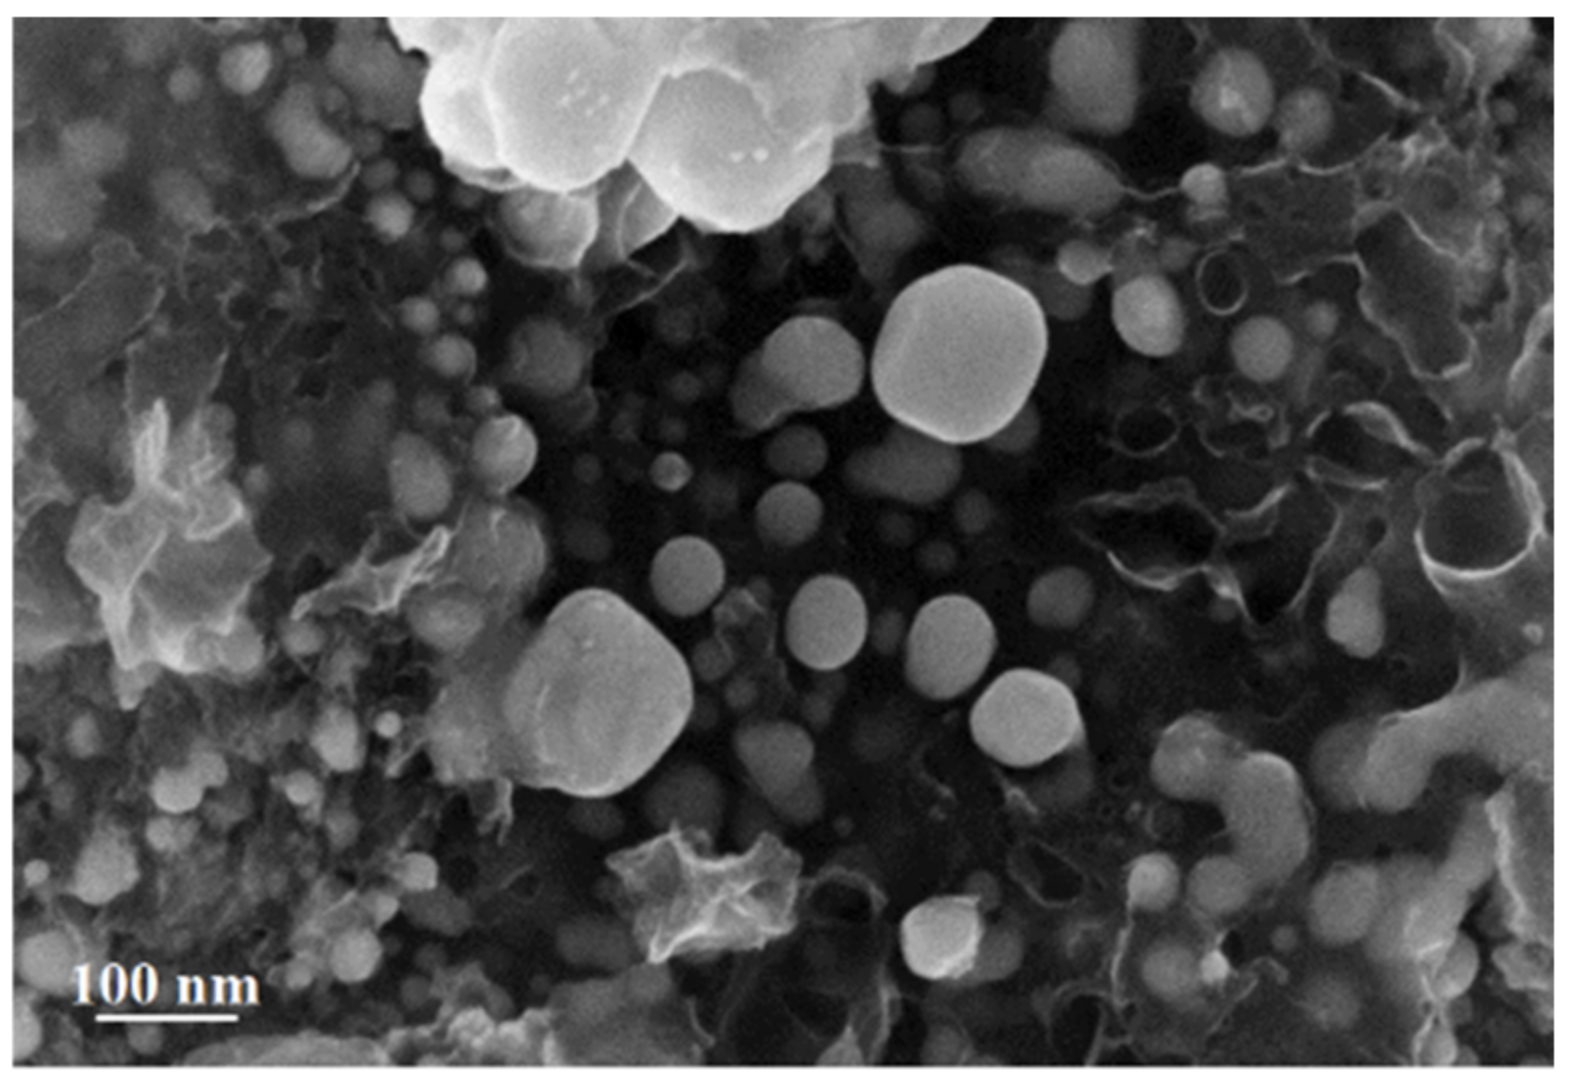
3.2. Study of Silver Itaconate Thermolysis Products
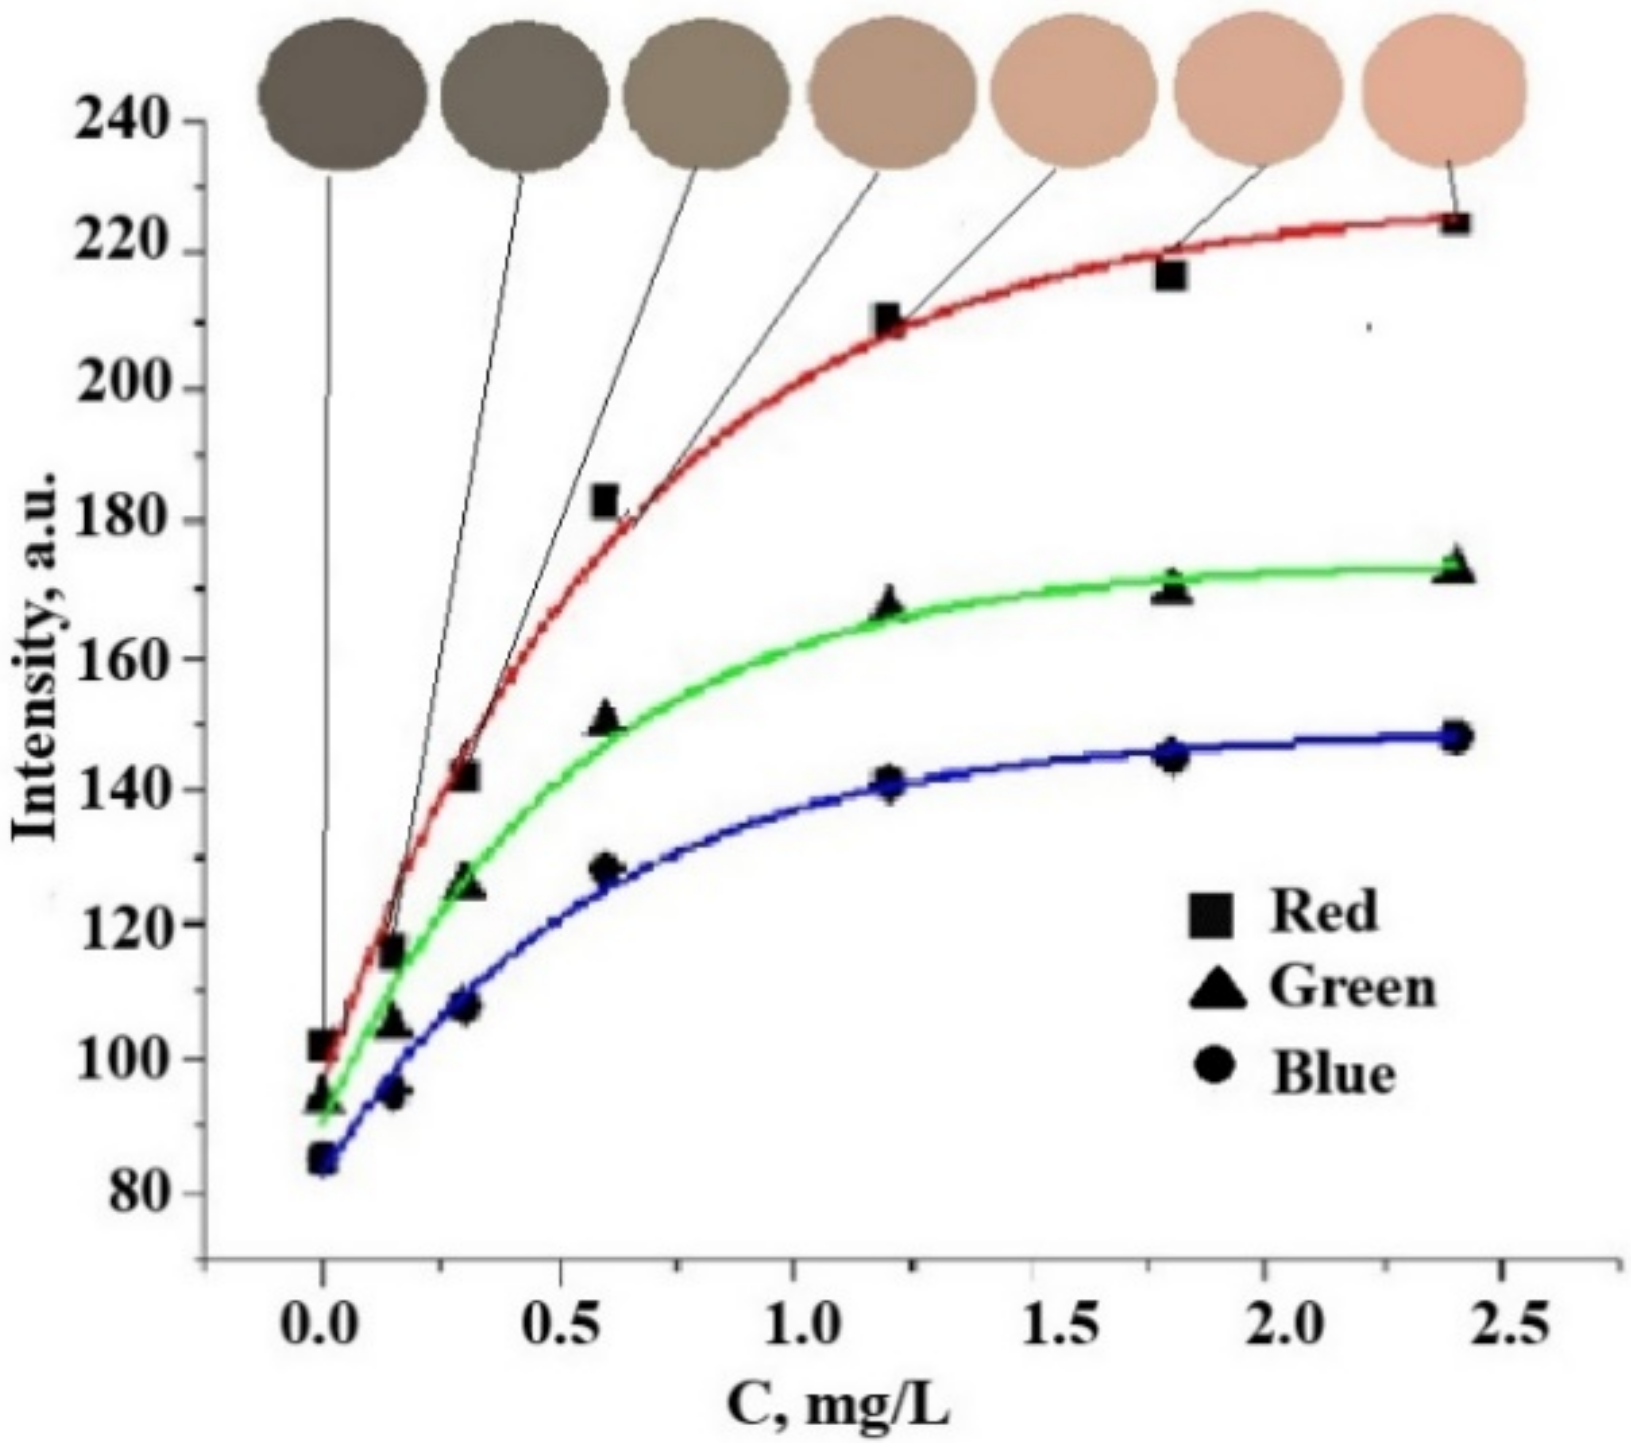
3.3. Determination of Chloride Ions
3.4. Use of the Obtained Nanocomposites for Adsorption of Chloride Ions
4. Conclusions
Author Contributions
Funding
Institutional Review Board Statement
Informed Consent Statement
Data Availability Statement
Conflicts of Interest
References
- Dzhardimalieva, G.I.; Uflyand, I.E. Review: Recent advances in the chemistry of metal chelate monomers. J. Coord. Chem. 2017, 70, 1468–1527. [Google Scholar] [CrossRef]
- Dzhardimalieva, G.I.; Uflyand, I.E. Metal Chelate Monomers as Precursors of Polymeric Materials. J. Inorg. Organomet. Polym. Mater. 2016, 26, 1112–1173. [Google Scholar] [CrossRef]
- Whittell, G.R.; Hager, M.D.; Schubert, U.S.; Manners, I. Functional soft materials from metallopolymers and metallosupramolecular polymers. Nat. Mater. 2011, 10, 176–188. [Google Scholar] [CrossRef] [PubMed]
- Dzhardimalieva, G.I.; Yadav, B.C.; Singh, S.; Uflyand, I.E. Self-healing and shape memory metallopolymers: State-of-the-art and future perspectives. Dalton Trans. 2020, 49, 3042–3087. [Google Scholar] [CrossRef]
- Pomogailo, A.D.; Dzhardimalieva, G.I. Nanostructured Materials Preparation via Condensation Ways; Springer: Dordrecht, The Netherlands, 2014. [Google Scholar]
- Dell’Anna, M.M.; Romanazzi, G.; Mastrorilli, P. Polymer Supported Catalysts Obtained from Metal-Containing Monomers. Curr. Org. Chem. 2013, 17, 1236–1273. [Google Scholar]
- Chekhomova, O.A.; Klepov, V.V.; Pushkin, D.V.; Alekseev, E.V.; Vologzhanina, A.V.; Serezhkina, L.B.; Serezhkin, V.N. Structural features of uranyl acrylate complexes with s-, p-, and d-monovalent metals. Z. Kristallogr. Cryst. Mater. 2019, 234, 247–256. [Google Scholar] [CrossRef]
- Dzhardimalieva, G.I.; Pomogailo, A.D. Macromolecular metal carboxylates. Russ. Chem. Rev. 2008, 77, 259–301. [Google Scholar] [CrossRef]
- Dzhardimalieva, G.I.; Semenov, S.A.; Knerelman, E.I.; Davydova, G.I.; Kydralieva, K.A. Preparation and Reactivity of Metal-Containing Monomers. 78. Scandium-Containing Monomers and Polymers: Synthesis, Structure and Properties. J. Inorg. Organomet. Polym. Mater. 2016, 26, 1441–1451. [Google Scholar] [CrossRef]
- Porollo, N.P.; Aliev, Z.G.; Dzhardimalieva, G.I.; Ivleva, I.N.; Uflyand, I.E.; Pomogailo, A.D.; Ovanesyan, N.S. Synthesis and reactivity of metal-containing monomers 47. Synthesis and structure of salts of unsaturated dicarboxylic acid. Russ. Chem. Bull. 1997, 46, 362–370. [Google Scholar] [CrossRef]
- Shershnev, V.; Kudryavtsev, P.; Knerelman, E.; Davydova, G.; Zarrelli, M.; Dzhardimalieva, G. Core-shell nanocomposites produced from metal dicarboxylates. Mater. Today Proc. 2021, 34, 235–238. [Google Scholar] [CrossRef]
- Semenov, S.A.; Musatova, V.Y.; Drobot, D.V.; Dzhardimalieva, G.I. Thermal Decomposition of Acidic Cobalt(II) Carboxylates with Unsaturated Dicarboxylic Anions. Russ. J. Inorg. Chem. 2020, 65, 61–68. [Google Scholar] [CrossRef]
- Semenov, S.A.; Musatova, V.Y.; Drobot, D.V.; Dzhardimalieva, G.I. Nickel Itaconate Thermolysis. Russ. J. Inorg. Chem. 2019, 64, 786–797. [Google Scholar] [CrossRef]
- Young, A.G.; Hanton, L.R. Square planar silver(I) complexes: A rare but increasingly observed stereochemistry for silver(I). Coord. Chem. Rev. 2008, 252, 1346–1386. [Google Scholar] [CrossRef]
- Carlucci, L.; Ciani, G.; Proserpio, D.M. Polycatenation, polythreading and polyknotting in coordination network chemistry. Coord. Chem. Rev. 2003, 246, 247–289. [Google Scholar] [CrossRef]
- Yeşilel, O.Z.; Günay, G.; Darcan, C.; Soylu, M.S.; Keskind, S.; Ng, S.W. An unusual 3D metal–organic framework, {[Ag4(μ4-pzdc)2(μ-en)2]·H2O}n: C–H⋯Ag, N–H⋯Ag and (O–H) Ag interactions and an unprecedented coordination mode for pyrazine-2,3-dicarboxylate. CrystEngComm 2012, 14, 2817–2825. [Google Scholar] [CrossRef]
- Nagarathinam, M.; Vittal, J.J. Anisotropic Movements of Coordination Polymers upon Desolvation: Solid-State Transformation of a Linear 1D Coordination Polymer to a Ladderlike Structure. Angew. Chem. Int. Ed. 2006, 45, 4337–4341. [Google Scholar] [CrossRef]
- Li, B.; Ji, C.; Zang, S.; Hou, H.; Mak, T.C.W. Benzenepolycarboxylate-templated assembly of silver coordination polymers exhibiting argentophilic honeycomb layer and tubular motifs. Dalton Trans. 2012, 41, 9151–9153. [Google Scholar] [CrossRef]
- Eckhardt, S.; Brunetto, P.S.; Gagnon, J.; Priebe, M.; Giese, B.; Fromm, K.M. Nanobio Silver: Its Interactions with Peptides and Bacteria, and Its Uses in Medicine. Chem. Rev. 2013, 113, 4708–4754. [Google Scholar] [CrossRef] [Green Version]
- Horcajada, P.; Gref, R.; Baati, T.; Allan, P.K.; Maurin, G.; Couvreur, P.; Férey, G.; Morris, R.E.; Serre, C. Metal-organic frameworks in biomedicine. Chem. Rev. 2012, 112, 1232–1268. [Google Scholar] [CrossRef]
- Nomiya, K.; Takahashi, S.; Noguchi, R. Synthesis and crystal structure of a hexanuclear silver(I) cluster [Ag(Hmna)]6·4H2O (H2mna = 2-mercaptonicotinic acid) and a supramolecular gold(I) complex H[Au(Hmna)2] in the solid state, and their antimicrobial activities. J. Chem. Soc. Dalton Trans. 2000, 2091–2097. [Google Scholar] [CrossRef]
- McCann, M.; Curran, R.; Ben-Shoshan, M.; McKee, V.; Tahir, A.A.; Devereux, M.; Kavanagh, K.; Creaven, B.S.; Kellett, A. Silver(I) complexes of 9-anthracenecarboxylic acid and imidazoles: Synthesis, structure and antimicrobial activity. Dalton Trans. 2012, 41, 6516–6527. [Google Scholar] [CrossRef]
- Nomiya, K.; Tsuda, K.; Sutoh, T.; Oda, M. Ag(I)-N bond-containing compound showing wide spectra in effective antimicrobial activities: Polymeric silver(I) imidazolate. J. Inorg. Biochem. 1997, 68, 39–44. [Google Scholar] [CrossRef]
- Jones, S.A.; Bowler, P.G.; Walker, M.; Parsons, D. Controlling wound bioburden with a novel silver-containing Hydrofiber dressing. Wound Repair Regen. 2004, 12, 288–294. [Google Scholar] [CrossRef]
- Shah, M.S.A.S.; Nag, M.; Kalagara, T.; Singh, S.; Manorama, S.V. Silver on PEG-PU-TiO2 Polymer Nanocomposite Films: An Excellent System for Antibacterial Applications. Chem. Mater. 2008, 20, 2455–2460. [Google Scholar] [CrossRef]
- Chernousova, S.; Epple, M. Silver as Antibacterial Agent: Ion, Nanoparticle, and Metal. Angew. Chem. Int. Ed. 2012, 51, 1636–1663. [Google Scholar] [CrossRef] [PubMed]
- Yang, W.; Wang, C.; Arrighi, V. Preparation and Characterization of Organic Silver Precursors for Conductive Ink. Int. J. Electron. Commun. 2018, 12, 670–677. [Google Scholar]
- Do, J.; Lee, Y.; Kang, J.; Jacobson, A.J. A twofold interpenetrating network constructed from silver ions coordinated to fumaric acid and pyrazine: Ag2(fum)(H2fum)(pyz)2 (fum = fumarate, pyz = pyrazine). Inorg. Chim. Acta 2012, 382, 191–194. [Google Scholar] [CrossRef]
- Li, X.; Wang, Y.; Li, Y.; Gou, Y.; Wang, Q. Synthesis, Characterization and Biological Evaluation of Two Silver(I) trans-Cinnamate Complexes as Urease Inhibitors. Z. Anorg. Allg. Chem. 2014, 640, 423–428. [Google Scholar] [CrossRef]
- Mohamed, M.A.; Mansour, S.A.A.; Hussien, G.A.M. Non-isothermal decomposition of silver maleate dihydrate and anhydrous silver fumarate. J. Therm. Anal. 1994, 41, 405–417. [Google Scholar] [CrossRef]
- Smith, G.; Sagatys, D.S.; Dahlgren, C.; Lynch, D.E.; Bott, R.C.; Byriel, K.A.; Kennard, C.H.L. Structures of the silver (I) complexes with maleic and fumaric acids: Silver(I) hydrogen maleate, silver(I) maleate and silver (I) fumarate. Z. Krist. New Cryst. Struct. 1995, 210, 44–48. [Google Scholar] [CrossRef]
- You, Z.-L.; Zhu, H.-L.; Liu, W.-S. catena-Poly[[silver(I)-μ-hexane-1,6-diamine-k2N:N′] cinnamate dihydrate]. Acta Cryst. 2004, C60, m231–m232. [Google Scholar]
- Dzhardimalieva, G.I.; Uflyand, I.E. Conjugated Thermolysis of Metal-Containing Monomers: Toward Core–Shell Nanostructured Advanced Materials. J. Inorg. Organomet. Polym. Mater. 2020, 30, 88–110. [Google Scholar] [CrossRef]
- Uflyand, I.E.; Dzhardimalieva, G.I. Nanomaterials Preparation by Thermolysis of Metal Chelates; Springer: Cham, Switzerland, 2018. [Google Scholar]
- Morones, J.R.; Elechiguerra, J.L.; Camacho, A.; Holt, K.; Kouri, J.B.; Ramírez, J.T.; Yacaman, M.J. The bactericidal effect of silver nanoparticles. Nanotechnology 2005, 16, 2346. [Google Scholar] [CrossRef] [PubMed]
- Dror-Ehre, A.; Mamane, H.; Belenkova, T.; Markovich, G.; Adin, A. Silver nanoparticle–E. coli colloidal interaction in water and effect on E. coli survival. J. Colloid Interface Sci. 2009, 339, 521–526. [Google Scholar] [CrossRef]
- Li, W.; Shi, Q.; Chen, Y.B.; Ouyang, Y.-S.; Duan, S.-S. Antifungal effects of citronella oil against Aspergillus niger ATCC 16404. Appl. Microbiol. Biotechnol. 2013, 97, 7483–7492. [Google Scholar] [CrossRef]
- Sharma, V.K.; Yngard, R.A.; Lin, Y. Silver nanoparticles: Green synthesis and their antimicrobial activities. Adv. Colloid Interface Sci. 2009, 145, 83–96. [Google Scholar] [CrossRef]
- Vasileva, P.; Donkova, B.; Karadjova, I.; Dushkin, C. Synthesis of starch-stabilized silver nanoparticles and their application as a surface plasmon resonance-based sensor of hydrogen peroxide. Colloids Surf. A 2011, 382, 203–210. [Google Scholar] [CrossRef]
- Seo, Y.; Hwang, J.; Kim, J.; Jeong, Y.; Hwang, M.P.; Choi, J. Antibacterial activity and cytotoxicity of multi-walled carbon nanotubes decorated with silver nanoparticles. Int. J. Nanomed. 2014, 9, 4621–4629. [Google Scholar]
- Gorbunova, M.O.; Apyari, V.V.; Baulina, A.A.; Garshina, M.S.; Kulyaginova, M.S.; Shevchenko, A.V.; Furletov, A.A.; Dmitrienko, S.G.; Zolotov, Y.A. An improved step-by-step airflow/paper-based colorimetric method for highly selective determination of halides in complex matrices. Talanta 2020, 219, 121254. [Google Scholar] [CrossRef] [PubMed]
- Gorbunova, M.O.; Garshina, M.S.; Kulyaginova, M.S.; Apyari, V.V.; Furletov, A.A.; Garshev, A.V.; Dmitrienko, S.G.; Zolotov, Y.A. A dynamic gas extraction-assisted paper-based method for colorimetric determination of bromides. Anal. Methods 2020, 12, 587–594. [Google Scholar] [CrossRef]
- Gorbunova, M.O.; Baulina, A.A.; Kulyaginova, M.S.; Apyari, V.V.; Furletov, A.A.; Garshev, A.V.; Dmitrienko, S.G. Determination of iodide based on dynamic gas extraction and colorimetric detection by paper modified with silver triangular nanoplates. Microchem. J. 2019, 145, 729–736. [Google Scholar] [CrossRef]
- Gorbunova, M.O.; Bayan, E.M. A novel paper-based sensor for determination of halogens and halides by dynamic gas extraction. Talanta 2019, 199, 513–521. [Google Scholar] [CrossRef] [PubMed]
- Gorbunova, M.O.; Baulina, A.A.; Kulyaginova, M.S.; Apyari, V.V.; Furletov, A.A.; Volkov, P.A.; Bochenkov, V.E.; Starukhin, A.S.; Dmitrienko, S.G. Dynamic gas extraction of iodine in combination with a silver triangular nanoplate-modified paper strip for colorimetric determination of iodine and of iodine-interacting compounds. Microchim. Acta 2019, 186, 188. [Google Scholar] [CrossRef] [PubMed]
- Apyari, V.V.; Gorbunova, M.O.; Shevchenko, A.V.; Furletov, A.A.; Volkov, P.A.; Garshev, A.V.; Dmitrienko, S.G.; Zolotov, Y.A. Towards highly selective detection using metal nanoparticles: A case of silver triangular nanoplates and chlorine. Talanta 2018, 176, 406–411. [Google Scholar] [CrossRef] [PubMed]
- Gorbunova, M.O.; Shevchenko, A.V.; Apyari, V.V.; Furletov, A.A.; Volkov, P.A.; Garshev, A.V.; Dmitrienko, S.G. Selective determination of chloride ions using silver triangular nanoplates and dynamic gas extraction. Sens. Actuators B 2018, 256, 699–705. [Google Scholar] [CrossRef]
- Apyari, V.V.; Furletov, A.A.; Garshev, A.V.; Volkov, P.A.; Gorbunova, M.O.; Shevchenko, A.V. Preparation of Reagent Indicator Papers with Silver Triangular Nanoplates for Chemical Analysis. Mosc. Univ. Chem. Bull. 2017, 72, 167–173. [Google Scholar] [CrossRef]
- Lupeiko, T.G.; Gorbunova, M.O.; Bayan, E.M. Deep purification of aqueous solutions to remove chromium (III) with industrial carbonate-containing wastes. Russ. J. Appl. Chem. 2001, 74, 1698–1701. [Google Scholar] [CrossRef]
- Lupeiko, T.G.; Bayan, E.M.; Gorbunova, M.O. Use of carbonate-containing industrial waste for treatment of aqueous solutions to remove nickel (II) ions. Russ. J. Appl. Chem. 2004, 77, 83–87. [Google Scholar] [CrossRef]
- Lupeiko, T.G.; Gorbunova, M.O.; Bayan, E.M. Deep purification of aqueous solutions to remove iron(III) with carbonate-containing industrial waste. Russ. J. Appl. Chem. 2004, 77, 79–82. [Google Scholar] [CrossRef]
- Jenkins, R.; Snyder, R.L. Chemical Analysis: Introduction to X-ray Powder Diffractometry; Wiley: Weinheim, Germany, 1996. [Google Scholar]
- Nečas, D.; Klapetek, P. Gwyddion: An open-source software for SPM data analysis. Centr. Eur. J. Phys. 2012, 10, 181–188. [Google Scholar] [CrossRef]
- Yudanova, L.I.; Logvinenko, V.A.; Yudanov, N.F.; Rudina, N.A.; Ishchenko, A.V.; Semyannikov, P.P.; Sheludyakova, L.A.; Alferova, N.I.; Romanenko, A.I.; Anikeev, O.B. Preparation of metal–polymer composites through the thermolysis of Fe(II), Co(II), and Ni(II) maleates. Inorg. Mater. 2013, 49, 1055–1060. [Google Scholar] [CrossRef]
- Apyari, V.V.; Dmitrienko, S.G. Using a digital camera and computer data processing for the determination of organic substances with diazotized polyurethane foams. J. Anal. Chem. 2008, 63, 530–537. [Google Scholar] [CrossRef]
- Xu, L.; Wang, Y.-Y.; Huang, J.; Chen, C.-Y.; Wang, Z.-X.; Xie, H. Silver nanoparticles: Synthesis, medical applications and biosafety. Theranostics 2020, 10, 8996–9031. [Google Scholar] [CrossRef] [PubMed]
- Kang, Y.O.; Jung, J.-Y.; Cho, D.; Kwon, O.H.; Cheon, J.Y.; Park, W.H. Antimicrobial Silver Chloride Nanoparticles Stabilized with Chitosan Oligomer for the Healing of Burns. Materials 2016, 9, 215. [Google Scholar] [CrossRef] [PubMed]
- Bujes-Garrido, J.; Arcos-Martinez, M.J. Disposable sensor for electrochemical determination of chloride ions. Talanta 2016, 155, 153–157. [Google Scholar] [CrossRef]
- De Graaf, D.B.; Abbas, Y.; Bomer, J.G.; Olthuis, W.; van den Berg, A. Sensor-actuator system for dynamic chloride ion determination. Anal. Chim. Acta 2015, 888, 44–51. [Google Scholar] [CrossRef]
- Bujes-Garrido, J.; Arcos-Martinez, M.J. Development of a wearable electrochemical sensor for voltammetric determination of chloride ions. Sens. Actuators B 2017, 240, 224–228. [Google Scholar] [CrossRef]
- Rocha, D.L.; Rocha, F.R.P. An environmentally friendly flow-based procedure with photo-induced oxidation for the spectrophotometric determination of chloride in urine and waters. Microchem. J. 2013, 108, 193–197. [Google Scholar] [CrossRef]
- Robaina, N.F.; Feiteira, F.N.; Cassella, A.R.; Cassella, R.J. Determination of chloride in Brazilian crude oils by ion chromatography after extraction induced by emulsion breaking. J. Chromatogr. A 2016, 1458, 112–117. [Google Scholar] [CrossRef]
- Kaur, H.; Singh, J.; Chopra, S.; Kaur, N. Calix[4] arene based dipodal receptor nanohybrids for selective determination of chloride ions in aqueous media. Talanta 2016, 146, 122–129. [Google Scholar] [CrossRef]


| Red Coordinate (R) | Green Coordinate (G) | Blue Coordinate (B) | |
|---|---|---|---|
| y0 | 96 ± 3 | 91 ± 3 | 83 ± 2 |
| A | 132 ± 3 | 84 ± 3 | 66 ± 3 |
| t | 0.65 ± 0.12 | 0.54 ± 0.09 | 0.59 ± 0.08 |
| A/t | 203 | 156 | 111 |
| R | 0.9893 | 0.9899 | 0.9939 |
| Found (Don River), mg/L | Introduced, mg/L | Found, mg/L | Θ = x − C |
|---|---|---|---|
| 134.8 | 10.0 | 144.0 | −0.8 |
| 128.0 | 10.0 | 139.3 | 1.3 |
| 131.3 | 10.0 | 144.5 | 3.2 |
| 130.6 | 10.0 | 138.7 | −1.9 |
| Tap Water | Adsorbent | |||
|---|---|---|---|---|
| Silica Gel | Activated Carbon | Thermolysis Product of Silver Itaconate on Silica Gel | ||
| Column flow rate, mL/min | 13.2 | 16.8 | 14.1 | |
| Chlorides, mg/L (decrease, %) | 325.83 ± 0.10 | 296.23 ± 0.05 (−8.83%) | 312.23 ± 0.18 (−4.23%) | 122.48 ± 0.05 (−62.05%) |
| Residual chlorine, mg/L (decrease, %) | 1.40 ± 0.05 | 1.30 ± 0.05 (−1.1) | 0.03 ± 0.01 (−73.4) | 0.04 ± 0.01 (−68.46) |
| Electrical conductivity, µS/m2 | 1085 | 1025 | 1150 | 775 |
| pH | 6.8 | 6.5 | 7.2 | 7.3 |
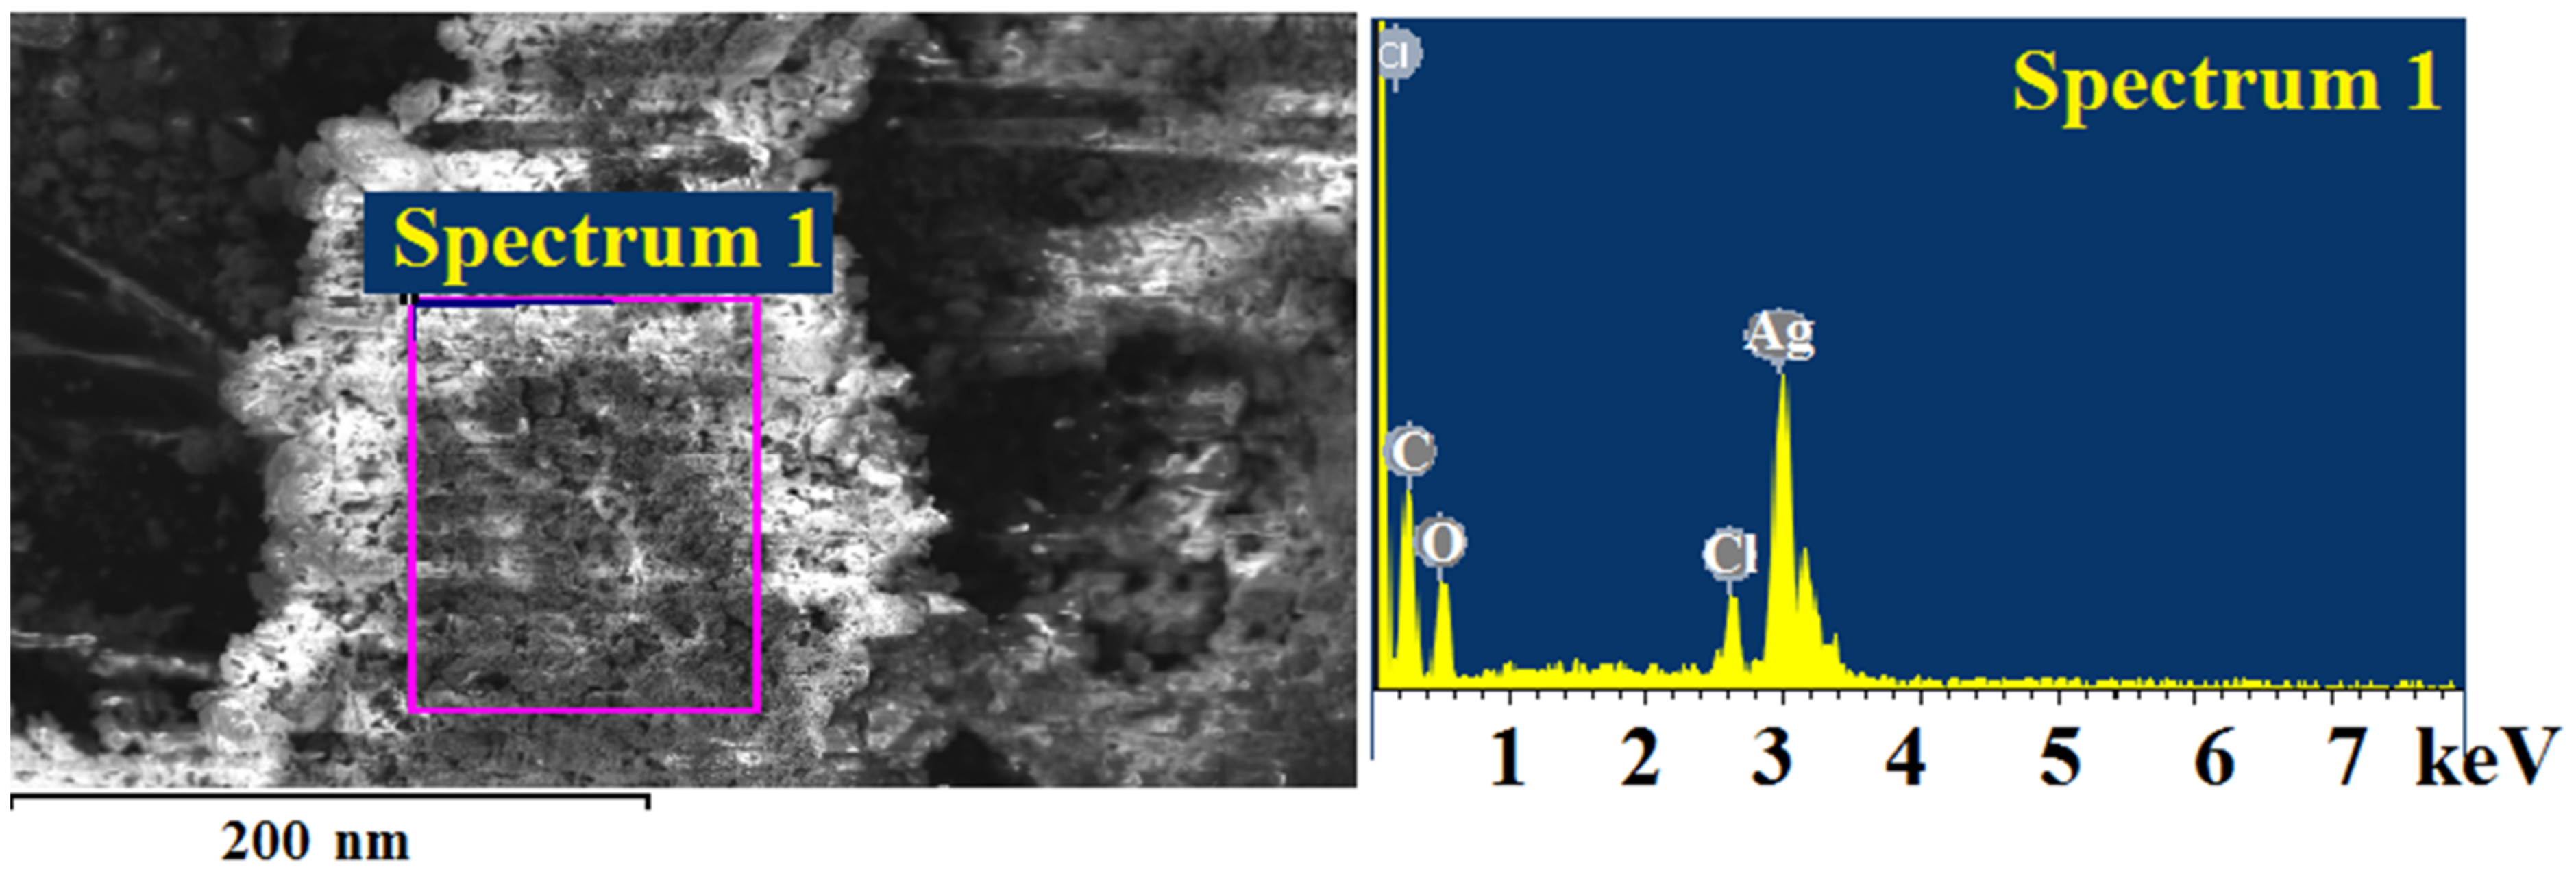
| Element | App | Intensity | Weight% | Weight% | |
|---|---|---|---|---|---|
| Conc. | Corrn. | Sigma | |||
| C K | 15.46 | 1.4685 | 13.28 | 1.24 | 38.03 |
| O K | 10.41 | 0.7641 | 17.19 | 1.64 | 36.94 |
| Cl K | 3.65 | 1.0459 | 4.41 | 0.60 | 4.27 |
| Ag L | 44.41 | 0.8605 | 65.12 | 1.89 | 20.76 |
| Totals | 100.00 |
| Method | LOD, μM | Determination Range, μM | Reference |
|---|---|---|---|
| Voltammetry (screen-printed electrodes) | 10,000 | 10,000–100,000 | [58] |
| Potentiometry (flow-based) | – | 1000–6000 | [59] |
| Voltammetry (screen-printed electrodes) | 200 | 200–700 | [60] |
| Spectrophotometry (flow-based) | 20 | 56–560 | [61] |
| Ion chromatography | 8.5 μmol kg−1 | 27–850 μmol kg−1 | [62] |
| Fluorimetry | 0.003 | 0.01–50 | [63] |
| Present method | 1.5 | 4.2–67.6 | This article |
Publisher’s Note: MDPI stays neutral with regard to jurisdictional claims in published maps and institutional affiliations. |
© 2022 by the authors. Licensee MDPI, Basel, Switzerland. This article is an open access article distributed under the terms and conditions of the Creative Commons Attribution (CC BY) license (https://creativecommons.org/licenses/by/4.0/).
Share and Cite
Kolesnikova, T.S.; Zarubina, A.O.; Gorbunova, M.O.; Zhinzhilo, V.A.; Dzhardimalieva, G.I.; Uflyand, I.E. Silver Itaconate as Single-Source Precursor of Nanocomposites for the Analysis of Chloride Ions. Materials 2022, 15, 8376. https://doi.org/10.3390/ma15238376
Kolesnikova TS, Zarubina AO, Gorbunova MO, Zhinzhilo VA, Dzhardimalieva GI, Uflyand IE. Silver Itaconate as Single-Source Precursor of Nanocomposites for the Analysis of Chloride Ions. Materials. 2022; 15(23):8376. https://doi.org/10.3390/ma15238376
Chicago/Turabian StyleKolesnikova, Tatiana S., Anastasiya O. Zarubina, Marina O. Gorbunova, Vladimir A. Zhinzhilo, Gulzhian I. Dzhardimalieva, and Igor E. Uflyand. 2022. "Silver Itaconate as Single-Source Precursor of Nanocomposites for the Analysis of Chloride Ions" Materials 15, no. 23: 8376. https://doi.org/10.3390/ma15238376
APA StyleKolesnikova, T. S., Zarubina, A. O., Gorbunova, M. O., Zhinzhilo, V. A., Dzhardimalieva, G. I., & Uflyand, I. E. (2022). Silver Itaconate as Single-Source Precursor of Nanocomposites for the Analysis of Chloride Ions. Materials, 15(23), 8376. https://doi.org/10.3390/ma15238376