
Effect of Al and Fe Doping on the Electrochemical Behavior of Li1.2Ni0.133Mn0.534Co0.133O2 Li-Rich Cathode Material
 , , and
Abstract
1. Introduction
2. Materials and Methods
2.1. Synthesis
2.2. Methods
3. Results and Discussion
4. Conclusions
Supplementary Materials
Author Contributions
Funding
Institutional Review Board Statement
Informed Consent Statement
Data Availability Statement
Acknowledgments
Conflicts of Interest
References
- Masias, A.; Marcicki, J.; Paxton, W.A. Opportunities and Challenges of Lithium Ion Batteries in Automotive Applications. ACS Energy Lett. 2021, 6, 621–630. [Google Scholar] [CrossRef]
- Choi, D.; Shamim, N.; Crawford, A.; Huang, Q.; Vartanian, C.K.; Viswanathan, V.V.; Paiss, M.D.; Alam, M.J.E.; Reed, D.M.; Sprenkle, V.L. Li-ion battery technology for grid application. J. Power Sources 2021, 511, 230419. [Google Scholar] [CrossRef]
- Malhotra, A.; Battke, B.; Beuse, M.; Stephan, A.; Schmidt, T. Use cases for stationary battery technologies: A review of the literature and existing projects. Renew. Sustain. Energy Rev. 2016, 56, 705–721. [Google Scholar] [CrossRef]
- Nitta, N.; Wu, F.; Lee, J.T.; Yushin, G. Li-ion battery materials: Present and future. Mater. Today 2015, 18, 252–264. [Google Scholar] [CrossRef]
- Murdock, B.E.; Toghill, K.E.; Tapia-Ruiz, N. A Perspective on the Sustainability of Cathode Materials used in Lithium-Ion Batteries. Adv. Energy Mater. 2021, 11, 2102028. [Google Scholar] [CrossRef]
- Ji, X.; Xia, Q.; Xu, Y.; Feng, H.; Wang, P.; Tan, Q. A review on progress of lithium-rich manganese-based cathodes for lithium ion batteries. J. Power Sources 2021, 487, 229362. [Google Scholar] [CrossRef]
- Goodenough, J.B.; Park, K.-S. The Li-Ion Rechargeable Battery: A Perspective. J. Am. Chem. Soc. 2013, 135, 1167–1176. [Google Scholar] [CrossRef]
- Song, J.; Li, B.; Chen, Y.; Zuo, Y.; Ning, F.; Shang, H.; Feng, G.; Liu, N.; Shen, C.; Ai, X.; et al. A High-Performance Li–Mn–O Li-rich Cathode Material with Rhombohedral Symmetry via Intralayer Li/Mn Disordering. Adv. Mater. 2020, 32, 2000190. [Google Scholar] [CrossRef] [PubMed]
- Genevois, C.; Koga, H.; Croguennec, L.; Ménétrier, M.; Delmas, C.; Weill, F. Insight into the Atomic Structure of Cycled Lithium-Rich Layered Oxide Li1.20Mn0.54Co0.13Ni0.13O2 Using HAADF STEM and Electron Nanodiffraction. J. Phys. Chem. C 2015, 119, 75–83. [Google Scholar] [CrossRef]
- Jarvis, K.A.; Deng, Z.; Allard, L.F.; Manthiram, A.; Ferreira, P.J. Atomic Structure of a Lithium-Rich Layered Oxide Material for Lithium-Ion Batteries: Evidence of a Solid Solution. Chem. Mater. 2011, 23, 3614–3621. [Google Scholar] [CrossRef]
- Boulineau, A.; Simonin, L.; Colin, J.-F.; Bourbon, C.; Patoux, S. First Evidence of Manganese–Nickel Segregation and Densification upon Cycling in Li-Rich Layered Oxides for Lithium Batteries. Nano Lett. 2013, 13, 3857–3863. [Google Scholar] [CrossRef]
- Ye, D.; Zeng, G.; Nogita, K.; Ozawa, K.; Hankel, M.; Searles, D.J.; Wang, L. Understanding the Origin of Li2MnO3 Activation in Li-Rich Cathode Materials for Lithium-Ion Batteries. Adv. Funct. Mater. 2015, 25, 7488–7496. [Google Scholar] [CrossRef]
- Luo, K.; Roberts, M.R.; Hao, R.; Guerrini, N.; Pickup, D.M.; Liu, Y.-S.; Edström, K.; Guo, J.; Chadwick, A.V.; Duda, L.C.; et al. Charge-compensation in 3d-transition-metal-oxide intercalation cathodes through the generation of localized electron holes on oxygen. Nat. Chem. 2016, 8, 684–691. [Google Scholar] [CrossRef]
- Thackeray, M.M.; Kang, S.-H.; Johnson, C.S.; Vaughey, J.T.; Benedek, R.; Hackney, S.A. Li2MnO3-stabilized LiMO2 (M = Mn, Ni, Co) electrodes for lithium-ion batteries. J. Mater. Chem. 2007, 17, 3112–3125. [Google Scholar] [CrossRef]
- Gu, M.; Belharouak, I.; Zheng, J.; Wu, H.; Xiao, J.; Genc, A.; Amine, K.; Thevuthasan, S.; Baer, D.R.; Zhang, J.-G.; et al. Formation of the Spinel Phase in the Layered Composite Cathode Used in Li-Ion Batteries. ACS Nano 2013, 7, 760–767. [Google Scholar] [CrossRef]
- Yan, J.; Liu, X.; Li, B. Recent progress in Li-rich layered oxides as cathode materials for Li-ion batteries. RSC Adv. 2014, 4, 63268–63284. [Google Scholar] [CrossRef]
- Yu, H.; Zhou, H. High-Energy Cathode Materials (Li2MnO3–LiMO2) for Lithium-Ion Batteries. J. Phys. Chem. Lett. 2013, 4, 1268–1280. [Google Scholar] [CrossRef]
- Song, B.; Liu, Z.; Lai, M.O.; Lu, L. Structural evolution and the capacity fade mechanism upon long-term cycling in Li-rich cathode material. Phys. Chem. Chem. Phys. 2012, 14, 12875. [Google Scholar] [CrossRef] [PubMed]
- Fell, C.R.; Qian, D.; Carroll, K.J.; Chi, M.; Jones, J.L.; Meng, Y.S. Correlation Between Oxygen Vacancy, Microstrain, and Cation Distribution in Lithium-Excess Layered Oxides during the First Electrochemical Cycle. Chem. Mater. 2013, 25, 1621–1629. [Google Scholar] [CrossRef]
- Li, S.; Fu, X.; Liang, Y.; Wang, S.; Zhou, X.; Dong, H.; Tuo, K.; Gao, C.; Cui, X. Enhanced Structural Stability of Boron-Doped Layered@Spinel@Carbon Heterostructured Lithium-Rich Manganese-Based Cathode Materials. ACS Sustain. Chem. Eng. 2020, 8, 9311–9324. [Google Scholar] [CrossRef]
- Lei, Y.; Ni, J.; Hu, Z.; Wang, Z.; Gui, F.; Li, B.; Ming, P.; Zhang, C.; Elias, Y.; Aurbach, D.; et al. Surface Modification of Li-Rich Mn-Based Layered Oxide Cathodes: Challenges, Materials, Methods, and Characterization. Adv. Energy Mater. 2020, 10, 2002506. [Google Scholar] [CrossRef]
- Hu, E.; Yu, X.; Lin, R.; Bi, X.; Lu, J.; Bak, S.; Nam, K.-W.; Xin, H.L.; Jaye, C.; Fischer, D.A.; et al. Evolution of redox couples in Li- and Mn-rich cathode materials and mitigation of voltage fade by reducing oxygen release. Nat. Energy 2018, 3, 690–698. [Google Scholar] [CrossRef]
- Zheng, H.; Han, X.; Guo, W.; Lin, L.; Xie, Q.; Liu, P.; He, W.; Wang, L.; Peng, D.-L. Recent developments and challenges of Li-rich Mn-based cathode materials for high-energy lithium-ion batteries. Mater. Today Energy 2020, 18, 100518. [Google Scholar] [CrossRef]
- Oh, P.; Yun, J.; Park, S.; Nam, G.; Liu, M.; Cho, J. Recent Advances and Prospects of Atomic Substitution on Layered Positive Materials for Lithium-Ion Battery. Adv. Energy Mater. 2021, 11, 2003197. [Google Scholar] [CrossRef]
- Chen, H.; Hu, Q.; Huang, Z.; He, Z.; Wang, Z.; Guo, H.; Li, X. Synthesis and electrochemical study of Zr-doped Li[Li0.2Mn0.54Ni0.13Co0.13]O2 as cathode material for Li-ion battery. Ceram. Int. 2016, 42, 263–269. [Google Scholar] [CrossRef]
- Lu, Y.; Pang, M.; Shi, S.; Ye, Q.; Tian, Z.; Wang, T. Enhanced Electrochemical Properties of Zr4+-doped Li1.20[Mn0.52Ni0.20Co0.08]O2 Cathode Material for Lithium-ion Battery at Elevated Temperature. Sci. Rep. 2018, 8, 2981. [Google Scholar] [CrossRef]
- Kou, Y.; Han, E.; Zhu, L.; Liu, L.; Zhang, Z. The effect of Ti doping on electrochemical properties of Li1.167Ni0.4Mn0.383Co0.05O2 for lithium-ion batteries. Solid State Ion. 2016, 296, 154–157. [Google Scholar] [CrossRef]
- Feng, X.; Gao, Y.; Ben, L.; Yang, Z.; Wang, Z.; Chen, L. Enhanced electrochemical performance of Ti-doped Li1.2Mn0.54Co0.13Ni0.13O2 for lithium-ion batteries. J. Power Sources 2016, 317, 74–80. [Google Scholar] [CrossRef]
- Pechen, L.S.; Makhonina, E.V.; Medvedeva, A.E.; Politov, Y.A.; Eremenko, I.L. Effect of Titanium Doping of Lithium-Rich Cathode Materials. Dokl. Phys. Chem. 2022, 502, 7–10. [Google Scholar] [CrossRef]
- Phattharasupakun, N.; Geng, C.; Johnson, M.B.; Väli, R.; Liu, A.; Liu, Y.; Sawangphruk, M.; Dahn, J.R. Impact of Al Doping and Surface Coating on the Electrochemical Performances of Li-Rich Mn-Rich Li1.11Ni0.33Mn0.56O2 Positive Electrode Material. J. Electrochem. Soc. 2020, 167, 120531. [Google Scholar] [CrossRef]
- Liang, X. Improving Electrochemical Performance of Li1.2Ni0.13Co0.13Mn0.54O2 Cathode Material by Al3+ Doping. Int. J. Electrochem. Sci. 2016, 11, 9164–9174. [Google Scholar] [CrossRef]
- Song, B.; Zhou, C.; Wang, H.; Liu, H.; Liu, Z.; Lai, M.O.; Lu, L. Advances in Sustain Stable Voltage of Cr-Doped Li-Rich Layered Cathodes for Lithium Ion Batteries. J. Electrochem. Soc. 2014, 161, A1723–A1730. [Google Scholar] [CrossRef]
- Nayak, P.K.; Grinblat, J.; Levi, M.; Haik, O.; Levi, E.; Aurbach, D. Effect of Fe in suppressing the discharge voltage decay of high capacity Li-rich cathodes for Li-ion batteries. J. Solid State Electrochem. 2015, 19, 2781–2792. [Google Scholar] [CrossRef]
- Wu, F.; Kim, G.; Kuenzel, M.; Zhang, H.; Asenbauer, J.; Geiger, D.; Kaiser, U.; Passerini, S. Elucidating the Effect of Iron Doping on the Electrochemical Performance of Cobalt-Free Lithium-Rich Layered Cathode Materials. Adv. Energy Mater. 2019, 9, 1902445. [Google Scholar] [CrossRef]
- Wang, D.; Huang, Y.; Huo, Z.; Chen, L. Synthesize and electrochemical characterization of Mg-doped Li-rich layered Li[Li0.2Ni0.2Mn0.6]O2 cathode material. Electrochim. Acta 2013, 107, 461–466. [Google Scholar] [CrossRef]
- Makhonina, E.; Pechen, L.; Medvedeva, A.; Politov, Y.; Rumyantsev, A.; Koshtyal, Y.; Volkov, V.; Goloveshkin, A.; Eremenko, I. Effects of Mg Doping at Different Positions in Li-Rich Mn-Based Cathode Material on Electrochemical Performance. Nanomaterials 2022, 12, 156. [Google Scholar] [CrossRef]
- Li, Z.; Chernova, N.A.; Feng, J.; Upreti, S.; Omenya, F.; Whittingham, M.S. Stability and Rate Capability of Al Substituted Lithium-Rich High-Manganese Content Oxide Materials for Li-Ion Batteries. J. Electrochem. Soc. 2011, 159, A116–A120. [Google Scholar] [CrossRef]
- Medvedeva, A.E.; Makhonina, E.V.; Pechen, L.S.; Politov, Y.A.; Rumyantsev, A.M.; Koshtyal, Y.M.; Kurlykin, A.A.; Eremenko, I.L. Cadmium Modification of the Lithium-Rich Cathode Material Li1.2Ni0.133Mn0.534Co0.133O2. Russ. J. Inorg. Chem. 2022, 67, 952–962. [Google Scholar] [CrossRef]
- Li, Z.-Y.; Guo, H.; Ma, X.; Sun, K.; Chen, D.; He, L.; Han, S. Al Substitution Induced Differences in Materials Structure and Electrochemical Performance of Ni-Rich Layered Cathodes for Lithium-Ion Batteries. J. Phys. Chem. C 2019, 123, 19298–19306. [Google Scholar] [CrossRef]
- Li, W.; Liu, X.; Celio, H.; Smith, P.; Dolocan, A.; Chi, M.; Manthiram, A. Mn versus Al in Layered Oxide Cathodes in Lithium-Ion Batteries: A Comprehensive Evaluation on Long-Term Cyclability. Adv. Energy Mater. 2018, 8, 1703154. [Google Scholar] [CrossRef]
- Kim, U.-H.; Lee, E.-J.; Yoon, C.S.; Myung, S.-T.; Sun, Y.-K. Compositionally Graded Cathode Material with Long-Term Cycling Stability for Electric Vehicles Application. Adv. Energy Mater. 2016, 6, 1601417. [Google Scholar] [CrossRef]
- Yi, T.-F.; Li, Y.-M.; Cai, X.-D.; Yang, S.-Y.; Zhu, Y.-R. Fe-stabilized Li-rich layered Li1.2Mn0.56Ni0.16Co0.08O2 oxide as a high performance cathode for advanced lithium-ion batteries. Mater. Today Energy 2017, 4, 25–33. [Google Scholar] [CrossRef]
- Bosubabu, D.; MG, K.B.; Ramesha, K. Tuning of Ni, Mn, and Co (NMC) Content in 0.4(LiNixMnyCozO2)·0.4(Li2MnO3) toward Stable High-Capacity Lithium-Rich Cathode Materials. ACS Appl. Energy Mater. 2020, 3, 10872–10881. [Google Scholar] [CrossRef]
- Wang, C.-C.; Manthiram, A. Influence of cationic substitutions on the first charge and reversible capacities of lithium-rich layered oxide cathodes. J. Mater. Chem. A 2013, 1, 10209. [Google Scholar] [CrossRef]
- Tabuchi, M.; Nabeshima, Y.; Takeuchi, T.; Kageyama, H.; Tatsumi, K.; Akimoto, J.; Shibuya, H.; Imaizumi, J. Synthesis and electrochemical characterization of Fe and Ni substituted Li2MnO3—An effective means to use Fe for constructing “Co-free” Li2MnO3 based positive electrode material. J. Power Sources 2011, 196, 3611–3622. [Google Scholar] [CrossRef]
- Kleiner, K.; Strehle, B.; Baker, A.R.; Day, S.J.; Tang, C.C.; Buchberger, I.; Chesneau, F.-F.; Gasteiger, H.A.; Piana, M. Origin of High Capacity and Poor Cycling Stability of Li-Rich Layered Oxides: A Long-Duration in Situ Synchrotron Powder Diffraction Study. Chem. Mater. 2018, 30, 3656–3667. [Google Scholar] [CrossRef]
- Strehle, B.; Kleiner, K.; Jung, R.; Chesneau, F.; Mendez, M.; Gasteiger, H.A.; Piana, M. The Role of Oxygen Release from Li- and Mn-Rich Layered Oxides during the First Cycles Investigated by On-Line Electrochemical Mass Spectrometry. J. Electrochem. Soc. 2017, 164, A400–A406. [Google Scholar] [CrossRef]
- Muhammad, S.; Kim, H.; Kim, Y.; Kim, D.; Song, J.H.; Yoon, J.; Park, J.-H.; Ahn, S.-J.; Kang, S.-H.; Thackeray, M.M.; et al. Evidence of reversible oxygen participation in anomalously high capacity Li- and Mn-rich cathodes for Li-ion batteries. Nano Energy 2016, 21, 172–184. [Google Scholar] [CrossRef]
- Saubanère, M.; McCalla, E.; Tarascon, J.-M.; Doublet, M.-L. The intriguing question of anionic redox in high-energy density cathodes for Li-ion batteries. Energy Environ. Sci. 2016, 9, 984–991. [Google Scholar] [CrossRef]
- Rozier, P.; Tarascon, J.M. Review—Li-Rich Layered Oxide Cathodes for Next-Generation Li-Ion Batteries: Chances and Challenges. J. Electrochem. Soc. 2015, 162, A2490–A2499. [Google Scholar] [CrossRef]
- Phillips, P.J.; Bareño, J.; Li, Y.; Abraham, D.P.; Klie, R.F. On the Localized Nature of the Structural Transformations of Li2MnO3 Following Electrochemical Cycling. Adv. Energy Mater. 2015, 5, 1501252. [Google Scholar] [CrossRef]
- Shen, S.; Hong, Y.; Zhu, F.; Cao, Z.; Li, Y.; Ke, F.; Fan, J.; Zhou, L.; Wu, L.; Dai, P.; et al. Tuning Electrochemical Properties of Li-Rich Layered Oxide Cathodes by Adjusting Co/Ni Ratios and Mechanism Investigation Using in situ X-ray Diffraction and Online Continuous Flow Differential Electrochemical Mass Spectrometry. ACS Appl. Mater. Interfaces 2018, 10, 12666–12677. [Google Scholar] [CrossRef] [PubMed]
- Teterin, Y.A.; Sobolev, A.V.; Belik, A.A.; Glazkova, Y.S.; Maslakov, K.I.; Yarzhemskii, V.G.; Teterin, A.Y.; Ivanov, K.E.; Presnyakov, I.A. Electronic Structure of Cobaltites ScCo1–xFexO3 (x = 0, 0.05) and BiCoO3: X-Ray Photoelectron Spectroscopy. J. Exp. Theor. Phys. 2019, 128, 899–908. [Google Scholar] [CrossRef]
- Cole, K.M.; Kirk, D.W.; Thorpe, S.J. Co(OH)2 powder characterized by x-ray photoelectron spectroscopy (XPS) and ultraviolet photoelectron spectroscopy (UPS). Surf. Sci. Spectra 2020, 27, 024013. [Google Scholar] [CrossRef]
- Cherkashinin, G.; Nikolowski, K.; Ehrenberg, H.; Jacke, S.; Dimesso, L.; Jaegermann, W. The stability of the SEI layer, surface composition and the oxidation state of transition metals at the electrolyte–cathode interface impacted by the electrochemical cycling: X-ray photoelectron spectroscopy investigation. Phys. Chem. Chem. Phys. 2012, 14, 12321. [Google Scholar] [CrossRef] [PubMed]
- Moses, A.W.; Flores, H.G.G.; Kim, J.-G.; Langell, M.A. Surface properties of LiCoO2, LiNiO2 and LiNi1−xCoxO2. Appl. Surf. Sci. 2007, 253, 4782–4791. [Google Scholar] [CrossRef]
- Langell, M.A.; Hutchings, C.W.; Carson, G.A.; Nassir, M.H. High resolution electron energy loss spectroscopy of MnO(100) and oxidized MnO(100). J. Vac. Sci. Technol. A Vacuum Surf. Film. 1996, 14, 1656–1661. [Google Scholar] [CrossRef]
- Soares, E.A.; Paniago, R.; de Carvalho, V.E.; Lopes, E.L.; Abreu, G.J.P.; Pfannes, H.-D. Quantitative low-energy electron diffraction analysis of MnO(00) films grown on Ag(100). Phys. Rev. B 2006, 73, 035419. [Google Scholar] [CrossRef]
- Stranick, M.A. Mn2O3 by XPS. Surf. Sci. Spectra 1999, 6, 39–46. [Google Scholar] [CrossRef]
- Stranick, M.A. MnO2 by XPS. Surf. Sci. Spectra 1999, 6, 31–38. [Google Scholar] [CrossRef]


| Sample | Determined Composition | Targeted Composition |
|---|---|---|
| LR | Li1.2Ni0.133Mn0.534Co0.133O2 | Li1.2Ni0.133Mn0.534Co0.133O2 |
| LR–Al | Li1.2Ni0.133Mn0.534Co0.118Al0.016O2 | Li1.2Ni0.134Mn0.531Co0.118Al0.017O2 |
| LR–Fe | Li1.2Ni0.133Mn0.534Co0.118Fe0.016O2 | Li1.2Ni0.133Mn0.532Co0.118Fe0.018O2 |
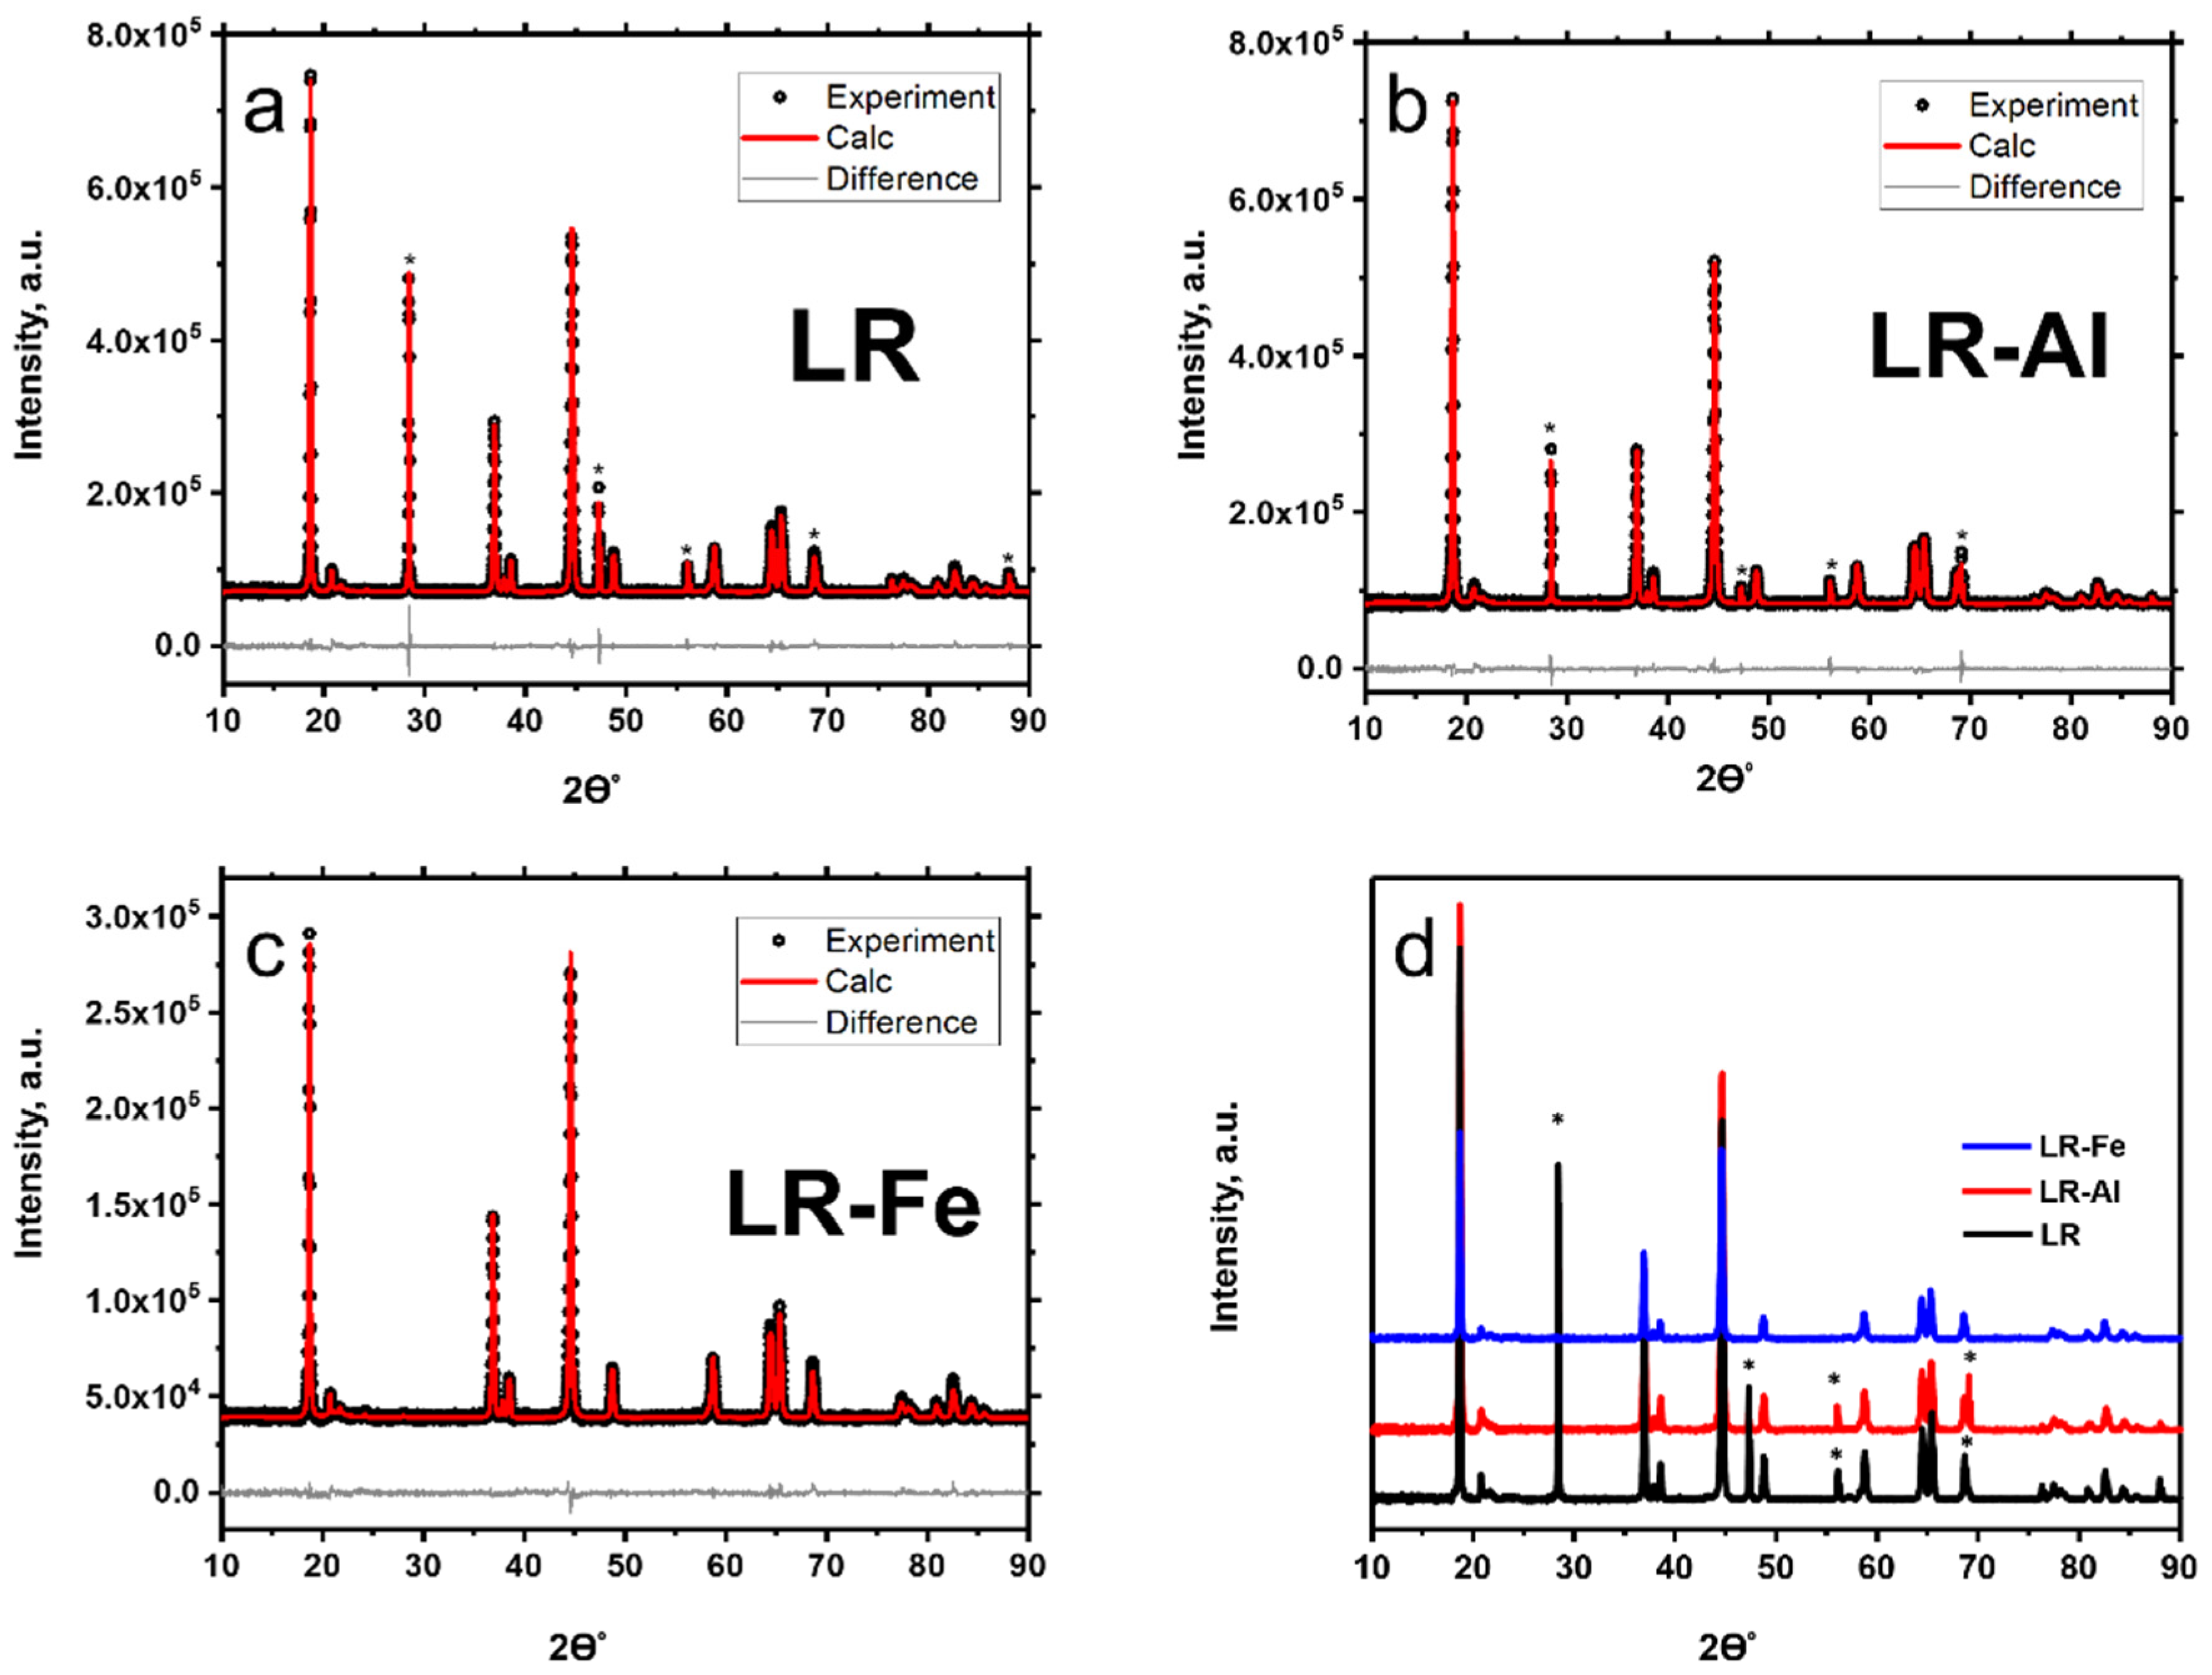
| Sample | a, Å | b, Å | c, Å | β, ° | V, Å3 |
|---|---|---|---|---|---|
| LR | 4.93909(6) | 8.55501(11) | 5.02970(11) | 109.259(3) | 200.632(8) |
| LR-Al | 4.93922(6) | 8.55523(10) | 5.02635(13) | 109.283(3) | 200.478(8) |
| LR-Fe | 4.9441(4) | 8.5638(7) | 5.0321(5) | 109.286(2) | 201.10(4) |
Publisher’s Note: MDPI stays neutral with regard to jurisdictional claims in published maps and institutional affiliations. |
© 2022 by the authors. Licensee MDPI, Basel, Switzerland. This article is an open access article distributed under the terms and conditions of the Creative Commons Attribution (CC BY) license (https://creativecommons.org/licenses/by/4.0/).
Share and Cite
Medvedeva, A.; Makhonina, E.; Pechen, L.; Politov, Y.; Rumyantsev, A.; Koshtyal, Y.; Goloveshkin, A.; Maslakov, K.; Eremenko, I. Effect of Al and Fe Doping on the Electrochemical Behavior of Li1.2Ni0.133Mn0.534Co0.133O2 Li-Rich Cathode Material. Materials 2022, 15, 8225. https://doi.org/10.3390/ma15228225
Medvedeva A, Makhonina E, Pechen L, Politov Y, Rumyantsev A, Koshtyal Y, Goloveshkin A, Maslakov K, Eremenko I. Effect of Al and Fe Doping on the Electrochemical Behavior of Li1.2Ni0.133Mn0.534Co0.133O2 Li-Rich Cathode Material. Materials. 2022; 15(22):8225. https://doi.org/10.3390/ma15228225
Chicago/Turabian StyleMedvedeva, Anna, Elena Makhonina, Lidia Pechen, Yury Politov, Aleksander Rumyantsev, Yury Koshtyal, Alexander Goloveshkin, Konstantin Maslakov, and Igor Eremenko. 2022. "Effect of Al and Fe Doping on the Electrochemical Behavior of Li1.2Ni0.133Mn0.534Co0.133O2 Li-Rich Cathode Material" Materials 15, no. 22: 8225. https://doi.org/10.3390/ma15228225
APA StyleMedvedeva, A., Makhonina, E., Pechen, L., Politov, Y., Rumyantsev, A., Koshtyal, Y., Goloveshkin, A., Maslakov, K., & Eremenko, I. (2022). Effect of Al and Fe Doping on the Electrochemical Behavior of Li1.2Ni0.133Mn0.534Co0.133O2 Li-Rich Cathode Material. Materials, 15(22), 8225. https://doi.org/10.3390/ma15228225