

Grain Growth upon Annealing and Its Influence on Biodegradation Rate for Pure Iron


Abstract
1. Introduction
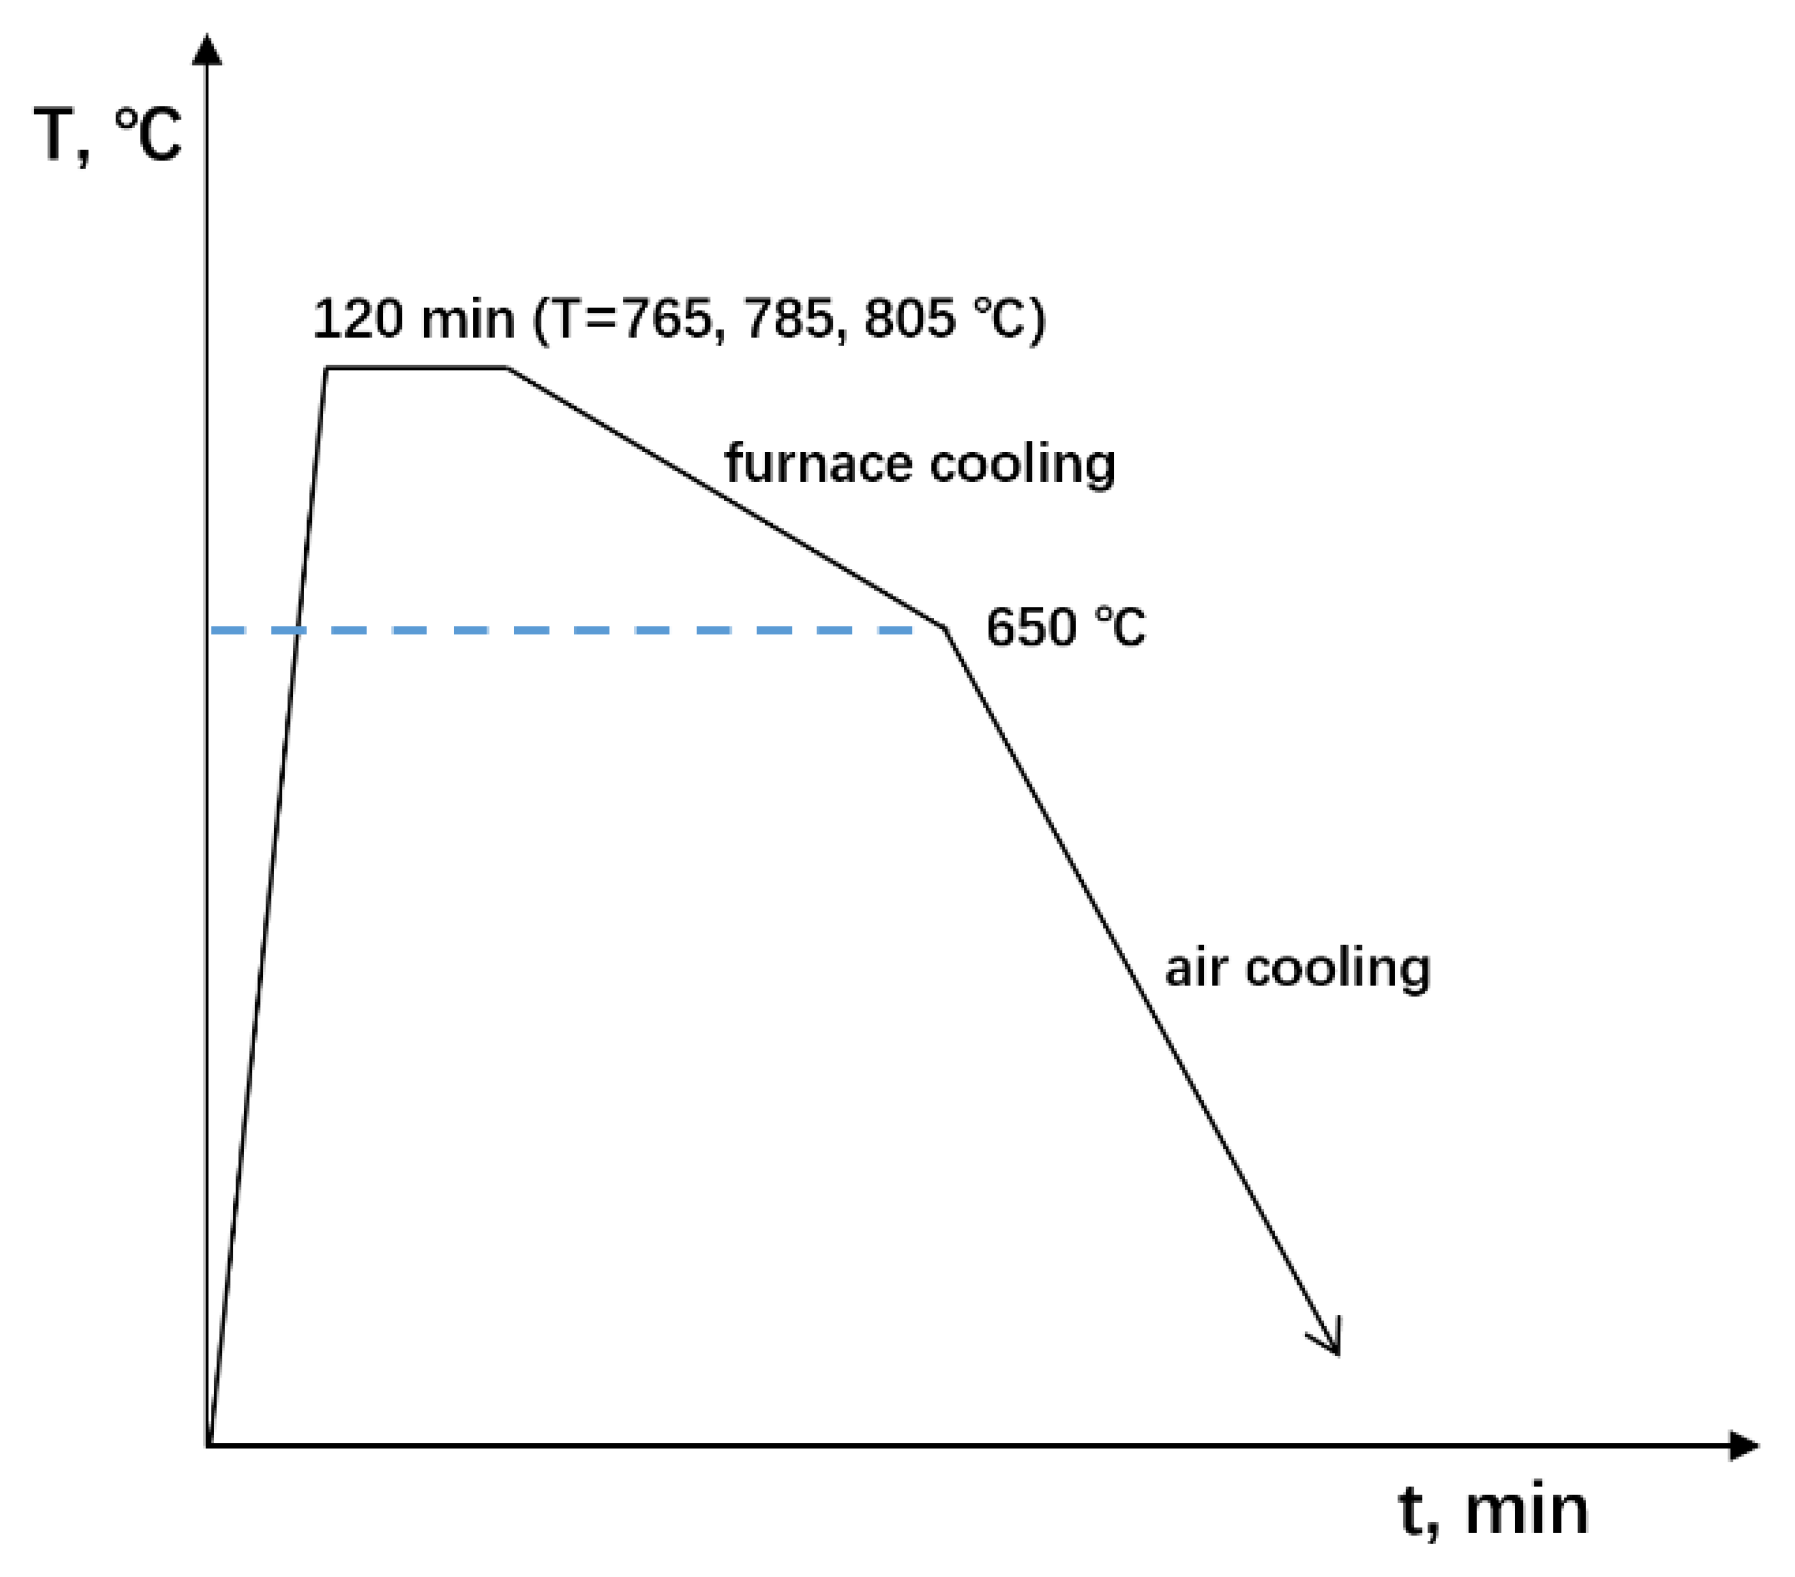
2. Experiments
3. Results
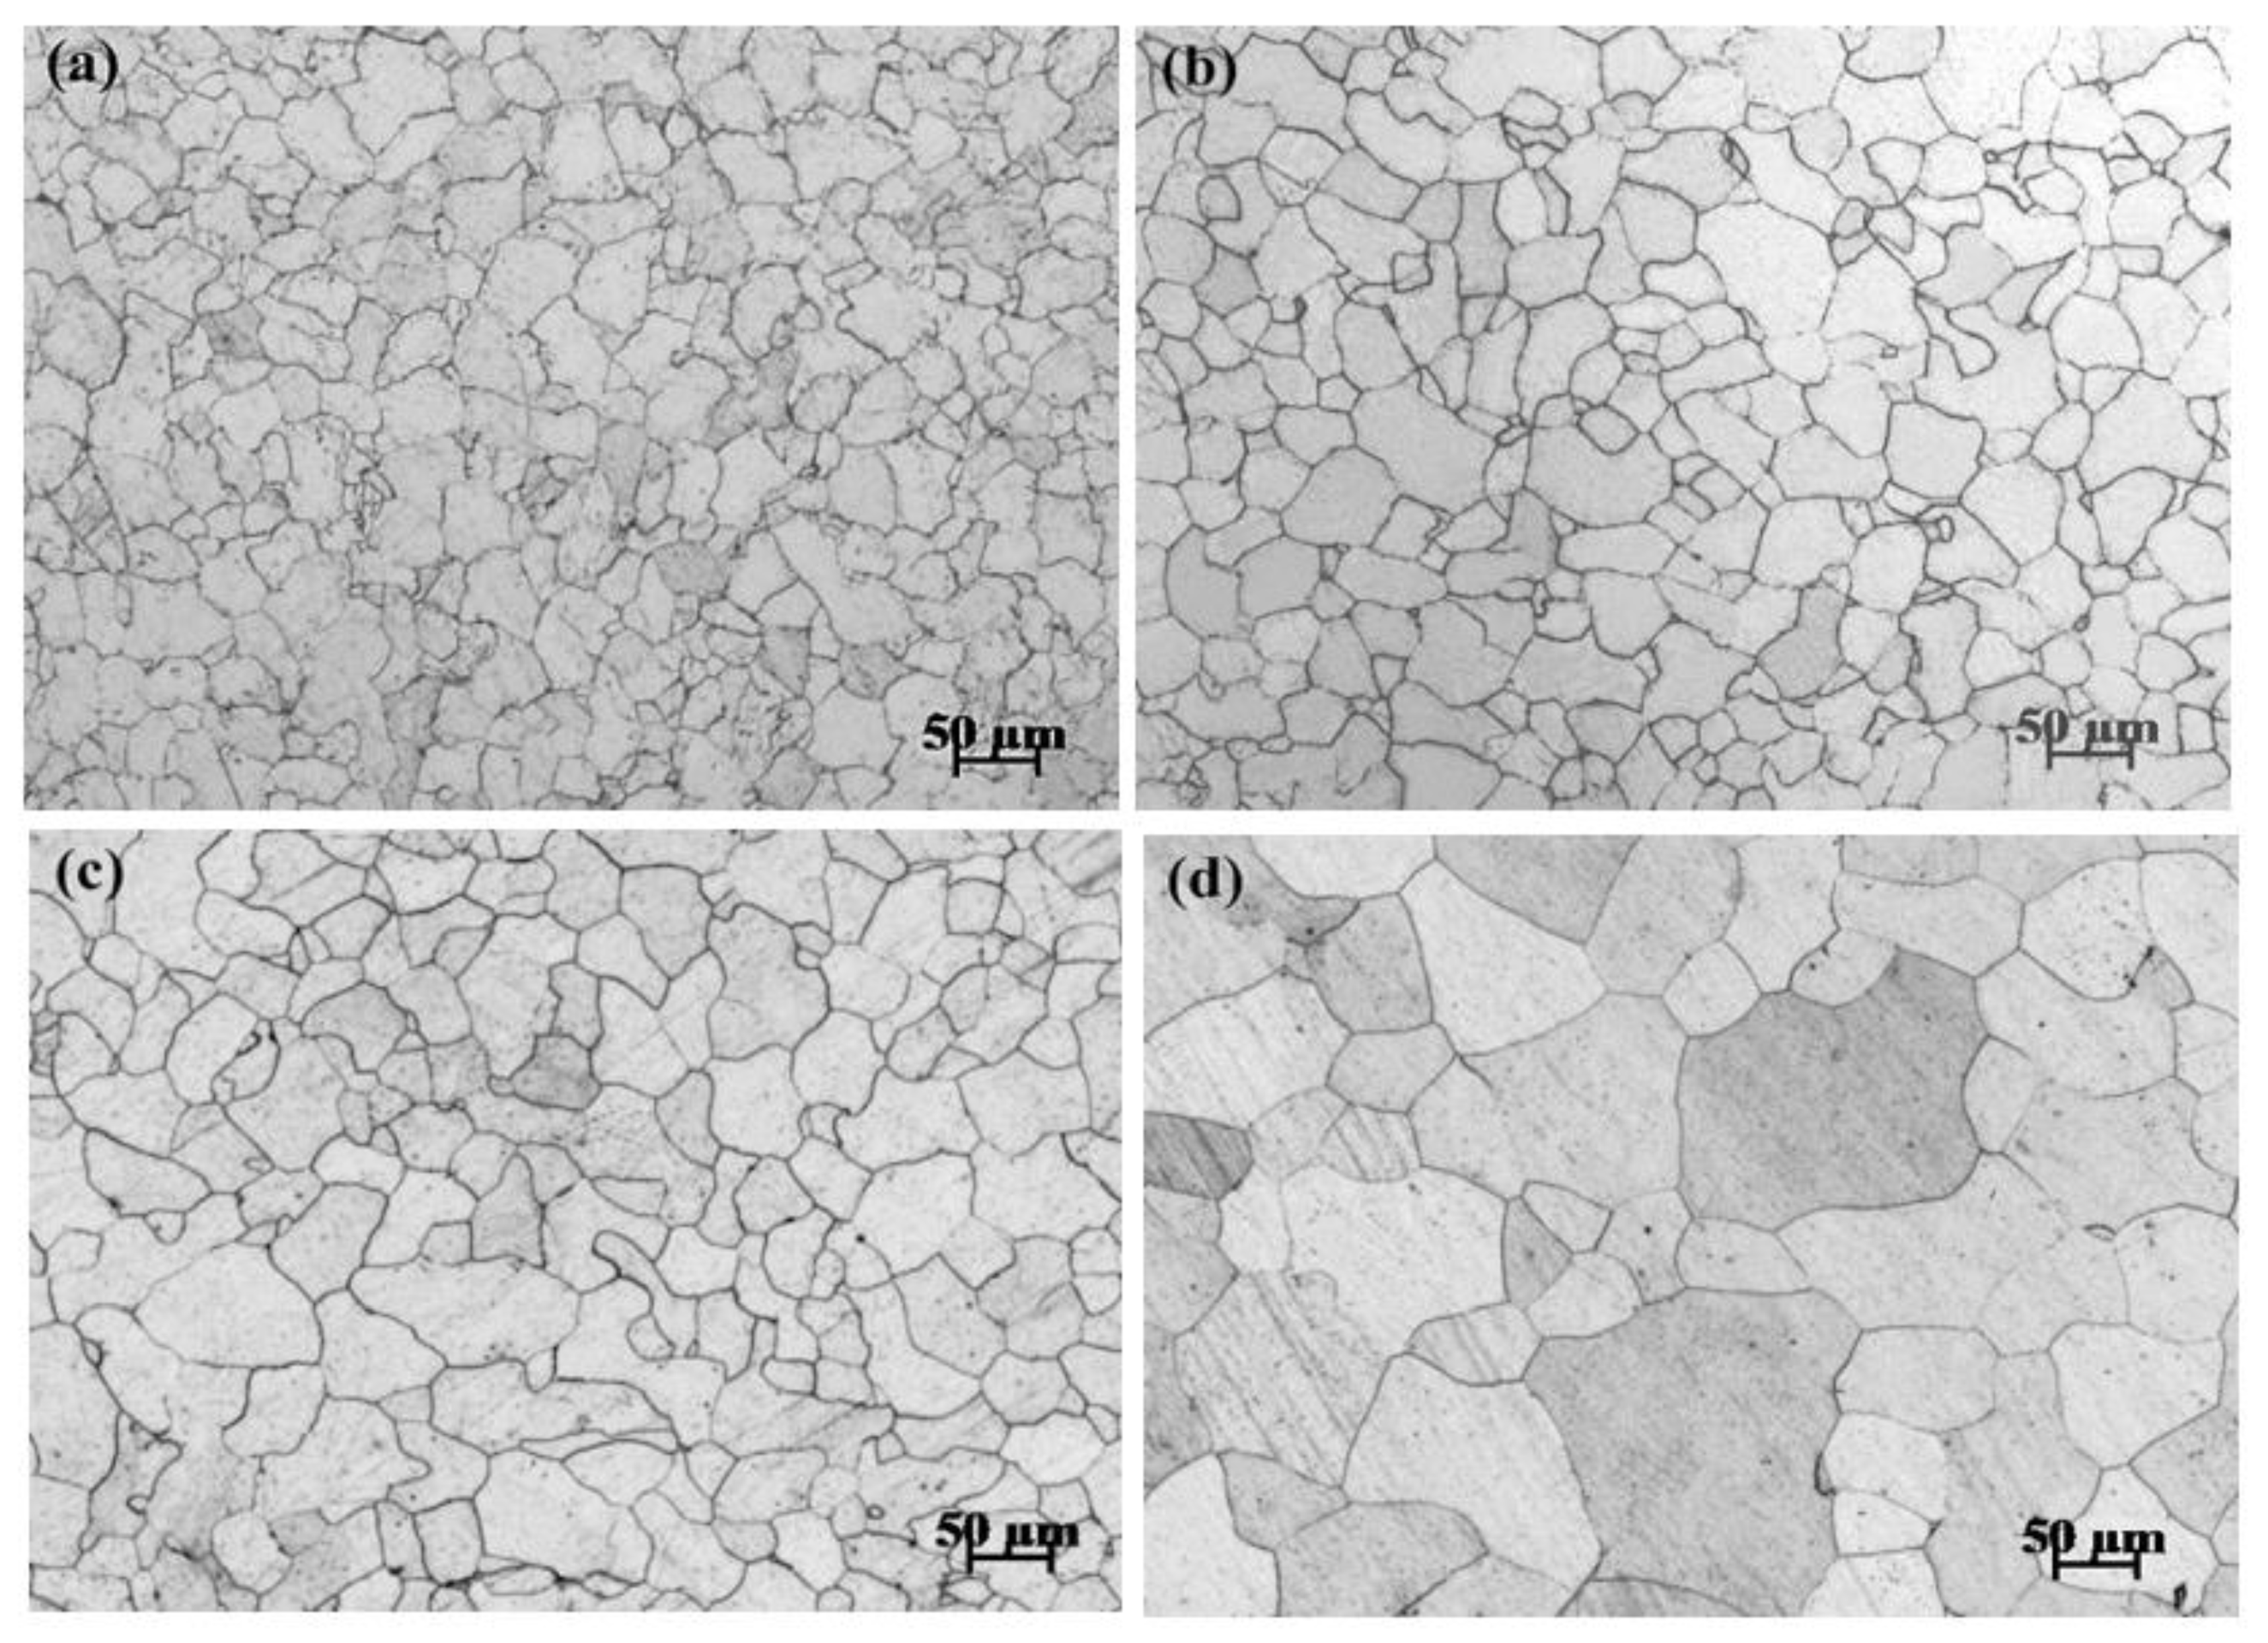
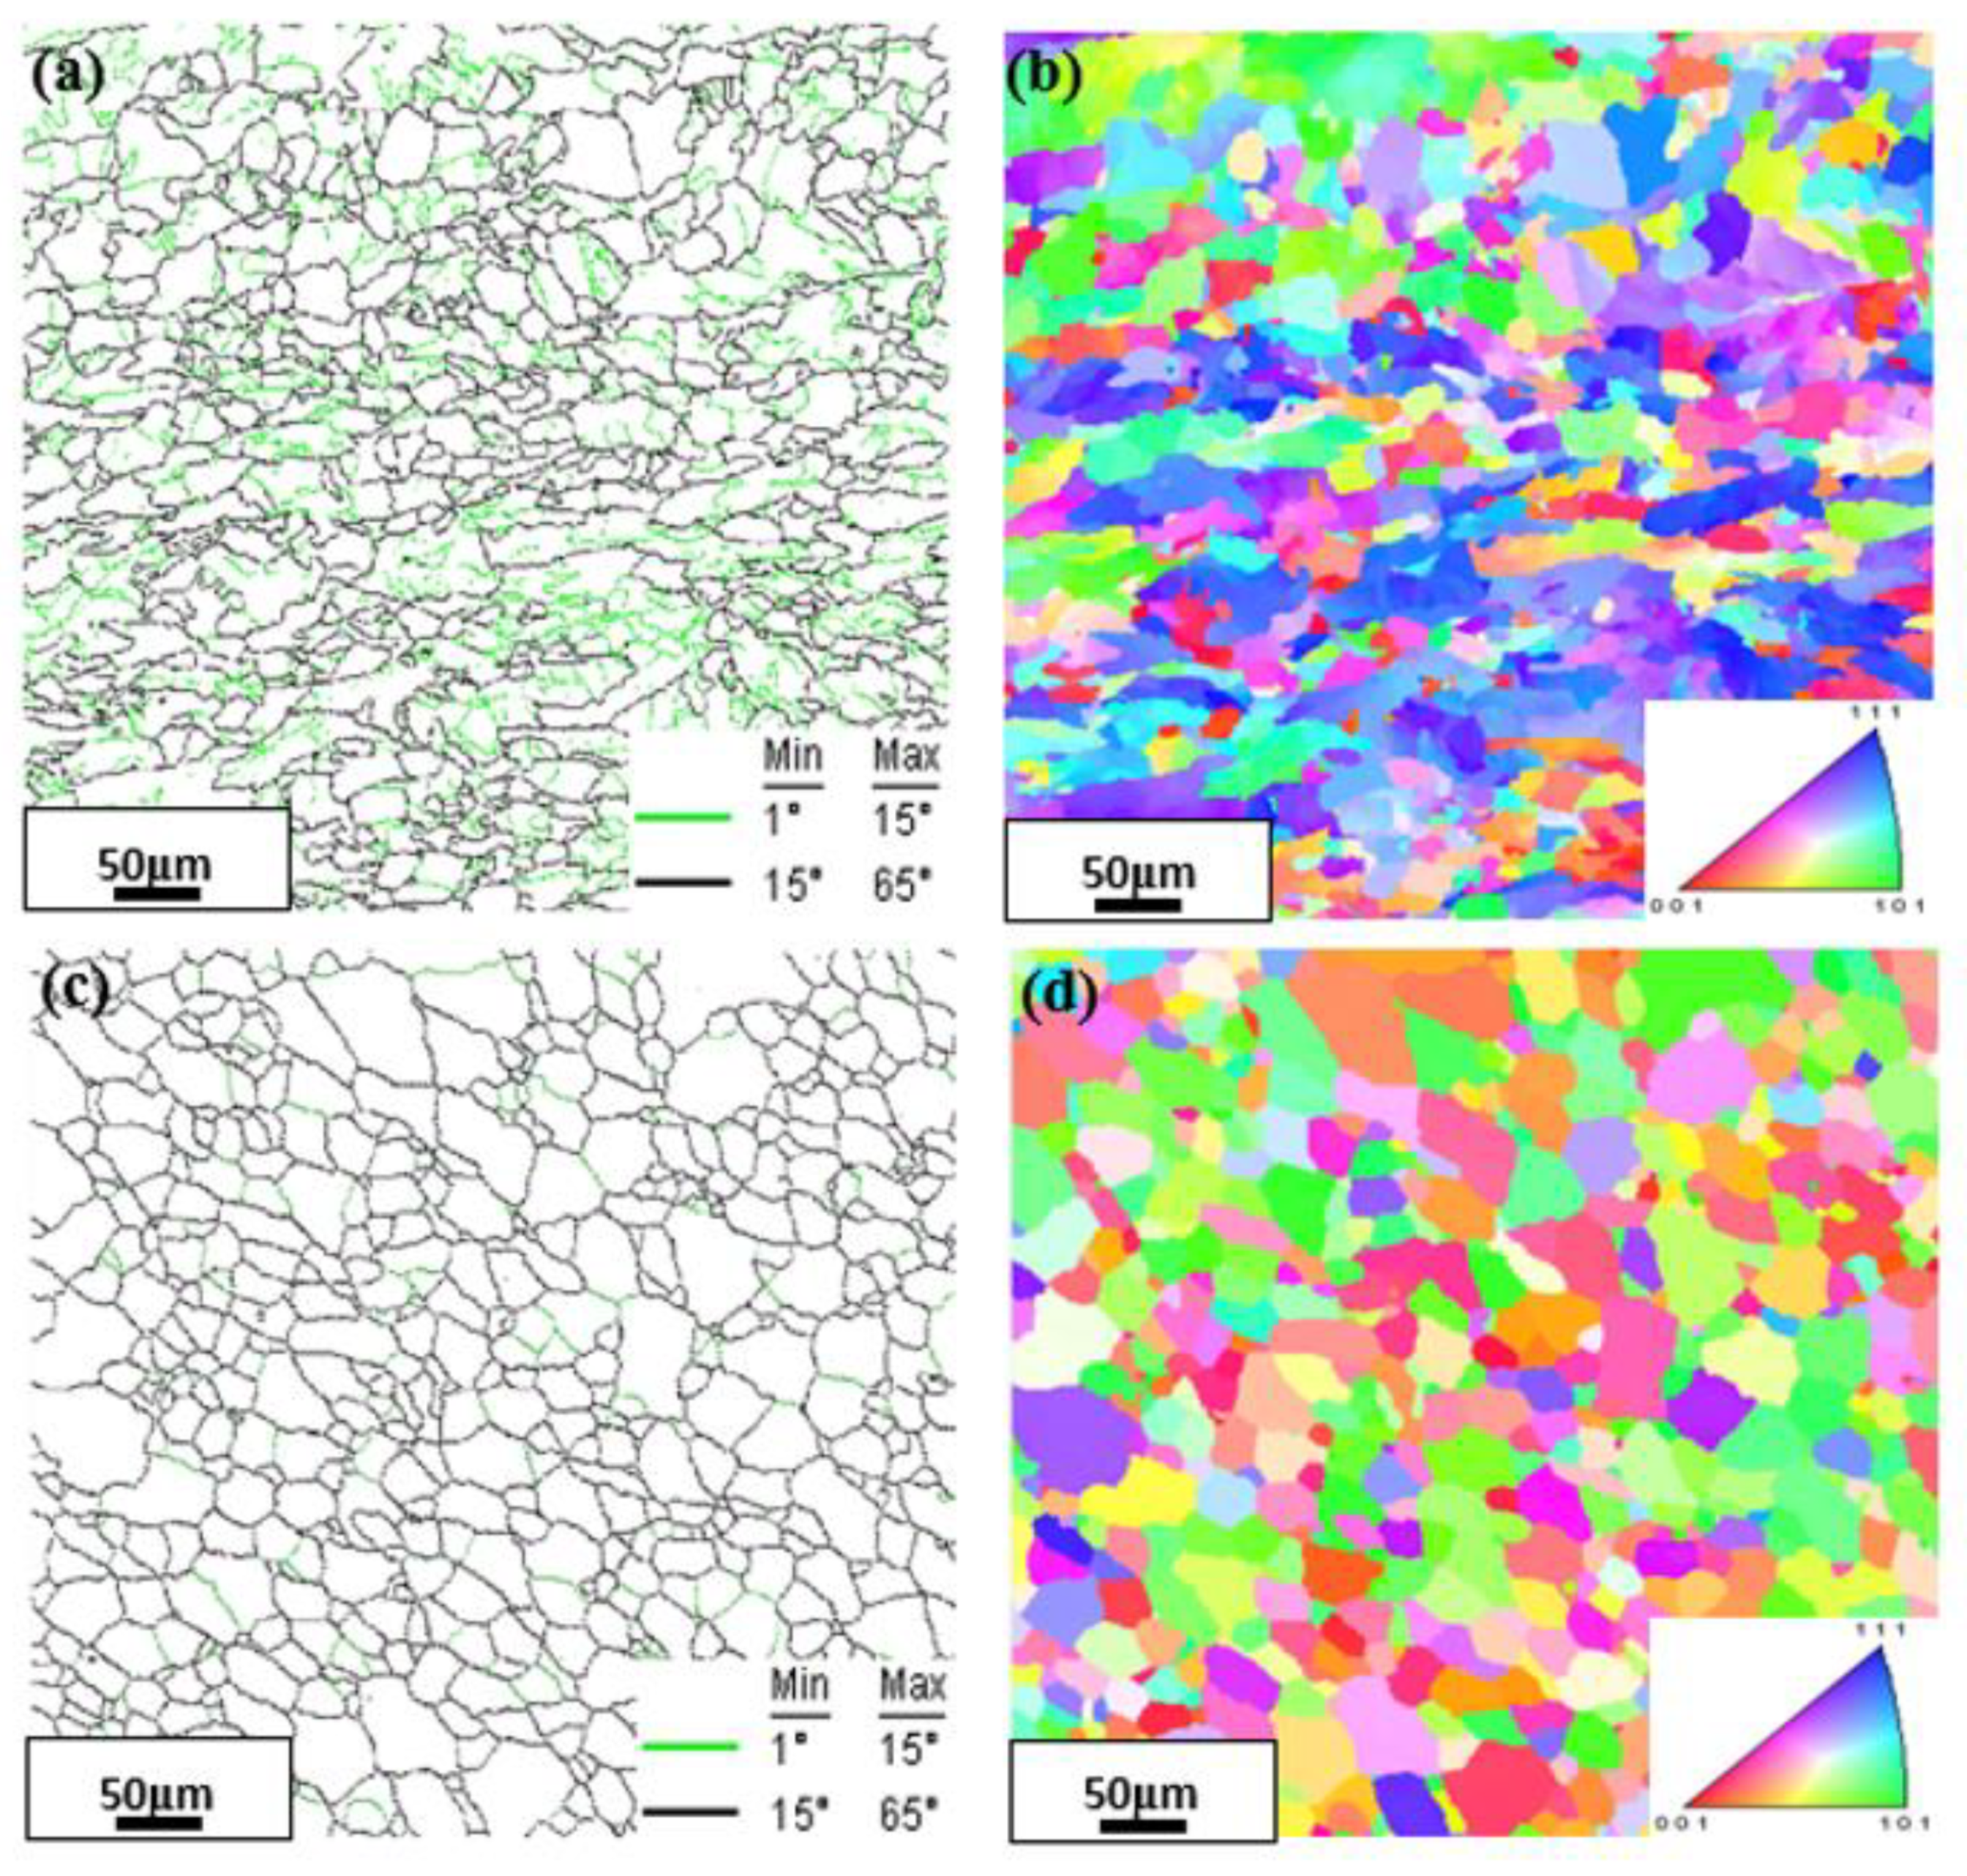
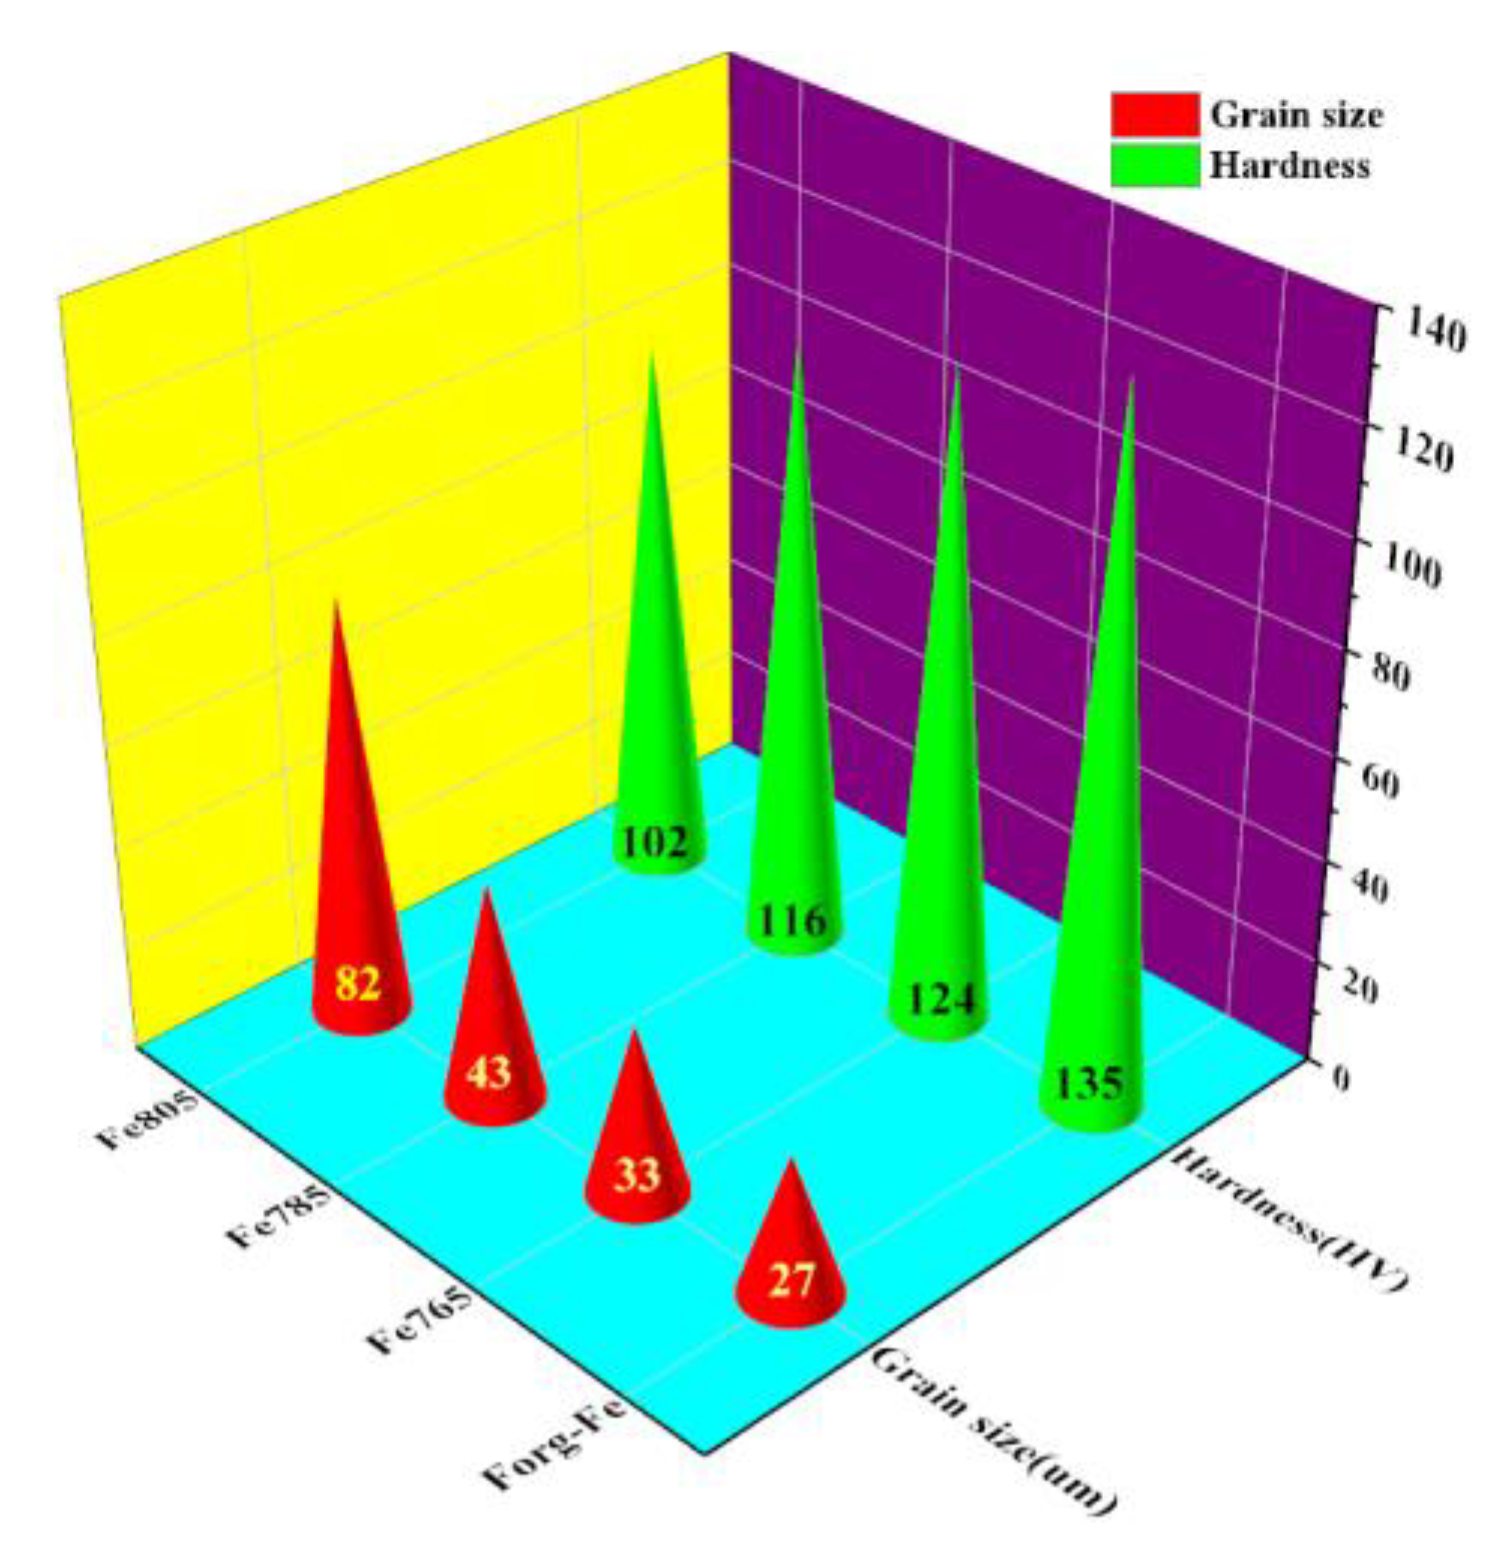
3.1. Grain Growth and Hardness Variation
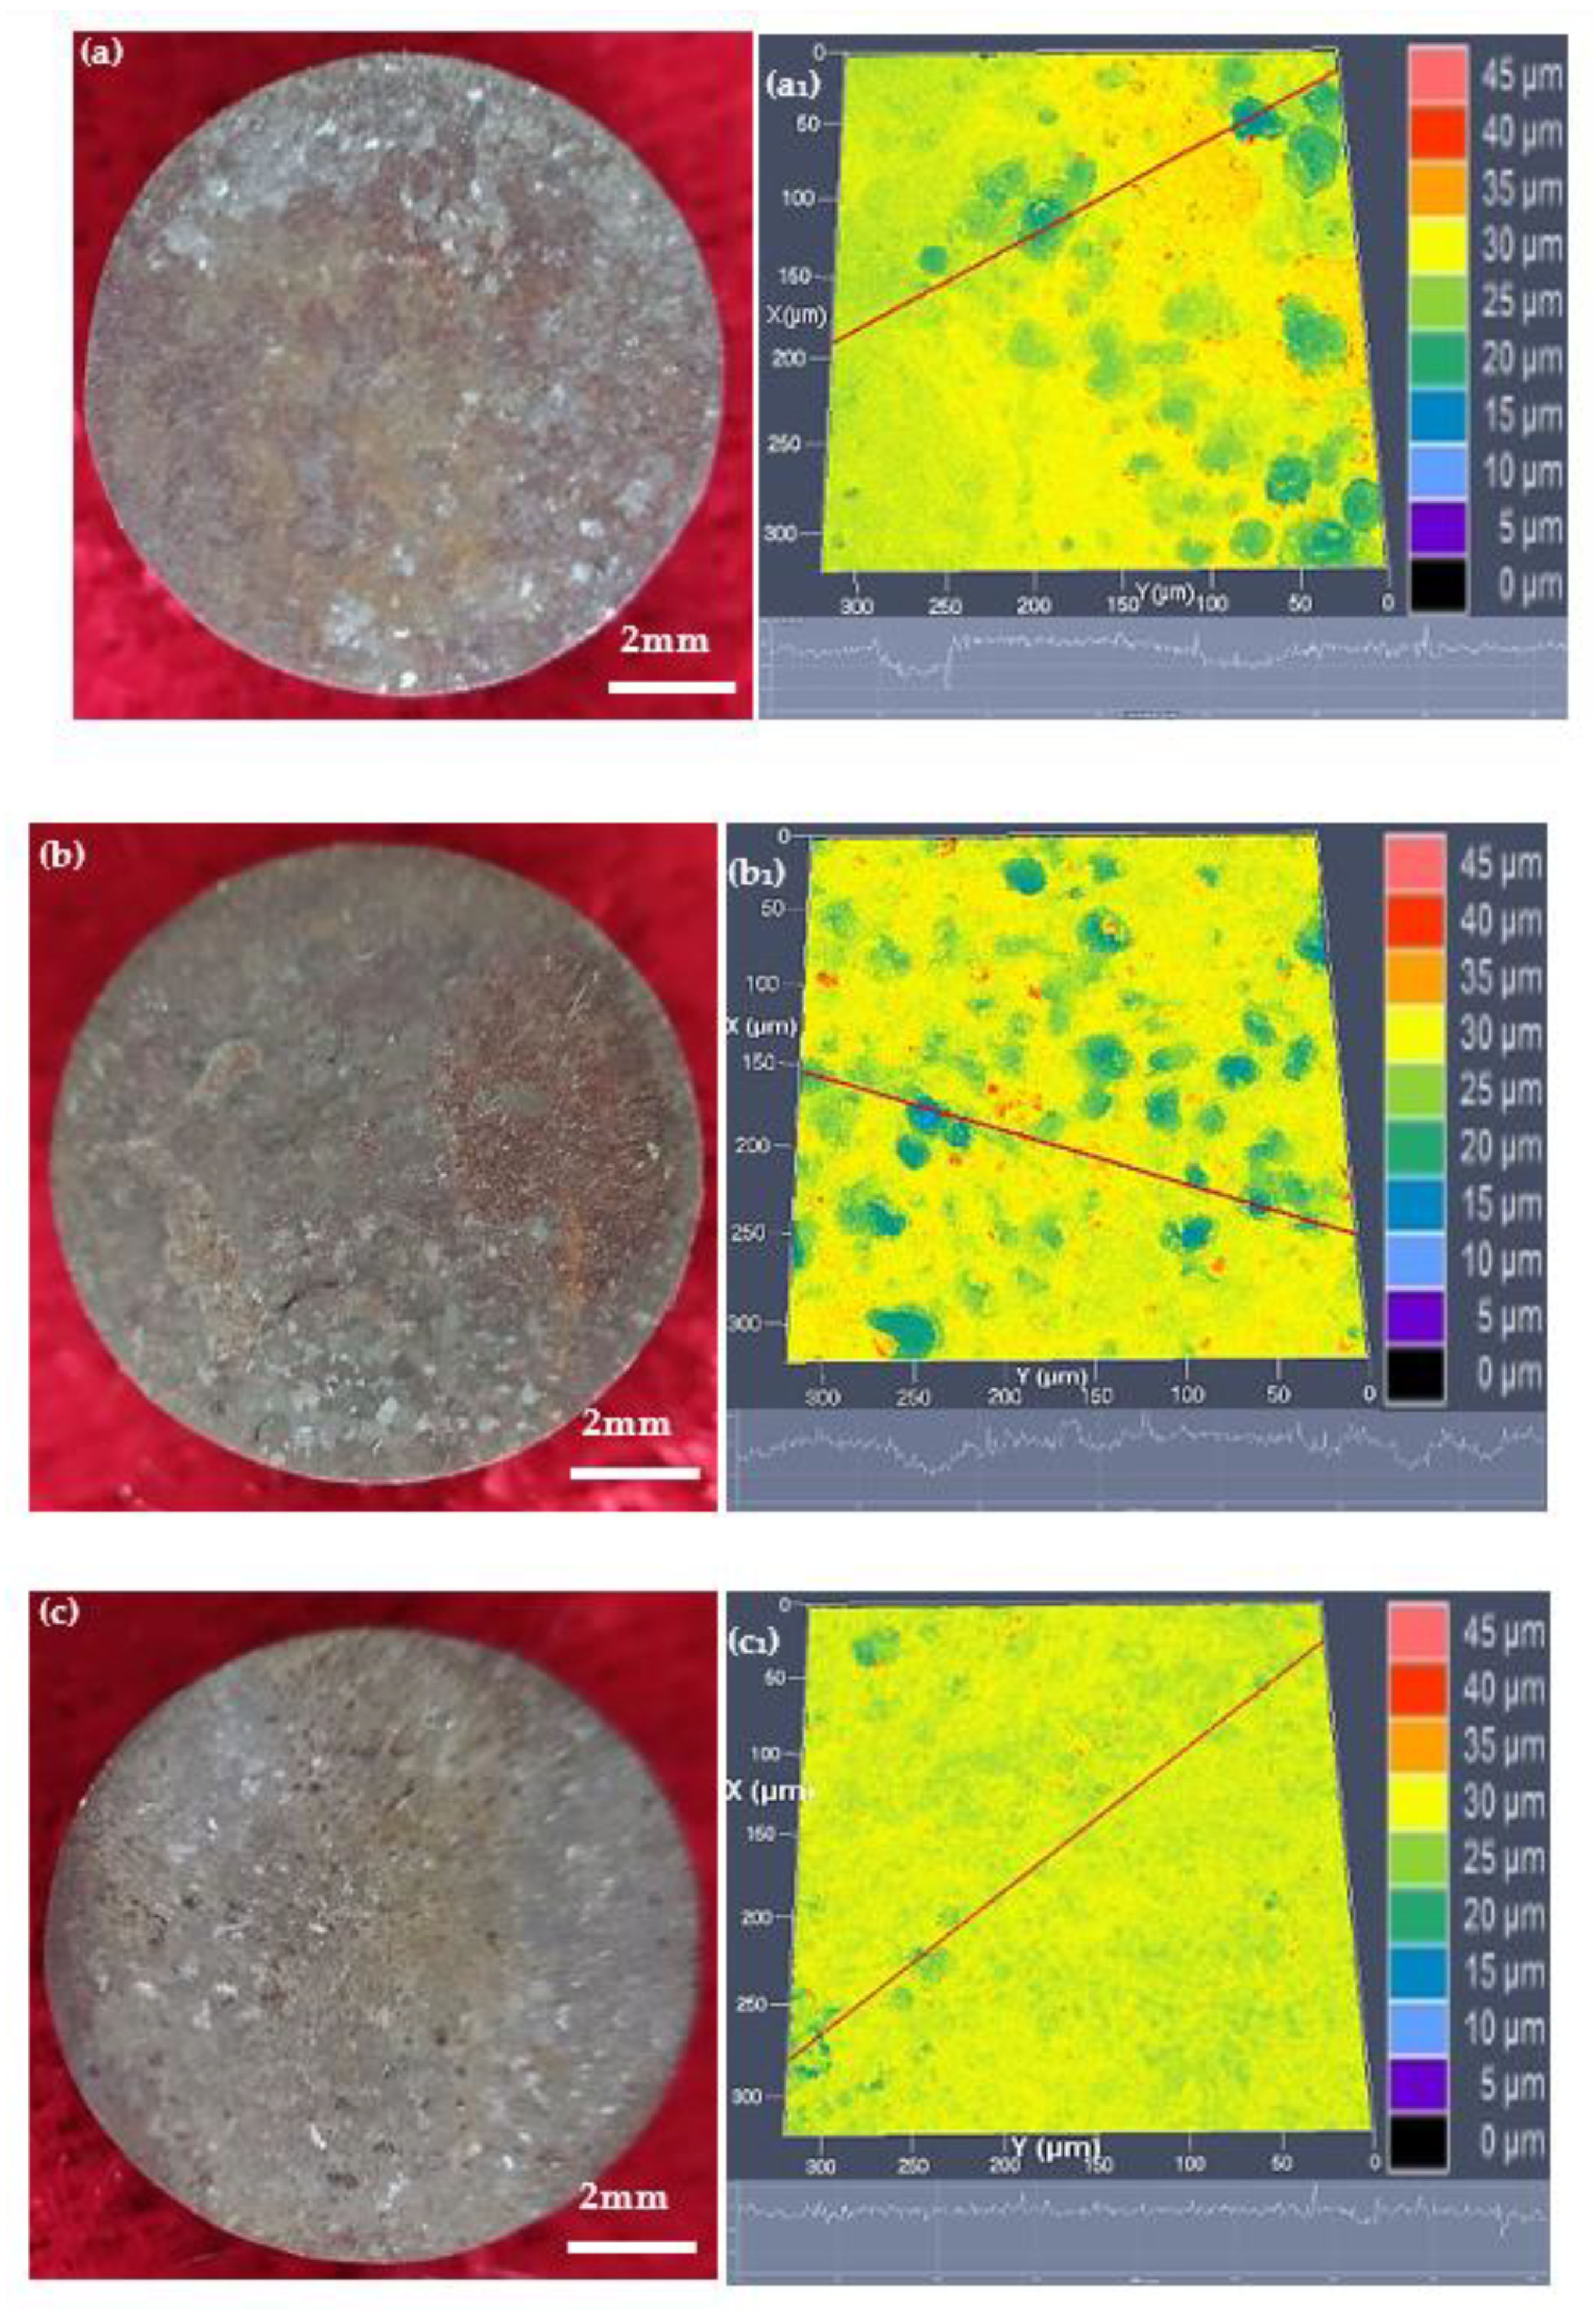
3.2. Biodegradation
4. Discussion
4.1. Grain Growth upon Annealing
4.2. Biodegradation
4.3. Safe Intake and Toxicity
5. Conclusions
- As annealed, the nuclei were generated at the sub-grain or grain boundaries of the original deformed microstructure, and the new undistorted ferrite grains with little residual stress and low dislocation density were formed.
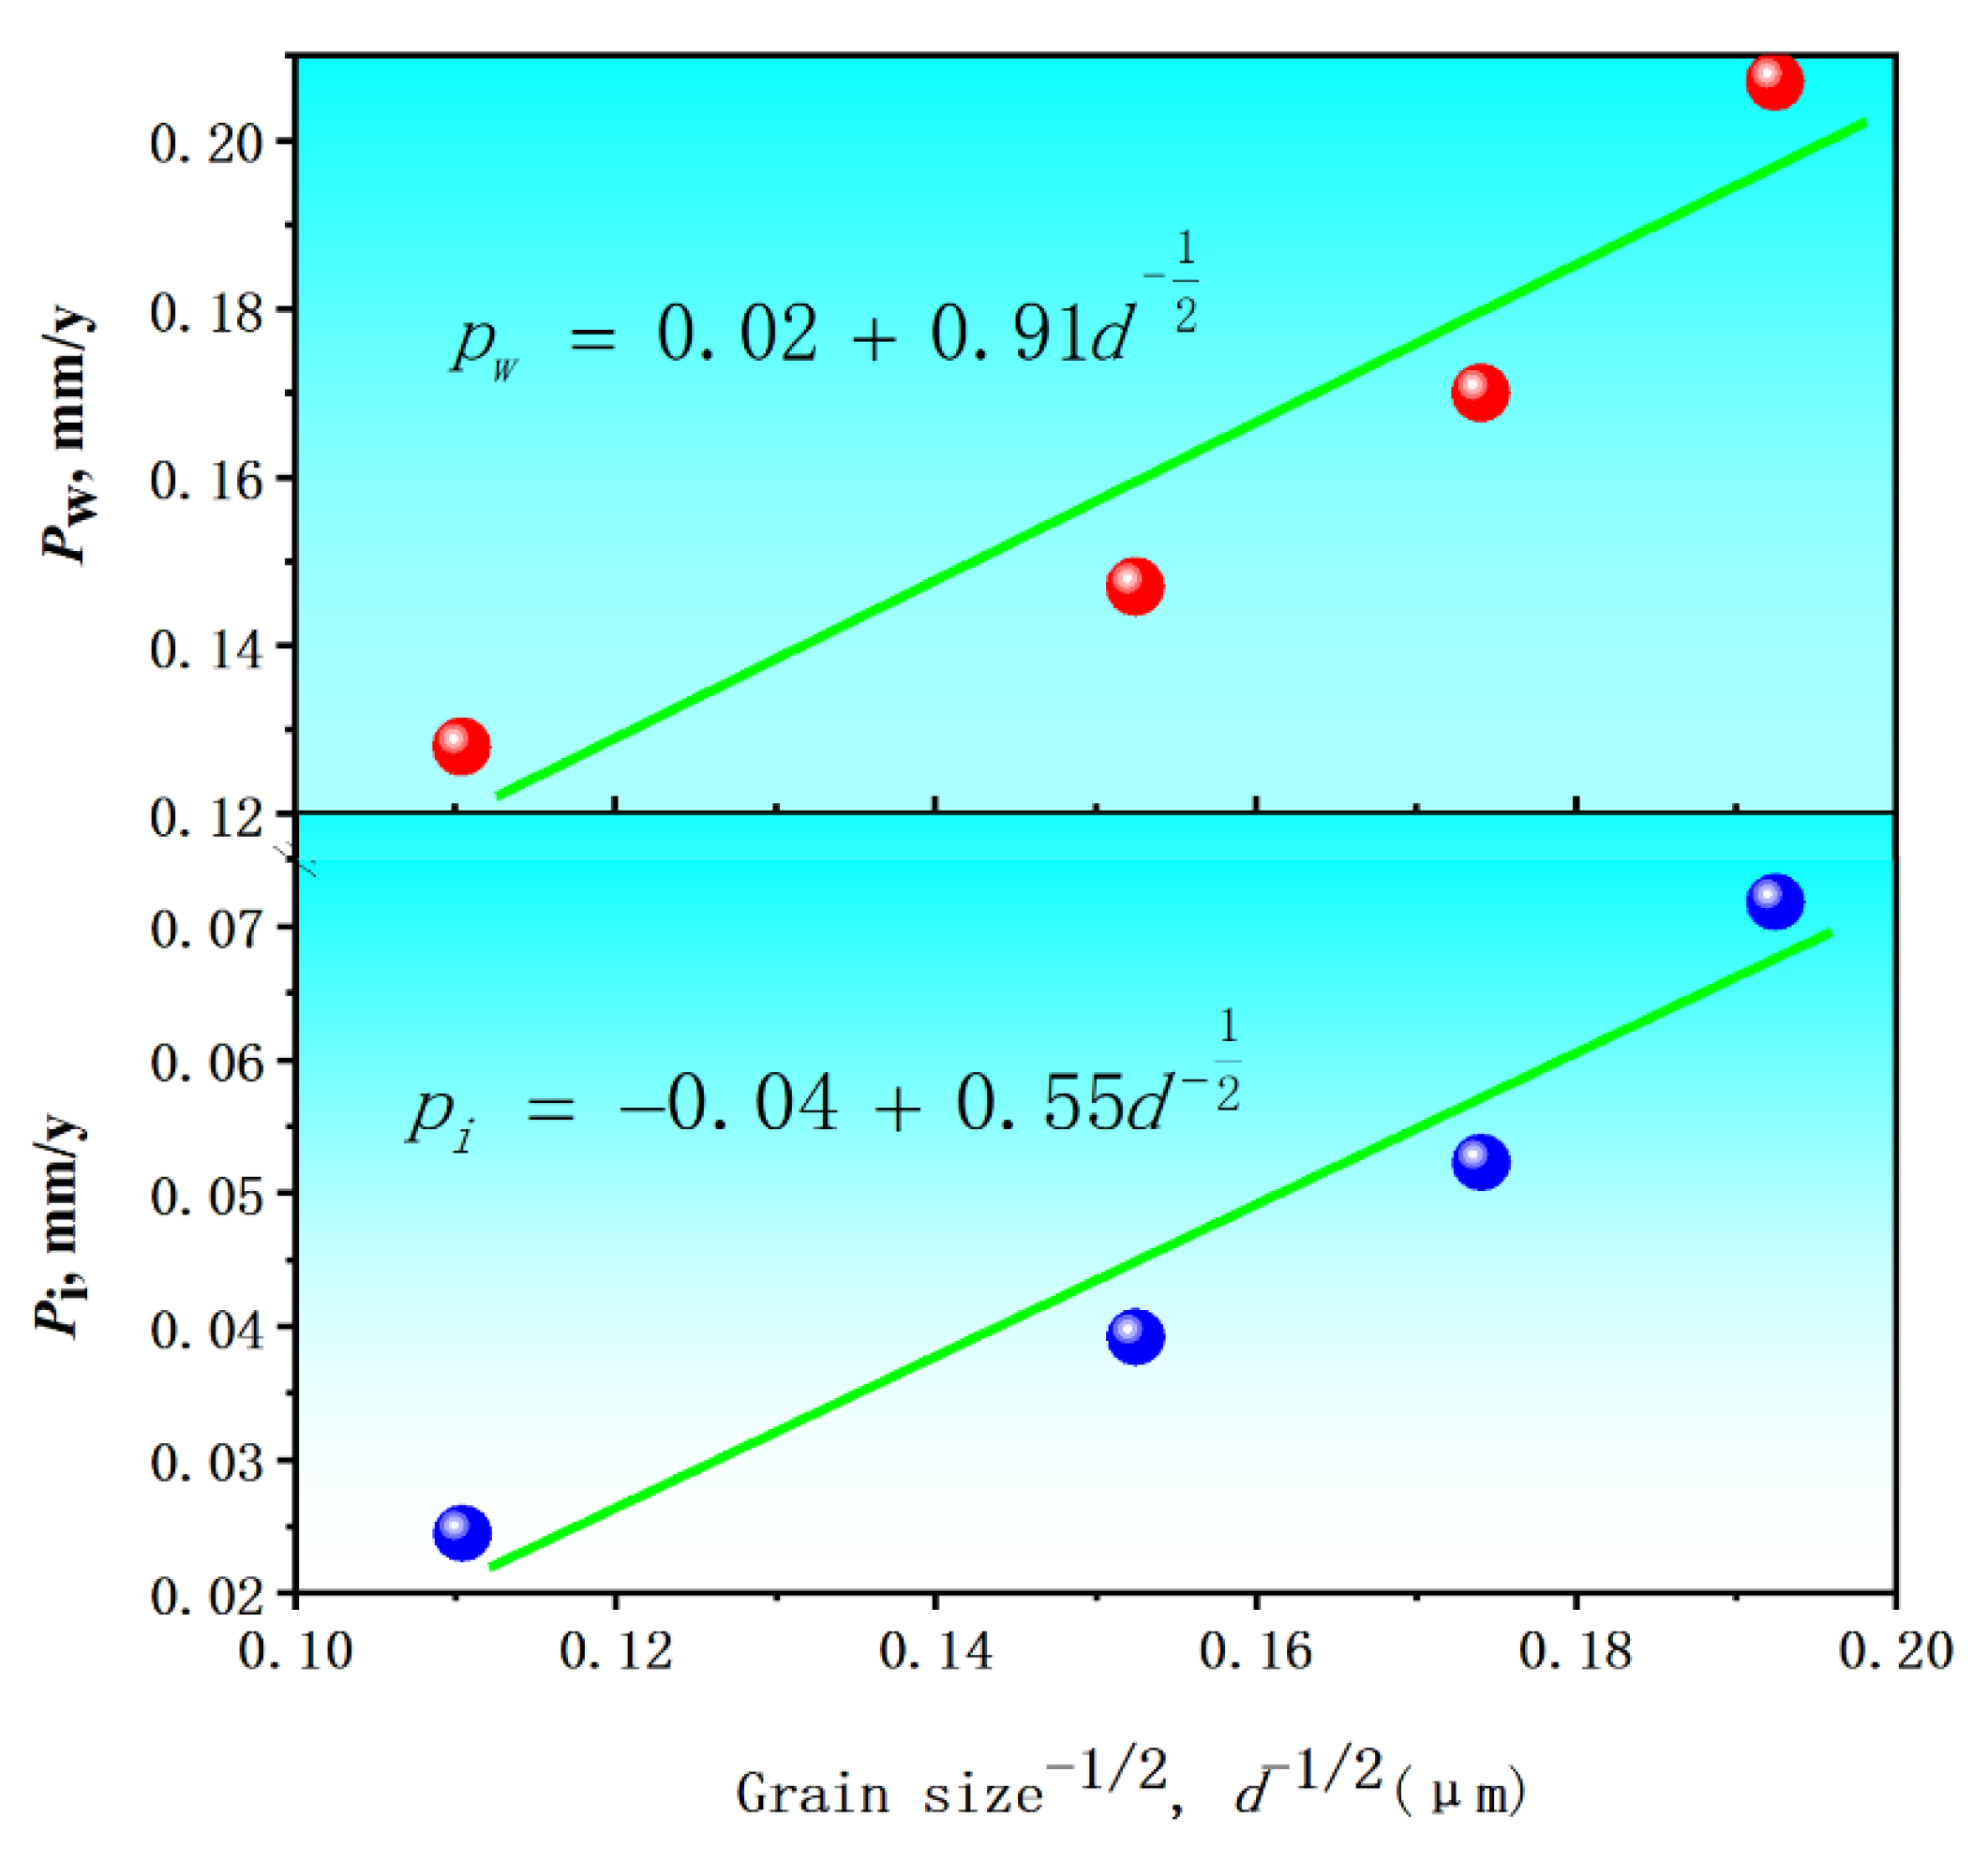
- A spectrum of ferrite grain size was gained by changing the annealed temperature. Hardness (HV) and biodegradation rate (Pi or Pw) were linearly ferrite grain size-dependent:
- ; and or .
- The biocompatibility of the pure iron experiencing annealing is acceptable.
- The obtained results were quite helpful for better regulating the biodegradation of biodegradable pure iron through annealing.
Author Contributions
Funding
Data Availability Statement
Conflicts of Interest
References
- Peuster, M.; Wohlsein, P.; Brugmann, M.; Ehlerding, M.; Seidler, K.; Fink, C.; Brauer, H.; Fischer, A.; Hausdorf, G. A novel approach to temporary stenting: Degradable cardiovascular stents produced from corrodible metal—Results 6–18 months after implantation into New Zealand white rabbits. Heart 2001, 86, 563–569. [Google Scholar] [CrossRef]
- Salama, M.; Vaz, M.F.; Colaço, R.; Santos, C.; Carmezim, M. Biodegradable Iron and Porous Iron: Mechanical Properties, Degradation Behaviour, Manufacturing Routes and Biomedical Applications. J. Funct. Biomater. 2022, 13, 72. [Google Scholar] [CrossRef] [PubMed]
- Peuster, M.; Hesse, C.; Schloo, T.; Fink, C.; Beerbaum, P.; von Schnakenburg, C.; von Schnakenburg, C. Long-term biocompatibility of a corrodible peripheral iron stent in the porcine descending aorta. Biomaterials 2006, 27, 4955–4962. [Google Scholar] [CrossRef]
- Zhao, Y.; Feng, J.; Yu, H.; Lin, W.; Li, X.; Tian, Y.; Zhao, M. Comparative Study on Biodegradation of Pure Iron Prepared by Microwave Sintering and Laser Melting. Materials 2022, 15, 1604. [Google Scholar] [CrossRef]
- Carluccio, D.; Bermingham, M.; Kent, D.; Demir, A.G.; Previtali, B.; Dargusch, M.S. Comparative study of pure iron manufactured by selective laser melting, laser metal deposition, and casting processes. Adv. Eng. Mater. 2019, 21, 1900049. [Google Scholar]
- Bagherifard, S.; Beni, R.N.; Kajanek, D.; Donnini, R.; Monti, S.; Molla, M.F.; Hadzima, B.; Guagliano, M. Inclined and multi-directional surface impacts accelerate biodegradation and improve mechanical properties of pure iron. J. Mech. Behav. Biomed. Mater. 2021, 119, 104476. [Google Scholar] [CrossRef]
- Obayi, C.S.; Tolouei, R.; Paternoster, C.; Turgeon, S.; Okorie, B.A.; Obikwelu, D.O.; Cassar, G.; Buhagiar, J.; Mantovani, D. Influence of cross-rolling on the micro-texture and biodegradation of pure iron as biodegradable material for medical implants. Acta Biomater. 2015, 17, 68–77. [Google Scholar] [CrossRef]
- Batista, B.A.; Soares, R.B.; Lins, V.D.C.; Figueiredo, R.B.; Hohenwarter, A.; Matencio, T. Corrosion in hank’s solution and mechanical strength of ultrafine-grained pure iron. Adv. Eng. Mater. 2020, 22, 2000183. [Google Scholar] [CrossRef]
- Obayi, C.S.; Tolouei, R.; Mostavan, A.; Paternoster, C.; Turgeon, S.; Okorie, B.A.; Obikwelu, D.O.; Mantovani, D. Effect of grain sizes on mechanical properties and biodegradation behavior of pure iron for cardiovascular stent application. Biomatter 2014, 6, e959874. [Google Scholar] [CrossRef]
- Zhao, Y.; Tang, Y.; Zhao, M.; Liu, L.; Gao, C.; Shuai, C.; Zeng, R.; Atrens, A.; Lin, Y. Graphene Oxide Reinforced Iron Matrix Composite with Enhanced Biodegradation Rate Prepared by Selective Laser Melting. Adv. Eng. Mater. 2019, 21, 1900314. [Google Scholar] [CrossRef]
- Deng, B.; Guo, Y.; Zhao, M.-C.; Li, Q.-F.; Ma, B.; Duan, B.; Yin, D.; Atrens, A. Study on a Novel Biodegradable and Antibacterial Fe-Based Alloy Prepared by Microwave Sintering. Materials 2021, 14, 3784. [Google Scholar] [CrossRef]
- Tian, Y.; Zhao, M.; Liu, W.; Zhang, J.; Zhang, M.; Li, H.; Yin, D.; Atrens, A. Comparison on Tensile Characteristics of Plain C–Mn Steel with Ultrafine Grained Ferrite/Cementite Microstructure and Coarse Grained Ferrite/Pearlite Microstructure. Materials 2021, 14, 2309. [Google Scholar] [CrossRef]
- Xie, B.; Zhao, M.-C.; Tao, J.-X.; Zhao, Y.-C.; Yin, D.; Gao, C.; Shuai, C.; Atrens, A. Comparison of the biodegradation of ZK30 subjected to solid solution treating and selective laser melting. J. Mater. Res. Technol. 2020, 10, 722–729. [Google Scholar] [CrossRef]
- Hansen, N. Hall–Petch relation and boundary strengthening. Scr. Mater. 2004, 51, 801–806. [Google Scholar] [CrossRef]
- Zhang, W.; Zhao, M.; Wang, Z.; Tan, L.; Qi, Y.; Yin, D.; Yang, K.; Atrens, A. Enhanced initial biodegradation resistance of the biomedical Mg-Cu alloy by surface nanomodification. J. Magnes. Alloy. 2022, in press. [Google Scholar] [CrossRef]
- Zheng, Z.; Zhao, M.-C.; Tan, L.; Zhao, Y.-C.; Xie, B.; Huang, L.; Yin, D.; Yang, K.; Atrens, A. Biodegradation behaviour of hydroxyapatite-containing self-sealing micro-arc-oxidation coating on pure Mg. Surf. Eng. 2021, 37, 942–952. [Google Scholar] [CrossRef]
- Wang, K.; Yin, D.; Zhao, Y.-C.; Atrens, A.; Zhao, M.-C. Microstructural evolution upon heat treatments and its effect on corrosion in Al-Zn-Mg alloys containing Sc and Zr. J. Mater. Res. Technol. 2020, 9, 5077–5089. [Google Scholar] [CrossRef]
- Sinha, A.K. Physical Metallurgy Handbook; McGraw-Hill Press: New York, NY, USA, 2003; Chapter 5; p. 40. [Google Scholar]
- Qu, Z.; Liu, L.; Deng, Y.; Tao, R.; Liu, W.; Zheng, Z.; Zhao, M.-C. Relationship between Biodegradation Rate and Grain Size Itself Excluding Other Structural Factors Caused by Alloying Additions and Deformation Processing for Pure Mg. Materials 2022, 15, 5295. [Google Scholar] [CrossRef] [PubMed]
- Gu, X.; Zheng, Y.; Cheng, Y.; Zhong, S.; Xi, T. In vitro corrosion and biocompatibility of binary magnesium alloys. Biomaterials 2009, 30, 484–498. [Google Scholar] [CrossRef] [PubMed]
- Yamamoto, A.; Honma, R.; Sumita, M. Cytotoxicity evaluation of 43 metal salts using murine fibroblasts and osteoblastic cells. J. Biomed. Mater. Res. 1998, 39, 331–340. [Google Scholar] [CrossRef]
- Hermawan, H.; Purnama, A.; Dube, D.; Couet, J.; Mantovani, D. Fe–Mn alloys for metallic biodegradable stents: Degradation and cell viability studies. Acta Biomater. 2010, 6, 1852–1860. [Google Scholar] [CrossRef] [PubMed]
- Zhao, Y.; Tang, Y.; Zhao, M.; Liu, C.; Liu, L.; Gao, C.; Shuai, C.; Atrens, A. Study on Fe-xGO composites prepared by selective laser melting: Microstructure, hardness, biodegradation and Cytocompatibility. JOM 2020, 72, 1163–1174. [Google Scholar] [CrossRef]
- Yusop, A.H.; Daud, N.M.; Nur, H.; Kadir, M.R.A.; Hermawan, H. Controlling the degradation kinetics of porous iron by poly(lactic-co-glycolic acid) infiltration for use as temporary medical implants. Sci. Rep. 2015, 5, 11194. [Google Scholar] [CrossRef]
- Guo, Y.X.; Zhao, M.C.; Xie, B.; Zhao, Y.C.; Yin, D.F.; Gao, C.D.; Shuai, C.J.; Atrens, A. In vitro Corrosion resistance and antibacterial performance of novel Fe-xCu biomedical alloys prepared by selective laser melting. Adv. Eng. Mater. 2021, 23, 2001000. [Google Scholar] [CrossRef]
- Zhu, S.; Huang, N.; Xu, L.; Zhang, Y.; Liu, H.; Sun, H.; Leng, Y. Biocompatibility of pure iron: In vitro assessment of degradation kinetics and cytotoxicity on endothelial cells. Mater. Sci. Eng. C 2009, 29, 1589–1592. [Google Scholar] [CrossRef]


| Specimens No. | Ecorr (VSCE) | icorr (μA/cm2) |
|---|---|---|
| Fe765 | −0.587 | 4.686 |
| Fe785 | −0.574 | 3.514 |
| Fe805 | −0.586 | 2.196 |
| Specimen No. | RS (Ω cm2) | CPEfilm-T (Ω−1 s−n/cm2) | n | Rf (Ω cm2) | CPEct-T (Ω−1 s−n/cm2) | n | Rt (Ω cm2) |
|---|---|---|---|---|---|---|---|
| Fe765 | 20.47 | 6.339 × 10⁻⁵ | 0.692 | 15.11 | 1.275 × 10⁻⁴ | 0.724 | 2.822 × 10³ |
| Fe785 | 21.79 | 1.59 × 10⁻⁴ | 0.708 | 14.38 | 6.18 × 10⁻⁶ | 0.883 | 3.40 × 10³ |
| Fe805 | 19.62 | 4.272 × 10⁻⁵ | 0.747 | 8.964 | 1.335 × 10⁻⁴ | 0.775 | 4.915 × 10³ |
| Specimen No. | Pi (mm y−1) | Pw (mm y−1) |
|---|---|---|
| Initial forged condition | 0.0718 | 0.207 ± 0.6 |
| Fe765 | 0.0523 | 0.170 ± 0.5 |
| Fe785 | 0.0392 | 0.147 ± 0.3 |
| Fe805 | 0.0245 | 0.128 ± 0.3 |
Publisher’s Note: MDPI stays neutral with regard to jurisdictional claims in published maps and institutional affiliations. |
© 2022 by the authors. Licensee MDPI, Basel, Switzerland. This article is an open access article distributed under the terms and conditions of the Creative Commons Attribution (CC BY) license (https://creativecommons.org/licenses/by/4.0/).
Share and Cite
Zhang, Y.; Zhang, K.; Liu, W.; Zheng, Z.; Zhao, M. Grain Growth upon Annealing and Its Influence on Biodegradation Rate for Pure Iron. Materials 2022, 15, 8030. https://doi.org/10.3390/ma15228030
Zhang Y, Zhang K, Liu W, Zheng Z, Zhao M. Grain Growth upon Annealing and Its Influence on Biodegradation Rate for Pure Iron. Materials. 2022; 15(22):8030. https://doi.org/10.3390/ma15228030
Chicago/Turabian StyleZhang, Yu, Ke Zhang, Weidong Liu, Zhongren Zheng, and Mingchun Zhao. 2022. "Grain Growth upon Annealing and Its Influence on Biodegradation Rate for Pure Iron" Materials 15, no. 22: 8030. https://doi.org/10.3390/ma15228030
APA StyleZhang, Y., Zhang, K., Liu, W., Zheng, Z., & Zhao, M. (2022). Grain Growth upon Annealing and Its Influence on Biodegradation Rate for Pure Iron. Materials, 15(22), 8030. https://doi.org/10.3390/ma15228030