Article

Modeling of Hydrogen Diffusion in Inhomogeneous Steel Welded Joints

by
Andrei I. Rudskoi
,
Victor A. Karkhin
,
Egor B. Starobinskii
and
Sergey G. Parshin
*
Institute of Mechanical Engineering, Materials and Transport, Higher School of Physics and Materials Technologies, Peter the Great St. Petersburg Polytechnic University, St. Petersburg 195251, Russia
*
Author to whom correspondence should be addressed.
Materials 2022, 15(21), 7686; https://doi.org/10.3390/ma15217686
Submission received: 23 September 2022 / Revised: 19 October 2022 / Accepted: 21 October 2022 / Published: 1 November 2022
(This article belongs to the Special Issue Finite Element Analysis and Simulation of Materials)

Abstract

:
Hydrogen is a main factor in cold cracking or hydrogen-induced cracking. The most crack susceptible region of a steel welded joint is the heat affected zone (HAZ). The formulation and functional-analytical solution of the one-dimensional problem of hydrogen diffusion in an inhomogeneous butt-welded joint considering weld and joint dimensions and initial hydrogen distribution as well as hydrogen diffusion coefficients and solubilities are presented. It is shown that the peak hydrogen concentration in the HAZ of inhomogeneous joints varies in direct proportion to the initial hydrogen concentration in the weld metal. It is inversely proportional to the ratio of hydrogen solubilities in the weld metal and the HAZ metal and is nonlinear in the diffusion coefficient ratio of these metals. The peak hydrogen concentration in the HAZ can exceed 170% of the average initial concentration in the joint if martensitic steel is welded using low-carbon low-alloy welding consumables. The utilization of austenitic consumables leads to a dramatic reduction in the hydrogen concentration in the HAZ in comparison with the non-austenitic consumables. No direct relationship was found between the hydrogen concentration in the HAZ and the hydrogen evolution from the joint surface.

1. Introduction

It is well-known that the cold cracking of steel weldments is promoted by higher strength microstructure (such as martensite), higher tensile stresses (as those imposed in welding in restrained heavy sections), and higher levels of diffusible hydrogen. Cold cracking is also called hydrogen-induced or hydrogen-assisted cracking. Hydrogen cracking may occur in both the weld metal (WM) and the heat affected zone (HAZ), although it is most prevalent in the HAZ due to the combination of the microstructure and tensile restraint that exists in the region of the weld [1]. To assess the probability of cold cracking based on strength criteria, information on the local hydrogen concentration in crack susceptible regions is required.
There are several reliable procedures for the determination of hydrogen content in the weld and deposited metal [2]. Measurement of a local concentration of hydrogen, however, is extremely difficult due to the high mobility of hydrogen atoms in a crystalline lattice. Because of this, calculation methods are widely used in the assessment of hydrogen diffusion from the WM to the HAZ, and reasonably comprehensive physical-mathematical models for hydrogen diffusion have been developed [2,3,4,5,6,7,8]. To be utilized, such models require the application of numerical methods and in common with all physical experiments, they suffer from the drawback that the results are often difficult to generalize, and it is thus difficult to find a general rule. Functional analysis methods allow the solution of the problem to be presented as a formula, but they require considerable simplification of the physical model [6,9,10,11].
The aim of the study was to develop an approximate analytical model for hydrogen diffusion with consideration for weld and joint dimensions, different initial hydrogen concentrations in the WM and the base metal (BM), and inhomogeneity in the microstructure (diffusion coefficients and hydrogen solubilities) of the WM and BM. The model is demonstrated with different combinations of the WM and BM.

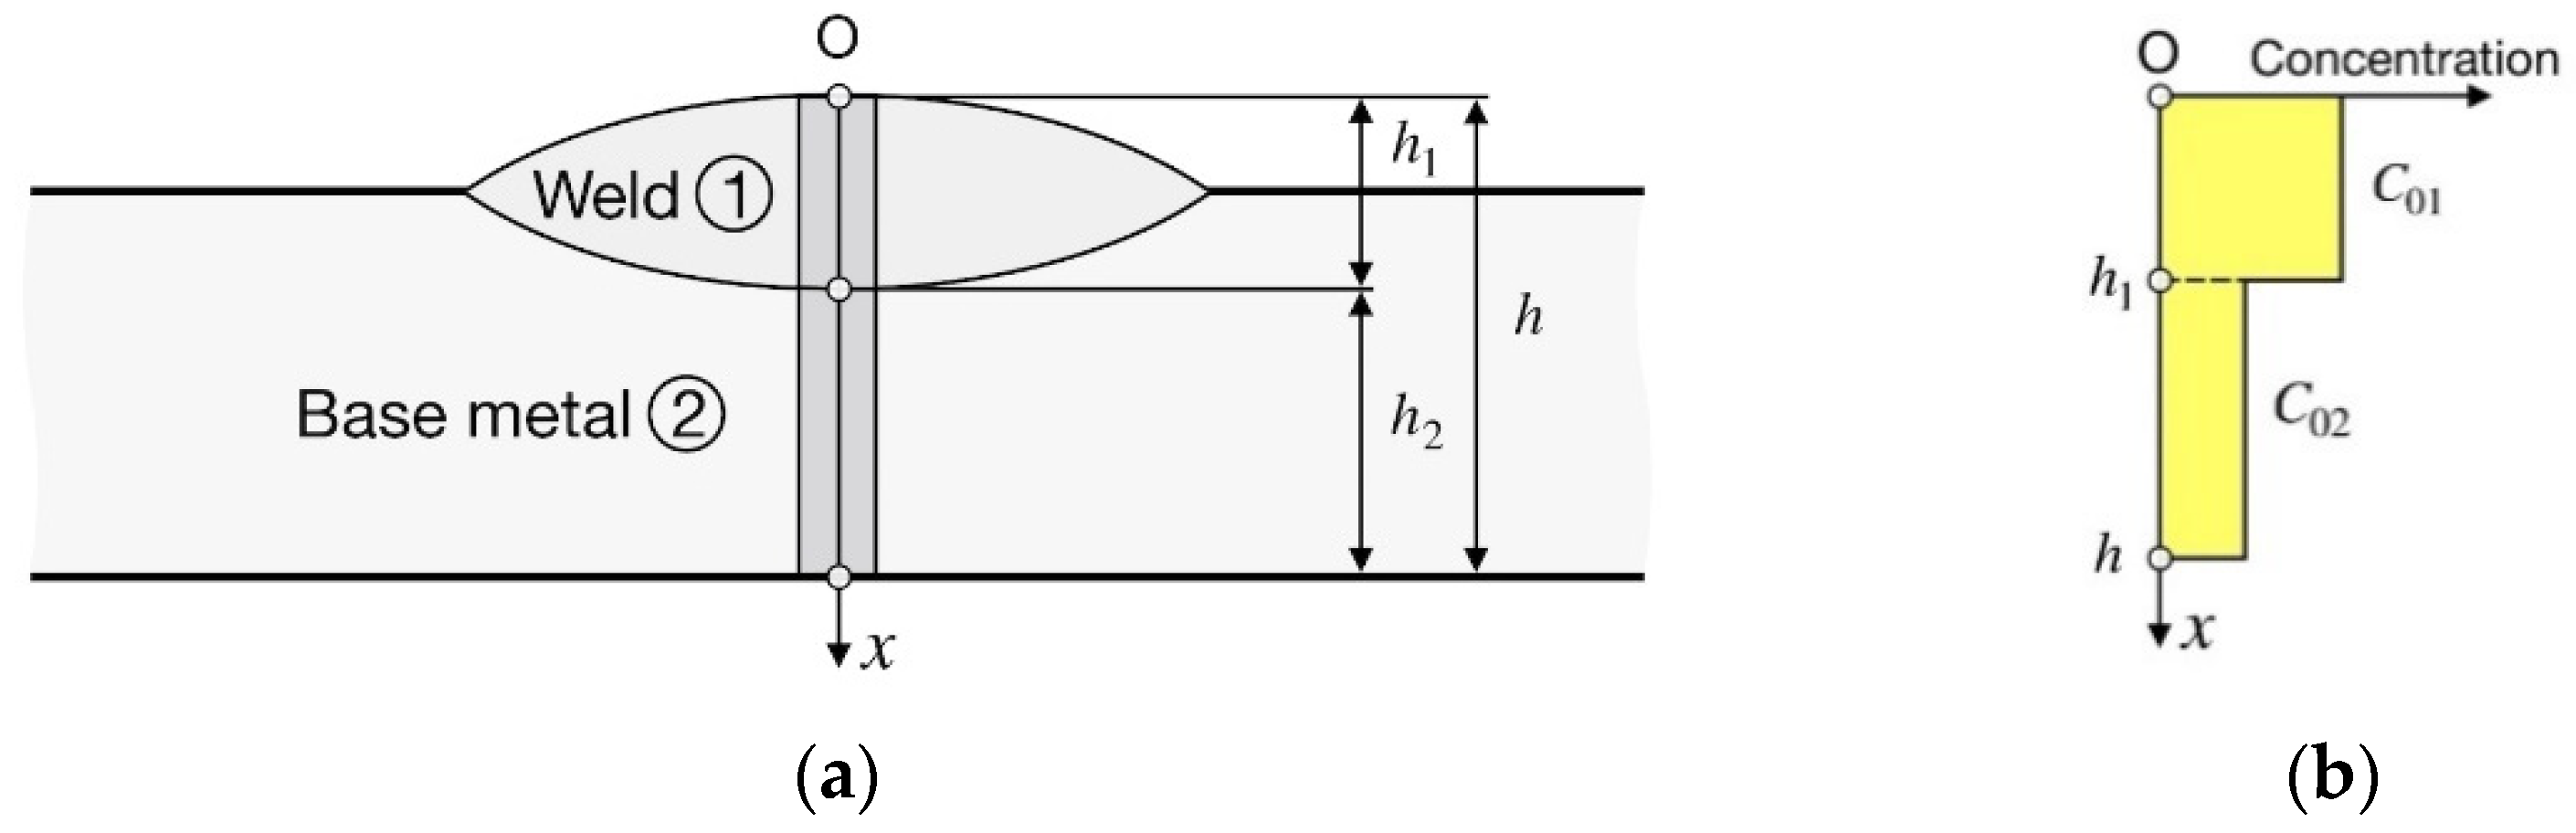
2. Statement of the Hydrogen Diffusion Problem

Let us make the following assumptions:
A welded joint consists of two materials (WM and BM) with different diffusion coefficients, D1 and D2, and solubilities, S1 and S2, with a stationary composite interface (subscript 1 refers to the WM and subscript 2 to the BM) (Figure 1a).
Properties D1, D2 and S1/S2 are constant at any moment.
The initial hydrogen concentration is constant in the WM (C01 = const) and in the BM (C02 = const) (Figure 1b).
Surface concentrations of hydrogen are zero because of very low hydrogen partial pressure in the air.
There are no hydrogen traps or other internal hydrogen sources and sinks.
Hydrogen flow is one-dimensional and directed along the x-axis and normally to the welding line (Figure 1a). This is more valid; the wider is the weld relative to the depth of penetration and the plate thickness.
The assumptions made allowed for the problem to be formulated in the following way.
(1)
Mass transfer equation (Fick’s law):
C 1 ( x , t ) t = D 1 2 C 1 ( x , t ) x 2 , t > 0 , 0 < x < h 1
C 2 ( x , t ) t = D 2 2 C 2 ( x , t ) x 2 , t > 0 , h 1 < x < h 2 ,
where t is the time.
(2)
Initial conditions ( t = 0 , Figure 1b):
C 1 ( x , 0 ) = C 01 ,
C 2 ( x , 0 ) = C 02 .
(3)
Boundary conditions (Figure 1a):
C 1 ( 0 , t ) = 0 ,
C 2 ( h , t ) = 0 .
Flux is continuous over the surface of separation of the two media and the partition coefficient k0 is constant, according to Nernst’s law:
D 1 C 1 ( h 1 , t ) x = D 2 C 2 ( h 1 , t ) x ,
C 1 ( h 1 , t ) C 2 ( h 1 , t ) = S 1 S 2 = k 0 .

3. Solution of the Hydrogen Diffusion Problem

The formulated linear boundary-value problem (1)–(8) can be solved by integral transformation [12]:
C 1 ( x , t ) = k 0 n = 1 [ ( C 01 A n + C 02 B n ) sin ( β n h 2 ) sin ( k β n x ) exp ( D 2 β n 2 t ) ] ,
C 2 ( x , t ) = n = 1 [ ( C 01 A n + C 02 B n ) sin ( k β n h 1 ) sin ( β n ( h x ) ) exp ( D 2 β n 2 t ) ] ,
where:
A n = 2 sin ( β n h 2 ) k β n 1 cos ( k β n h 1 ) h 2 sin 2 ( k β n h 1 ) + k 0 h 1 sin 2 ( β n h 2 ) ,
B n = 2 sin ( k β n h 1 ) β n 1 cos ( β n h 2 ) h 2 sin 2 ( k β n h 1 ) + k 0 h 1 sin 2 ( β n h 2 ) ,
where k = D 2 D 1 and β n are the positive roots of the equation:
cot ( β h 2 ) + k 0 k cot ( k β h 1 ) = 0 .
Here, it was assumed that kh1/h2 is an irrational fraction [12].
If a welded joint is homogeneous (k0 = 1, D1 = D2 = D), the solution of the problem takes a simple form:
C ( x , t ) = n = [ C 01 erf ( x 2 n h 4 D t ) C 02 erf ( x + ( 2 n 1 ) h 4 D t ) 1 2   m = 1 , 1 { C 01 erf ( x 2 n h + m h 1 4 D t ) C 02 erf ( x + ( 2 n 1 ) h + m h 2 4 D t ) } ] ,
where erf ( u ) = 2 π 0 u e u 2   d u .
If the lower surface of the plate does not affect the hydrogen diffusion, that is, the distance between the weld interface and the lower surface is great enough (theoretically h2→∞), then the hydrogen concentration distribution in such an inhomogeneous solid is described by the following equations [10]:
C 1 ( x , t ) = C 01 C 01 erfc ( x 4 D 1 t ) + C 01 n = 1 B n [ erfc ( 2 n h 1 x 4 D 1 t ) erfc ( 2 n h 1 + x 4 D 1 t ) ] k C 01 k 0 C 02 k + k 0 n = 1 B n 1 [ erfc ( ( 2 n 1 ) h 1 x 4 D 1 t ) erfc ( ( 2 n 1 ) h 1 + x 4 D 1 t ) ] ,
C 2 ( x , t ) = C 02 + k 0 k + k 0 { ( C 01 k 0 C 02 ) erfc ( x h 1 4 D 2 t ) 2 C 01 k 0 n = 1 B n 1 erfc ( x h 1 + ( 2 n 1 ) h 1 D 2 / D 1 4 D 2 t ) + 2 k k + k 0 ( C 01 k 0 C 02 ) n = 1 B n 1 erfc ( x h 1 + 2 n h 1 D 2 / D 1 4 D 2 t ) } ,
where B = k k 0 k + k 0 ,   erfc ( u ) = 1 erf ( u ) .
The corresponding computer programs have been developed.

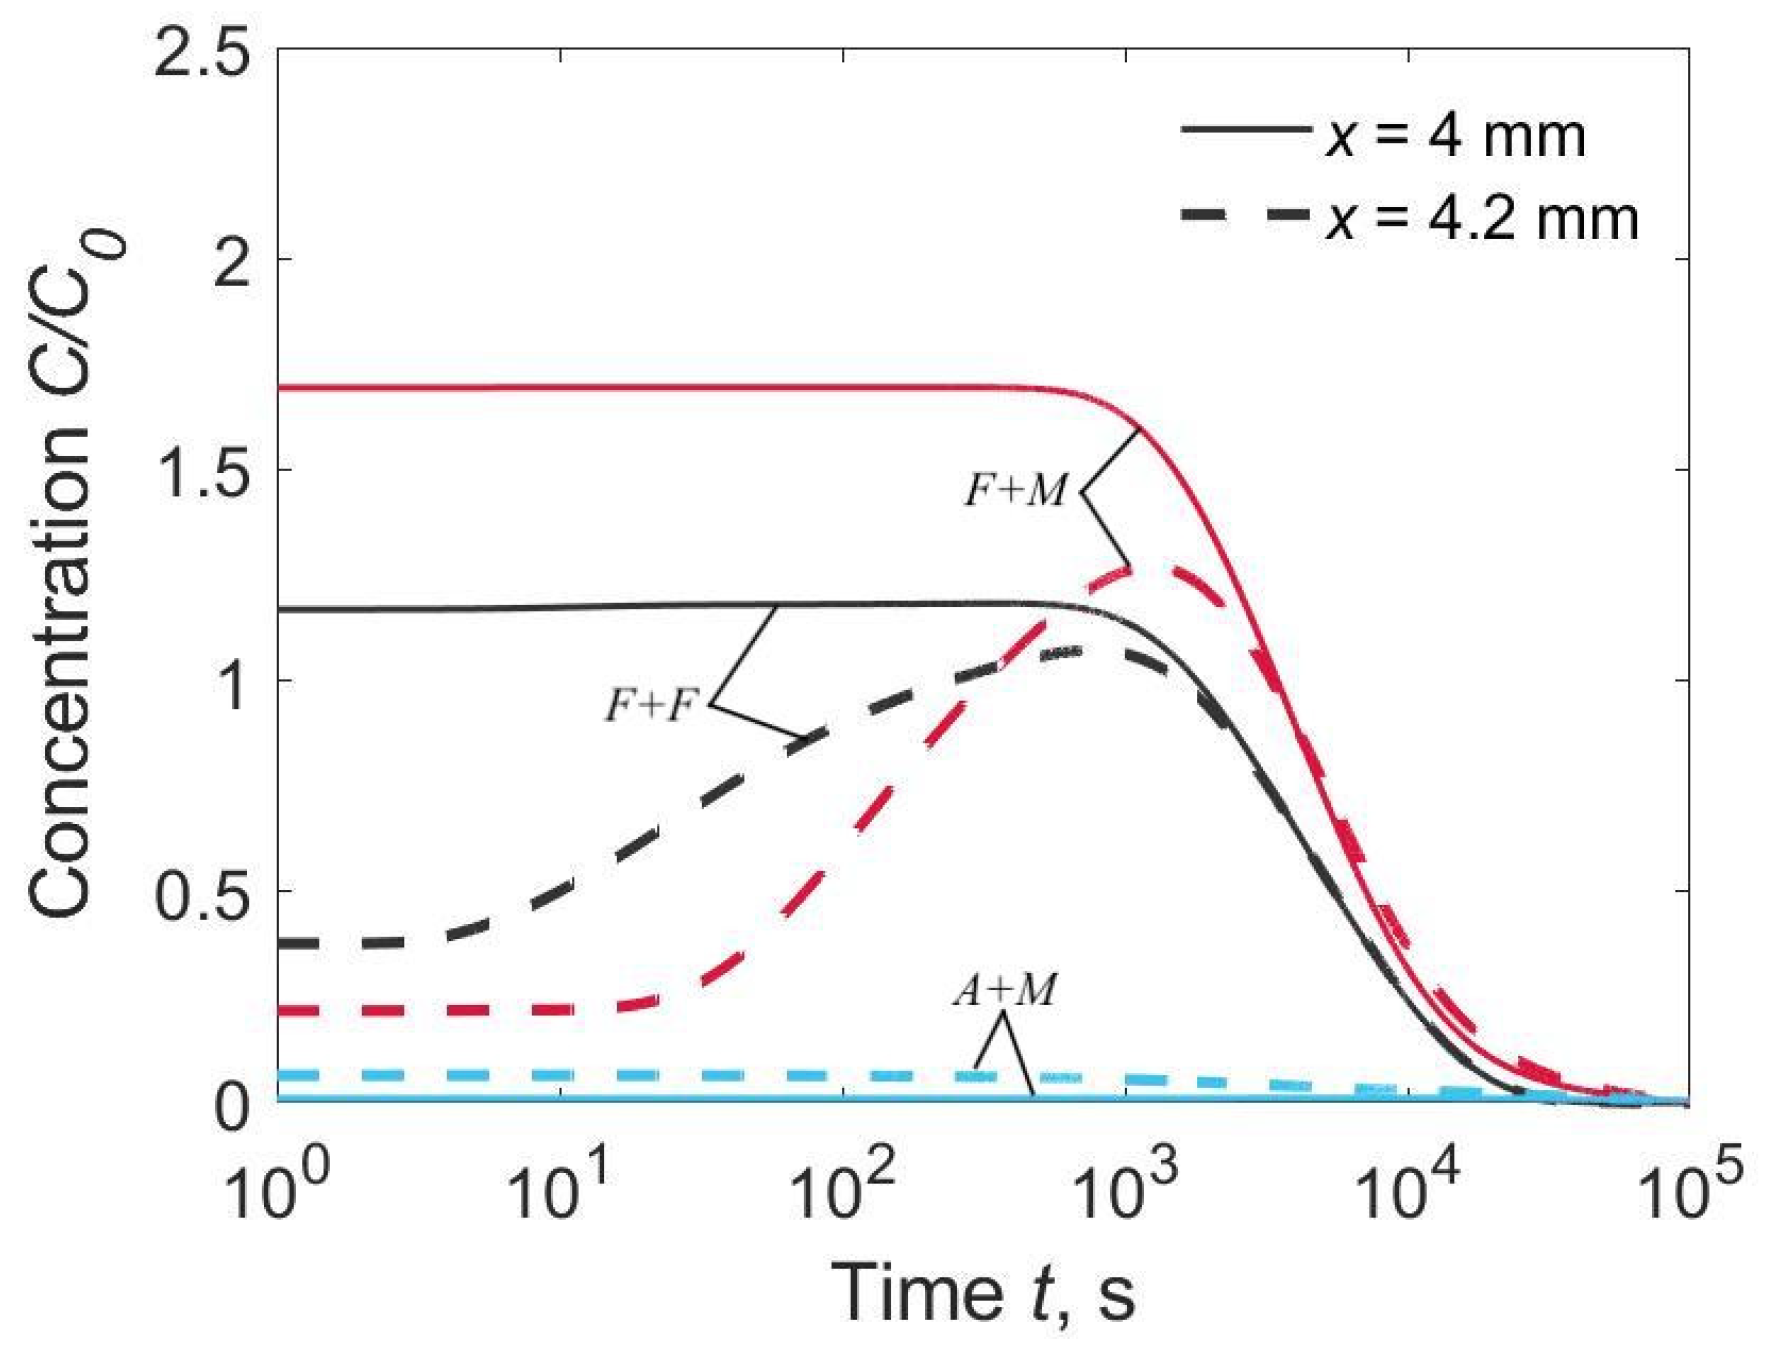
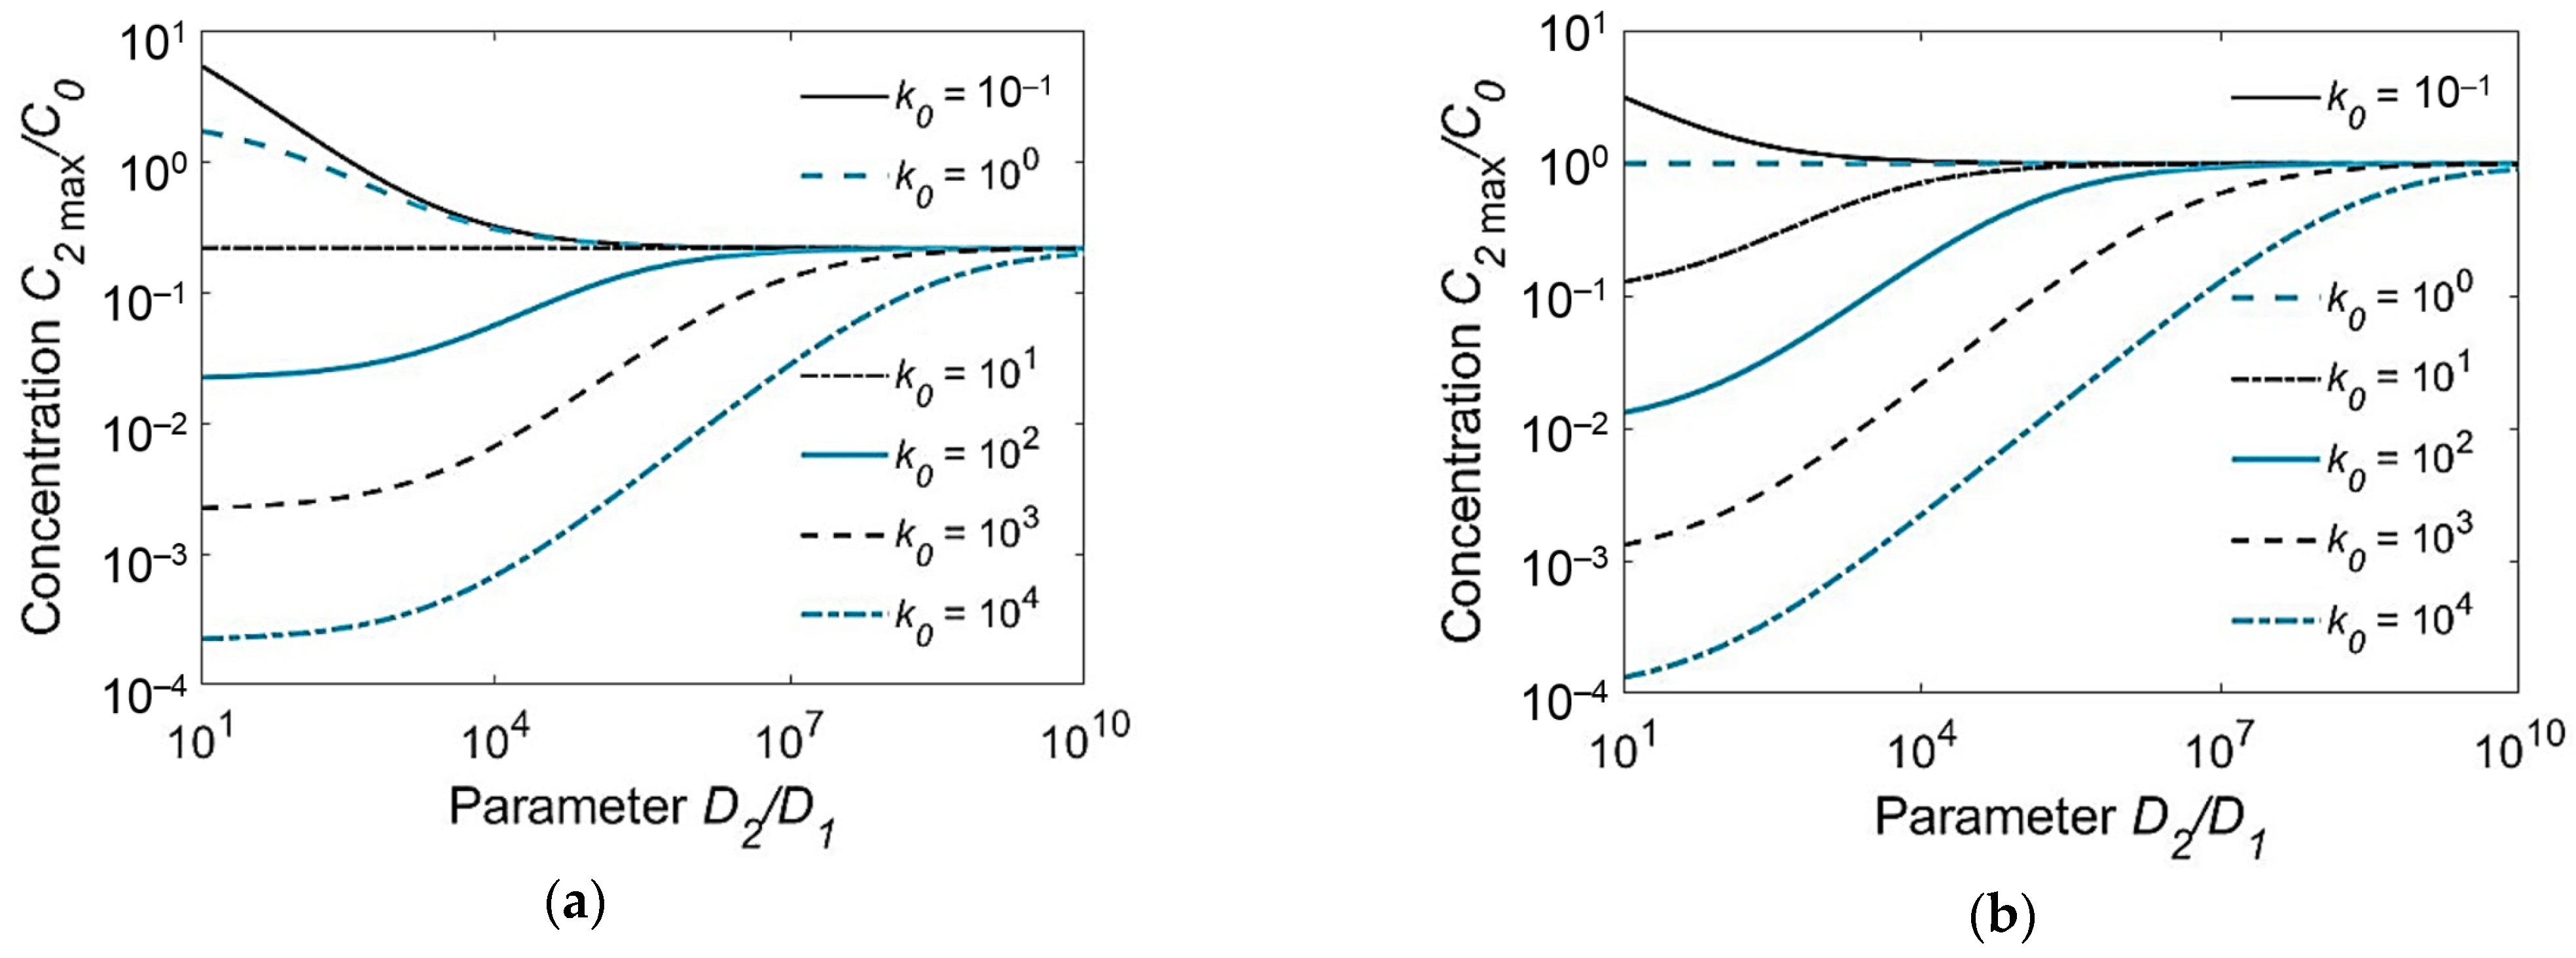
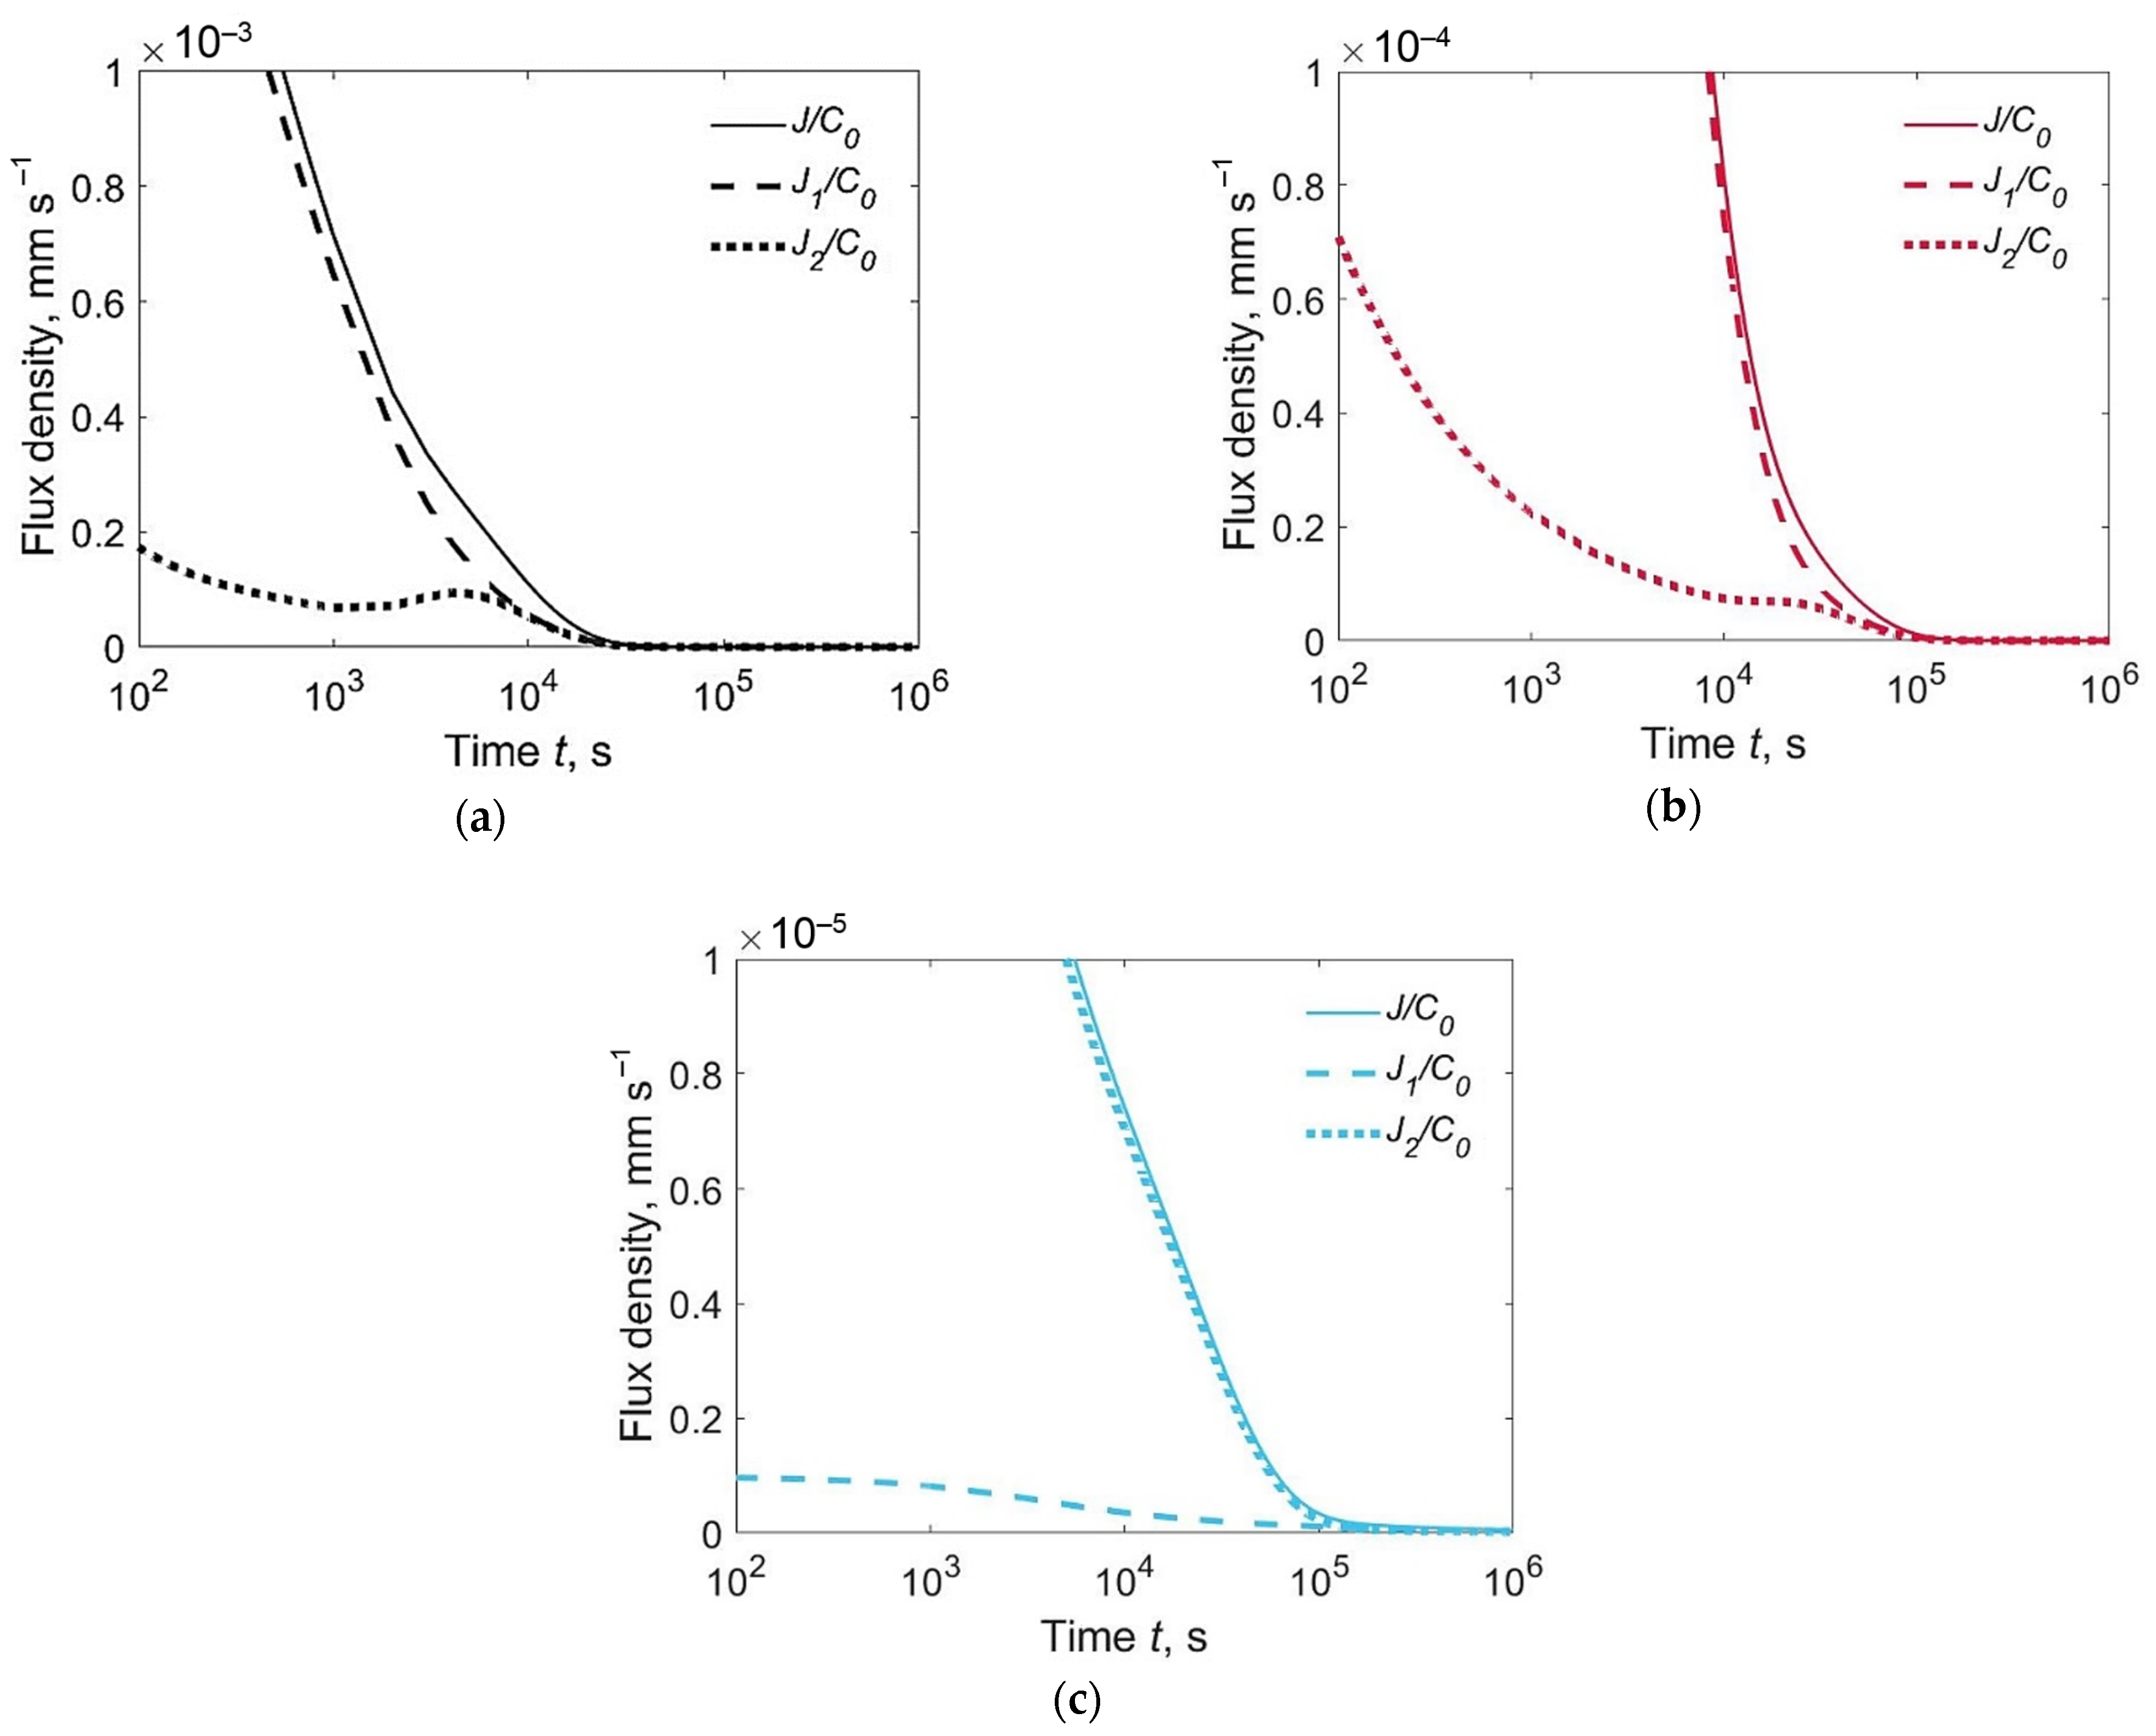
4. Results and Discussion

Let us consider hydrogen diffusion in a welded joint combining different materials conventionally named ferrite F (low-carbon low-alloy steel), martensite M (alloyed steel) and austenite A (high-alloy steel). Let the diffusion coefficients at a temperature of 293 K be 1.50 × 10⁻⁹ m2⋅s−1 for F, 1.58 × 10⁻¹⁰ m2⋅s−1 for M, and 3.98 × 10⁻¹⁵ m2⋅s−1 for A and the hydrogen solubility in γ-Fe (A) relative to α-Fe (F and M) is k0 = 4013. The D and k0 values correspond to iron, 2.25Cr-1Mo steel, and 347 stainless steel [13]. Hence, the diffusion coefficient in a quenched steel M is one order of magnitude less than that in a non-quenched steel F and five orders of magnitude greater than that in austenitic steel A. The weld thickness is h1 = 4 mm and the joint thickness is h = 10 mm (Figure 1a). Let the initial hydrogen concentration be C01 in the WM and C02 = 0.1 C01 in the BM, unless otherwise specified.
Three characteristic combinations of materials were under consideration: F + F (D1 = D2, k0 = 1), F + M (D1 > D2, k0 = 1) and A + M (D1 < D2, k0 = 4013). The first combination corresponded to a homogeneous joint with a WM chemistry that closely matches the BM. The second combination corresponded to the welding of alloyed steels with low-carbon non-alloyed welding consumables. The third combination corresponded to the welding of low-carbon alloyed steels with austenitic welding consumables. We determined the time-dependent hydrogen diffusion from the distribution of hydrogen over thickness (Figure 2) and the local concentration at the weld interface (x = h1) and at the HAZ (x = h1 + 0.2 mm, Figure 3).
To compare different solutions, we normalized the results to the average initial hydrogen concentration in the joint C0, C0 = (h1C01 + h2C02)/h.
In the homogeneous joint F + F, hydrogen flux was directed from the WM to the HAZ. Concentration of hydrogen was maximum at the weld interface, C2max(h1) = 0.5(C01 + C02) ≈ 1.20 C0 (Figure 2a and Figure 3). The calculated hydrogen distributions across the plate thickness resembled the experimental curves [9].
In the welded joint of the F + M type (F for WM, M for BM), the hydrogen concentration in the HAZ reached 170% of the average initial concentration (C2max ≈ 1.70 C0) due to intensive inflow from the WM and low discharge into the BM (Figure 2b and Figure 3). Long dwell time of the HAZ under high hydrogen concentration is a contributing factor to cold cracking.
Hydrogen concentration in the HAZ of the A + M type joint was relatively low; it decreased from an initial value down to 0.011 C0 (Figure 2c and Figure 3). Note that the C2/C0 scale was expanded. In other words, the austenitic WM sucks off hydrogen due to its relatively high solubility, even though the initial concentration in the BM is less than that in the WM (Figure 2c). A dramatic increase in the hydrogen concentration in the austenitic WM near the weld interface was experimentally observed [9]. If the initial concentration in the BM was as high as in the WM (C02 = C01), it dropped to 0.048 C0 (Figure 2d). Later, the hydrogen was released slowly from the WM and diffuses fast in the BM. Hence if hydrogen concentration in the HAZ is considered, the effect of the utilization of austenitic consumables is equivalent to a dramatic reduction in the initial hydrogen content in non-austenitic consumables.
Comparative analysis of Equations (9)–(14) proved that under the assumptions made, the peak concentration at the weld interface C2max(h1) depends only slightly on the plate thickness [10,11]. It follows from Equation (14):
C 2 max ( h 1 ) = C 01 + C 02 D 2 D 1 k 0 + D 2 D 1 .
It can be seen from Equation (15) that the peak concentration in the HAZ varies in direct proportion to the initial concentration in the WM C01 and in the BM C, and in inverse proportion to the partition coefficient k0 and the square root of the diffusion coefficient ratio of the BM and the WM D2/D1. This dependence is shown over a wide range of parameters in Figure 4. Thus, to minimize the hydrogen concentration near the weld interface and consequently hydrogen-induced cracking, welding consumables need to be chosen that have a lower diffusion coefficient (D1) and a greater solubility (partition coefficient k0) than the BM. The application of austenitic welding consumables with a low hydrogen content (C01) for the welding of alloyed steels (D2D1, k0 ≫ 1) is an ideal case.
In practice, the behavior of hydrogen in a welded joint is commonly assessed based on evolution from the joint surface. Based on Equations (9)–(14), the density of hydrogen flux from a unit area of the surfaces x = 0 and x = h can be calculated as:
J 1 ( 0 , t ) = D 1 | C 1 ( x , t ) x | x = 0 ,
J 2 ( h , t ) = D 2 | C 2 ( x , t ) x | x = h ,
J ( t ) = J 1 ( 0 , t ) + J 2 ( h , t ) .
Figure 5 shows the relative fluxes J1(0,t)/C0, J2(h,t)/C0 and J(t)/C0. The flux of effused hydrogen is usually the maximum at the weld metal surface (curves J1(0,t)/C0, Figure 5a,b), but this is not valid for an inhomogeneous joint with an austenitic weld metal and martensitic base metal (Figure 5c). In the latter case, the diffusion coefficient in the WM is several orders of magnitude lower than in the BM, due to which the hydrogen flux through the lower surface turns out to be noticeably greater than the flux through the weld surface, despite the significantly lower initial hydrogen concentration in the BM.
The flux density integrated over time from 0 to t is defined as the quantity of hydrogen evolved from a unit area of the corresponding surface by the time t:
Q 1 ( 0 , t ) = 0 t J 1 ( 0 , t ) d t ,
Q 2 ( h , t ) = 0 t J 2 ( h , t )   d t ,
Q ( t ) = Q 1 ( 0 , t ) + Q 2 ( h , t ) .
Here, Q is the total quantity of the evolved hydrogen. It can be computed alternatively as:
Q ( t ) = Q 0 0 h C ( x , t )   d x ,
where Q0 is the initial quantity of hydrogen, Q0 = C01 h1 + C02 h2 = C0 h.
A significant proportion of hydrogen evolves from the lower surface if the diffusion coefficient of the BM is equal to or greater than that of the WM (curves F + F and A + M, Figure 6). The degassing times are about 10 h for an F + F type joint and several hundreds of hours for an A + M type joint (Figure 6).
It follows from a comparison of Figure 3 with Figure 5 and Figure 6 where there is no direct relationship between hydrogen concentration in the HAZ on one hand, and flux and the quantity of effused hydrogen on the other. This means that it is unjustified to link the current concentration in the HAZ to the experimental degassing curves, however, the scale of all values is given by the initial hydrogen concentration.
It must be noted that hydrogen diffusion coefficients for steels with a body-centered lattice can differ by 3–4 orders of magnitude at room temperature [14,15,16]. Therefore, for other combinations of materials, the calculated results will be quantitatively different from the ones obtained in this work; however, the main conclusions of the qualitative analysis will remain valid.
The obtained solutions of the hydrogen diffusion problem can be used to calculate the time and temperature of the post-weld heat treatment to reduce the hydrogen concentration to a permissible level. If the average temperature of a weld is assumed to change slowly, then the diffusion processes can be evaluated based on the concept of equivalent time [17].
It should be emphasized that the results of this study were obtained based on the exact solution of a mass transfer problem, corresponding to a significantly simplified physical model. For a more exact and detailed analysis of the diffusion processes, a more adequate physical model is required that takes into consideration anisothermal welding conditions, thermodiffusion (Soret effect), residual stresses, traps, and other factors. Under such approach, however, the problem of hydrogen diffusion can only be solved by using numerical methods [2,3,5,7,8].

5. Conclusions

(1)
The obtained functional-analytical solutions make it possible to analyze hydrogen diffusion in inhomogeneous butt-welded joints considering the weld dimensions, initial hydrogen distribution, diffusion coefficients, and solubilities.
(2)
The peak hydrogen concentration in the HAZ of inhomogeneous joints varies in direct proportion to the initial hydrogen concentration in the WM and in inverse proportion to the ratio of hydrogen solubilities in the WM and BM. It is nonlinear in the diffusion coefficient ratio of the BM and WM.
(3)
In the welding of martensitic steel with ferritic welding consumables, the peak hydrogen concentration in the HAZ can exceed 170% of the average initial concentration in the joint, thus contributing to the susceptibility to cold cracking.
(4)
Application of austenitic consumables leads to aa dramatic reduction in the hydrogen concentration in the HAZ in comparison with non-austenitic consumables.
(5)
The time-dependent effusion of hydrogen depends on the inhomogeneity of the welded joint with regard to the solubility and diffusion coefficient. There is no direct relationship between the hydrogen concentration in the HAZ and the flux of effused hydrogen.

Author Contributions

Conceptualization, A.I.R.; Methodology, A.I.R. and V.A.K.; Software, E.B.S.; Validation, S.G.P., V.A.K. and E.B.S.; Formal analysis, V.A.K.; Data curation, V.A.K.; Writing—original draft preparation, E.B.S. and S.G.P.; Writing—review and editing, V.A.K. and S.G.P.; Visualization, E.B.S.; Project administration, A.I.R.; Funding acquisition, A.I.R. All authors have read and agreed to the published version of the manuscript.

Funding

This research received no external funding.

Institutional Review Board Statement

Not Applicable.

Informed Consent Statement

Not Applicable.

Data Availability Statement

Data sharing is not applicable.

Conflicts of Interest

The authors declare no conflict of interest.

References

  1. Lippold, J.C. Welding Metallurgy and Weldability; John Wiley and Sons: Hoboken, NJ, USA, 2015. [Google Scholar]
  2. Padhy, G.K.; Komizo, Y. Diffusion hydrogen in steel weldments. Trans. Jpn. Weld. Res. Inst. 2013, 42, 39–62. [Google Scholar]
  3. Andersson, B.A.B. Diffusion and trapping of hydrogen in a bead-on-plate weld. J. Eng. Mater. Technol. 1980, 102, 64–72. [Google Scholar] [CrossRef]
  4. Leblond, J.B.; Dubois, D. A general mathematical description of hydrogen diffusion in steels: Derivation of diffusion equations from Boltzmann-type transport equations. Acta Metall. 1983, 31, 1459–1469. [Google Scholar] [CrossRef]
  5. Mundra, K.; Blackburn, J.M.; DebRoy, T. Absorption and transport of hydrogen during gas metal arc welding of low alloy steel. Sci. Technol. Weld. Join. 1997, 2, 174–184. [Google Scholar] [CrossRef]
  6. Alexandrov, B.T. Hydrogen behaviour in welded joints and evaluation of its role for cold cracking. In Mathematical Modelling of Weld Phenomena 7; Technical University of Graz: Graz, Austria, 2005; pp. 781–846. [Google Scholar]
  7. Fjaer, H.G.; Aas, S.K.; Olden, V.; Lindholm, D.; Akselsen, O.M. Simulation of multipass welding of a steel pipe including modelling of hydrogen diffusion and fracture mechanics assessment. In Mathematical Modelling of Weld Phenomena 10; Technical University of Graz: Graz, Austria, 2013; pp. 371–399. [Google Scholar]
  8. Karkhin, V.A.; Levchenko, A.M.; Khomich, P.N. Hydrogen diffusion model at welding high-strength steels. Weld. Int. 2022, 36, 226–236. [Google Scholar] [CrossRef]
  9. Million, A.; Million, C. L’hydrogene dans les Aciers et dans les Joints Soudes; [Hydrogen in Steels and in Welded Joints]; Dunod: Paris, France, 1971. (In French) [Google Scholar]
  10. Karkhin, V.A.; Marx, O.Y. Analysis of influence of welded joint inhomogeneity on hydrogen concentration in the heat affected zone. Autom. Weld. 1994, 2, 9–14. (In Russian) [Google Scholar]
  11. Karkhin, V.A.; Levchenko, A.M.; Starobinskii, E.B.; Parshin, S.G. Effect of microstructural inhomogeneity on hydrogen diffusion in welded joints. Mater. Today Proc. 2020, 30, 462–466. [Google Scholar] [CrossRef]
  12. Carslaw, H.S.; Jaeger, J.C. Conduction of Heat in Solids, 2nd ed.; Oxford University Press: Oxford, UK, 1973. [Google Scholar]
  13. Lancaster, J.F. Metallurgy of Welding, 6th ed.; Abington Publishing: Cambridge, UK, 1999. [Google Scholar]
  14. Boellinghaus, T.; Hoffmeister, H.; Middel, C. Scatterbands for hydrogen diffusion coefficients in steels having a ferritic or martensitic microstructure and steels having an austenitic microstructure at room temperature. Weld. World 1996, 37, 16–23. [Google Scholar]
  15. Karkhin, V.A.; Aldaiee, Y.; Levchenko, A.M. Hydrogen diffusion coefficient in welded steels. Weld. Diagn. 2021, 6, 20–27. (In Russian) [Google Scholar]
  16. Parshin, S.G.; Levchenko, A.M.; Maystro, A.S. Metallurgical model of diffusible hydrogen and non-metallic slag inclusions in underwater wet welding of high-strength steel. Metals 2020, 10, 1498. [Google Scholar] [CrossRef]
  17. Karkhin, V.A. Thermal Processes in Welding; Springer: Singapore, 2019. [Google Scholar]
Figure 1. Schematic of a bead-on-plate weld: (a) coordinate system; (b) initial distribution of hydrogen concentration.
Materials 15 07686 g001
Figure 2. Distribution of relative hydrogen concentration in welded joints at different time t: (a) F + F, C02/C01 = 0.1; (b) F + M, C02/C01 = 0.1; (c) A + M, C02/C01 = 0.1; (d) A + M, C02/C01 = 1.
Materials 15 07686 g002
Figure 3. Time dependence of hydrogen concentration in the HAZ at the weld interface (x = 4.0 mm) and at 0.2 mm from the weld interface (x = 4.2 mm), C02/C01 = 0.1.
Materials 15 07686 g003
Figure 4. Peak hydrogen concentration in the HAZ at the weld interface (C2max(h1))/C0 as a function of the ratio D2/D1 of the diffusion coefficients and the partition coefficient k0: (a) C02/C01 = 0.1; (b) C02/C01 = 1.
Materials 15 07686 g004
Figure 5. Relative flux density of hydrogen evolution from the upper surface J1/C0, lower surface J2/C0 and both surfaces J/C0 for welded joints of different types, C02/C01 = 0.1: (a) F + F; (b) F + M; (c) A + M.
Materials 15 07686 g005
Figure 6. Fraction of hydrogen evolved from the upper surface (Q1/Q0), lower surface (Q2/Q0), and both surfaces (Q/Q0) for welded joints of three types: F + F, F + M, and A + M. C02/C01 = 0.1.
Materials 15 07686 g006
Publisher’s Note: MDPI stays neutral with regard to jurisdictional claims in published maps and institutional affiliations.

