Article

Conductive Membranes Based on Cotton Fabric Coated with Polymers for Electrode Applications

Department of Research in Textile Materials Engineering and Processes, National Research and Development Institute for Textiles and Leather, 030508 Bucharest, Romania
*
Author to whom correspondence should be addressed.
Materials 2022, 15(20), 7286; https://doi.org/10.3390/ma15207286
Submission received: 23 July 2022 / Revised: 24 August 2022 / Accepted: 12 September 2022 / Published: 18 October 2022

Abstract

:
This paper presents the evaluation of some electrodes based on polymeric conductive membranes (polyvinylidene fluoride (PVDF), polyvinyl alcohol (PVA) and polyethylene glycol (PEG)) for sensor applications. The electrodes were developed using textile support (weave structure-based 100% cotton yarns) and applying conductive membrane layers deposited on the textile surface. Coating the fabrics with thin layers of conductive membranes could generate new surfaces with the electrical resistance specific to conductive samples. Laboratory tests evaluated the physicomechanical and electrical properties. The surface resistance was investigated using a digital surface resistance meter by neglecting electrode polarization impedance. In addition, the correlation coefficients between the physicomechanical and electrical parameters obtained by the laboratory were analyzed. These conductive samples can be used to and develop flexible electrodes for moisture, temperature and strain sensors.

1. Introduction

Due to the miniaturization of the electronic components using advanced assembly technologies and flexible support, printed electronics, and the wearable devices-based sensors having self-powering capacity and autonomy represent a challenge for many researchers. Users mainly prefer wearable devices (smart-glass, intelligent clothes, intelligent rings) because they are flexible, lightweight and comfortable. The scientific articles reported using polyvinylidene fluoride (PVDF) membranes and nanofibres for energy harvesting devices [1,2,3].
PVDF membranes [4,5] have been used often for intelligent textile, capacitive sensors for humidity detection, triboelectric textile sensors and energy harvesters [6,7,8,9].
Research shows that piezoelectric wearable sensors for biomedical signals monitoring is efficient because using PVDF can obtain flexible membranes that are biocompatible and lightweight [10]. Mix PVDF with different microparticles or cellulose nanocrystal to obtain nanocomposite fibers by dry-jet wet spinning [11].
Overall, the PVDF membranes are also used for triboelectric nanogenerator (TENG) [12,13,14,15] or self-powered sensors [16,17,18,19,20] for pressure or vibration measurement [21,22,23,24] based on the electrical properties of the PVDF polymers [25,26,27,28].
The purpose of this research was to develop wearable electrodes-based polymeric membranes (PVDF), polyvinyl alcohol (PVA), or polyethylene glycol (PEG) for sensors using textile support coated with conductive paste-based polymeric matrix and microparticles (copper, nickel, graphene oxide).
Moreover, the conductive composites based on graphene oxide [29,30,31,32,33,34] and polyaniline [35] have been used to develop strain or biomedical sensors and energy harvesting.

2. Materials and Methods

To achieve the proposed results consisting of conductive polymeric membrane electrodes, in our experiments, the textile samples (plain weave based 100% cotton S twisted yarns Nm 20/2 (FAVIL SA, Râmnicu Vâlcea, Romania), breaking strength 1758 cN, breaking elongation 8.46%) were treated with conductive paste based polymeric matrix: polyvinyl alcohol (PVA (Sigma Aldrich, Taufkirchen, Germany)), PVDF (Sigma Aldrich, Taufkirchen, Germany), polyethylene glycol (PEG (Sigma Aldrich, Taufkirchen, Germany)), polyvinylpyrrolidone (PVP (Sigma Aldrich, Taufkirchen, Germany)), distilled water (dH2O), dimethylformamide (DMF) 99.5+%, pure and microparticles (copper (Cu1 (Sigma Aldrich, Taufkirchen, Germany) having particle dimensions between 14–25 µm; Cu2 (Sigma Aldrich, Taufkirchen, Germany) having particle dimensions <75 µm), nickel (Ni (Sigma Aldrich, Taufkirchen, Germany) having particle dimensions of 150 µm), and graphene oxide (GO)). All these samples were treated previously using a primary classical cleaning method (alkaline boiling-bleaching) to obtain a hydrophilic character of the surface.
The samples (electrode materials) have been prepared by coating the textile surface with a conductive paste-based polymeric matrix (PVA, PEG, PVP, and PVDF) with microparticles content (GO, Cu1, Cu2, Ni) using the scrapping method.
The polymers such as PEG, PVA, and PVP present a hydrophilic character. The polymer PVDF has a nonpolar phase and is hydrophobic. In order to transform hydrophobic PVDF into hydrophilic, the nonpolar PVDF polymer has been dissolved in polar (hydrophilic) aprotic solvent DMF. The polymeric matrix PVDF with microparticle content presents a hydrophilic surface.
According to the standard SR EN ISO 9237:1999, the air permeability (Pa) of the electrode materials obtained was investigated using a Testex Air Permeability Tester FX 3300 (TEXTEST AG, Schwerzenbach, Switzerland).
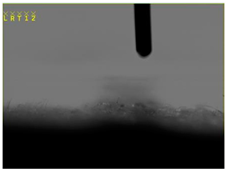
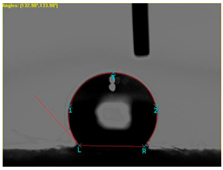
The contact angle was investigated using the Video Camera Angle (VCA) Optima device (AST Products, Inc., Billerica, MA, USA), which has a CCD camera, syringe with distilled water, and droplet size of 4 µL.
The electrical resistance (Rs) has been investigated using portable resistance meter devices with internal parallel electrodes (Figure 1) fixed on the textile surface having 6 cm length (D), 0.5 cm width (w) and 3 cm distance (L) between the parallel electrodes. The tests neglected the polarization phenomena on the electrodes.
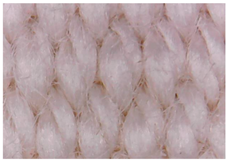
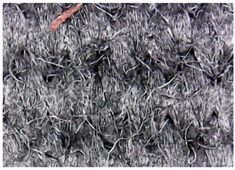
The surface morphology was evaluated using scanning electron microscopy (Quanta 200 184 SEM) and the surface topography using a digital optic microscope (Biolux, Bresser, Germany).
Table 1 presented:
-
the composition of samples 1–14 is based on the polymeric matrix (PVDF (samples 2–5), PEG (samples 6–10 and 14), PVP (samples 5–12 and 13–14), and PVA (sample 6)) and microparticles (GO (samples 2 and 9), Ni (samples 3 and 11), Cu1 (samples 4, 8, 10, 12 and 14) and Cu2 (samples 5–7 and 13));
-
the results of the physico-mechanical (Mass per unit area (SR EN 12127:2003), thickness (SR EN ISO 5084:2001), air permeability (SR EN ISO 9237:1999), water vapor permeability (STAS 9005:1979)) and electrical resistance (Rs) evaluations.
The samples based on PVDF polymer matrix and Cu1, Cu2, GO and Ni microparticles were treated by immersion in artificial perspiration solutions (alkaline/acid) for 10 min. The surface electrical resistances were analyzed, and it can be concluded that the treatment in acid/alkaline perspiration solutions leads to an antistatic character of textile surfaces (109 Ω). Table 2 presents the electrical resistance values for samples based PVDF polymeric matrix. For testing, five samples were used for each paste composition with dimensions 10 × 10 cm.
In Table 2, it can be observed that samples T1–T4, which are samples 2–5 from Table 1 treated with a conductive paste based:
-
PVDF and Cu1 microparticles (T3), the surface resistance decreases by 10%;
-
PVDF and Cu2 microparticles (T4), the surface resistance has the same value of 109 Ω;
-
PVDF and Ni microparticles (T2), the surface resistance increases by 200%;
-
PVDF and GO microparticles (T1), the surface resistance decreases by 25%.
The alkaline perspiration solution contains:
-
distilled water;
-
l-histidine monohydrochloride monohydrate;
-
sodium chloride;
-
disodium hydrogen orthophosphate dodecahydrate;
-
disodium hydrogen orthophosphate dihydrate.
The acid perspiration solution contains:
-
distilled water;
-
l-histidine monohydrochloride monohydrate-
-
sodium chloride;
-
sodium dihydrogen orthophosphate dihydrate (ISO 105-E04:2013).
We observed that alkaline/acid perspiration treatments generate an antistatic character calibration of the surface resistance. In addition, this calibration was also observed in our previous experiments based on coating textile with an electroconductive paste based on chitosan. From Table 1, sample 3 (based on PVDF and Ni microparticles) presents the adequate surface resistance specific to electroconductive materials and can be used for electrode manufacturing. In addition, samples 5–10 and 14 present the resistance values specific to dissipative materials, while samples 2, 4 and 11–13 present a surface resistance specific to materials used for electrical insulation.

3. Results

3.1. Characterization of the Samples Treated Using Conductive Membranes

3.1.1. Surface Morphology Using SEM

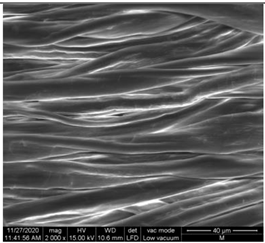
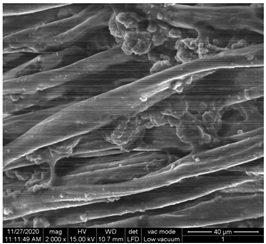
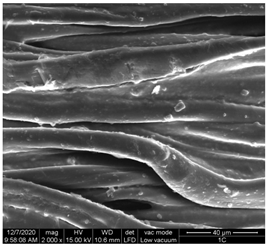
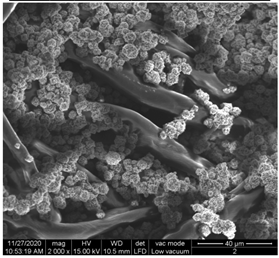
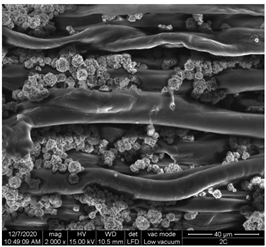
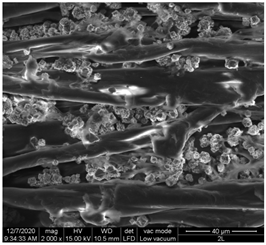
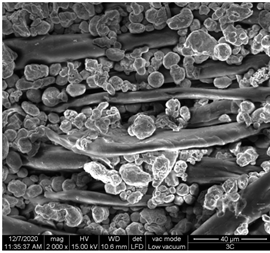
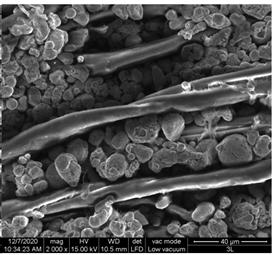
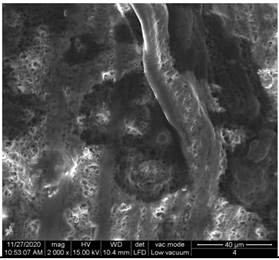
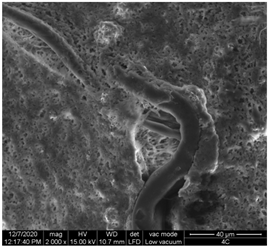
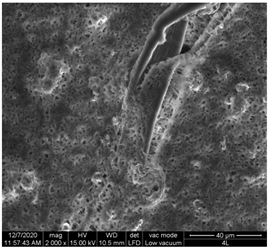
A scan electron microscopy (SEM) using Quanta 200 184 SEM (FEI, Cleveland, OH, USA) was used to study the surface morphology using 2000× magnification.
The surface morphology of the fabrics treated using polymeric (PVDF) paste (samples 2–5) with metallic and GO microparticles content is presented in Table 3. Sample 1 from Table 3 represents the hydrophilic fabric (100% cotton, plain weave) used to obtain samples 2–14.
Table 3 shows the morphology of the textile surface untreated (sample 1) and coated with conductive paste-based graphene (sample 2), Ni (sample 3), Cu1 (sample 4) and Cu2 (sample 5). From the surface morphology of sample 4, in comparison with sample 5, it can be observed that the Cu1 particles (14–25 µm) have a homogeneous distribution on the textile surface. In the case of sample 3 based on Ni microparticles, a tendency of microparticles to agglomerate and to form clusters of microparticles can be observed. In addition, samples 2 (based on graphene) and 5 (based on Cu2 microparticles having dimensions <75 µm) present a non-homogeneous distribution of the particles.
In the case of samples 2, 3, 4 and 5 (Table 3), it can be observed that the aggregations of the microparticles are reduced after alkaline and acid perspiration treatments. This is because the PVA, PEG, and PVP are hydrophilic polymers, and PVDF dissolved in the organic solvent DMF becomes hydrophilic. Consequently, the sample surface becomes hydrophilic after coating through thin film deposition using screen printing the conductive paste on the textile surface. This explains that some metal microparticles may migrate in the water-based alkaline/acid perspiration solution after the immersion of the samples in acid/alkaline perspiration for 10 min. In addition, we observed that, after the treatments with alkaline and acid artificial perspiration, the electrical resistance (Rs) was reduced by 25% for GO-based samples, by 10% for Cu1-based samples and was increased by 200% in the samples based on Ni microparticles.

3.1.2. Surface Topography Using Optical Microscopy

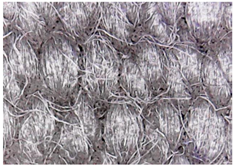
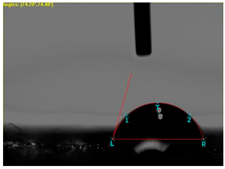
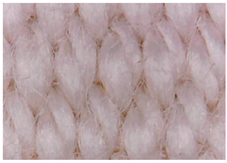
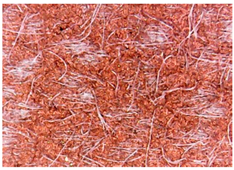
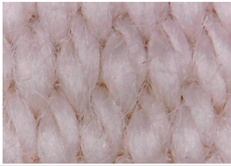
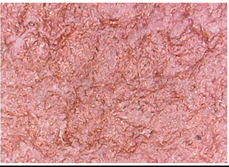
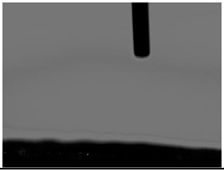
Table 4 presents the electrodes’ topography captured by digital electron microscopy (60× magnification) for raw fabrics and fabrics coated (samples 2–5) with conductive paste-based polymeric matrix (PVDF, PVA, PEG) and microparticles (Cu1, Cu2, Ni, GO). In addition, Table 4 presents the static capture of the contact angles. We can observe the contact angles measured using the VCA Optima device (Figure 1) and a four μL distilled water droplet, with values greater than 90° for samples 2 and 4. However, for other samples (6–14, presented in Table S1, in the Supplementary Materials), the contact angles are equal to zero, indicating that the samples present a pronounced hydrophilic character after coating with conductive polymeric paste.

3.1.3. Chemical Composition

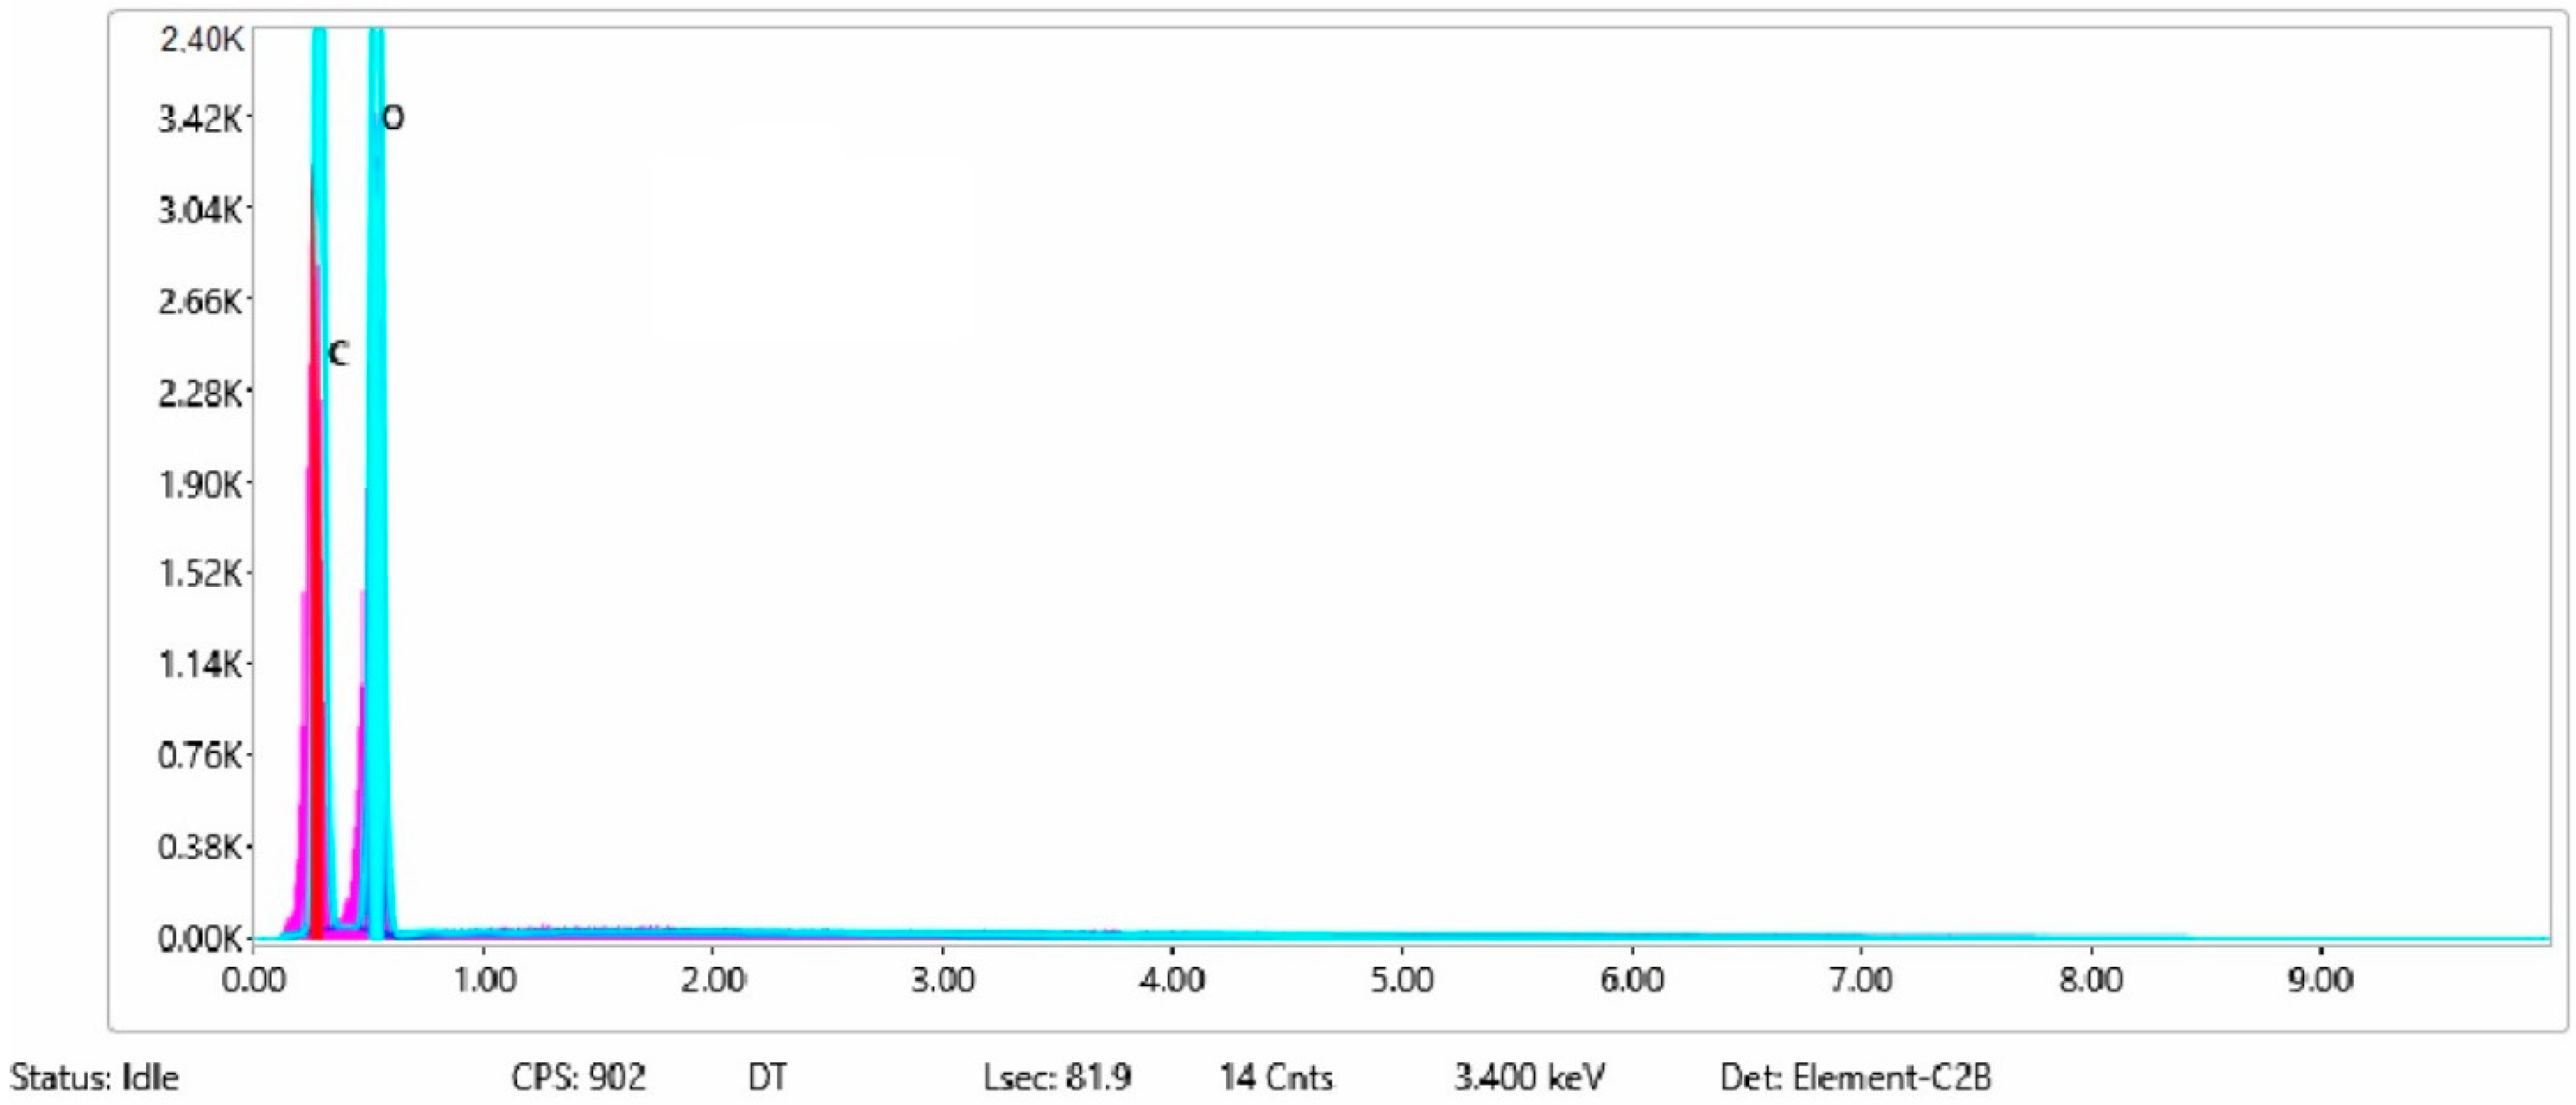
The chemical composition after coating was investigated using EDS (Energy Dispersive Spectroscopy) analysis and elemental mapping overlay for samples 1, 2, 3, 4 and 5 (Table 2) using EDAX (AMETEK, Inc., Montvale, NJ, USA), and the results are presented in Table 5. Using the smart phase mapping tool from EDAX, the spectra, elemental and phase maps were automatically collected for samples 2a, 2b, 2c, 3a, 3b, 3c, 4a, 4b, 4c, 5a, 5b and 5c. Samples 2, 3, 4 and 5 are treated with a polymeric conductive paste based on graphene (sample 2), nickel (sample 3), Cu1 (sample 4) and Cu2 (sample 5). Samples 2a, 3a, 4a and 5a are initially treated with polymeric conductive paste and after with artificial acid perspiration (samples 2b, 3b, 4b and 5b) and respective alkaline perspiration (2c, 3c, 4c and 5c). In Figure 2 and Figure 3 are presented the EDS spectra for sample 1 (clean fabric without conductive paste), respective the smart elemental mapping for sample 1.
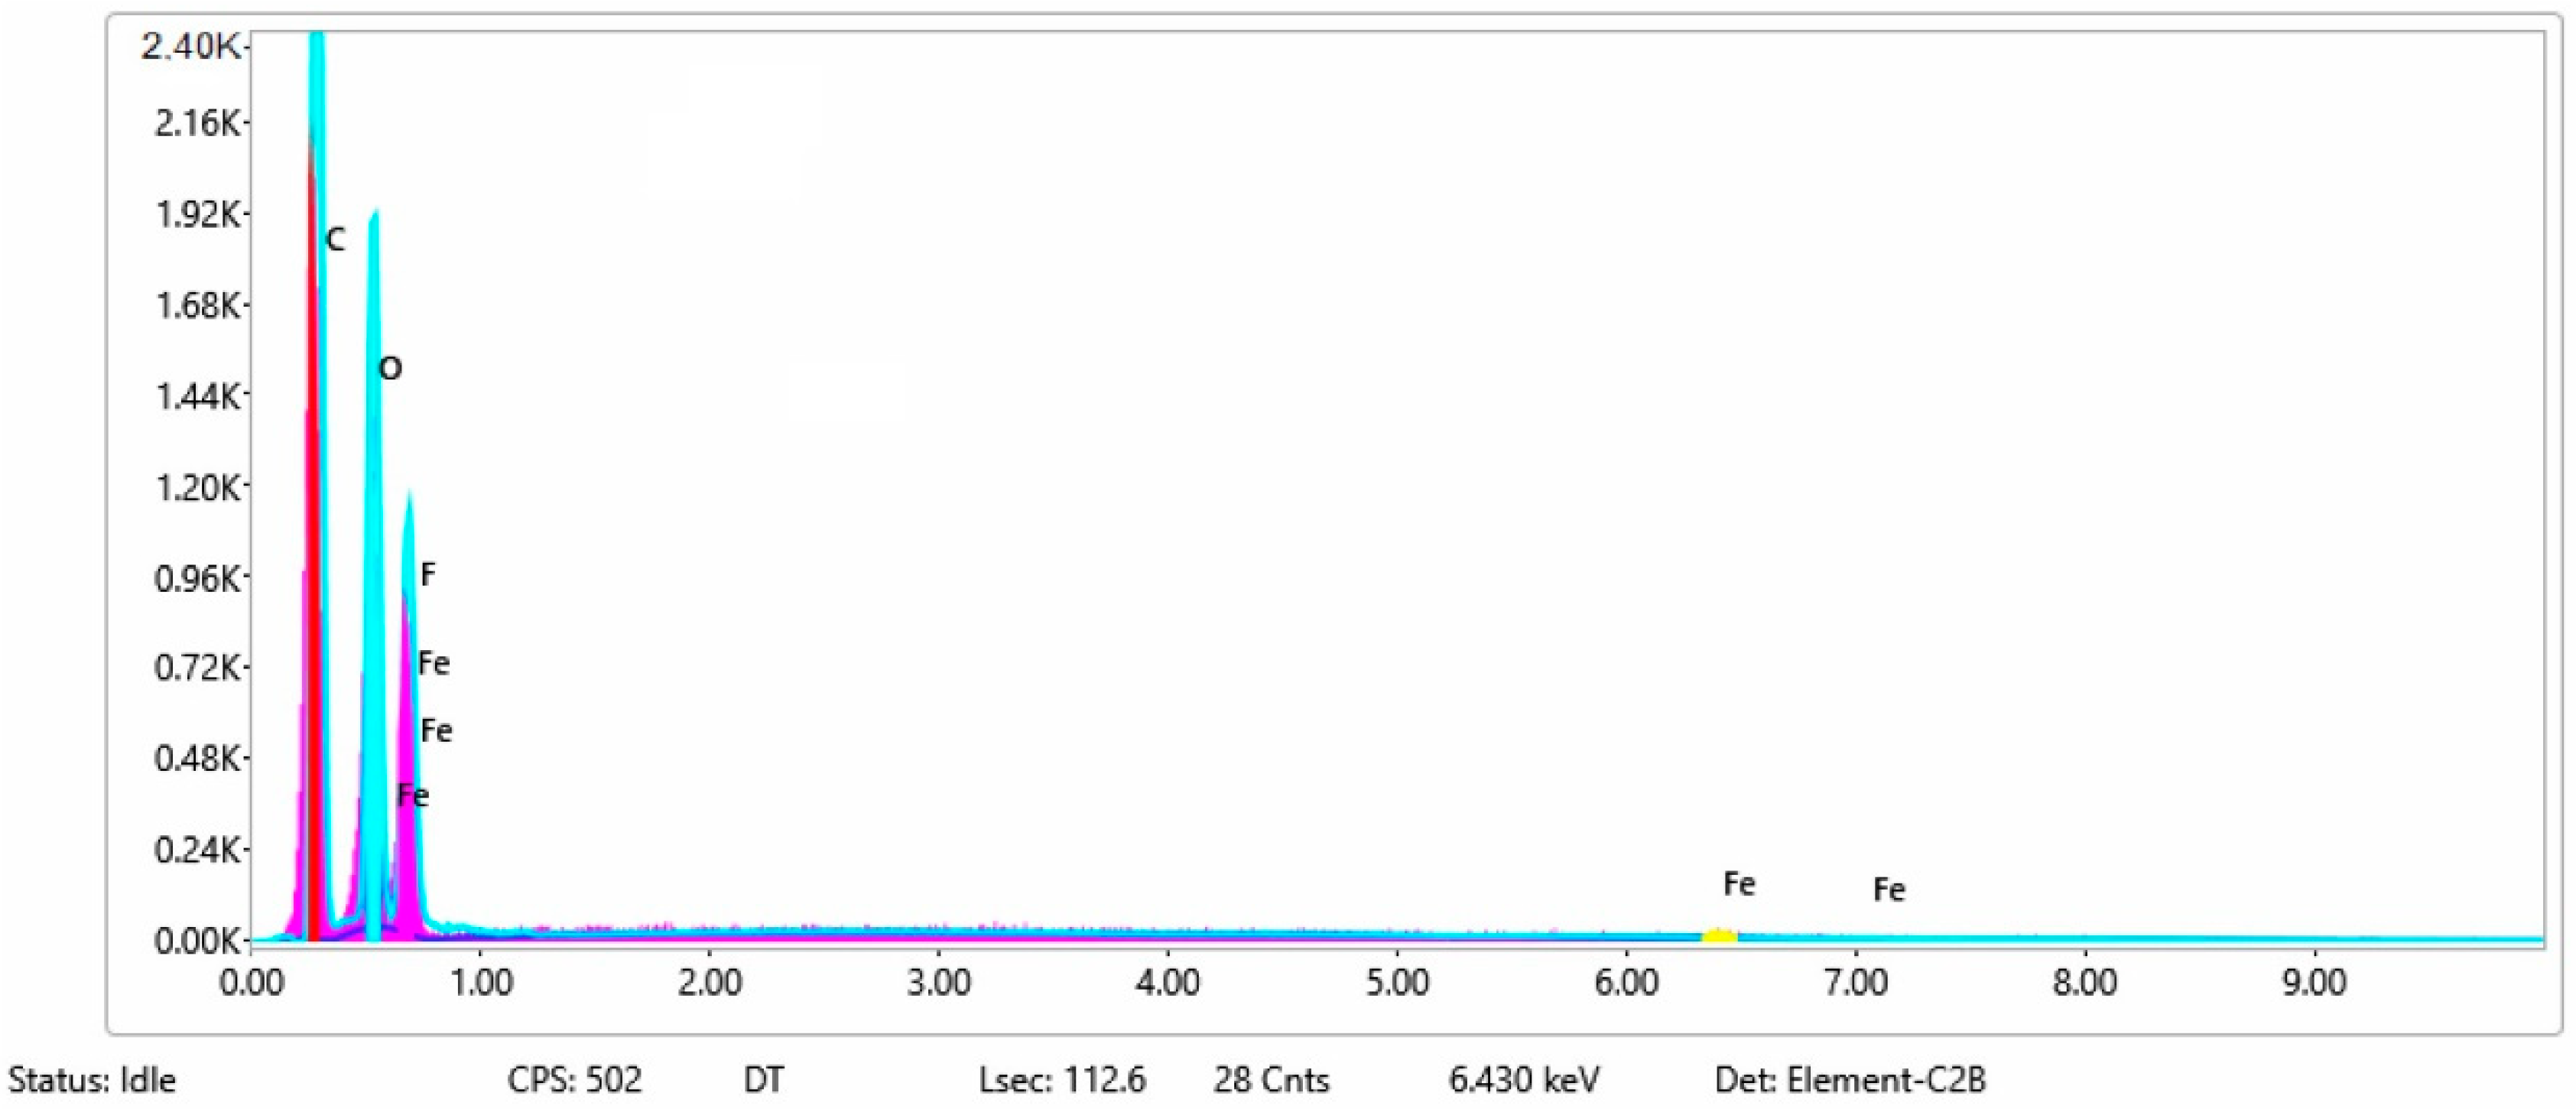
Figure 4 and Figure 5 present the EDS spectra for sample 2 (clean fabric coated with conductive paste based PVDF and GO), respective the smart elemental mapping overlay for sample 2 untreated with artificial perspiration (Figure 5a), treated with acid perspiration (Figure 5b) and alkaline perspiration (Figure 5c).
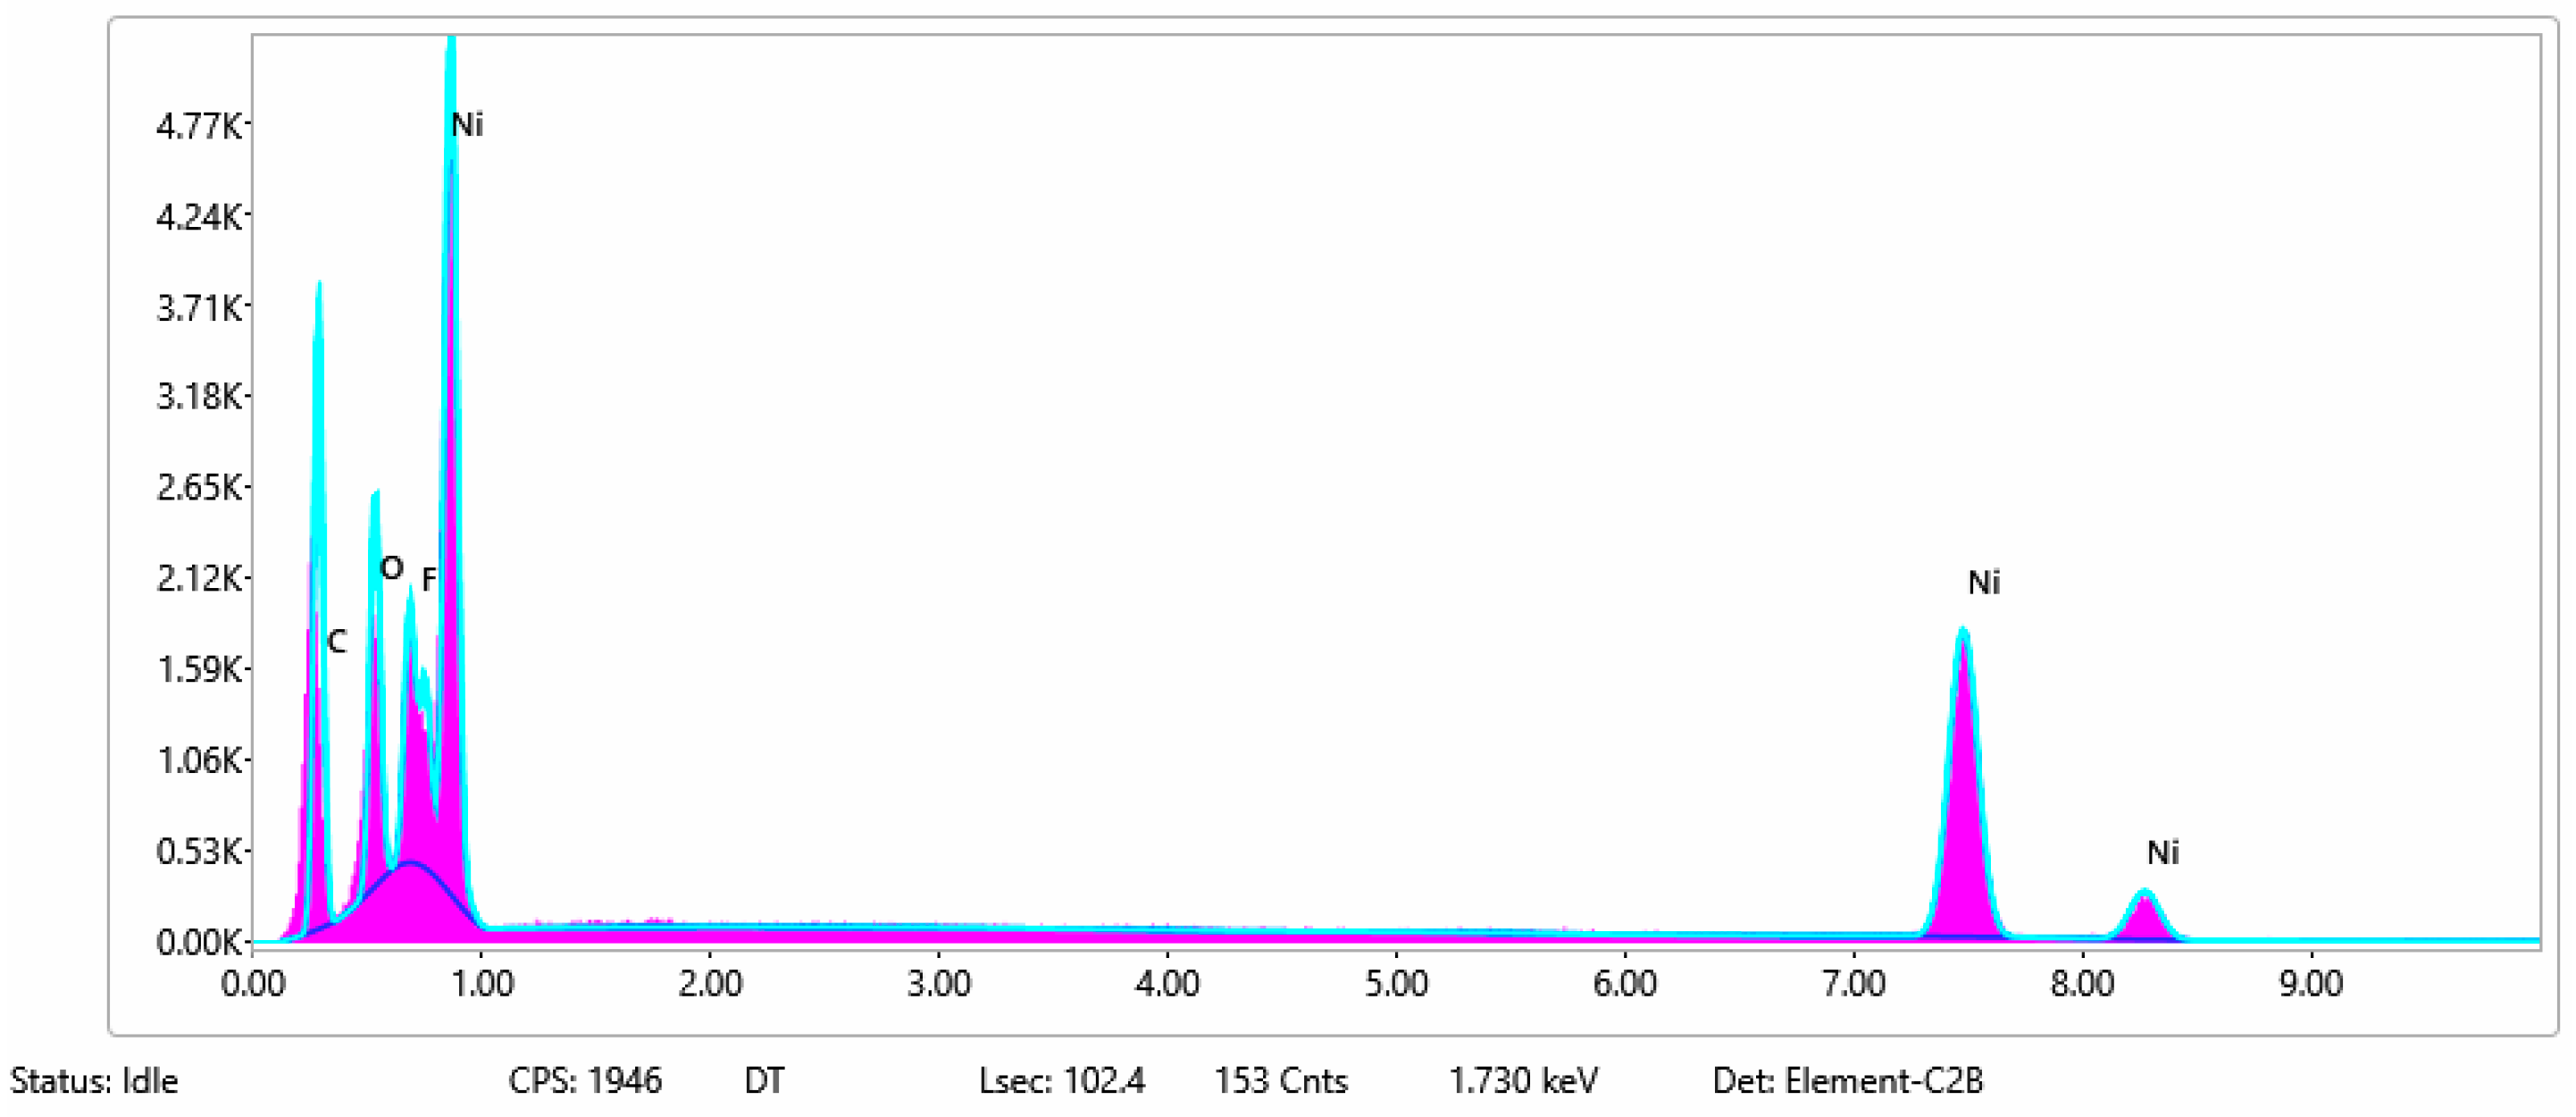
In Figure 6 and Figure 7 are presented the ESD spectra for sample 3 (clean fabric coated with conductive paste based on PVDF and Ni, Figure 6), respective the smart elemental mapping for sample 3 untreated with artificial perspiration (Figure 7a), treated with acid perspiration (Figure 7b) and alkaline perspiration (Figure 7c).
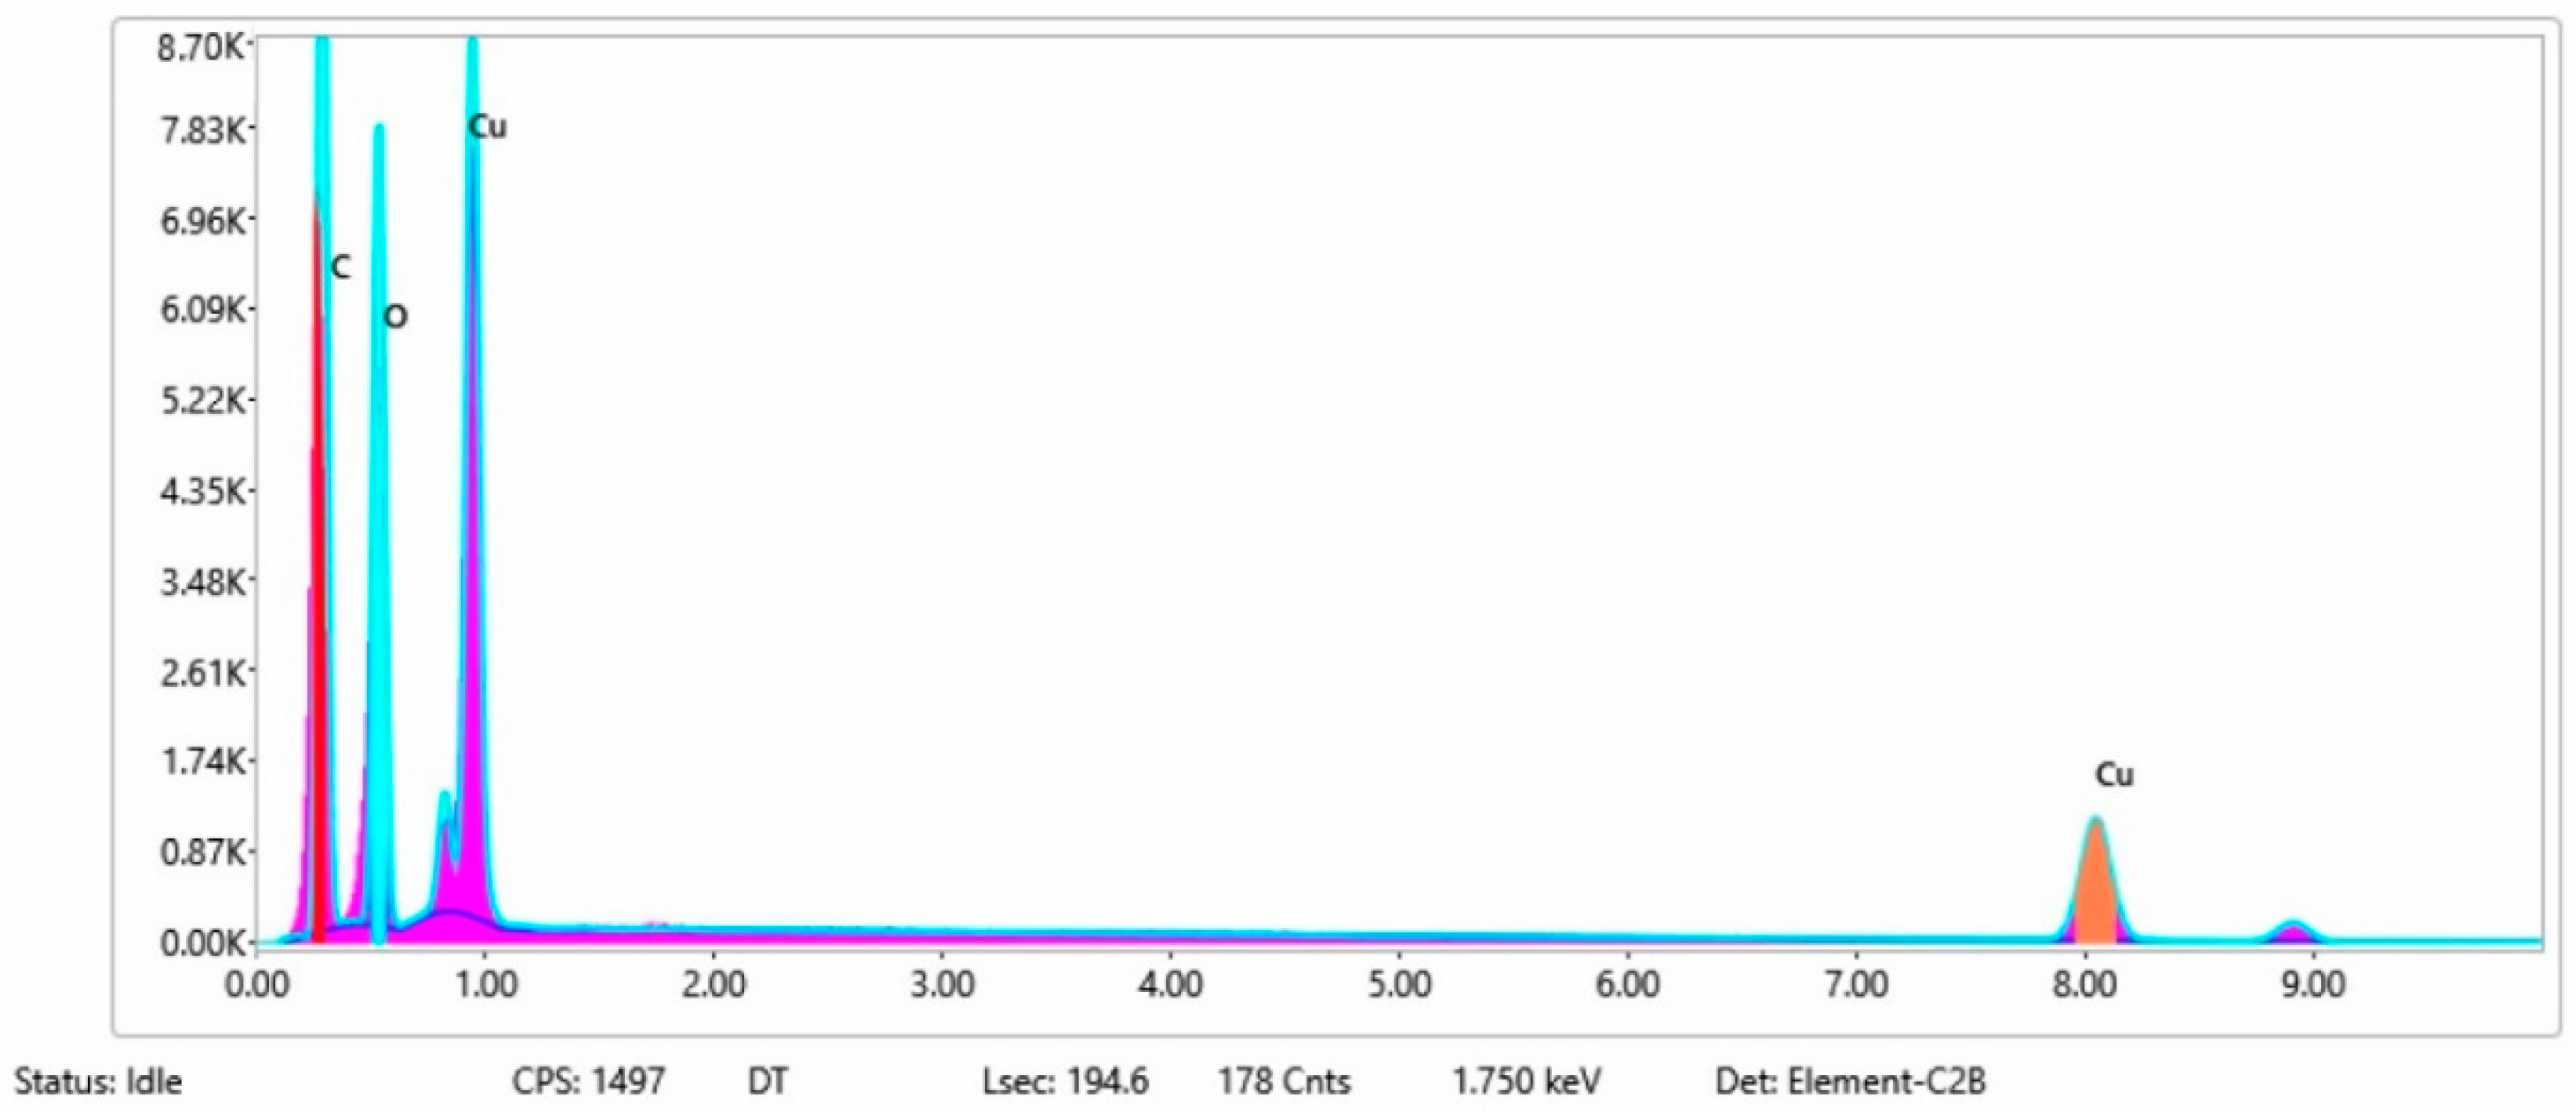
In Figure 8 and Figure 9 are presented the ESD spectra for sample 4 (clean fabric coated with conductive paste based on PVDF and Cu1, Figure 8), respective the smart elemental mapping for sample 4 untreated with artificial perspiration (Figure 9a), treated with acid perspiration (Figure 9b) and alkaline perspiration (Figure 9c).
In addition, Figure 10 and Figure 11 present the ESD spectra for sample 5 (clean fabric coated with conductive paste based on PVDF and Cu2, Figure 10), respective the smart elemental mapping for sample 5 untreated with artificial perspiration (Figure 11a), treated with acid perspiration (Figure 11b) and alkaline perspiration (Figure 11c). Overall, it can be observed that the quantity of the metals (Cu, Ni) is reduced after these treatments. For example, in the case of the sample:
-
3 (Figure 7a), the quantity of Ni was reduced by 11% after treatment with acid perspiration (Figure 7b), with a respective 25% after treatment with alkaline artificial perspiration (Figure 7c);
-
4 (Figure 9a), the quantity of Cu1 was reduced by 23% after treatment with acid perspiration (Figure 9b), with a respective 26% after treatment with alkaline artificial perspiration (Figure 9c);
-
5 (Figure 11a), the quantity of Cu2 was reduced by 3% after treatment with acid perspiration (Figure 11b), with a respective 2% after treatment with alkaline artificial perspiration (Figure 11c).
The reduction of the metal microparticles after treatments in acid or alkaline artificial perspiration explains the surface resistance increase in sample 3 coated with a paste-based Ni and PVDF.

4. Discussion

4.1. Correlation between Physicomechanical and Electrical Parameters

The correlation coefficients Pearson (1) between the dependent variable (surface resistance (Rs) after crosslinking) and independent variables (Pa, Pv, δ and M) have been analyzed to observe the strength of the relationship between these variables:
r x y = 1 n   ( x x ¯ ) ( y y ¯ ) s x s y
where:
x, y represents the individual values of the variables x and y;
x ¯ , y ¯ represents the arithmetic mean of all the values of x, y;
s x ,     s y represent the standard deviation of all values x and y.
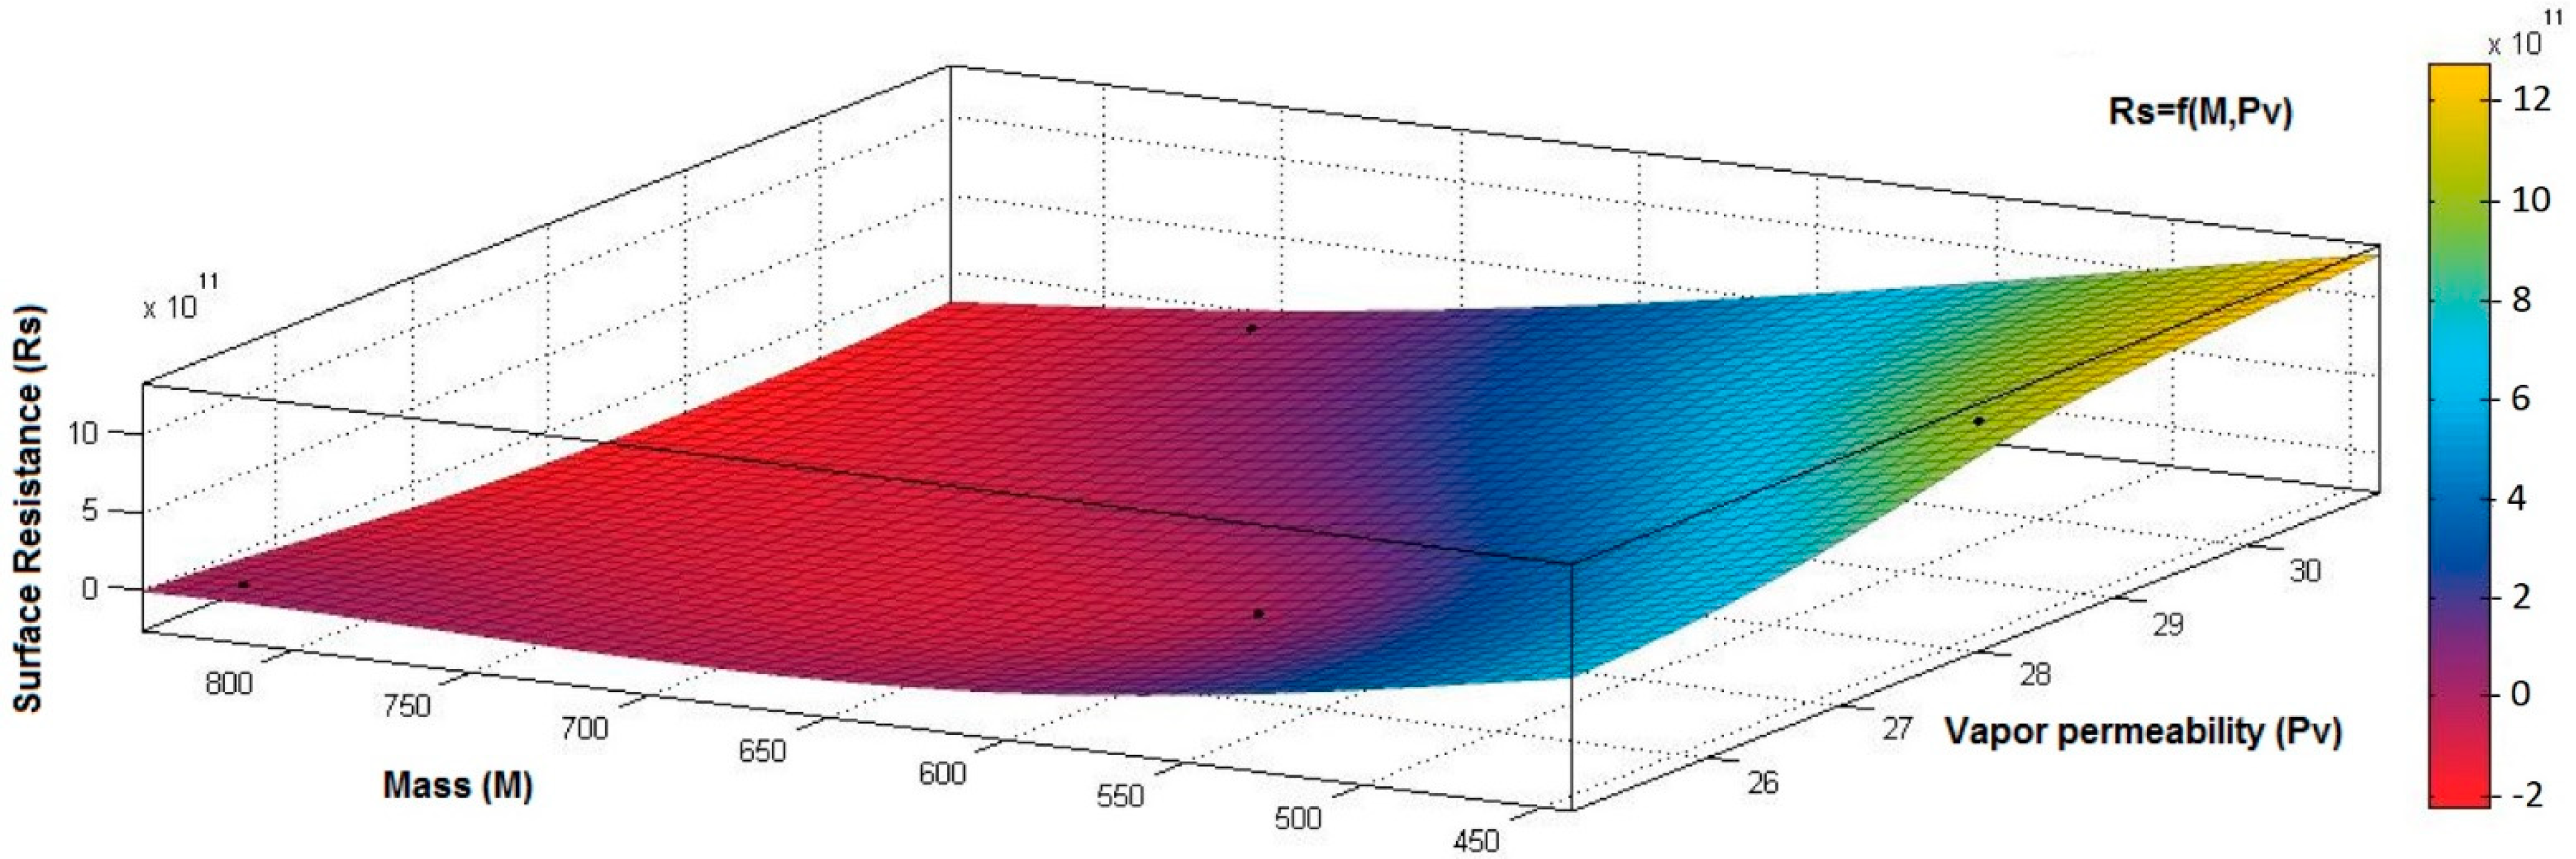
Figure 12, Figure 13 and Figure 14 present the 3D interpolation of datasets for surface electrical resistance (Rs) values, mass (M) values, air permeability (Pa), and thickness (δ) values. These 3D interpolations (Figure 12, Figure 13 and Figure 14) were considered the independent variables such as mass (M), air permeability (Pa), thickness (δ) and surface resistance (Rs) as the dependent variables. Figure 12 presented the 3D representation of the multivariate dependence of Rs values on the mass and thickness values. Figure 13 presents the 3D representation of the Rs values dependent on mass and air permeability values. Figure 14 presents the 3D representation of the multivariate dependence of the electrical surface resistance (Rs) on the air permeability and thickness. The models from Figure 12, Figure 13 and Figure 14, using 3D multivariate representation, were developed to investigate and predict the Rs variable evolution depending on the independent variables such as mass, thickness, and air permeability.
Analyzing the correlation coefficient between Rs and Pa (rRs,Pa = 0.8523 (2)), we can observe a strong positive correlation between variables, which means that the increase of the Pa values can increase surface resistance values.
Analyzing the correlation coefficient between Rs and δ (rRs,δ = 0.2694 (3)), we can observe that, between Rs and δ, it is a weak correlation, and the increase or decrease of δ values will not generate modification in Rs.
Analyzing the correlation coefficient between Rs and M (rRs,M = −0.5261 (4)), we observed a weak negative correlation, and this indicates an inverse proportionality report between Rs and M, suggesting that the increase of M values can have a minor influence on the decrease of the Rs values:
  r R s , P a = | 0.0000 0.8523 0.8523 0.0000 | r 12 R s , P a = r 21 R s , P a = 0.8523
r R s , δ = | 0.0000 0.2694 0.2694 0.0000 | r 12 R s , δ = r 21 R s , δ = 0.2694
r R s , M = | 0.0000 0.5261 0.5261 0.0000 | r 12 R s , M = r 21 R s , M = 0.5261
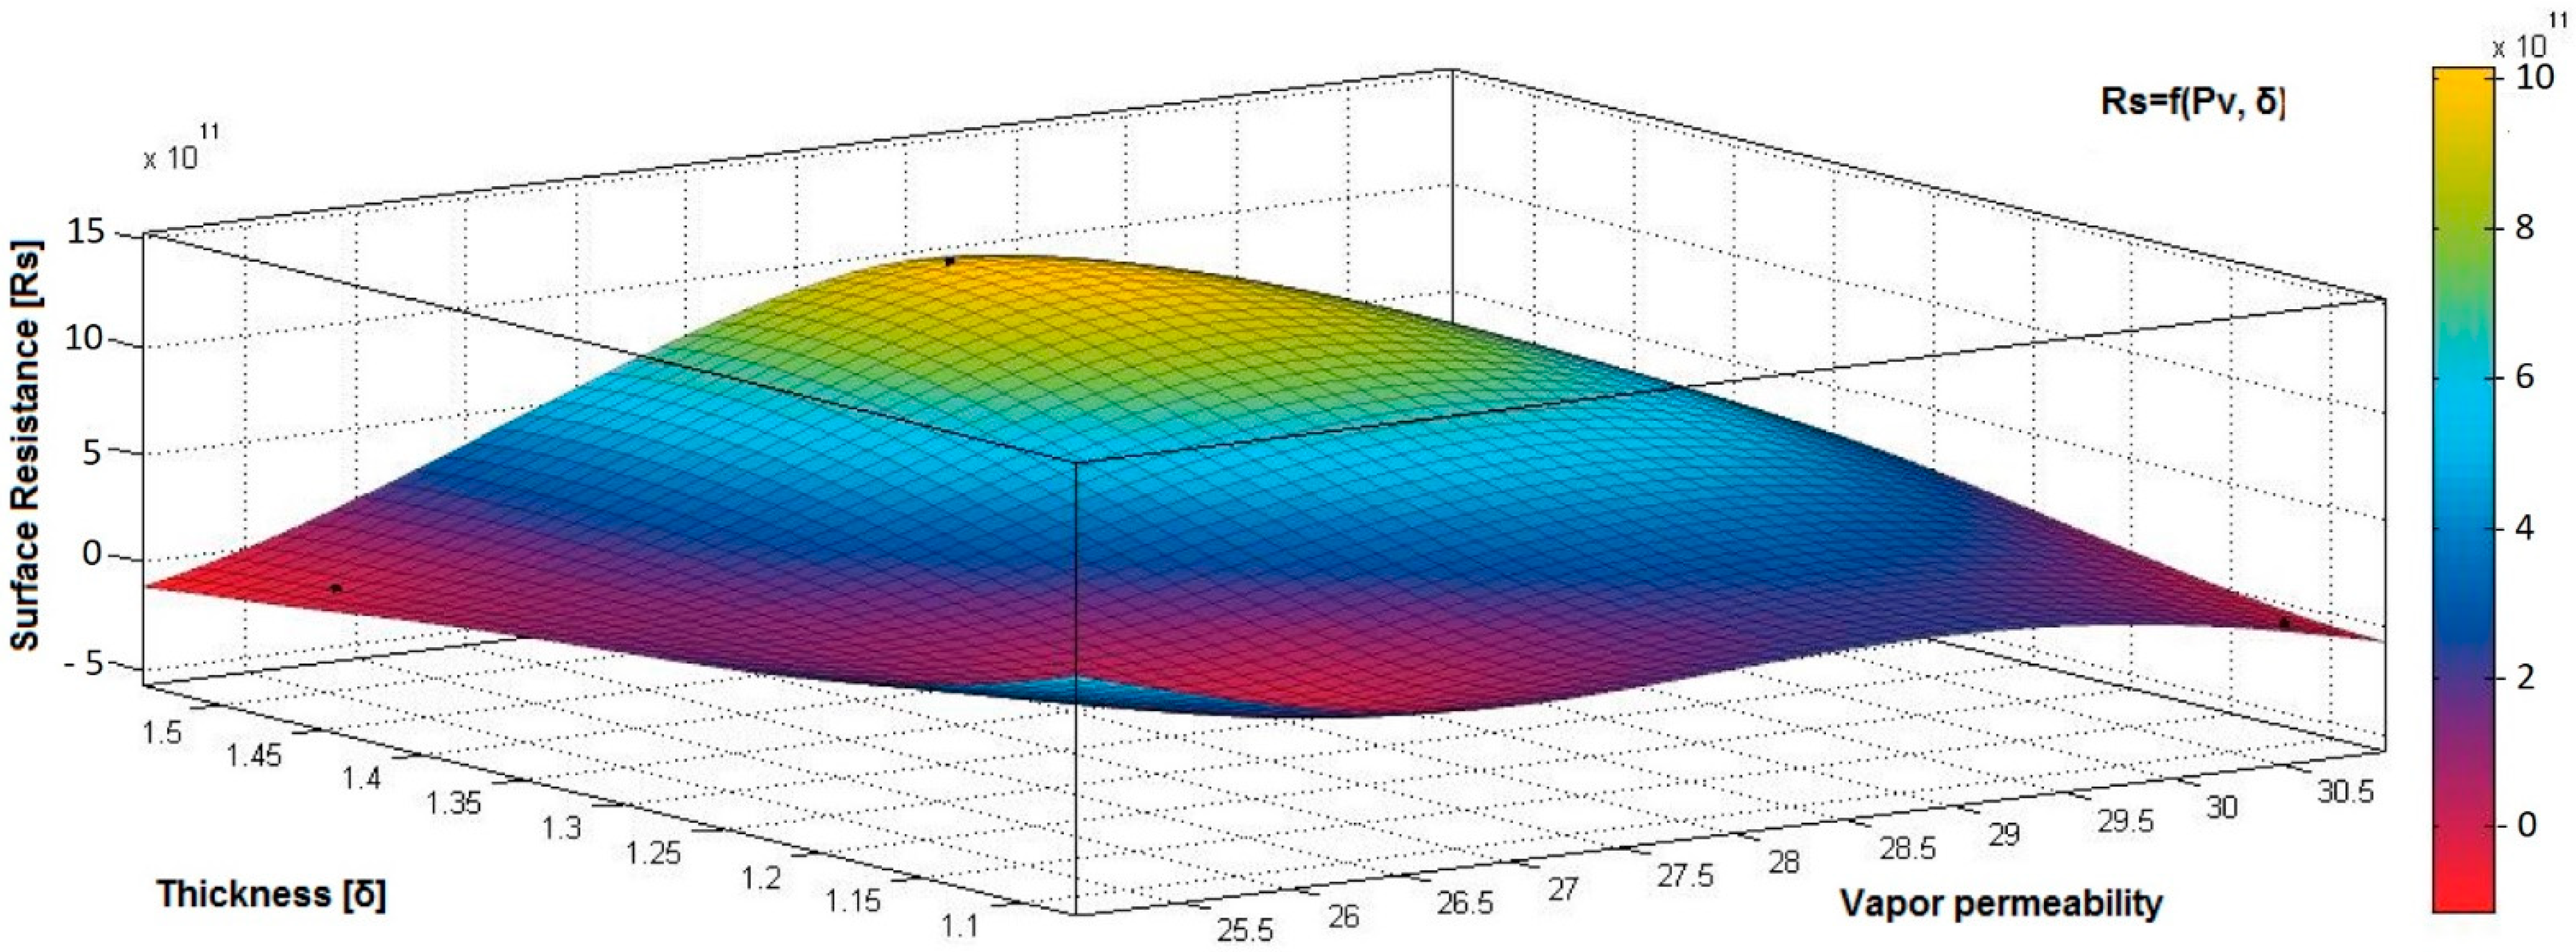
Figure 15, Figure 16, Figure 17, Figure 18 and Figure 19 present the 3D representation of the surface resistance (Rs) depending on the independent variables air permeability (Pa), vapor permeability (Pv), mass (M) and thickness (δ) for electrodes based PVDF membranes. Figure 15 presents the 3D representation of Rs values dependent on air and vapor permeability. In Figure 16, the 3D representation of the Rs values dependent on mass and vapor permeability values is shown.
Figure 17 presents the 3D representation of the electrical surface resistance (Rs) depending on the thickness (δ) and vapor permeability (Pv).
Figure 18 presents the 3D representation of the electrical surface resistance (Rs) depending on the thickness (δ) and air permeability (Pa).
Figure 19 presents the 3D representation of the electrical surface resistance (Rs) depending on the mass (M) and air permeability (Pa).
In the case of the electrodes obtained by conductive PVDF membranes, the correlation coefficient values between surface resistance (Rs) and air permeability (Pa), thickness (δ), vapor permeability (Pv), and mass (M), we can observe the associations between variables analyzed.
The correlation coefficient between Rs and Pa (rRs,Pa = 0.8969 (5)) is positive. It indicates a strong association between variables and means that the increase of the Rs can be influenced by increasing the value of Pa. The correlation coefficient between Rs and δ (rRs,δ = 0.6392 (6)) is positive. It indicates a weak positive association between these variables, which means that the increase of δ will generate low Rs values.
The correlation coefficient between Rs and Pv (rRs,Pv = 0.2082 (7)) is positive but below 0.3, indicating a low association between Rs and Pv variables. However, increasing the Pv value will not generate modification in Rs. In addition, the correlation coefficient between Rs and M (rRs,M = −0.8046 (8)) is negative, suggesting a strong negative association between these variables and an inverse proportionality relationship:
r R s , P a = | 0.0000 0.8969 0.8969 0.0000 | r 12 R s , P a = r 21 R s , P a = 0.8969
r R s , δ = | 0.0000 0.6392 0.6392 0.0000 | r 12 R s , δ = r 21 R s , δ = 0.6392
r R s , P v = | 0.0000 0.2082 0.2082 0.0000 | r 12 R s , P v = r 21 R s , P v = 0.2082
r R s , M = | 0.0000 0.8046 0.8046 0.0000 | r 12 R s , M = r 21 R s , M = 0.8046

4.2. Electrodes Materials Comparison

Table 6 presents the resistance of the PVDF, PEG, PVP, and PVA-based sensors reported in the scientific literature of ethanol biosensors based on polymer-modified electrodes reported in the literature.

5. Conclusions

In conclusion, samples coated with a conductive polymeric paste-based PVDF, PEG, PVA and microparticles (Cu, Ni, and GO) present differences in surface resistance. Samples functionalized by PVDF with Ni microparticles content have a lower surface resistance (Rs = 103 Ω) specific to the electroconductive materials. These conductive membranes obtained can be used for electrodes in flexible electronics.
In the case of the samples treated with artificial perspiration, a reduction of the surface resistance was observed with 25% for electrodes-based PVDF and GO, with a respective 10% for electrodes-based PVDF and Cu1 microparticles [50].
Analyzing the correlation parameters (surface resistance and mass, air permeability and vapor permeability) allows the identification of sensors that can be developed using the proposed electrodes.
In the case of the electrodes based on PVDF membrane:
-
the correlation coefficient between electrical surface resistance (Rs) and vapor permeability (Pv) is 0.2082 (below 0.3), and this demonstrates that, between Rs and Pv, it is a weak correlation;
-
the correlation coefficient between electrical surface resistance (Rs) and mass (M) is negative (−0.8046) and indicates a strong negative association between Rs and M, suggesting that increasing the M (quantity of conductive paste) will generate a decrease in the Rs;
-
the correlation coefficient between Rs and Pa is positive (0.8969), indicating a strong positive association between variables and a direct relationship between Rs and Pa, suggesting that increasing the Pa (air being an excellent electrical insulator) will increase the Rs.
The proposed electrodes based on PVDF and Ni showed promising results compared to other state-of-the-art methods.
Our flexible electrodes generate new perspectives on the successful detection of temperature or moisture by integrating these electrodes in wearable textile articles.
In the future, we plan to use these electrodes based on PVDF and Ni in real demonstrators for moisture and temperature sensors.
Our next research objective is to develop a wearable sensor capable of detecting temperature and moisture variation by connecting the electrodes embedded in textile articles to a microcontroller.

Supplementary Materials

The following supporting information can be downloaded at: https://www.mdpi.com/article/10.3390/ma15207286/s1, Table S1: Surface topography-optical microscopy and contact angle analysis for samples 6–14.

Author Contributions

All authors discussed and agreed upon the idea and made scientific contributions: writing draft preparation, R.M.A.; Conceptualization and experiment design, R.M.A.; methodology, R.M.A.; classical treatment, R.M.A. and L.C.; statistical analysis, R.M.A.; investigation, R.M.A. and L.C.; project administration, R.M.A. All authors have read and agreed to the published version of the manuscript.

Funding

The Ministry of Research, Innovation and Digitalization funded this research within Project 3D ELECTROTEX, Contract No. PN 19 17 01 01 and the APC was funded within Program NUCLEU—Contract no. PN 19 17 01 01 (Research Project 3D ELECTROTEX) and Program 1—Development of the national R&D system, Subprogram 1.2—Institutional Performance—RDI excellence funding projects, Contract no. 4 PFE/2021.

Institutional Review Board Statement

Not applicable.

Informed Consent Statement

Not applicable.

Data Availability Statement

Not applicable.

Acknowledgments

This scientific paper has been funded by the Ministry of Research, Innovation and Digitalization, project 3D Electrotex, PN 19 17 01 01. The investigation (SEM, EDX) was carried out by the scientific researcher eng. Irina Sandulache within the 3D-Electrotex project, using INCDTP research infrastructure.

Conflicts of Interest

The authors declare no conflict of interest.

References

  1. Proto, A.; Fida, B.; Bernabucci, I.; Bibbo, D.; Conforto, S.; Schmid, M.; Penhaker, M. Wearable PVDF transducer for biomechanical energy harvesting and gait cycle detection. In Proceedings of the 2016 IEEE EMBS Conference on Biomedical Engineering and Sciences (IECBES), Kuala Lumpur, Malaysia, 4–8 December 2016; pp. 62–66. [Google Scholar]
  2. Gupta, S.; Chang, C.; Anbalagan, A.K.; Lee, C.H.; Tai, N.H. Reduced graphene oxide/zinc oxide coated wearable electrically conductive cotton textile for high microwave absorption. Compos. Sci. Technol. 2020, 188, 107994. [Google Scholar] [CrossRef]
  3. Shateri-Khalilabad, M.; Yazdanshenas, M.E. Fabricating electroconductive cotton textiles using graphene. Carbohydr. Polym. 2013, 96, 190–195. [Google Scholar] [CrossRef] [PubMed]
  4. Sang, M.; Liu, S.; Li, W.; Wang, S.; Li, J.; Li, J.; Gong, X. Flexible Polyvinylidene fluoride (PVDF)/MXene (Ti3C2Tx)/Polyimide (P.I.) Wearable Electronic for Body Monitoring, Thermotherapy and Electromagnetic Interference Shielding. Compos. Part A Appl. Sci. Manuf. 2021, 153, 106727. [Google Scholar] [CrossRef]
  5. Hernández-Rivera, D.; Rodríguez-Roldán, G.; Mora-Martínez, R.; Suaste-Gómez, E. A capacitive humidity sensor based on an electrospun PVDF/graphene membrane. Sensors 2017, 17, 1009. [Google Scholar] [CrossRef] [PubMed] [Green Version]
  6. Islam, J.; Chowdhury, F.I.; Raza, W.; Qi, X.; Rahman, M.R.; Das, J.; Zabed, H.M. Toward polymer composites based and architectural engineering induced flexible electrodes for lithium-ion batteries. Renew. Sustain. Energy Rev. 2021, 148, 111302. [Google Scholar] [CrossRef]
  7. Wang, X.; Yu, J.; Cui, Y.; Li, W. Research progress of flexible wearable pressure sensors. Sens. Actuators A Phys. 2021, 330, 112838. [Google Scholar] [CrossRef]
  8. Zhang, C.; Fan, W.; Wang, S.; Wang, Q.; Zhang, Y.; Dong, K. Recent Progress of Wearable Piezoelectric Nanogenerators. ACS Appl. Electron. Mater. 2021, 3, 2449–2467. [Google Scholar] [CrossRef]
  9. Xue, L.; Fan, W.; Yu, Y.; Dong, K.; Liu, C.; Sun, Y.; Wang, Q. A Novel Strategy to Fabricate Core-Sheath Structure Piezoelectric Yarns for Wearable Energy Harvesters. Adv. Fiber Mater. 2021, 3, 239–250. [Google Scholar] [CrossRef]
  10. Xin, Y.; Guo, C.; Qi, X.; Tian, H.; Li, X.; Dai, Q.; Wang, C. Wearable and unconstrained systems based on PVDF sensors in physiological signals monitoring: A brief review. Ferroelectrics 2016, 500, 291–300. [Google Scholar] [CrossRef]
  11. Fashandi, H.; Abolhasani, M.M.; Sandoghdar, P.; Zohdi, N.; Li, Q.; Naebe, M. Morphological changes towards enhancing piezoelectric properties of PVDF electrical generators using cellulose nanocrystals. Cellulose 2016, 23, 3625–3637. [Google Scholar] [CrossRef]
  12. Fan, F.R.; Tang, W.; Wang, Z.L. Flexible nanogenerators for energy harvesting and self-powered electronics. Adv. Mater. 2016, 28, 4283–4305. [Google Scholar] [CrossRef] [PubMed]
  13. Kaur, N.; Bahadur, J.; Panwar, V.; Singh, P.; Rathi, K.; Pal, K. Effective energy harvesting from a single electrode based triboelectric nanogenerator. Sci. Rep. 2016, 6, 38835. [Google Scholar] [CrossRef] [PubMed] [Green Version]
  14. Zhang, X.S. Flexible Triboelectric Nanogenerators: Enhancement and Applications. In Micro/Nano Integrated Fabrication Technology and Its Applications in Microenergy Harvesting; Springer: Berlin/Heidelberg, Germany, 2016; pp. 93–117. [Google Scholar]
  15. Li, W.; Torres, D.; Wang, T.; Wang, C.; Sepúlveda, N. Flexible and biocompatible polypropylene ferroelectret nanogenerator (FENG): On the path toward wearable devices powered by human motion. Nano Energy 2016, 30, 649–657. [Google Scholar] [CrossRef] [Green Version]
  16. Sim, H.J.; Choi, C.; Kim, S.H.; Kim, K.M.; Lee, C.J.; Kim, Y.T.; Kim, S.J. Stretchable triboelectric fiber for self-powered kinematic sensing textile. Sci. Rep. 2016, 6, 35153. [Google Scholar] [CrossRef] [PubMed] [Green Version]
  17. Fuh, Y.K.; Ho, H.C. Highly flexible self-powered sensors based on printed circuit board technology for human motion detection and gesture recognition. Nanotechnology 2016, 27, 095401. [Google Scholar] [CrossRef]
  18. Shi, Q.; Wang, H.; Wang, T.; Lee, C. Self-powered liquid triboelectric microfluidic sensor for pressure sensing and finger motion monitoring applications. Nano Energy 2016, 30, 450–459. [Google Scholar] [CrossRef]
  19. Trung, T.Q.; Lee, N.E. Flexible and stretchable physical sensor integrated platforms for wearable human-activity monitoringand personal healthcare. Adv. Mater. 2016, 28, 4338–4372. [Google Scholar] [CrossRef]
  20. Bendi, R.; Bhavanasi, V.; Parida, K.; Nguyen, V.C.; Sumboja, A.; Tsukagoshi, K.; Lee, P.S. Self-powered graphene thermistor. Nano Energy 2016, 26, 586–594. [Google Scholar] [CrossRef]
  21. Xin, Y.; Sun, H.; Tian, H.; Guo, C.; Li, X.; Wang, S.; Wang, C. The use of polyvinylidene fluoride (PVDF) films as sensors for vibration measurement: A brief review. Ferroelectrics 2016, 502, 28–42. [Google Scholar] [CrossRef]
  22. Khan, R.A.; Ashraf, M.; Javid, A.; Iqbal, K.; Rasheed, A.; Nasir, N. Development of self-polarized PVDF films on carbon fabrics for sensing applications. J. Text. Inst. 2021, 113, 2208–2214. [Google Scholar] [CrossRef]
  23. Chakhchaoui, N.; Farhan, R.; Chu, Y.M.; Khan, U.; Eddiai, A.; Omari, L.E.H.; Van Langenhove, L. Flexible smart textile coated by PVDF/Graphene oxide with excellent energy harvesting toward a novel class of self-powered sensors: Fabrication, Characterization and Measurements. Preprints 2021, 2021030786. [Google Scholar] [CrossRef]
  24. Rohit, A.; Kaya, S. A Systematic Study of Wearable Multi-Modal Capacitive Textile Patches. IEEE Sens. J. 2021, 21, 21339475. [Google Scholar] [CrossRef]
  25. Wu, Y.; Ma, Y.; Zheng, H.; Ramakrishna, S. Piezoelectric Materials for Flexible and Wearable Electronics: A review. Mater. Des. 2021, 211, 110164. [Google Scholar] [CrossRef]
  26. Katsouras, I.; Asadi, K.; Li, M.; Van Driel, T.B.; Kjaer, K.S.; Zhao, D.; De Leeuw, D.M. The negative piezoelectric effect of the ferroelectric polymer poly (vinylidene fluoride). Nat. Mater. 2016, 15, 78–84. [Google Scholar] [CrossRef] [Green Version]
  27. Lim, J.; Kim, H.S. Effects of SWCNT/PVDF composite web behavior on acoustic piezoelectric property. Sens. Actuators A Phys. 2021, 330, 112840. [Google Scholar] [CrossRef]
  28. Choi, Y.; Lee, S.; Sung, M.; Park, J.; Kim, S.; Choi, Y. Development of EMG-FMG Based Prosthesis With PVDF-Film Vibrational Feedback Control. IEEE Sens. J. 2021, 21, 23597–23607. [Google Scholar] [CrossRef]
  29. Shateri-Khalilabad, M.; Yazdanshenas, M.E. Preparation of superhydrophobic electroconductive graphene-coated cotton cellulose. Cellulose 2013, 20, 963–972. [Google Scholar] [CrossRef]
  30. Jang, H.S.; Moon, M.S.; Kim, B.H. Electronic Textiles Fabricated with Graphene Oxide-Coated Commercial Textiles. Coatings 2021, 11, 489. [Google Scholar] [CrossRef]
  31. Al Faruque, M.A.; Kiziltas, A.; Mielewski, D.; Naebe, M. A facile approach of fabricating electrically conductive knitted fabrics using graphene oxide and textile-based waste material. Polymers 2021, 13, 3003. [Google Scholar] [CrossRef]
  32. Yun, Y.J.; Hong, W.G.; Kim, W.J.; Jun, Y.; Kim, B.H. A novel method for applying reduced graphene oxide directly to electronic textiles from yarns to fabrics. Adv. Mater. 2013, 25, 5701–5705. [Google Scholar] [CrossRef]
  33. Yu, R.; Zhu, C.; Wan, J.; Li, Y.; Hong, X. Review of graphene-based textile strain sensors, with emphasis on structure activity relationship. Polymers 2021, 13, 151. [Google Scholar] [CrossRef] [PubMed]
  34. Wu, R.; Ma, L.; Patil, A.; Meng, Z.; Liu, S.; Hou, C.; Liu, X.Y. Graphene decorated carbonized cellulose fabric for physiological signal monitoring and energy harvesting. J. Mater. Chem. A 2020, 8, 12665–12673. [Google Scholar] [CrossRef]
  35. Tissera, N.D.; Wijesena, R.N.; Rathnayake, S.; de Silva, R.M.; de Silva, K.N. Heterogeneous in situ polymerization of polyaniline (PANI) nanofibers on cotton textiles: Improved electrical conductivity, electrical switching, and tuning properties. Carbohydr. Polym. 2018, 186, 35–44. [Google Scholar] [CrossRef] [PubMed]
  36. Li, L.; Au, W.M.; Li, Y.; Wan, K.M.; Wan, S.H.; Wong, K.S. Design of intelligent garment with transcutaneous electrical nerve stimulation function based on the intarsia knitting technique. Text. Res. J. 2010, 80, 279–286. [Google Scholar] [CrossRef]
  37. Frydrysiak, M.; Zieba, J.; Tesiorowski, L. Mechatronic line for activation and testing of printed electrodes. Tech. Gaz. 2016, 23, 1003–1010. [Google Scholar]
  38. Zieba, J.; Frydrysiak, M.; Tesiorowski, L.; Tokarska, M. Textronic matrix of electrode system to electrostimulation. In Proceedings of the IEEE International Symposium on Medical Measurements and Applications Proceedings (MeMeA), Budapest, Hungary, 18–19 May 2012; pp. 1–5. [Google Scholar]
  39. Ali, A.; Baheti, V.; Militky, J.; Khan, Z. Utility of silver-coated fabrics as electrodes in electrotherapy applications. J. Appl. Polym. Sci. 2018, 135, 46357. [Google Scholar] [CrossRef]
  40. Euler, L.; Guo, L.; Persson, N.-K. Textile electrodes: Influence of knitting construction and pressure on the contact impedance. Sensors 2021, 21, 1578. [Google Scholar] [CrossRef]
  41. Ge, J.; Sun, L.; Zhang, F.R.; Zhang, Y.; Shi, L.A.; Zhao, H.Y.; Zhu, H.W.; Jiang, H.L.; Yu, S.H. A stretchable electronic fabric artificial skin with pressure-, lateral strain-, and flexion-sensitive properties. Adv. Mater. 2016, 28, 722–728. [Google Scholar] [CrossRef]
  42. Huang, F.; Hu, J.; Yan, X. Review of Fiber-or Yarn-Based Wearable Resistive Strain Sensors: Structural Design, Fabrication Technologies and Applications. Textiles 2022, 2, 81–111. [Google Scholar] [CrossRef]
  43. Dong, K.; Peng, X.; Wang, Z.L. Fiber/fabric-based piezoelectric and triboelectric nanogenerators for flexible/stretchable and wearable electronics and artificial intelligence. Adv. Mater. 2020, 32, 1902549. [Google Scholar] [CrossRef]
  44. Zhong, J.; Zhang, Y.; Zhong, Q.; Hu, Q.; Hu, B.; Wang, Z.L.; Zhou, J. Fiber-based generator for wearable electronics and mobile medication. ACS Nano 2014, 8, 6273–6280. [Google Scholar] [CrossRef] [PubMed]
  45. Lin, Z.; Yang, J.; Li, X.; Wu, Y.; Wei, W.; Liu, J.; Chen, J.; Yang, J. Large-scale and washable smart textiles based on triboelectric nanogenerator arrays for self-powered sleeping monitoring. Adv. Funct. Mater. 2018, 28, 1704112. [Google Scholar] [CrossRef]
  46. Huang, T.; Wang, C.; Yu, H.; Wang, H.; Zhang, Q.; Zhu, M. Human walking-driven wearable all-fiber triboelectric nanogenerator containing electrospun polyvinylidene fluoride piezoelectric nanofibers. Nano Energy 2015, 14, 226–235. [Google Scholar] [CrossRef]
  47. Abbasipour, M.; Khajavi, R.; Yousefi, A.A.; Yazdanshenas, M.E.; Razaghian, F.; Akbarzadeh, A. Improving piezoelectric and pyroelectric properties of electrospun PVDF nanofibers using nanofillers for energy harvesting application. Polym. Adv. Technol. 2019, 30, 279–291. [Google Scholar] [CrossRef]
  48. Tseghai, G.B.; Mengistie, D.A.; Malengier, B.; Fante, K.A.; Van Langenhove, L. PEDOT: PSS-based conductive textiles and their applications. Sensors 2020, 20, 1881. [Google Scholar] [CrossRef] [Green Version]
  49. Li, X.; Lin, Z.H.; Cheng, G.; Wen, X.; Liu, Y.; Niu, S.; Wang, Z.L. 3D fiber-based hybrid nanogenerator for energy harvesting and as a self-powered pressure sensor. ACS Nano 2014, 8, 10674–10681. [Google Scholar] [CrossRef]
  50. Aileni, R.M.; Chiriac, L.; Sandulache, I. Conductive membranes for sensors. In Proceedings of the 4th International Conference on Emerging Technologies in Materials Engineering, Bucharest, Romania, 4–5 November 2021; ISSN 2602-0416. [Google Scholar]
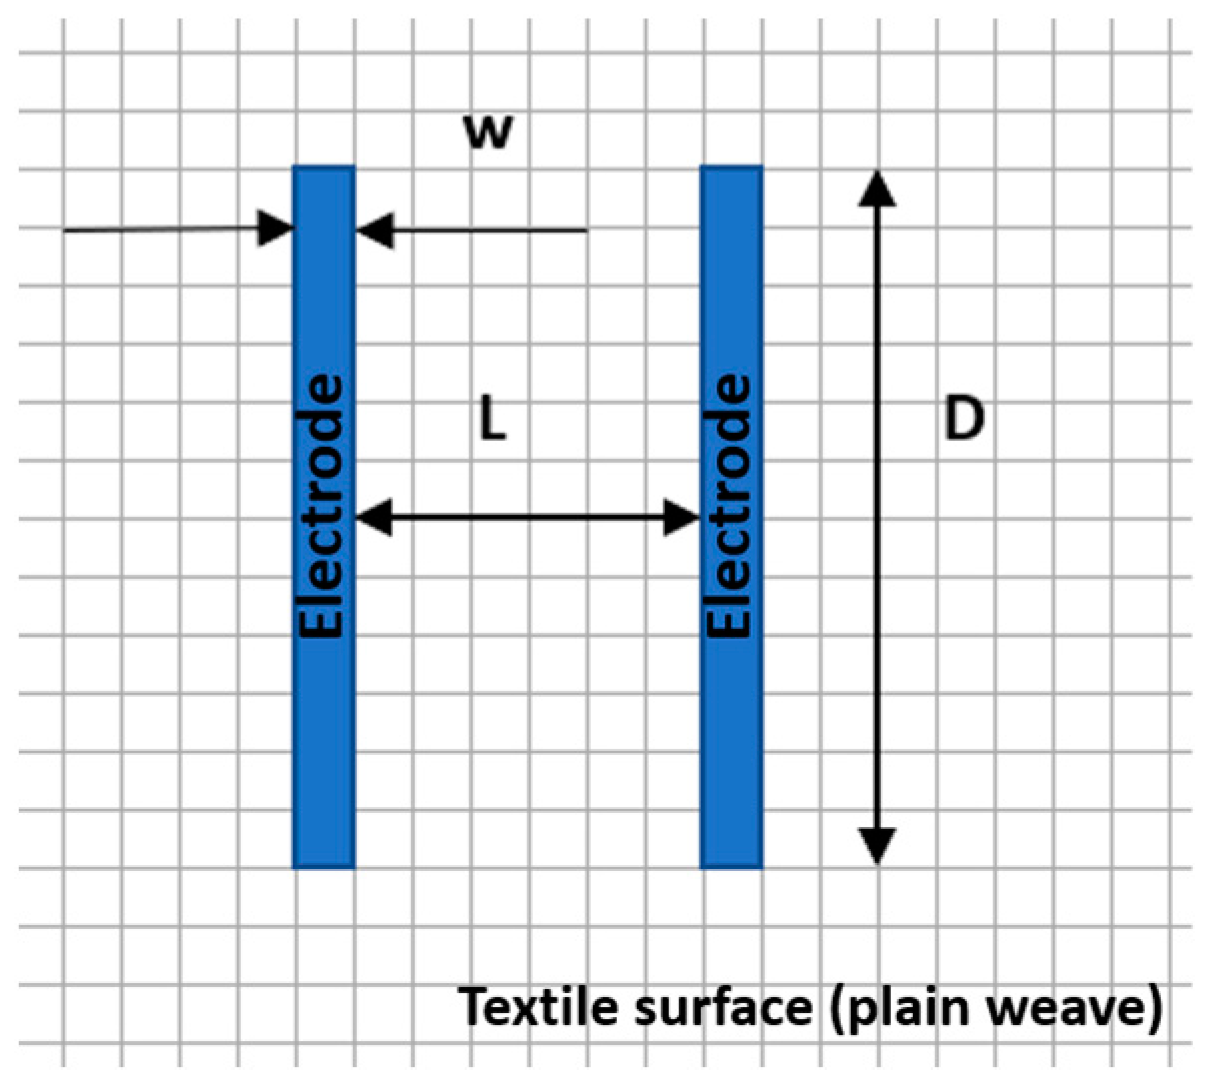
Figure 1. Placement of the parallel electrodes on the same side of the textile surface for surface resistance measurement (w represents the width of the electrode, D represents the length of the electrode (D = 6 cm), and L is the distance between electrodes (L = 3 cm)).
Materials 15 07286 g001
Figure 2. EDS spectra for sample 1 (fabric treated using a preliminary classical cleaning method, without conductive paste).
Materials 15 07286 g002
Figure 3. Smart elemental mapping overlay for sample 1 (fabric treated using a preliminary classical cleaning method, without conductive paste).
Materials 15 07286 g003
Figure 4. EDS spectra for sample 2 (fabric treated using a preliminary classical cleaning method and conductive paste).
Materials 15 07286 g004
Figure 5. Smart elemental mapping overlay for sample 2: (a) untreated with artificial perspiration; (b) treated with acid perspiration; (c) treated with alkaline artificial perspiration.
Materials 15 07286 g005
Figure 6. EDS spectra for sample 3 (fabric treated using a preliminary classical cleaning method and conductive paste).
Materials 15 07286 g006
Figure 7. Smart elemental mapping overlay for sample 3: (a) untreated with artificial perspiration; (b) treated with acid perspiration; (c) treated with alkaline artificial perspiration.
Materials 15 07286 g007
Figure 8. EDS spectra for sample 4 (fabric treated using a preliminary classical cleaning method and conductive paste).
Materials 15 07286 g008
Figure 9. Smart elemental mapping overlay for sample 4: (a) untreated with artificial perspiration; (b) treated with acid perspiration; (c) treated with alkaline artificial perspiration.
Materials 15 07286 g009
Figure 10. EDS spectra for sample 5 (fabric treated using preliminary classical cleaning method and conductive paste).
Materials 15 07286 g010
Figure 11. Smart elemental mapping overlay for sample 5: (a) untreated with artificial perspiration; (b) treated with acid perspiration; (c) treated with alkaline artificial perspiration.
Materials 15 07286 g011
Figure 12. 3D representation Rs = f(M, δ) samples coated with conductive polymeric paste.
Materials 15 07286 g012
Figure 13. 3D representation Rs (Pa, M) samples coated with conductive polymeric paste.
Materials 15 07286 g013
Figure 14. 3D representation Rs = f(Pa, δ) samples coated with conductive polymeric paste.
Materials 15 07286 g014
Figure 15. 3D representation Rs = f(Pa, Pv) samples coated with a conductive polymeric paste-based PVDF.
Materials 15 07286 g015
Figure 16. 3D representation Rs = f(M, Pv) samples coated with a conductive polymeric paste-based PVDF.
Materials 15 07286 g016
Figure 17. 3D representation Rs = f(δ, Pv) samples coated with a conductive polymeric paste-based PVDF.
Materials 15 07286 g017
Figure 18. 3D representation Rs = f(δ, Pa) samples coated with a conductive polymeric paste-based PVDF.
Materials 15 07286 g018
Figure 19. 3D representation Rs = f(M, Pa) samples coated with a conductive polymeric paste-based PVDF.
Materials 15 07286 g019
Table 1. Physico-mechanical and electrical properties of the electrodes-based polymeric membranes with metallic microparticles (Ni, Cu1, Cu2) and GO.
Sample No.PVDFPEGPVPPVAGONiCu1Cu2Rs *
(Ω)
M **
(g/m2)
δ ***
(mm)
Pv ****Pa *****
(L/m2/s)
1--------10124151.06-33.76
2x---x---1012460.41.5228.595.2
3x----x--103593.61.14426.745.9
4x-----x-10107481.09630.724.42
5x-x----x109824.41.47425.33.332
6-xxx---x106997.61.168-10.86
7-xx----x10610421.044-1.38
8-xx---x-10712621.06-2.066
9-xx-x---107940.41.008-2.076
10-xx---x-10712221.006-2.024
11--x--x--1010717.61.73224.127.44
12--x---x-10116081.32224.136.74
13--x----x1010784.81.8982619.68
14-xx---x-1061187.21.034-1.184
* Rs—surface resistance [Ω]; ** M—mass [g/m2]; *** δ—Thickness [mm]; **** Pv—Vapor permeability [%]; ***** Pa—Air permeability [L/m2/s].
Table 2. Electrical properties of the electrodes before and after treatments with artificial (alkaline/acid) perspirations.
Sample No.PVDFGONiCu1Cu2Rs1 *
(Ω)
Rs2 **
(Ω)
T ***
(° C)
Conductive Effect
T1xx---101210919.2antistatic
T2x-x--10310919.1antistatic
T3x--x-101010919.1antistatic
T4x---x10910919.4antistatic
* Rs1—surface resistance before treatments in artificial perspirations; ** Rs2—surface resistance after treatments in artificial perspirations; *** T—the temperature at the moment of Rs2 investigation.
Table 3. Surface morphology-SEM.
Sample No.InitialAcid Perspiration TreatmentAlkaline Perspiration Treatment
1Materials 15 07286 i001--
2Materials 15 07286 i002Materials 15 07286 i003Materials 15 07286 i004
3Materials 15 07286 i005Materials 15 07286 i006Materials 15 07286 i007
4Materials 15 07286 i008Materials 15 07286 i009Materials 15 07286 i010
5Materials 15 07286 i011Materials 15 07286 i012Materials 15 07286 i013
Table 4. Surface topography-optical microscopy and contact angle analysis.
Sample No.InitialAfter CoatingContact Angle ViewContact Angle Value [°]
1Materials 15 07286 i014-Materials 15 07286 i0150
2Materials 15 07286 i016Materials 15 07286 i017Materials 15 07286 i018131.5
3Materials 15 07286 i019Materials 15 07286 i020Materials 15 07286 i02174.2
4Materials 15 07286 i022Materials 15 07286 i023Materials 15 07286 i024132.9
5Materials 15 07286 i025Materials 15 07286 i026Materials 15 07286 i0270
Table 5. Chemical composition (% wt).
Sample No.COFNiNaPCuSiFe
14159
2393425 2
2a323532
2b333235
316192243
3a25331527
3b263421182
491510 66
4a15309 343
4b152612 3403
518671 5
5a17971 22
5b151070 23
Table 6. Electrode materials for sensors.
No.Electrode MaterialRsCFabrication TechniqueSensor TypeReference
1PVDF membrane-based nanofibers--ElectrospinningPotentiometer[1]
2PVDF-MWCNT--ElectrospinningPiezoelectric sensor[2]
3ZnO/PVDF nanofiber membrane --ElectrospinningPressure sensor[3]
4PVDF/Graphene Membrane--ElectrospinningHumidity sensor [4]
5-----[5]
6-----[6]
7PVDF-based Ni membrane103 Ω-Coating (scrapping)-Actual work
8Graphene350/2100 Ω-CVDStrain sensor[7]
9Graphene oxide reduced103 Ω- [8]
10Graphene/Ni -CVD [8]
11Ag fabric465 kΩ-Intarsia knitting Electrode for transcutaneous electrical nerve stimulation[36]
12Ag printed fabric194–953 Ω-Digital printing with inks-based AgElectrode for muscular electrostimulation[37]
13Ag nonwoven10.22 Ω-NonwovenElectrode for electrostimulation[38]
14AgNO3 coated fabric19 Ω-Knit coatedElectrode for electrotherapy[39]
15Ag/PA knitted426 MΩ-Knitted electrodes based on silver-plated polyamide (Ag/PA) yarnsElectrode for biomedical monitoring[40,41]
16Woven-based conductive core-spun yarns--Woven electrodeElectronic Fabric Artificial Skin[42,43,44]
17Fiber–Bragg Gratings-based electrode--Woven electrodesPulse/Temperature Monitoring[45]
18Woven-based conductive yarns--Woven structureElectrodes for triboelectric nanogenerator[46]
19Energy harvesting insole-based PVDF nanofibers--NonwovenElectrodes for triboelectric nanogenerator[47]
20PEDOT: PSS coated fabric--CoatingElectrodes for triboelectric nanogenerator[48]
21Fiber-based hybrid nanogenerator (FBHNG)--FBHNG-based piezoelectric nanogenerator (PENG) and triboelectric nanogenerator (TENG)Electrodes for energy harvesting[49]
Publisher’s Note: MDPI stays neutral with regard to jurisdictional claims in published maps and institutional affiliations.