

Assessment of Waste Marble Powder on the Mechanical Properties of High-Strength Concrete and Evaluation of Its Shear Strength


Abstract
:1. Introduction
2. Research Objectives
3. Materials and Procedures
3.1. Test Materials
3.2. Test Specimens
3.3. Preparation of Test Specimens
4. Specimens Results
4.1. Concrete Strengths
4.2. Acid Attack
4.3. Water Absorption Test
5. Experimental Program
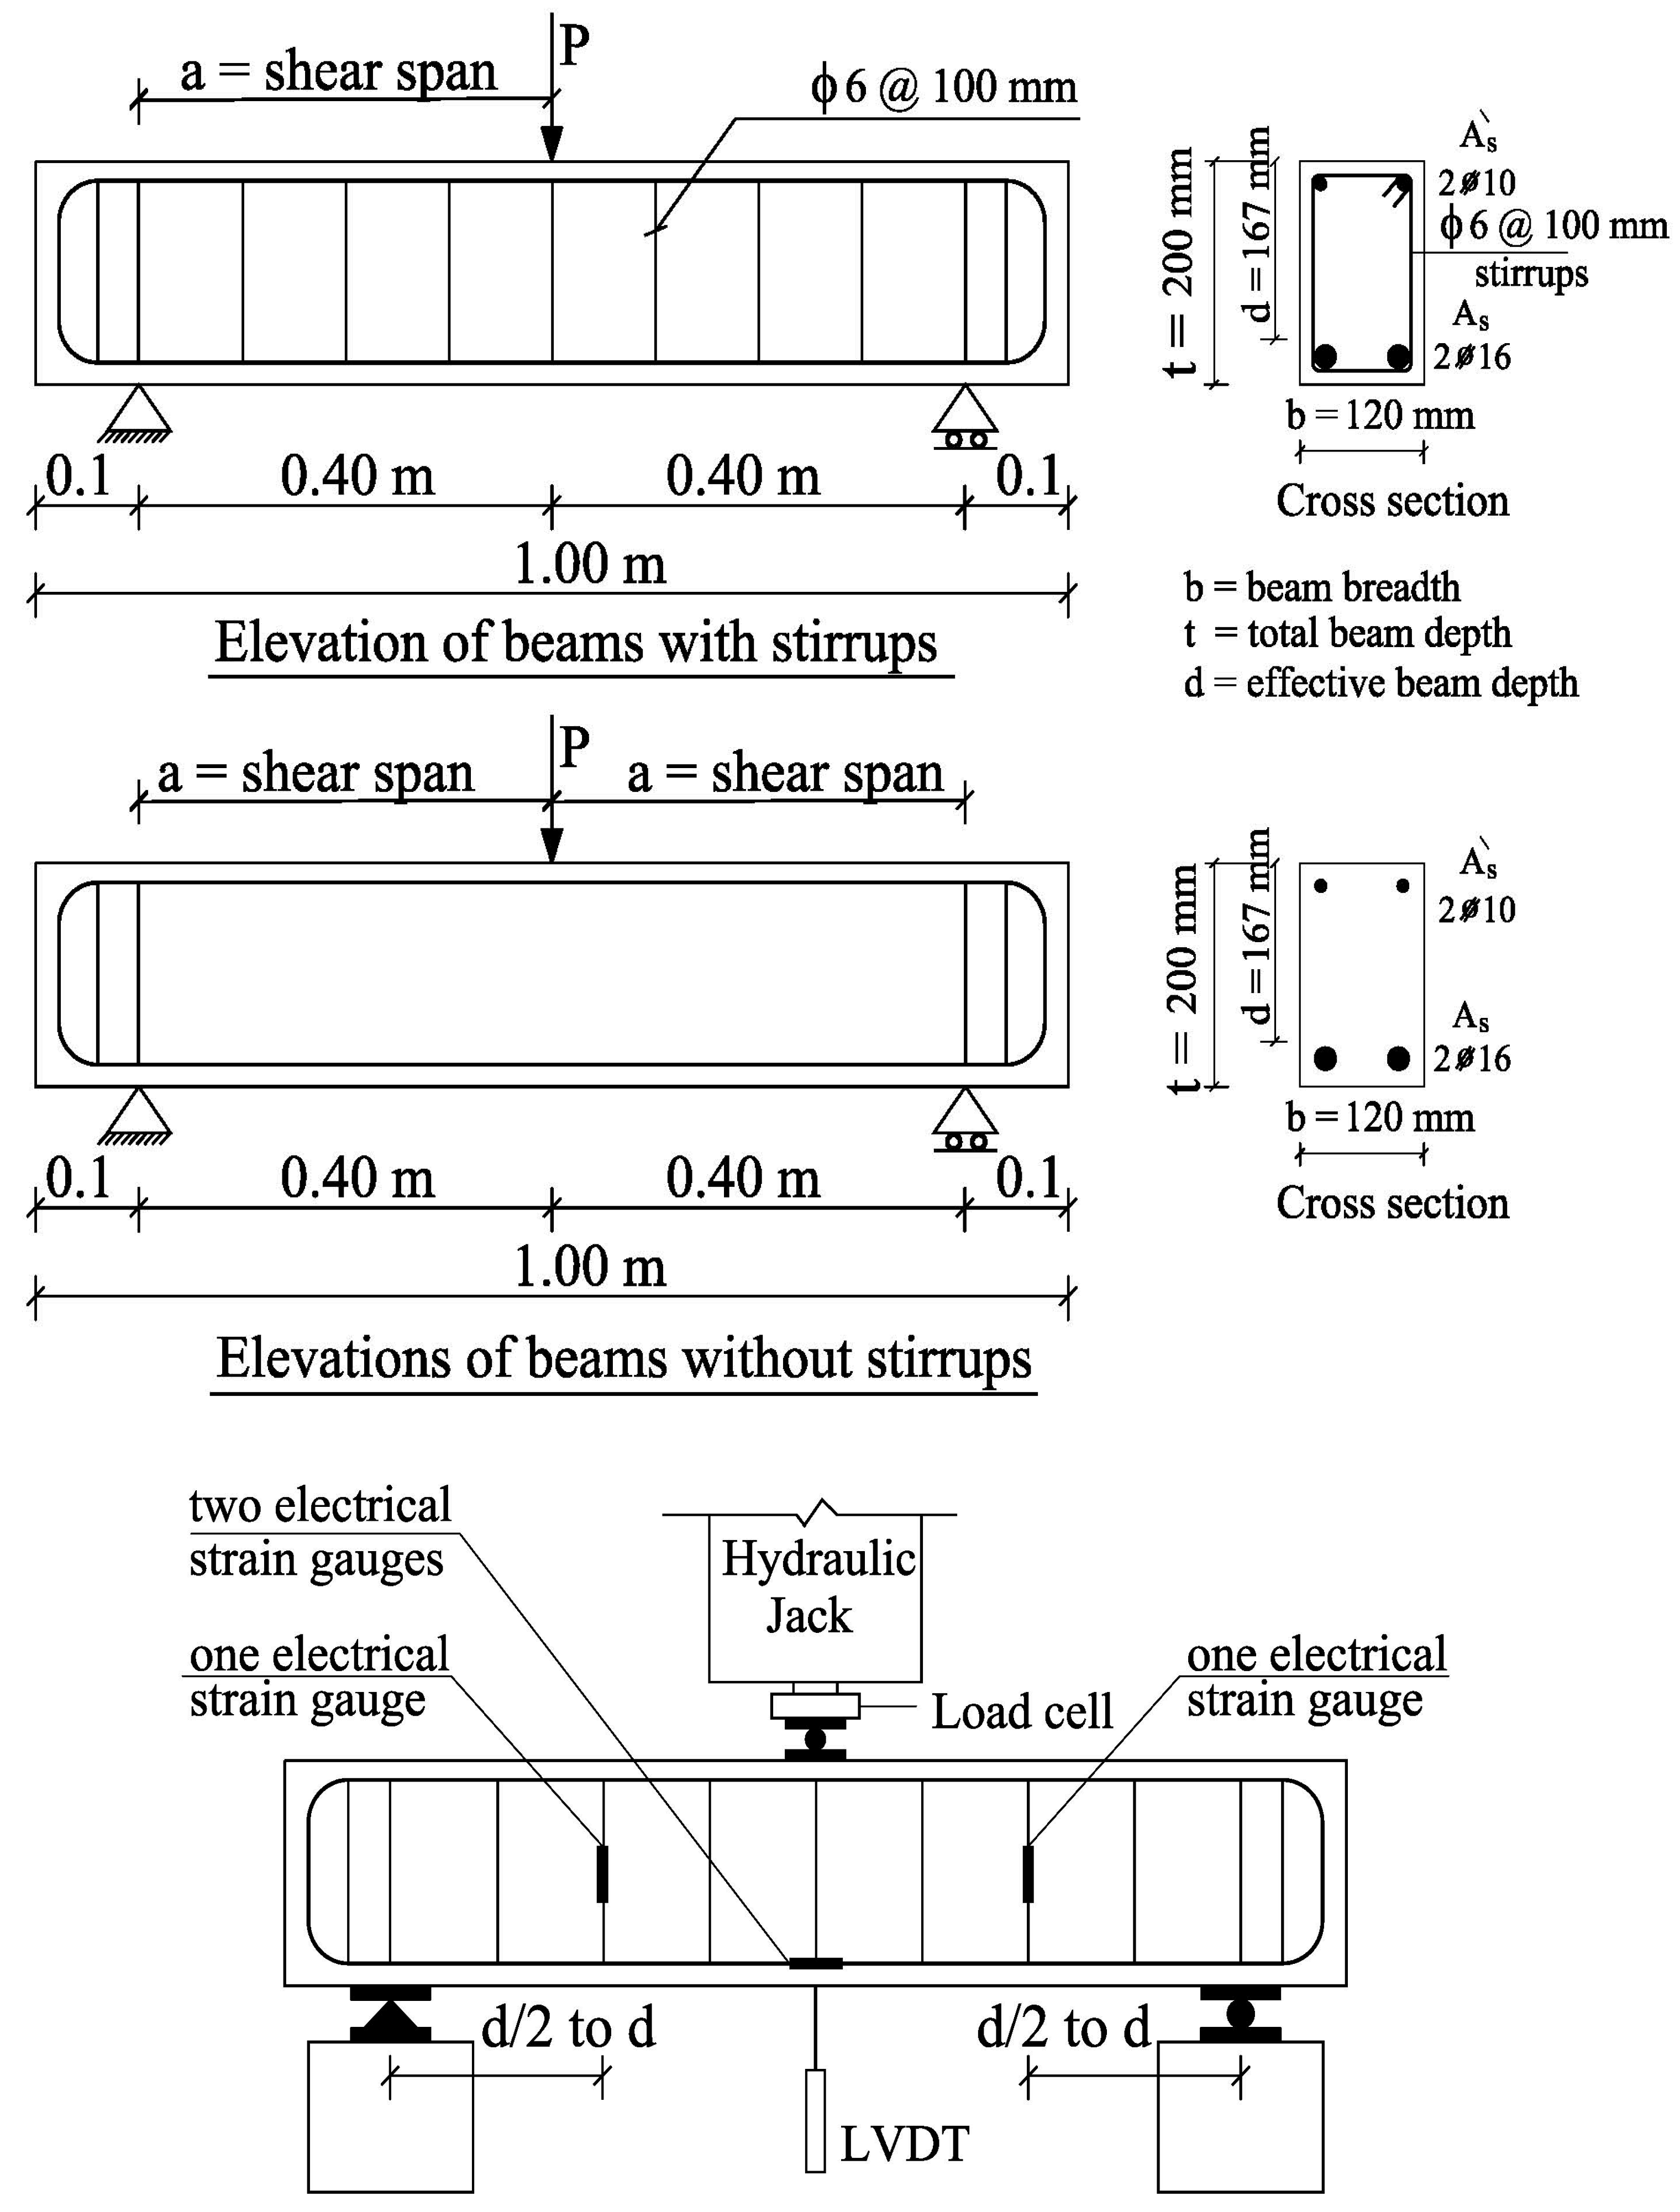
5.1. Beams Description
5.2. Test Setup
6. Experimental Results and Discussion
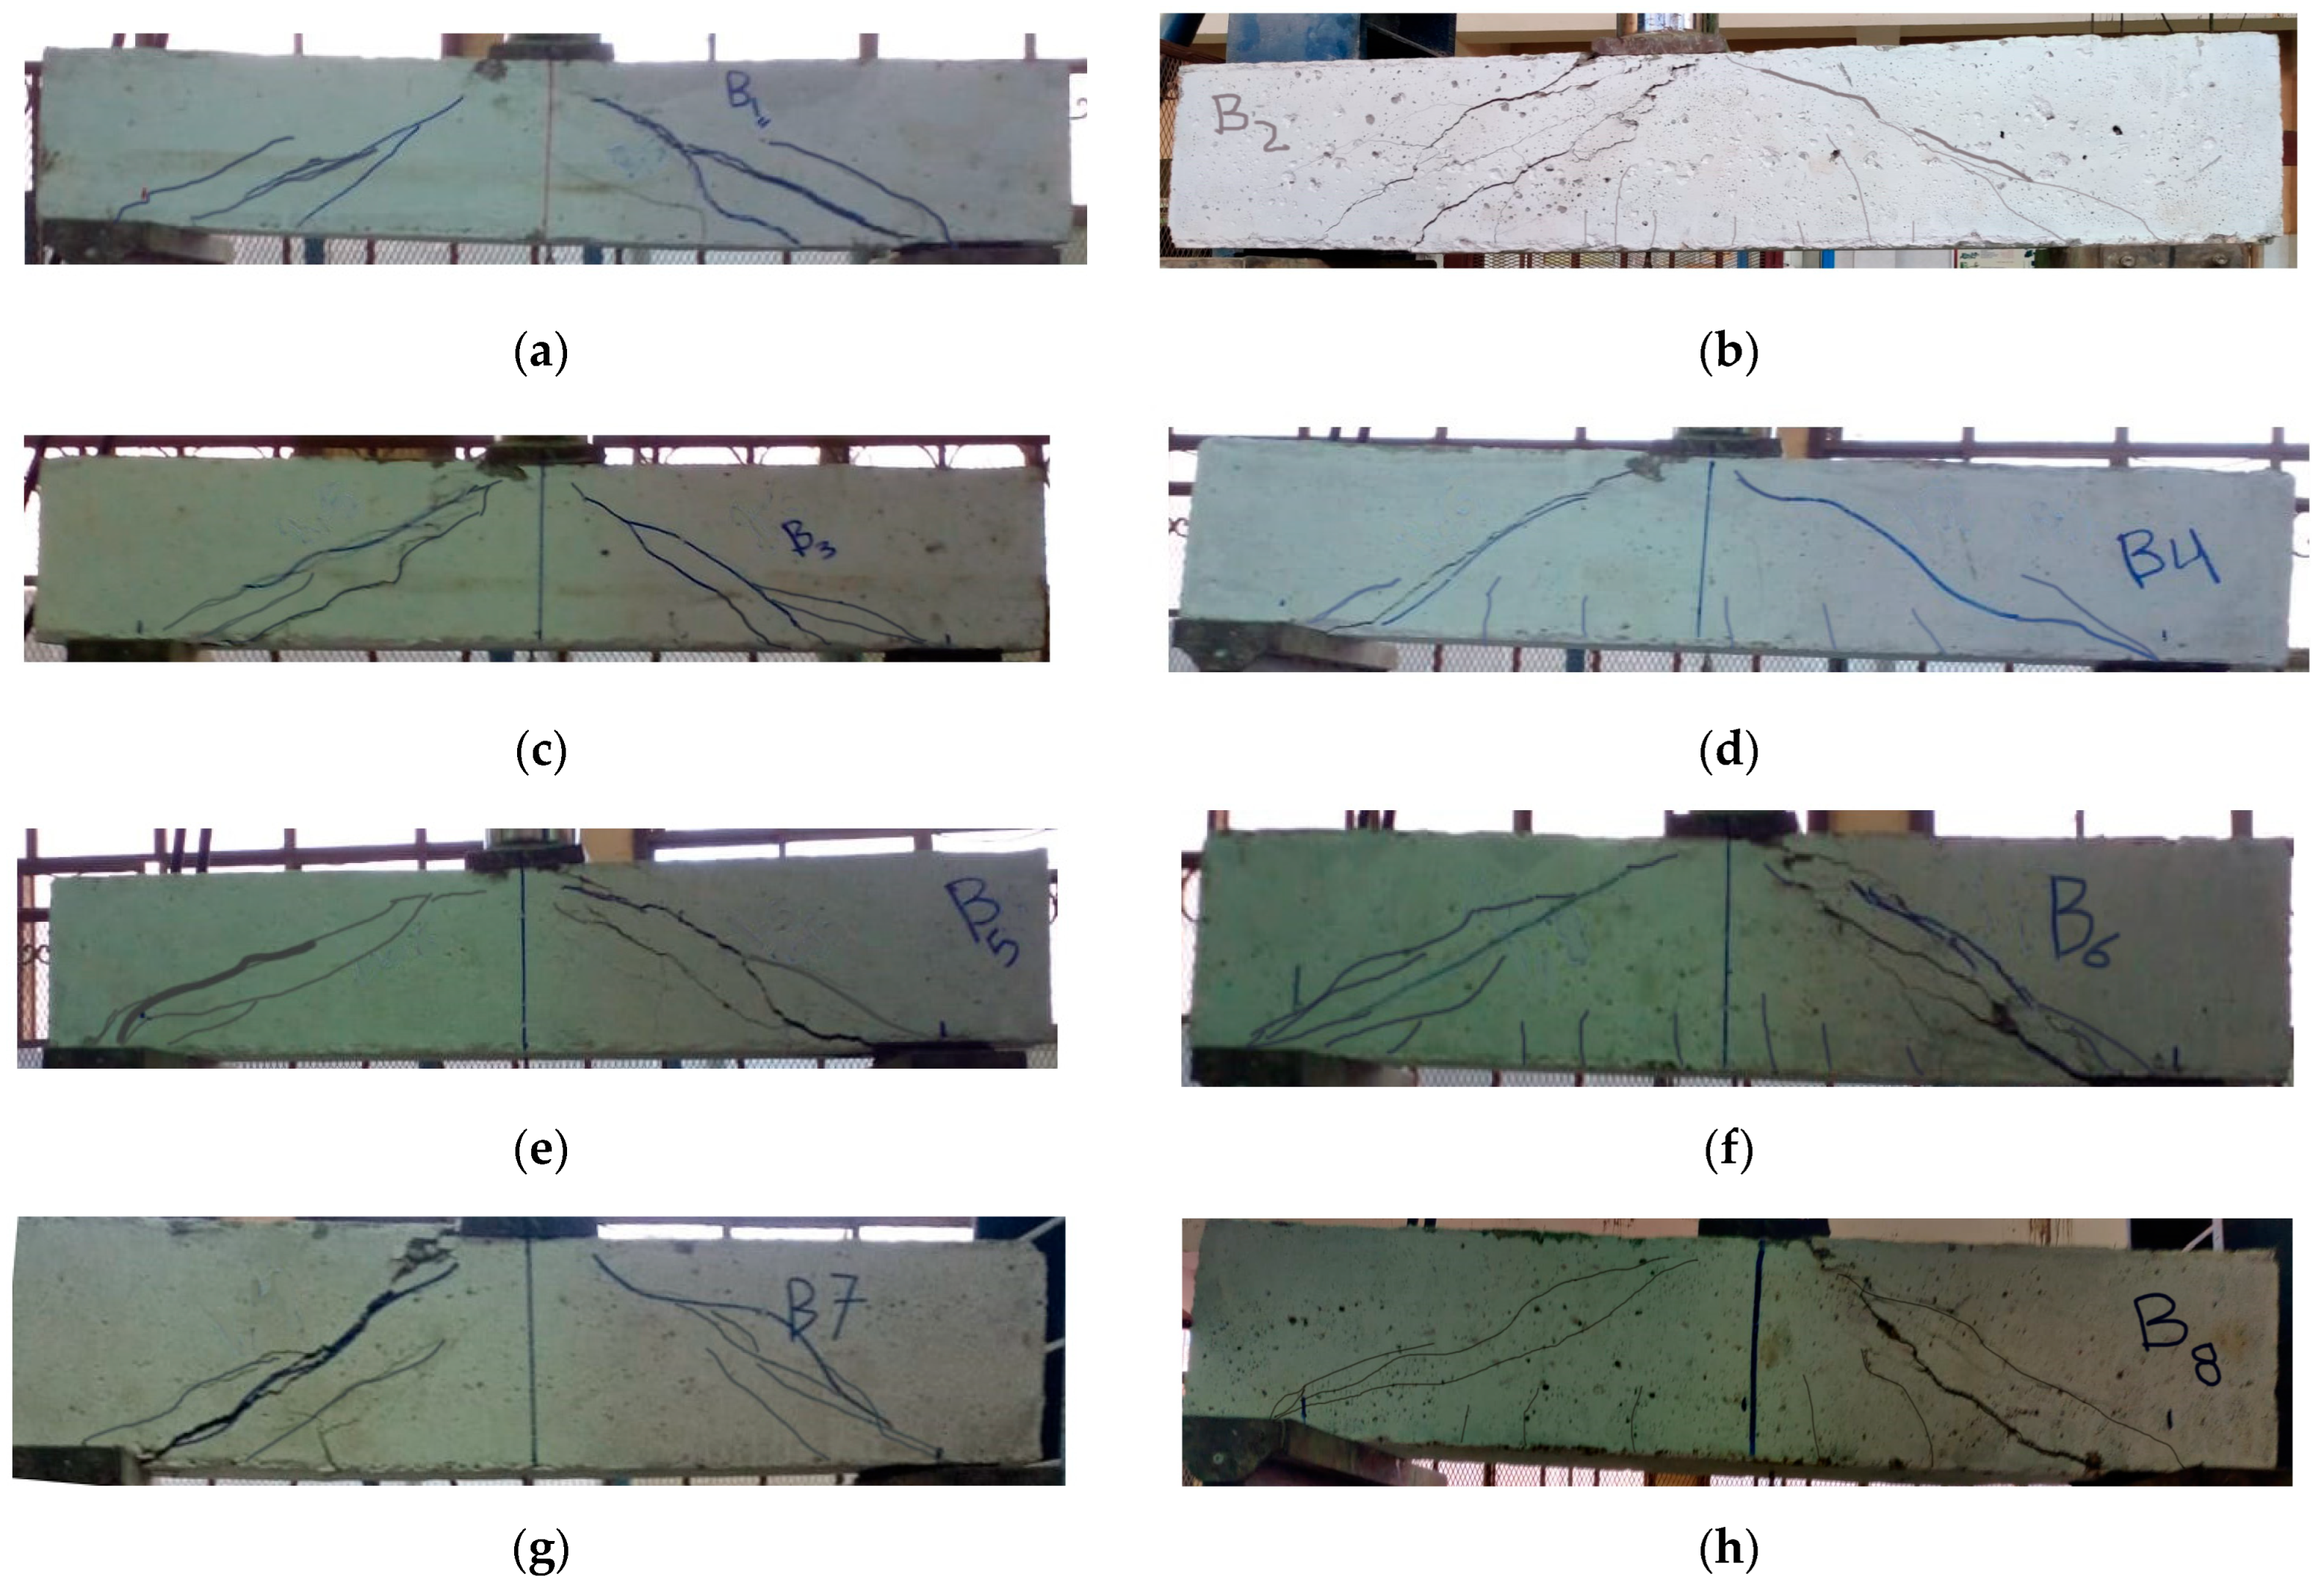
6.1. Beams Crack Patterns
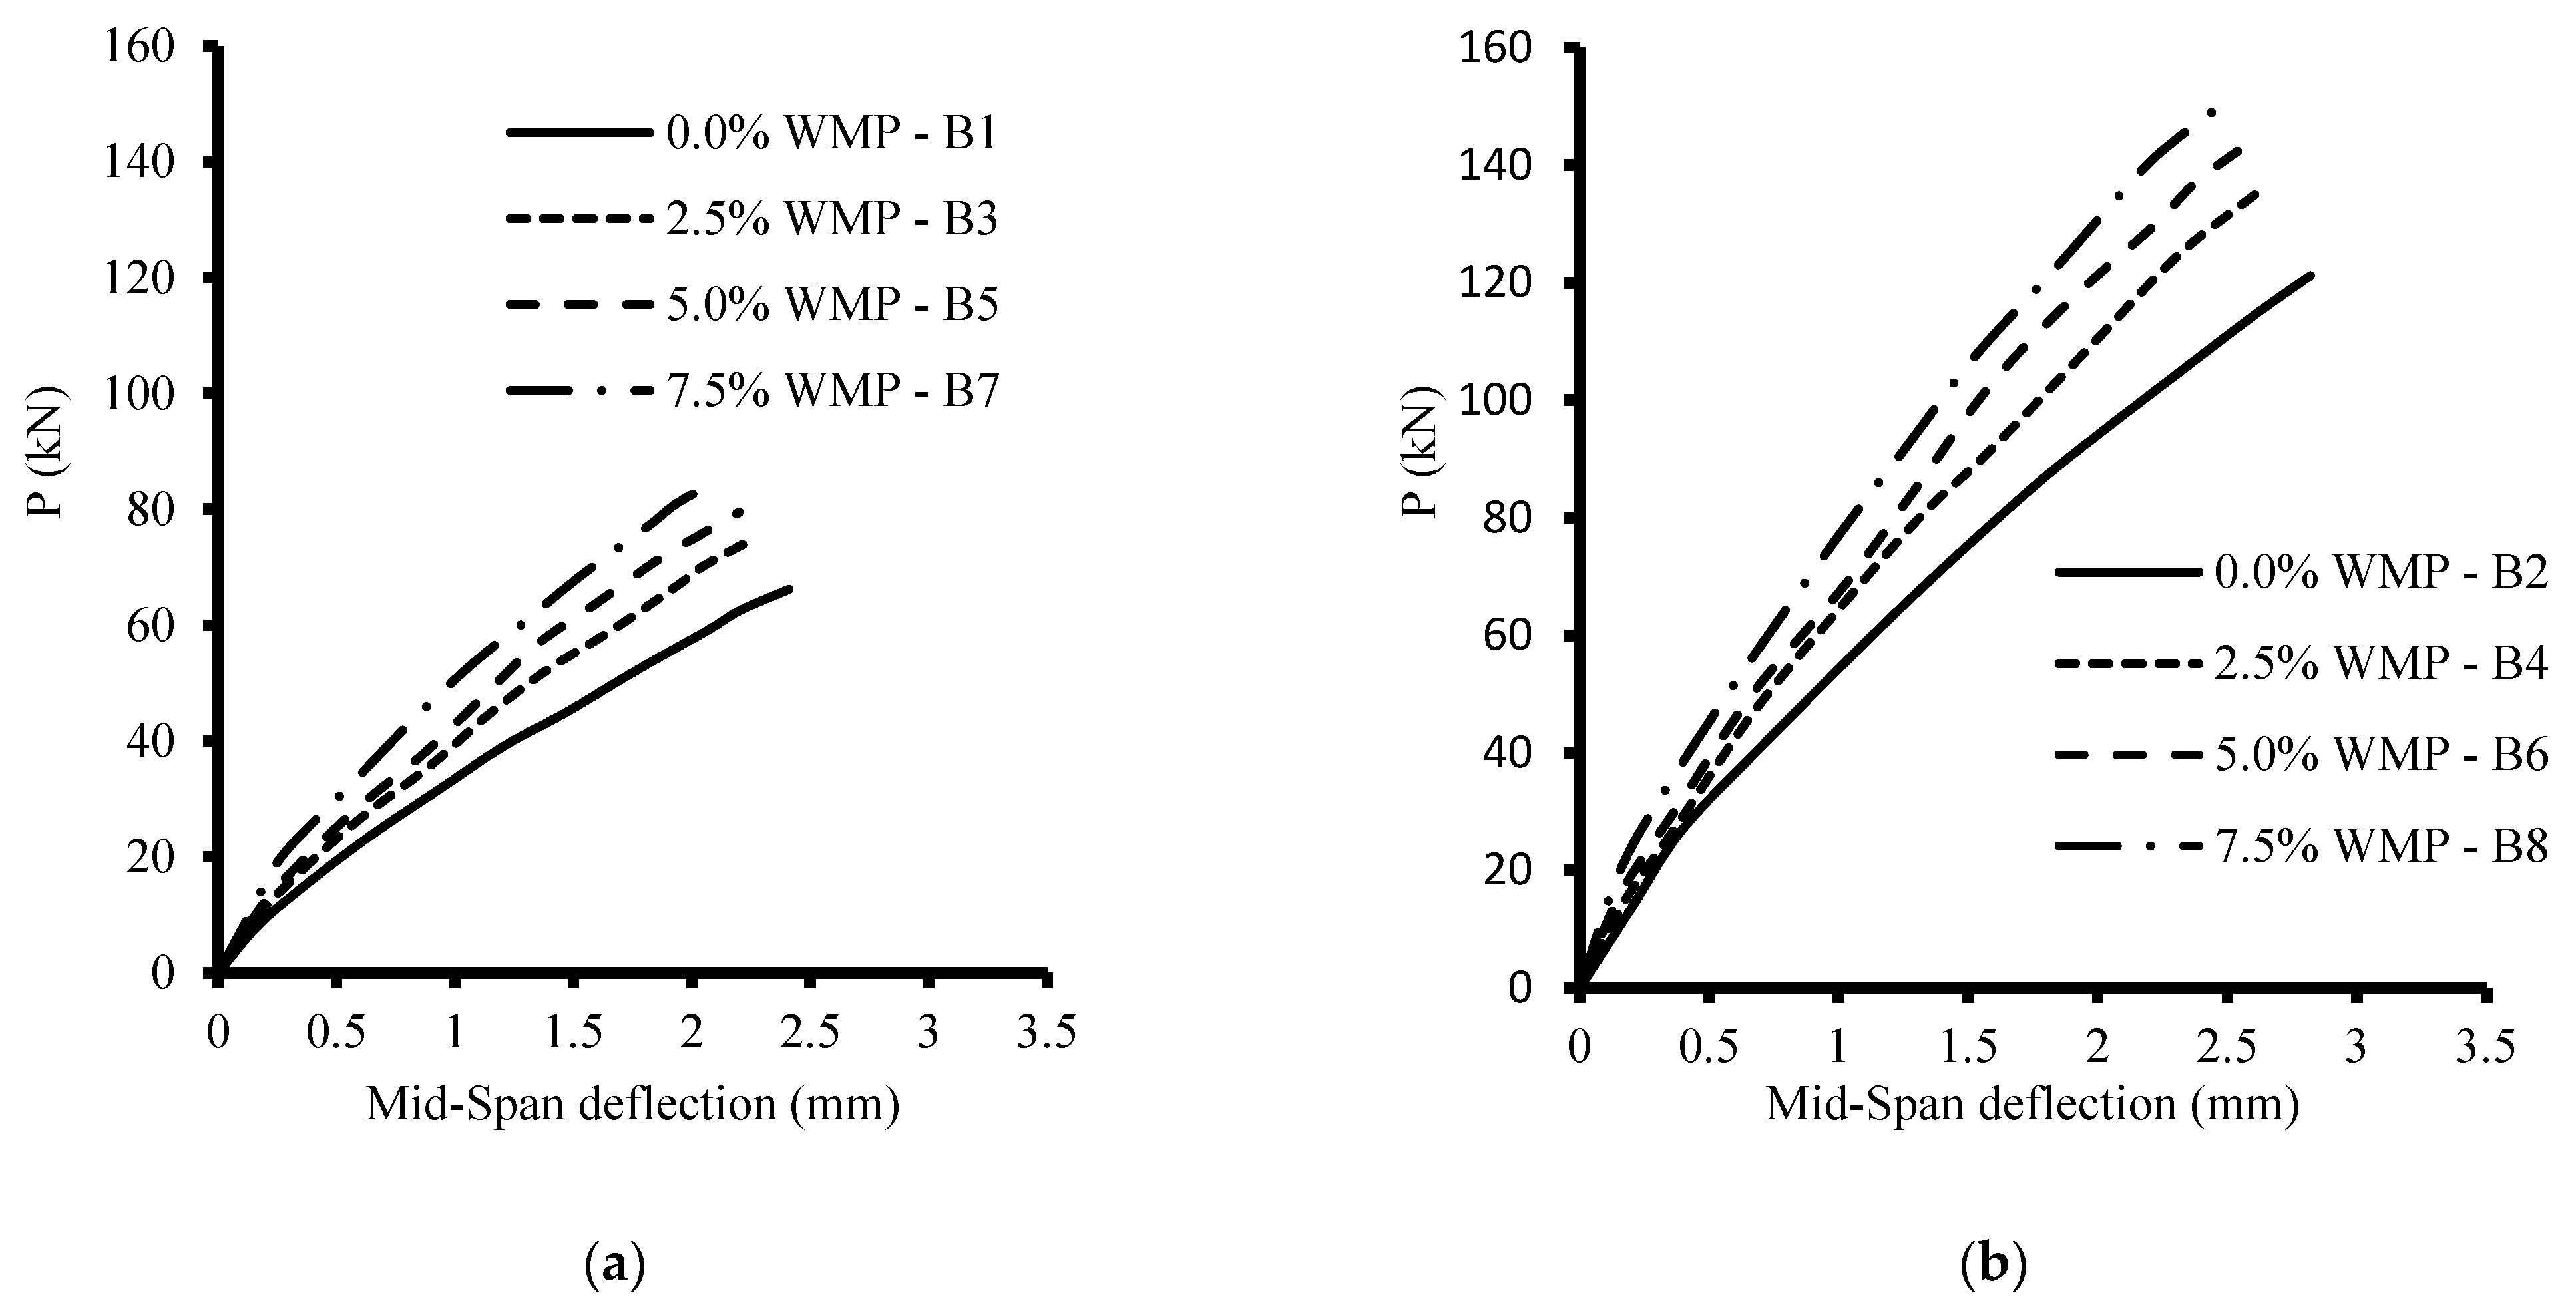
6.2. Loads vs. Vertical Deflections
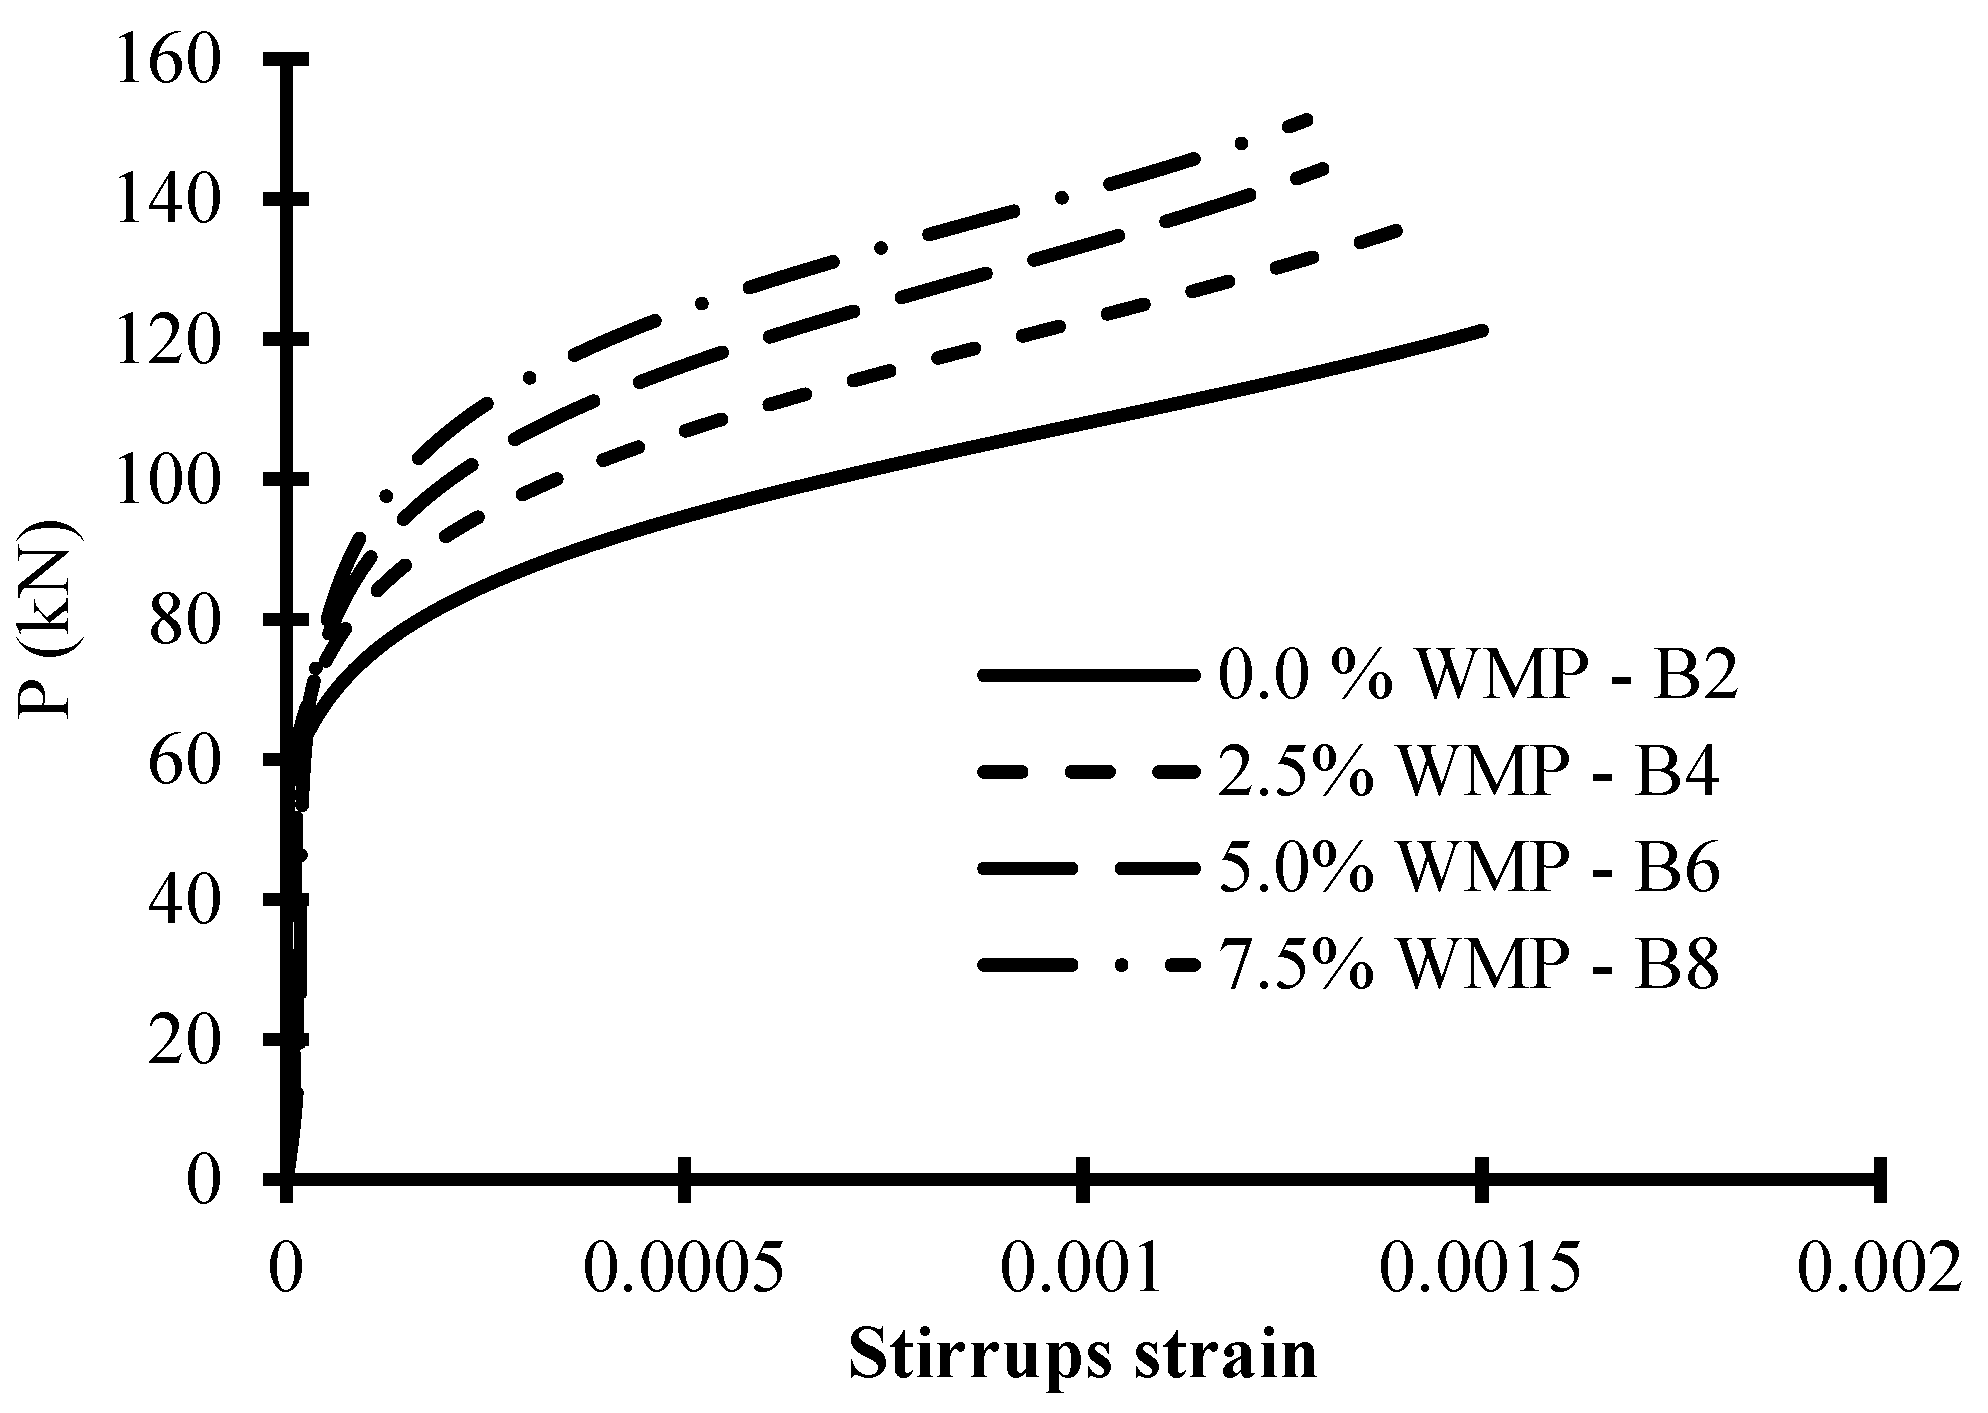
6.3. Stirrups Strains
7. Code Provisions
7.1. ACI 318-19
7.2. ECP 207
8. Test Results and Code Predictions Comparison
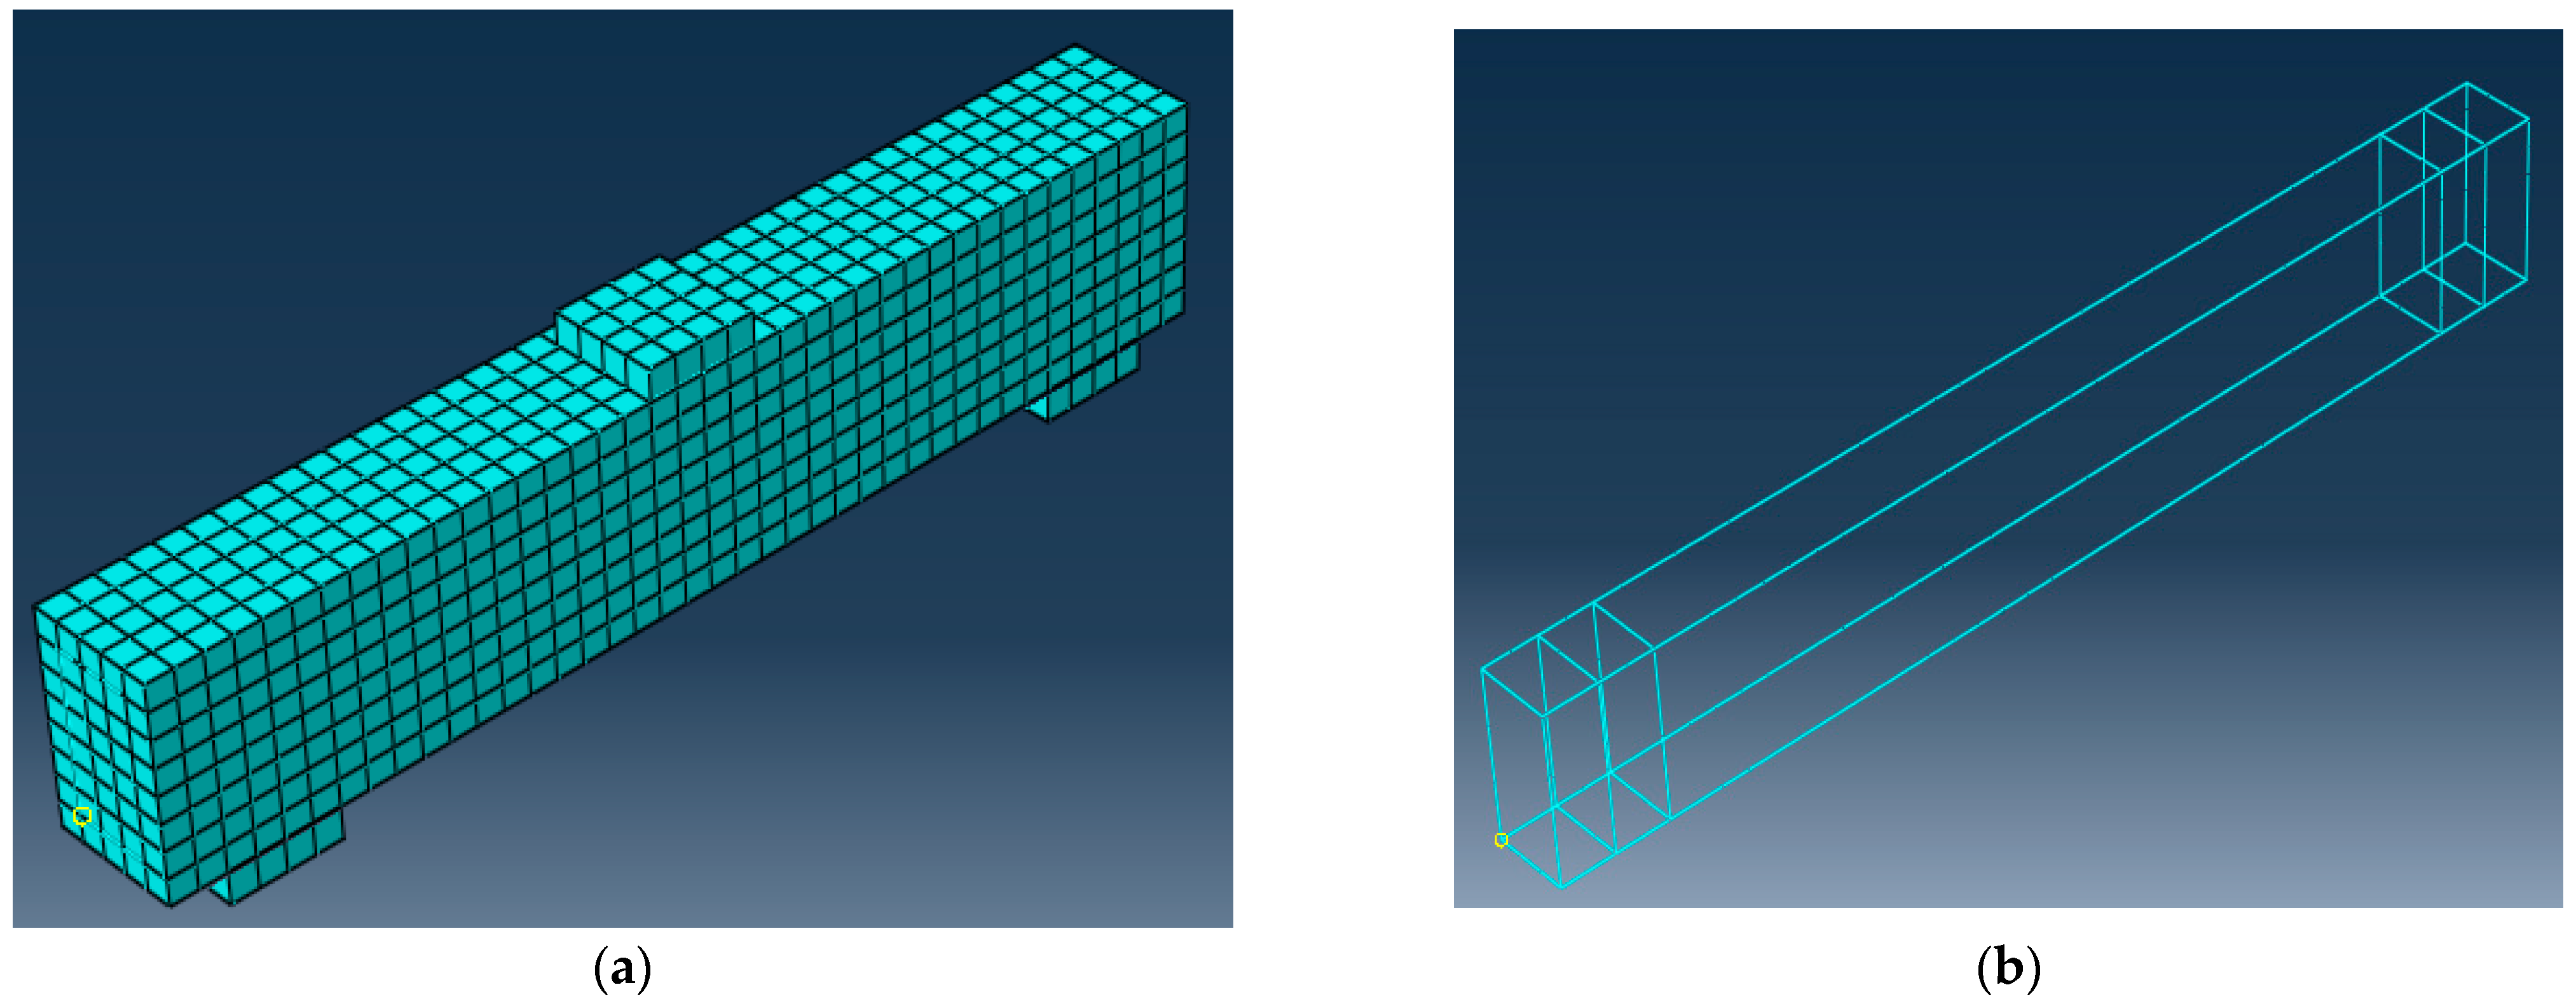
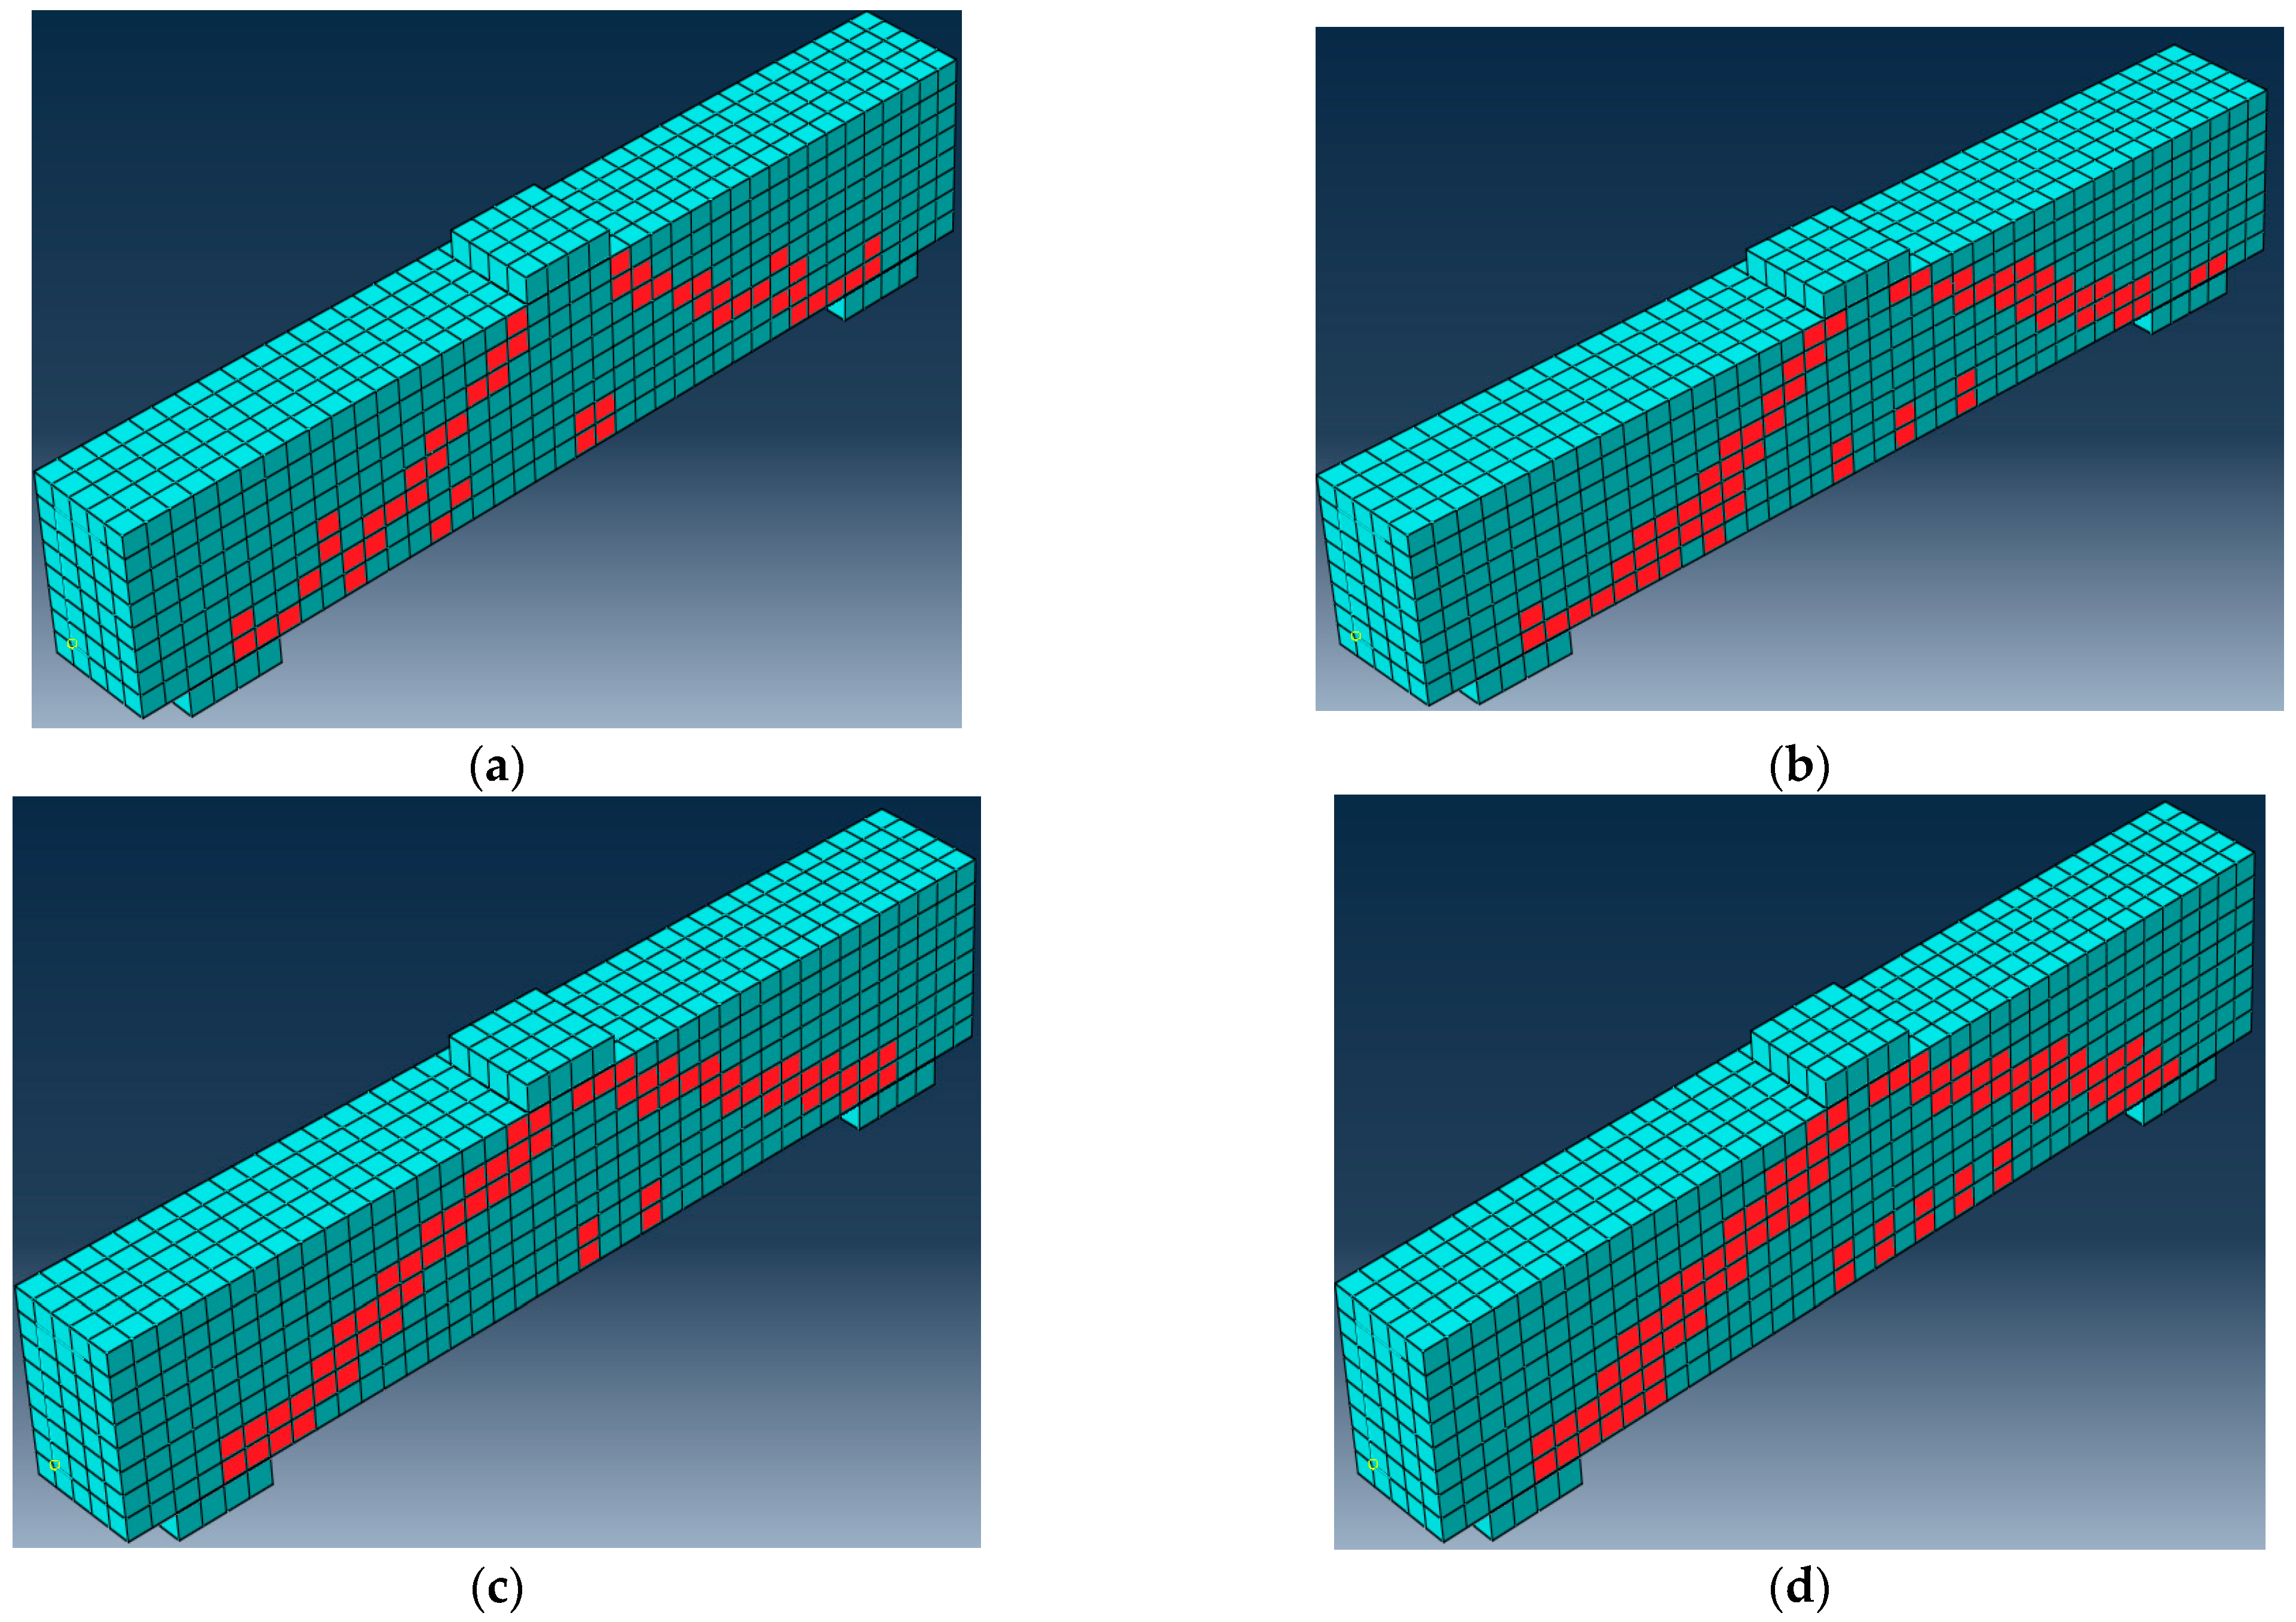
9. Finite Element Modeling
9.1. Material Nonlinearity
9.2. Types of Elements
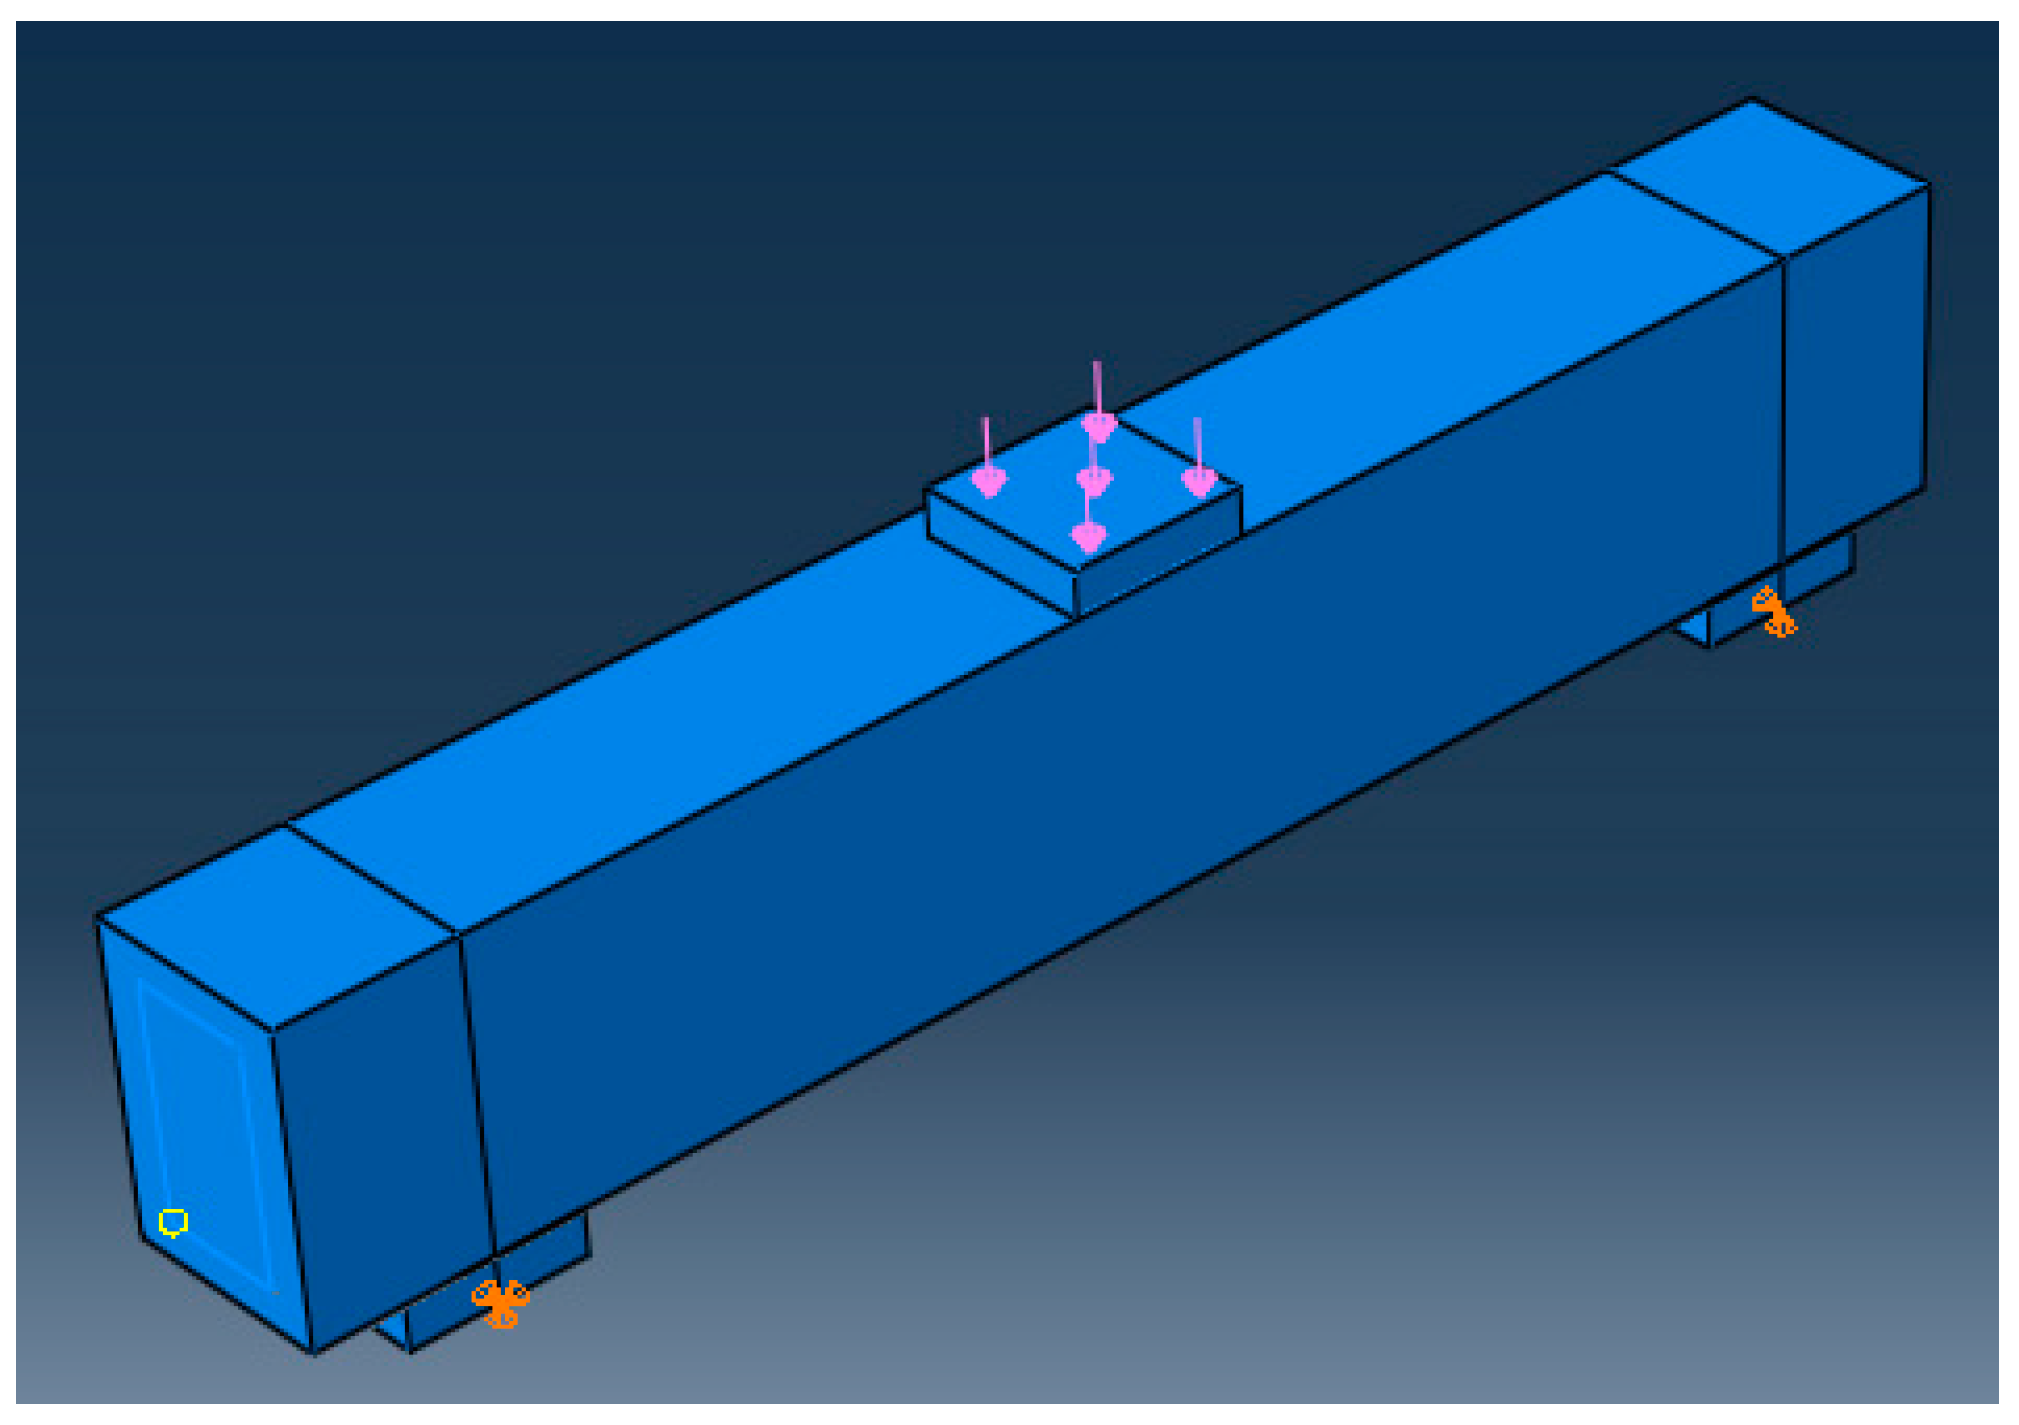
9.3. Loading and Boundaries Conditions
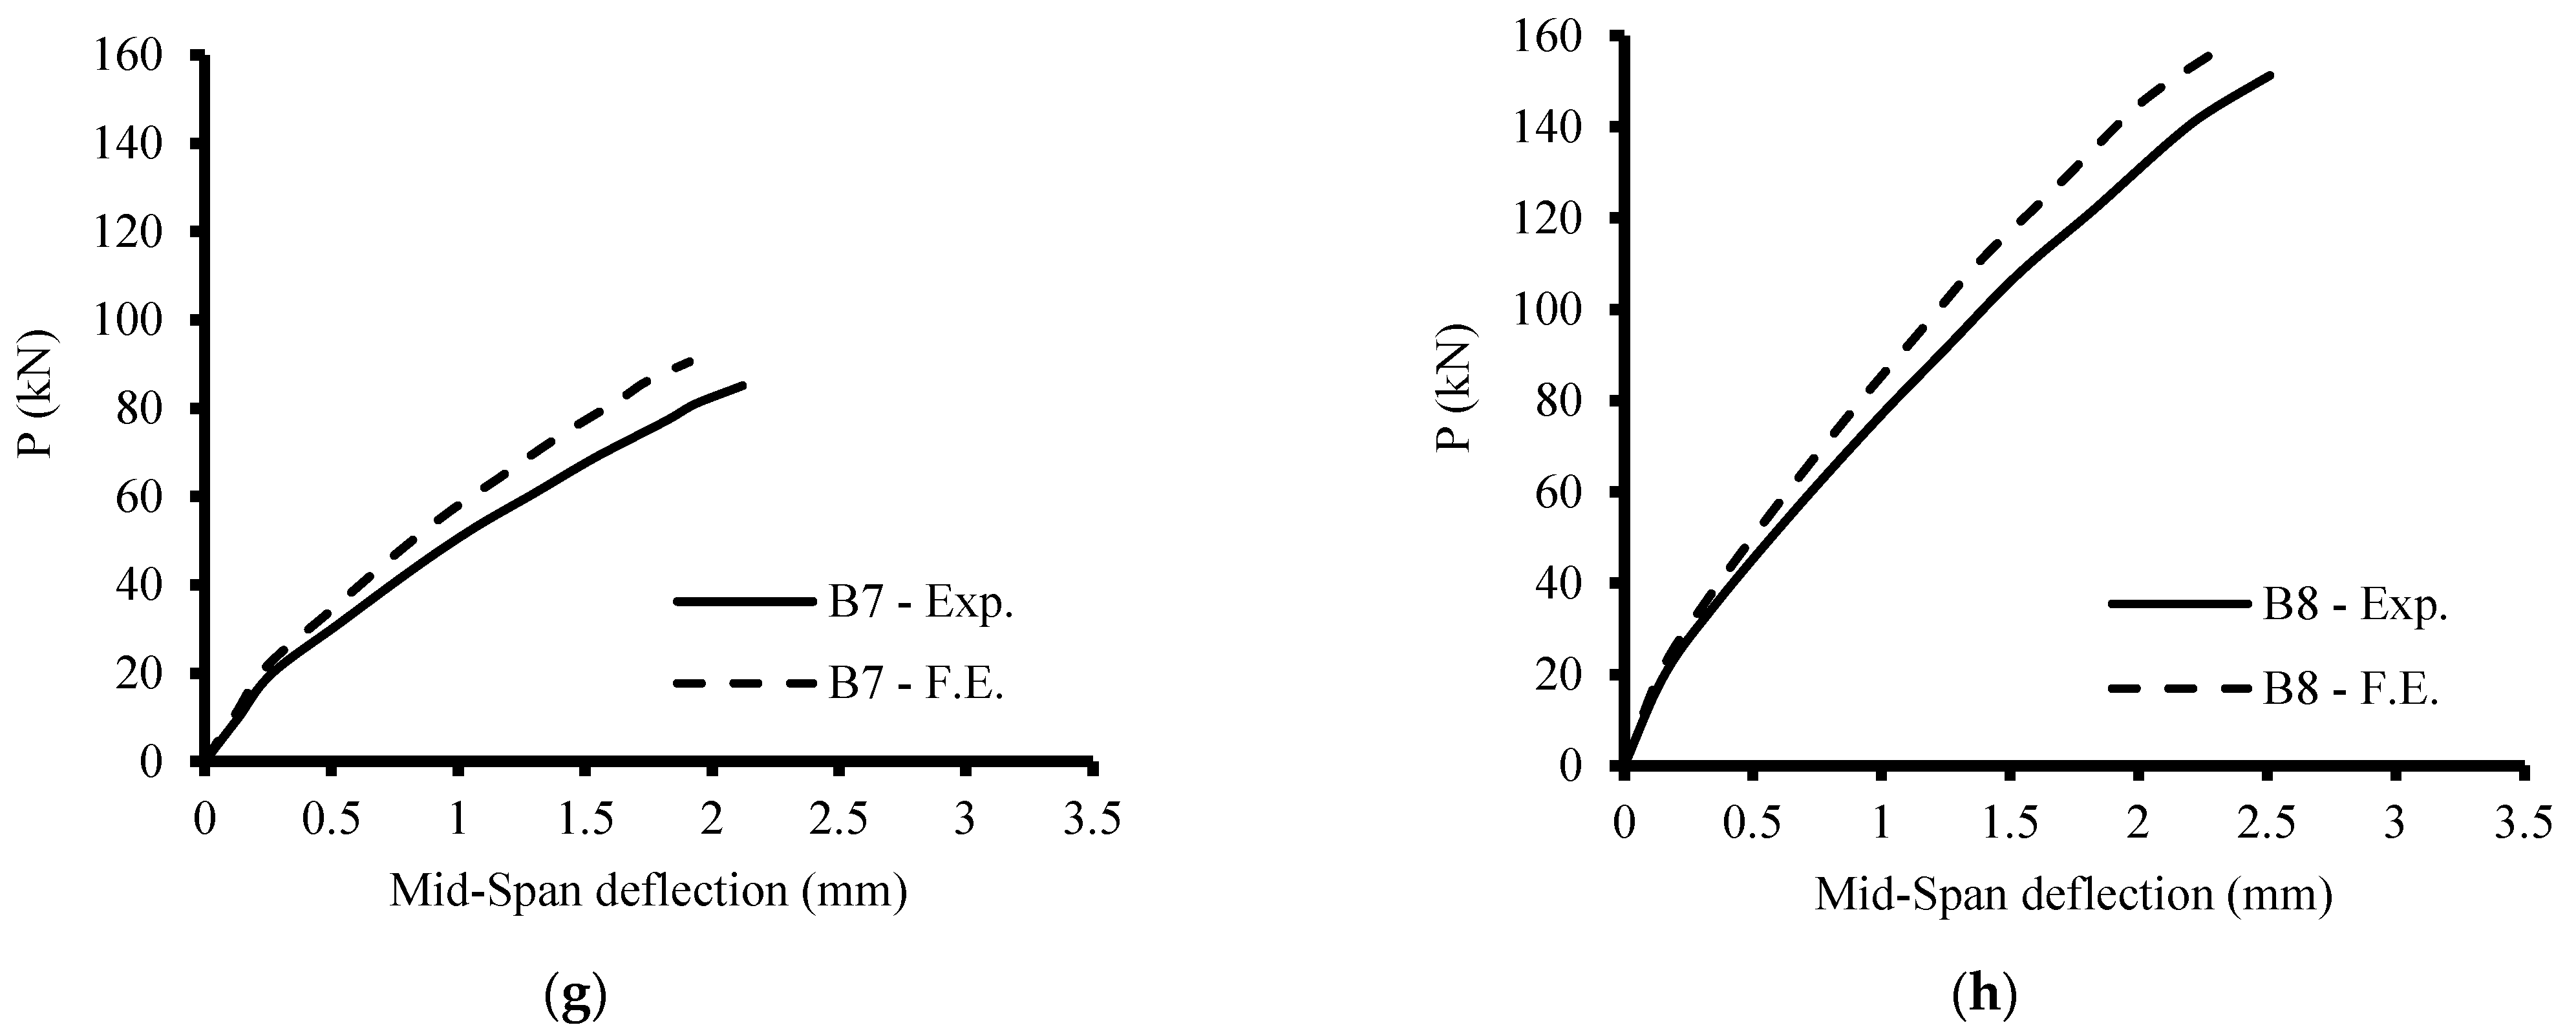
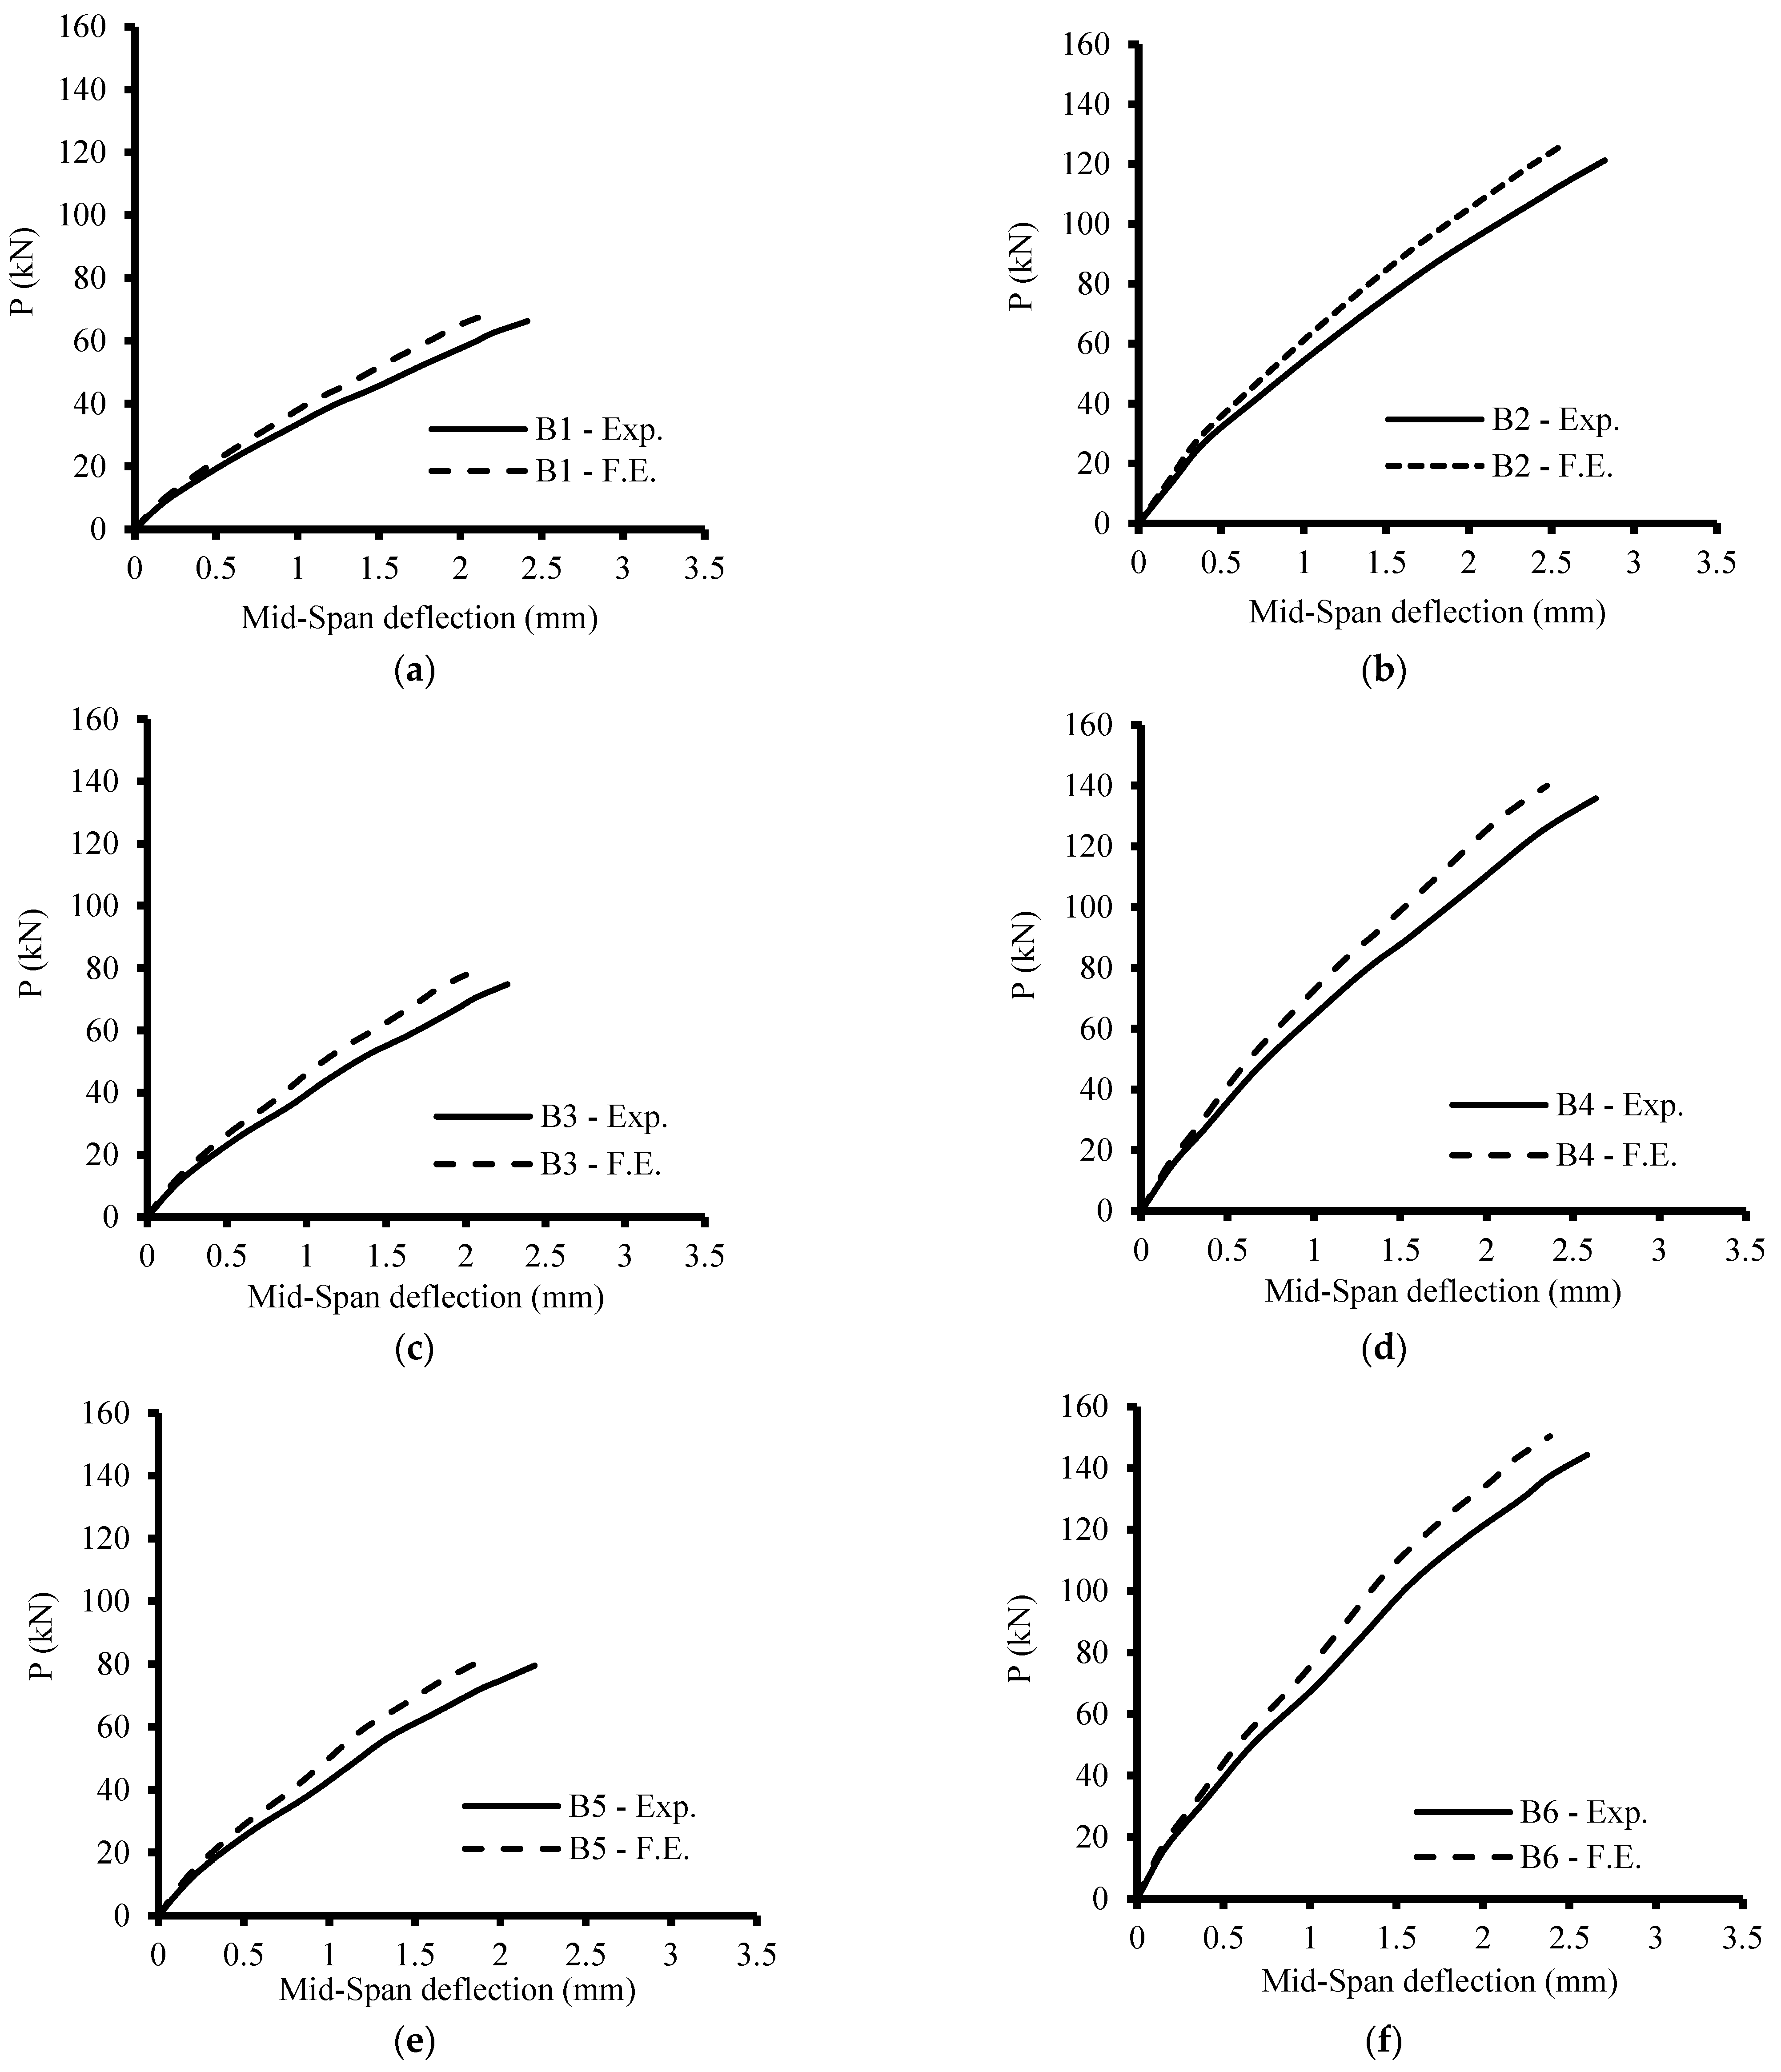
10. Comparison of the Experimental and Finite Element Findings
11. Conclusions
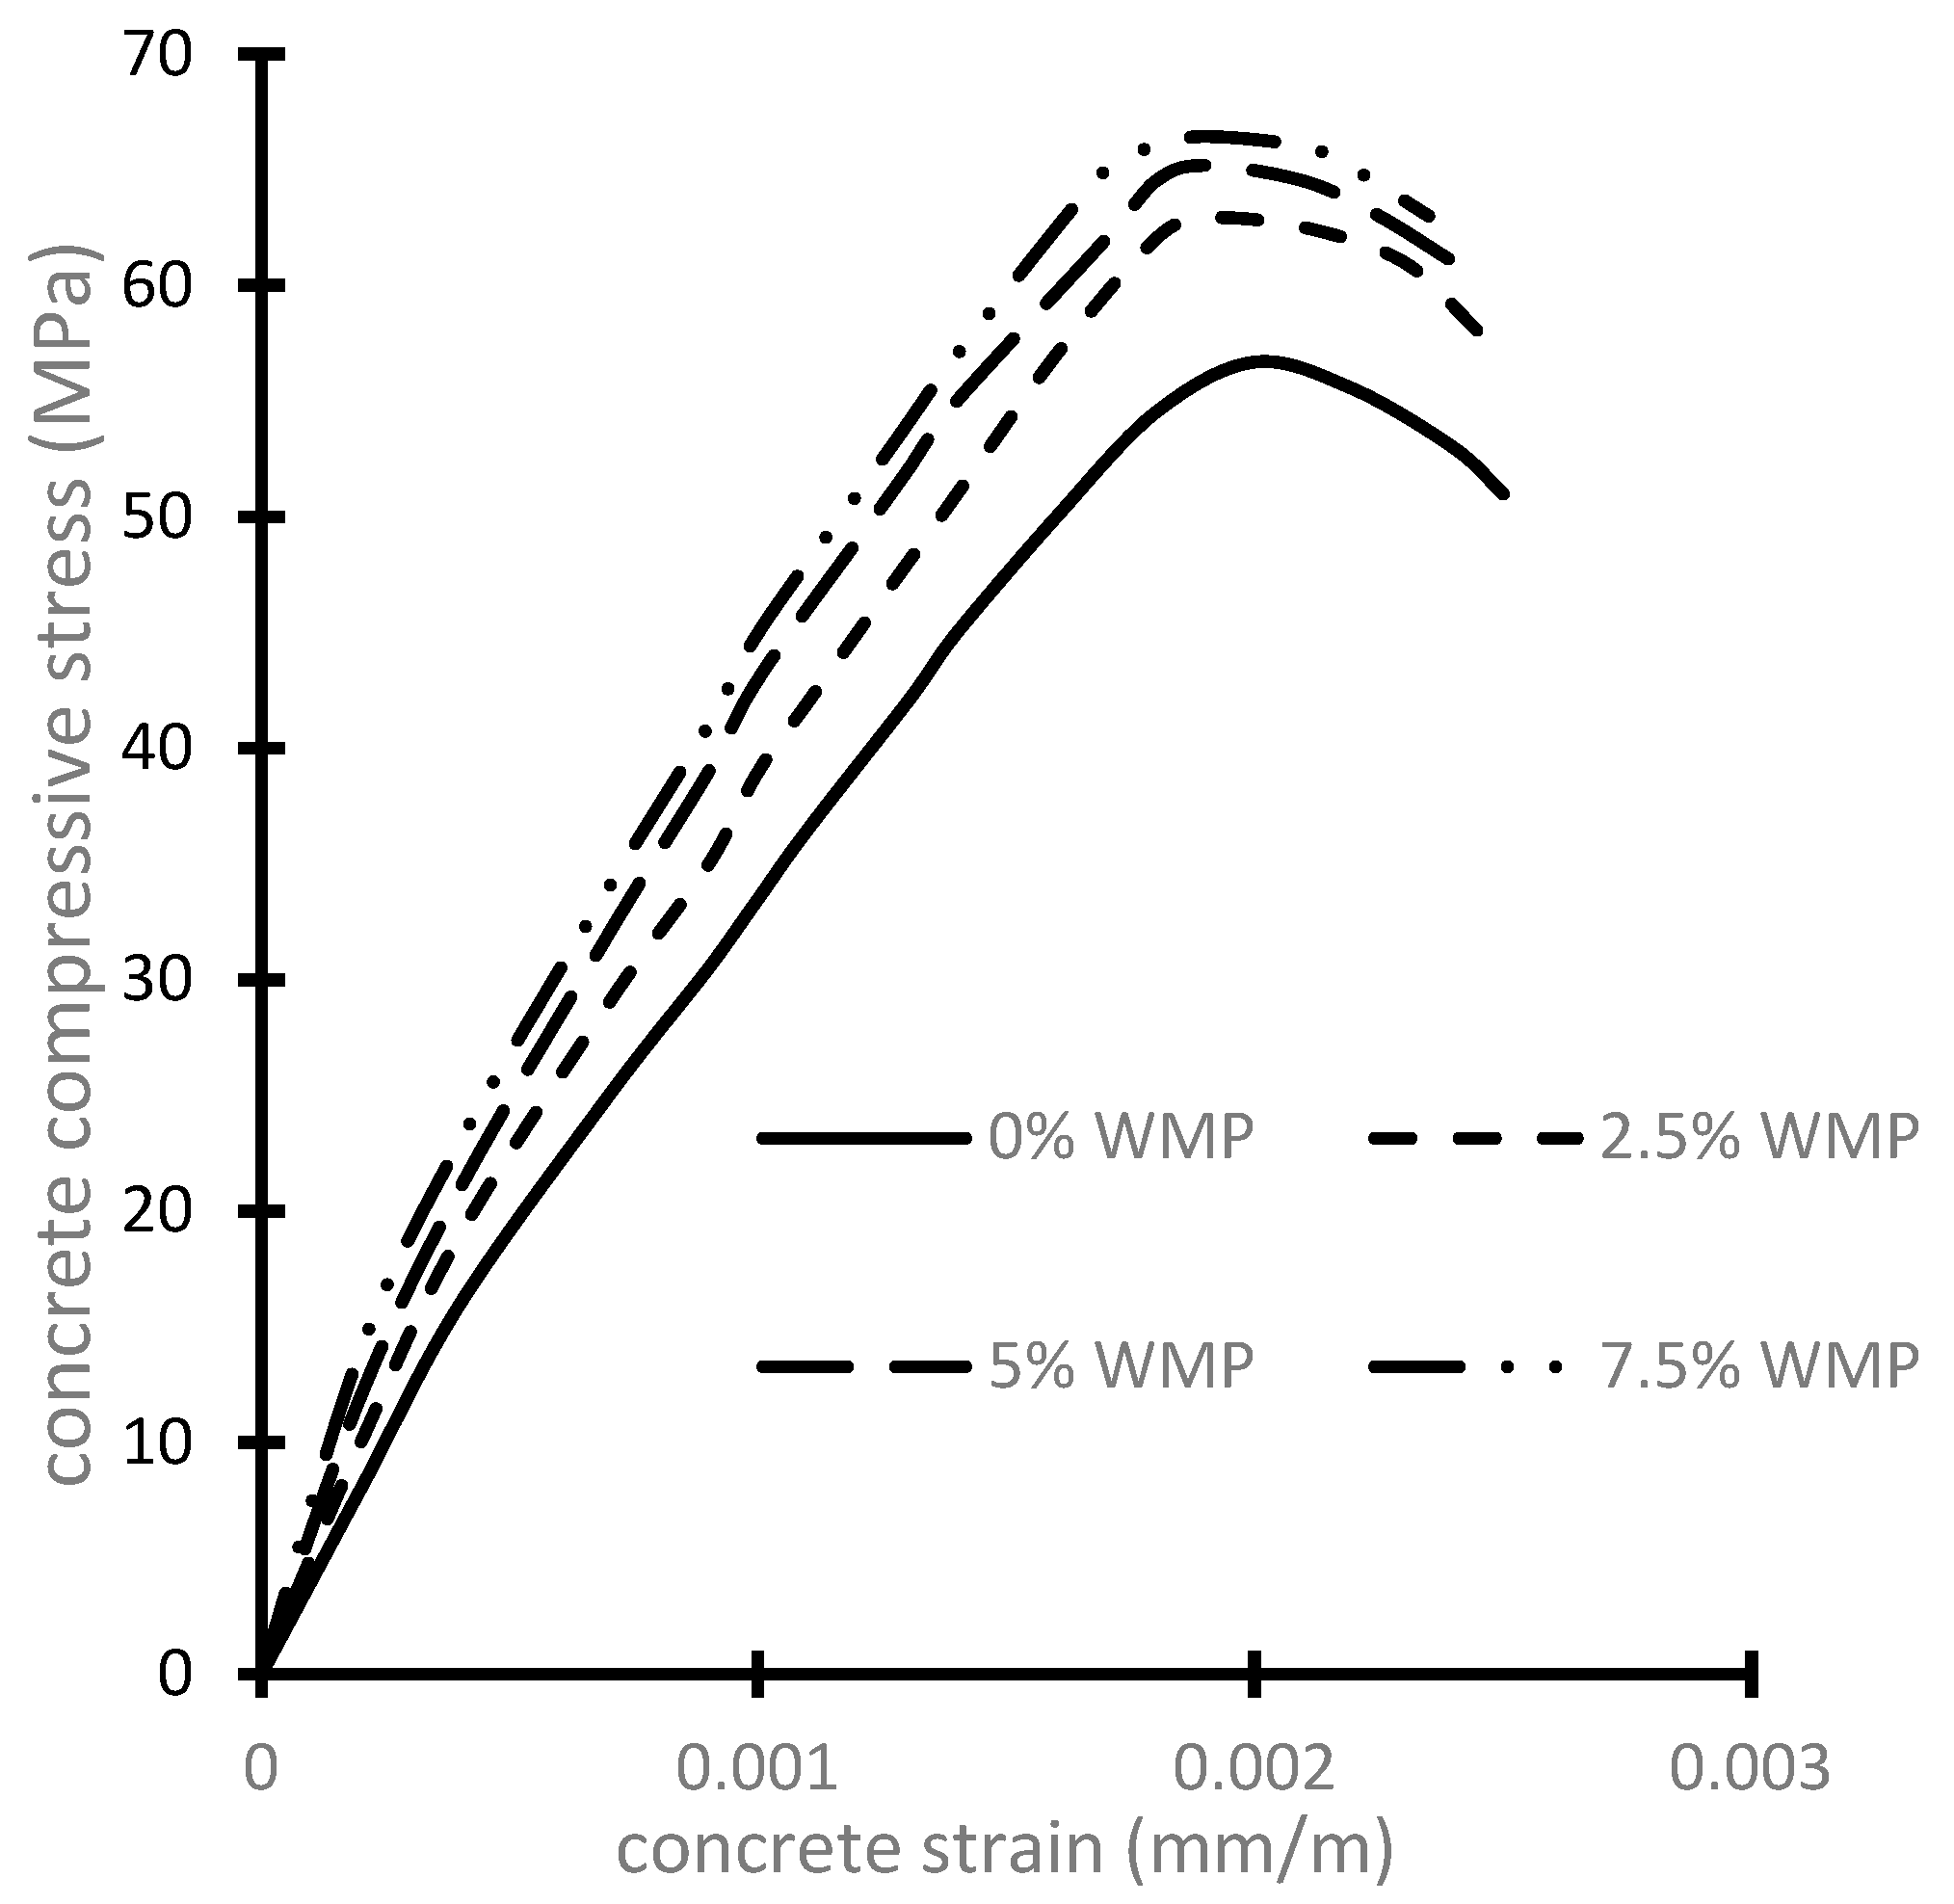
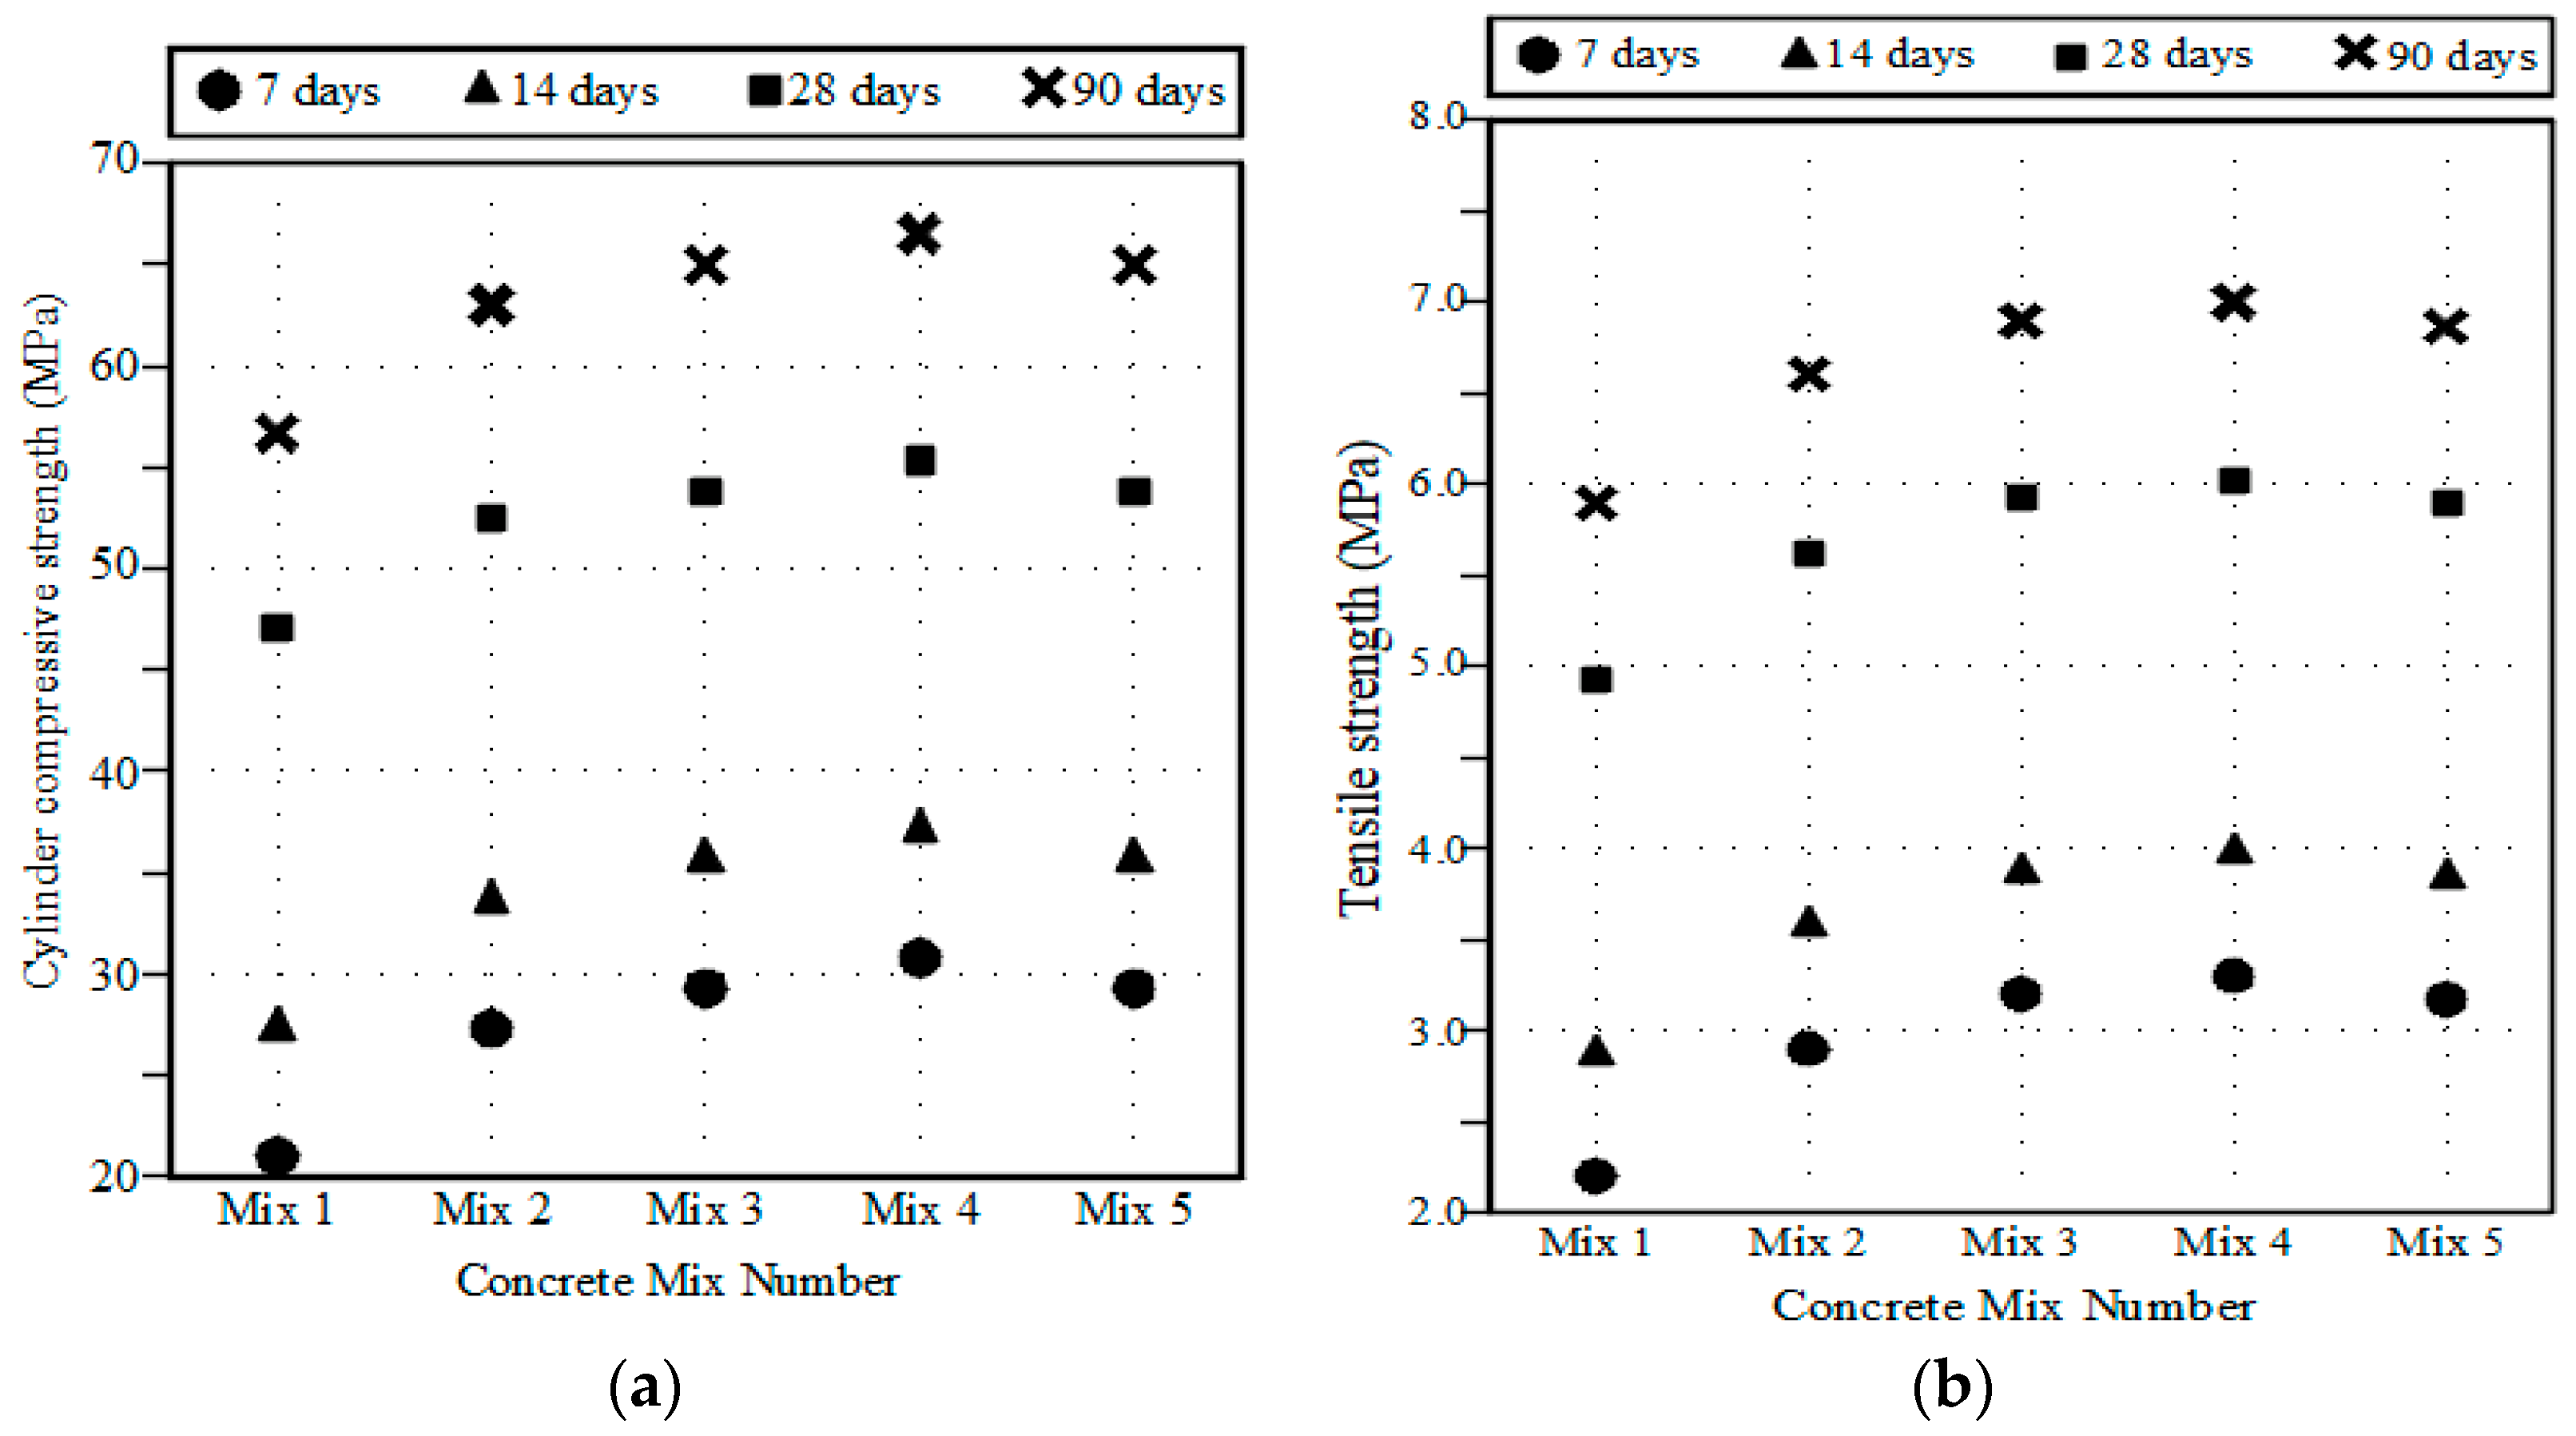
- Increasing the WMP ratio from 0% to 2.5%, 5%, and 7.5% led to an increase in the concrete compressive strength by about 11%, 15%, and 17%, respectively. In addition, the concrete tensile strength was increased by 13%, 17%, and 19% at the same WMP ratios.
- The increase in the WMP ratio resulted in a roughly decreased crack number, increased crack spacing, and decreased crack width.
- Increasing the WMP ratio from 0% to 2.5%, 5%, and 7.5% increased Pu by about 13%, 20%, and 28%, respectively, for beams without stirrups, while for beams with stirrups, the ultimate load improved by 12%, 19%, and 25%, respectively.
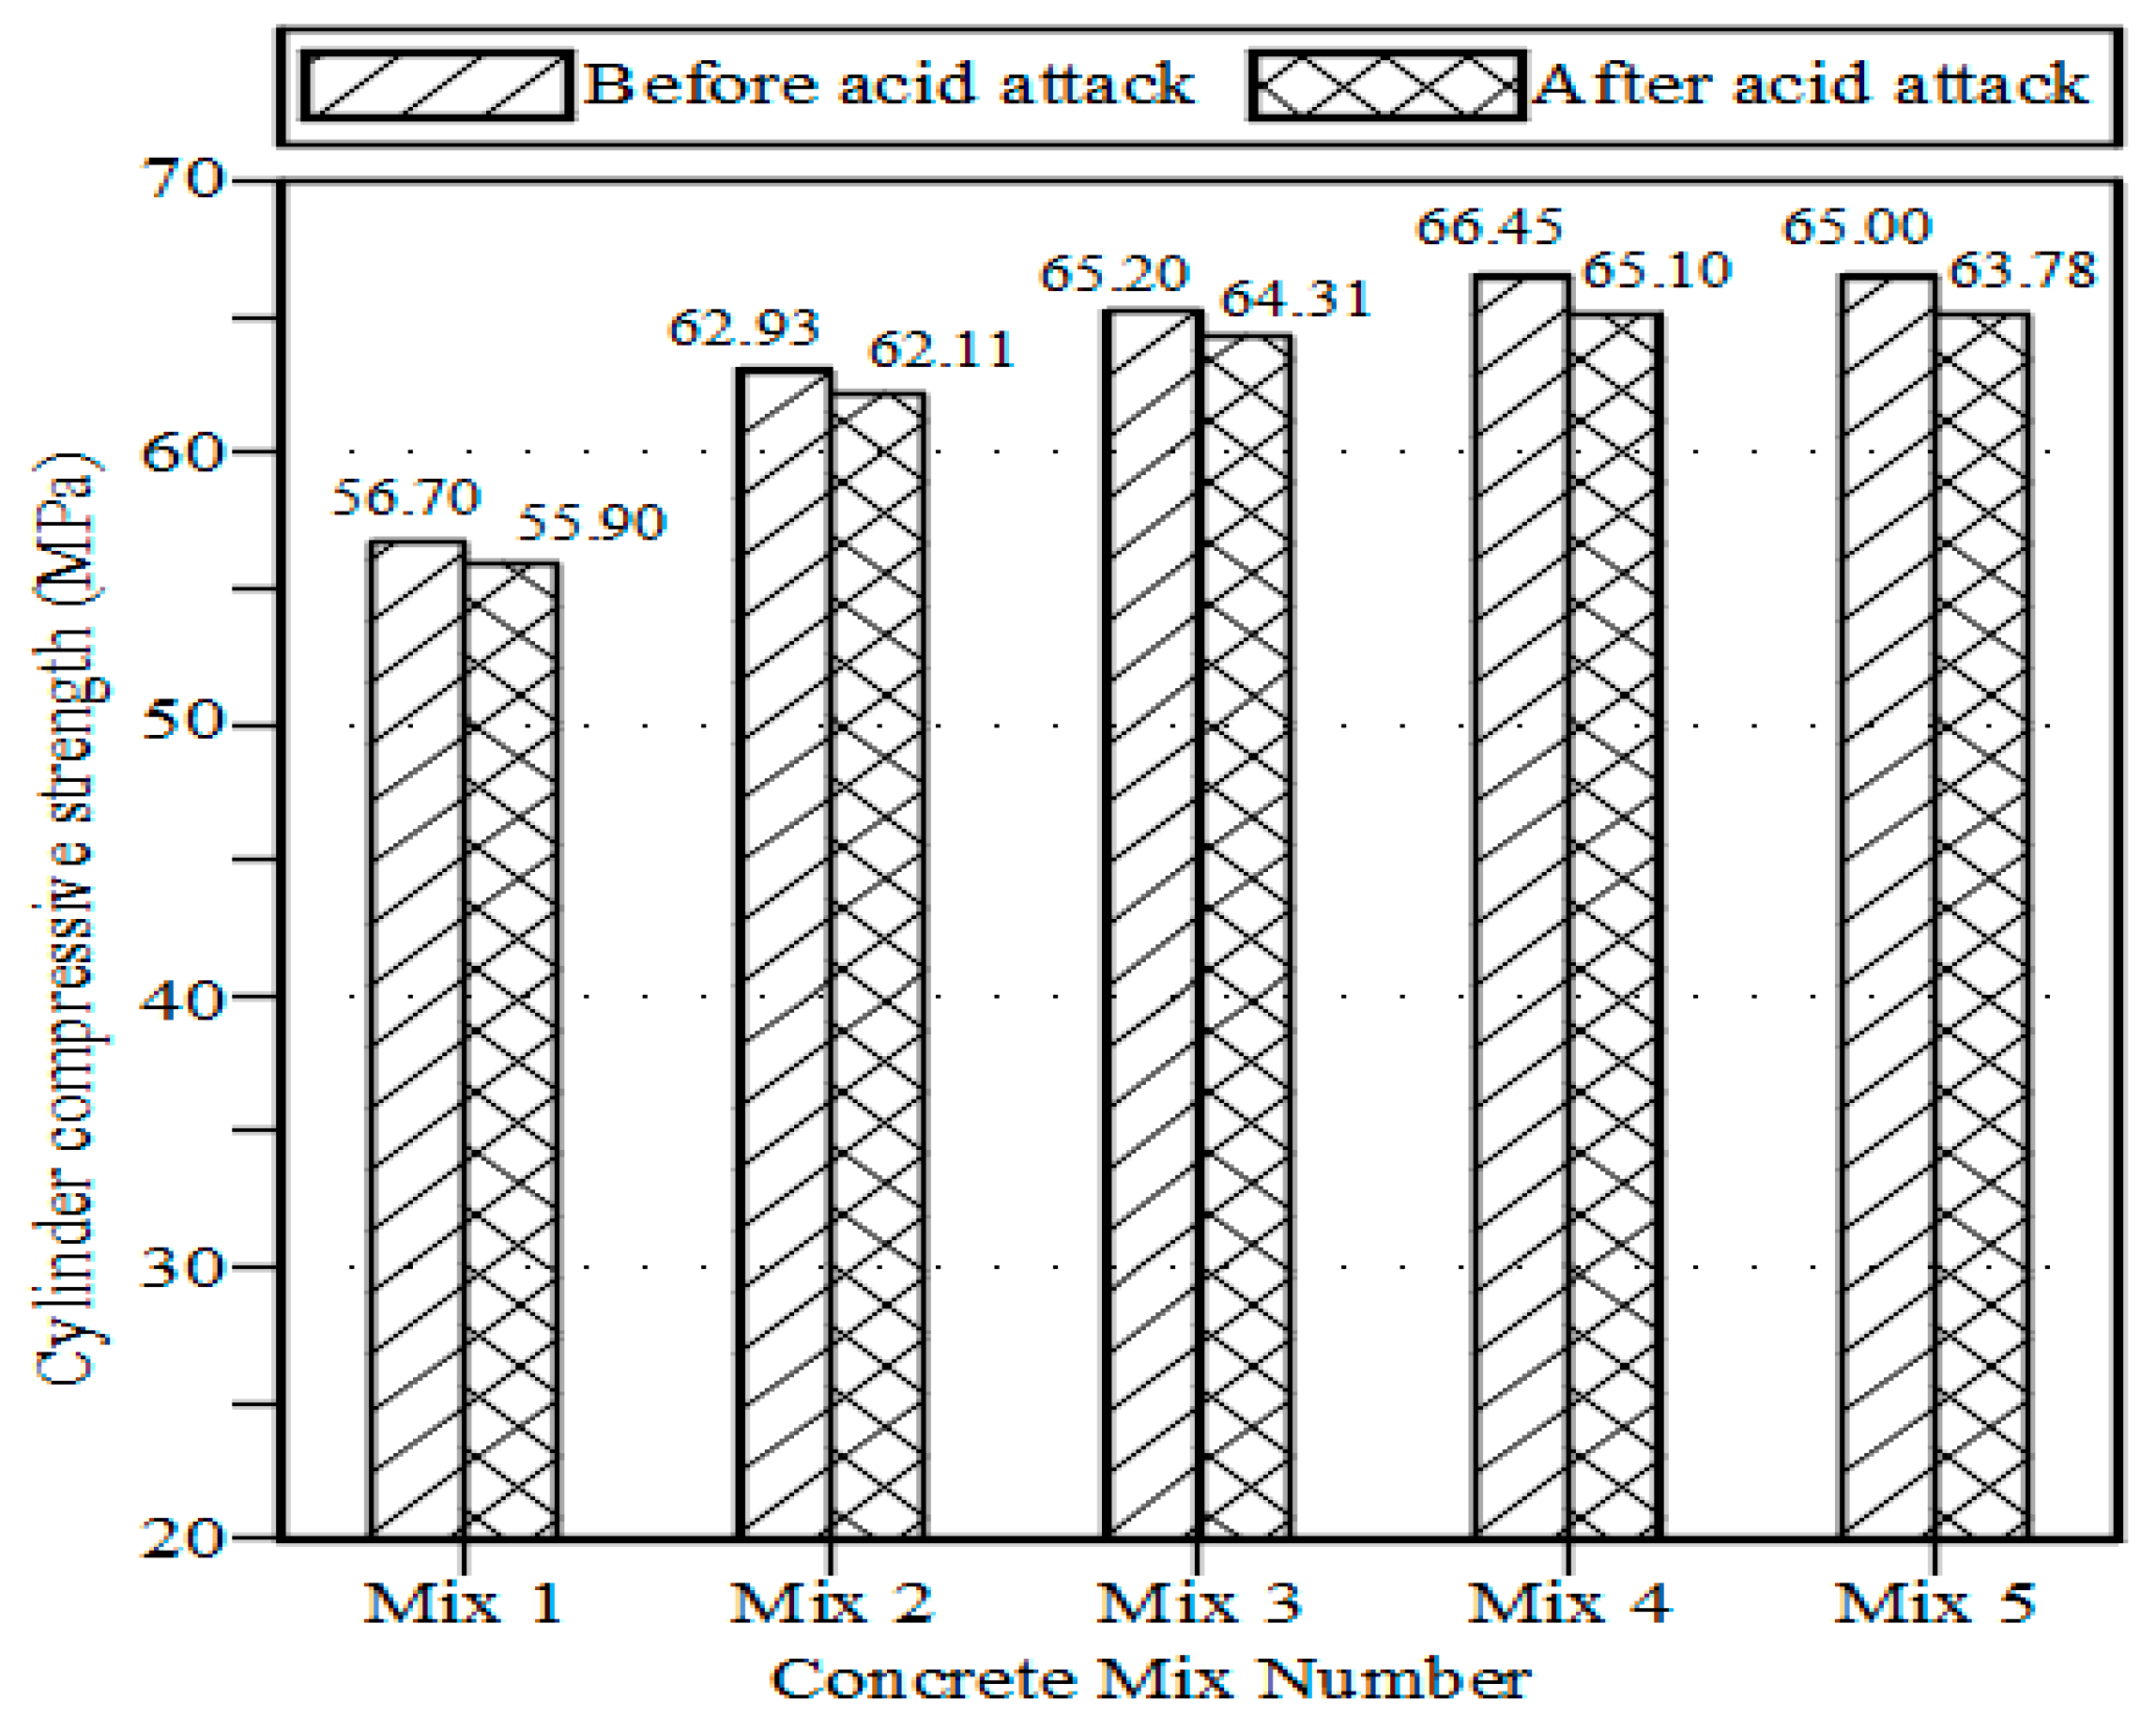
- When tested specimens were exposed to acid attack, there were slight losses in weight and compressive strength (1.25% to 2.47%) for both with and without the addition of WMP.
- Both the concrete with and without WMP showed the same level of water absorption.
- For stirrup-equipped specimens, raising the WMP ratio from 0% to 2.5%, 5.0%, and 7.5% resulted in a decrease in the stirrup strain of about 16%, 22%, and 27%, respectively.
- The average values of the ratios between the experimentally measured shear failure force and those derived from ACI 318-19 and ECP 207 were 1.40 and 1.59, respectively, indicating that the ECP Code is more conservative when designing shear than the ACI Code.
- The average ratio of the experimental to the FE ultimate load was 0.96, while the average ratio of the experimental to the FE mid-span displacement was 1.11. This indicates that the experimental findings and FE simulations were in good agreement.
Author Contributions
Funding
Institutional Review Board Statement
Informed Consent Statement
Data Availability Statement
Conflicts of Interest
Nomenclature
| As | the area of the main bottom steel reinforcement bars in tension |
| As′ | the area of secondary top steel reinforcement bars in compression |
| Av | the shear reinforcement area |
| a | shear span |
| b | breadth of the beam cross section |
| d | effective depth of the beam cross section |
| dc | concrete damaged plasticity material model’s stiffness degradation coefficients for compression |
| dt | concrete damaged plasticity material model’s stiffness degradation coefficients for tension |
| Es | Young steel modulus |
| fcu | concrete cube compressive strength |
| fc′ | concrete cylinder compressive strength |
| ft | concrete tensile strength |
| fy | yield stress of the main reinforcing bars |
| fys | the stirrups yield stress |
| fbo/fco | the ratio of initial equibiaxial compressive yield stress to initial uniaxial compressive yield stress |
| K | The ratio of the second stress invariant on the tensile meridian |
| P | applied load |
| Pcr | cracking load |
| Pu | ultimate failure load |
| s | the spacing between vertical stirrups |
| t | total depth of the beam cross section |
| Vc | concrete shear force capacity |
| Vs | stirrups shear force capacity |
| Vu | total beam shear force capacity |
| Vu ACI | beam shear capacity according to ACI 318-19 |
| Vu ECP | beam shear capacity according to ECP 207 |
| Vu exp. | beam experimental shear capacity |
| ε | concrete tensile strain |
| εt | concrete tensile strain at the peak stress ft |
| Δu | maximum mid-span deflection |
| ρv | vertical stirrups ratio |
| λ | Factor taken as 1.0 for normal-weight concrete according to ACI 318-19 |
| γc | strength reduction factor for concrete and equal to 1.50 according to ECP 207 |
| σt | concrete tensile stress |
| v | Poisson’s ratio |
References
- Alyamac, K.E.; Ince, R. A preliminary concrete mix design for SCC with marble powders. Constr. Build. Mater. 2009, 23, 1201–1210. [Google Scholar] [CrossRef]
- Valeria Corinaldesi, V.; Moriconi, G.; Naik, T.R. Characterization of marble powder for its use in mortar and concrete. Constr. Build. Mater. 2010, 24, 113–117. [Google Scholar] [CrossRef]
- Soliman, N.M. Effect of using Marble Powder in Concrete Mixes on the Behavior and Strength of R.C. Slabs. Int. J. Curr. Eng. Technol. 2013, 3, 1863–1870. [Google Scholar]
- Aliabdo, A.A.; Abd Elmoaty, A.M.; Auda, E.M. Re-use of waste marble dust in the production of cement and concrete. Constr. Build. Mater. 2014, 50, 28–41. [Google Scholar] [CrossRef]
- Latha, G.; Reddy, A.S.; Mounika, K. Experimental Investigation on Strength Characteristics of Concrete Using Waste Marble Powder as Cementitious Material. Int. J. Innov. Res. Sci. Eng. Technol. 2015, 4, 12691–12698. [Google Scholar] [CrossRef]
- Singh, J.; Bansal, R.S. Partial Replacement of Cement with Waste Marble Powder with M25 Grade. Int. J. Tech. Res. Appl. 2015, 3, 202–205. [Google Scholar]
- Singh, M.; Srivastava, A.; Bhunia, D. An investigation on effect of partial replacement of cement by waste marble slurry. Constr. Build. Mater. 2017, 134, 471–488. [Google Scholar] [CrossRef]
- Memon, F.A.; Yousfani, A.M.; Ladher, D.K.; Jarwar, N. Effect of Marble Dust as a Partial Replacement of Cement on Fresh and Hardened Properties of Concrete. In Proceedings of the International Conference on Sustainable Development in Civil Engineering, Jamshoro, Pakistan, 23–25 November 2017; Volume II, pp. 16–20. [Google Scholar]
- Khodabakhshian, A.; Brito, J.; Ghalehnovi, M.; Shamsabadi, E.A. Mechanical, environmental and economic performance of structural concrete containing silica fume and marble industry waste powder. Constr. Build. Mater. 2018, 169, 237–251. [Google Scholar] [CrossRef]
- Tunc, E.T. Recycling of marble waste: A review based on strength of concrete containing marble waste. J. Environ. Manag. 2019, 231, 86–97. [Google Scholar] [CrossRef]
- Bostanci, S.C. Use of Waste Marble Dust and Recycled Glass for Sustainable Concrete Production. J. Clean. Prod. 2019, 251, 119785. [Google Scholar] [CrossRef]
- Maa, B.; Wang, J.; Tan, H.; Li, X.; Cai, L.; Zhou, Y.; Chu, Z. Utilization of waste marble powder in cement-based materials by incorporating nano silica. Constr. Build. Mater. 2019, 211, 139–149. [Google Scholar] [CrossRef]
- Ruiz-Sánchez, A.; Sánchez-Polo, M.; Rozalen, M. Waste marble dust: An interesting residue to produce cement. Constr. Build. Mater. 2019, 224, 99–108. [Google Scholar] [CrossRef]
- Sharma, A.K.; Mishra, N.; Gupta, S. Waste Marble Dust as a Partial Replacement of Cement and Fine Aggregate in Concrete. J. Crit. Rev. 2019, 6, 2633–2639. [Google Scholar]
- Varadharajan, S. Determination of mechanical properties and environmental impact due to inclusion of flyash and marble waste powder in concrete. Structures 2020, 25, 613–630. [Google Scholar] [CrossRef]
- Babouri, L.; Biskri, Y.; Khadraoui, F.; El-Mendili, Y. Mechanical performance and corrosion resistance of reinforced concrete with marble waste. Eur. J. Environ. Civ. Eng. 2020, 26, 4112–4129. [Google Scholar] [CrossRef]
- Ince, C.; Hamza, A.; Derogar, S.; Ball, R.J. Utilization of waste marble dust for improved durability and cost efficiency of pozzolanic concrete. J. Clean. Prod. 2020, 270, 122213. [Google Scholar] [CrossRef]
- Benjeddou, O.; Alyousef, R.; Mohammadhosseini, H.; Soussi, C.; Khadimallah, M.A.; Alabduljabbar, H.; Tahir, M.M. Utilisation of waste marble powder as low-cost cementing materials in the production of mortar. J. Build. Eng. 2020, 32, 101642. [Google Scholar] [CrossRef]
- Choudhary, R.; Gupta, R.; Alomayri, T.; Jain, A.; Nagar, R. Permeation, corrosion, and drying shrinkage assessment of self-compacting high strength concrete comprising waste marble slurry and fly ash, with silica fume. Structures 2021, 33, 971–985. [Google Scholar] [CrossRef]
- Bayraktar, O.Y.; Yarar, G.; Benli, A.; Kaplan, G.; Gencel, O.; Sutcu, M.; Kozłowski, M.; Kadela, M. Basalt fiber reinforced foam concrete with marble waste and calcium aluminate cement. J. Struct. Concr. 2022, 1–27. [Google Scholar] [CrossRef]
- Lezzerini, M.; Luti, L.; Aquino, A.; Gallello, G.; Pagnotta, S. Effect of Marble Waste Powder as a Binder Replacement on the Mechanical Resistance of Cement Mortars. J. Appl. Sci. 2022, 12, 4481. [Google Scholar] [CrossRef]
- Kavya, C.; VamsiMohan, U. Properties of SCC with marble powder as a marginal material. Mater. Today Proc. 2022, 60, 2167–2170. [Google Scholar] [CrossRef]
- Nayak, S.K.; Satapathy, A.; Mantry, S. Use of waste marble and granite dust in structural applications: A review. J. Build. Eng. 2022, 46, 103742. [Google Scholar] [CrossRef]
- El-Mandouh, M.A.; Kaloop, M.R.; Hu, J.W.; Abd El-Maula, A.S. Shear Strength of Nano Silica High-Strength Reinforced Concrete Beams. Materials 2022, 15, 3755. [Google Scholar] [CrossRef]
- El-Mandouh, M.A.; Hu, J.W.; Abd El-Maula, A.S. Behavior of Waste Glass Powder in Concrete Deep Beams with Web Openings. Buildings 2022, 12, 1334. [Google Scholar] [CrossRef]
- Abbasi, S.M.; Rashidi, A.; Ghorbani, A.; Khalaj, A. Synthesis, processing, characterization, and applications of red mud/carbon nanotube composites. Ceram. Int. 2016, 42, 16738–16743. [Google Scholar] [CrossRef]
- Ahmadi, H.; Khalaj, G.; Najafi, A.; Abbasi, S.M.; Safari, M. Metakaolin-red mud/carbon nanotubes geopolymer nanocomposite: Mechanical properties and structural studies. Mater. Res. Express 2022, 9, 025011. [Google Scholar] [CrossRef]
- Egyptian Code Committee 203. Egyptian Code of Practice for Design and Construction of Reinforced Concrete Structures; Housing and Building Research Centre: Cairo, Egypt, 2018. (In Arabic) [Google Scholar]
- ACI Committee 318. Building Code Requirements for Reinforced Concrete and Commentary (ACI 318-19); American Concrete Institute: Farmington Hills, MI, USA, 2019. [Google Scholar]
- ABAQUS. Abaqus Analysis User’s Manual Version 6.9; Dassault Systems Corp.: Providence, RI, USA, 2014. [Google Scholar]
- ASTM C494; Standard Specification for Chemical Admixtures for Concrete. ASTM Int.: West Conshohocken, PA, USA, 2019; Volume 4.
- Eurocode 2. Design of Concrete Structures—Part 1-1: General Rules and Rules for Buildings; British Standards Institution: London, UK, 2004; Available online: https://www.phd.eng.br/wp-content/uploads/2015/12/en.1992.1.1.2004.pdf (accessed on 15 December 2004).
- Karlsson, B.I.; Sorensen, E.P. ABAQUS Analysis User’s Guide Volume IV: Elements; Hibbitt Publication: Pawtucket, RI, USA, 2006. [Google Scholar]


| Chemical Composition | SiO2 | Al2O3 | Fe2O3 | CaO | SO3 | K2O | Na2O | MgO | CL |
|---|---|---|---|---|---|---|---|---|---|
| % Cement | 19.39 | 4.13 | 4.70 | 55.66 | 3.9 | 0.28 | 0.31 | 1.70 | - |
| % WMP | 21.44 | 5.50 | 3.65 | 62.24 | 2.99 | 0.60 | 0.90 | 2.65 | 0.03 |
| Characteristic | Specific gravity | Water absorption | Fineness modulus | Crushing strength | Impact strength |
| 19.39 | 4.13 | 4.70 | 55.66 | 3.9 |
| Density (g/cm3) | Specific Gravity | Fineness (m2/kg) | Color |
|---|---|---|---|
| 2.78 | 2.67 | 350 | Light gray |
| Mix No. | WMP % | Cement kg/m3 | WMP kg/m3 | SP kg/m3 | Fine Aggregate (Sand) kg/m3 | Coarse Aggregate (Crushed Limestone) kg/m3 | Water kg/m3 |
|---|---|---|---|---|---|---|---|
| 1 | 0.0 | 500 | 0 | 5.00 | 681 | 1065 | 179 |
| 2 | 2.5 | 487.5 | 12.5 | 4.88 | 681 | 1065 | 179 |
| 3 | 5.0 | 475 | 25 | 4.75 | 681 | 1065 | 179 |
| 4 | 7.5 | 462.5 | 37.5 | 4.63 | 681 | 1065 | 179 |
| 5 | 10 | 450 | 50 | 4.50 | 681 | 1065 | 179 |
| Mix No. | WMP % | fc′(MPa) | fcu (MPa) | ft (MPa) |
|---|---|---|---|---|
| 1 | 0.0 | 56.70 | 70.81 | 5.91 |
| 2 | 2.5 | 62.93 | 78.65 | 6.68 |
| 3 | 5.0 | 65.20 | 81.48 | 6.90 |
| 4 | 7.5 | 66.45 | 83.11 | 7.03 |
| 5 | 10 | 65.00 | 81.25 | 6.87 |
| Mix No. | WMP % | Water Absorption (%) |
|---|---|---|
| 1 | 0.0 | 0.75 |
| 2 | 2.5 | 1.12 |
| 3 | 5.0 | 1.35 |
| 4 | 7.5 | 1.56 |
| 5 | 10 | 1.67 |
| Serial | Beam Name | WMP % | b mm | d mm | Stirrups ϕ Bar Diameter mm @ Spacing (mm) | ρv % | Pcr kN | Pu kN | Δu mm | Pcr/Pu |
|---|---|---|---|---|---|---|---|---|---|---|
| 1 | B1 | 0.0 | 120 | 167 | 0 | 0.00 | 46.36 | 66.25 | 2.41 | 0.70 |
| 2 | B2 | ϕ 6 @ 100 | 0.47 | 77.60 | 121.25 | 2.82 | 0.64 | |||
| 3 | B3 | 2.5 | 120 | 167 | 0 | 0.00 | 53.84 | 74.86 | 2.26 | 0.72 |
| 4 | B4 | ϕ 6 @ 100 | 0.47 | 86.90 | 135.80 | 2.63 | 0.64 | |||
| 5 | B5 | 5.0 | 120 | 167 | 0 | 0.00 | 58.14 | 79.51 | 2.20 | 0.73 |
| 6 | B6 | ϕ 6 @ 100 | 0.47 | 94.70 | 144.33 | 2.60 | 0.66 | |||
| 7 | B7 | 7.5 | 120 | 167 | 0 | 0.00 | 63.10 | 85.11 | 2.12 | 0.74 |
| 8 | B8 | ϕ 6 @ 100 | 0.47 | 102.34 | 151.32 | 2.51 | 0.68 |
| Beam | Vu exp. = (Pu/2) (kN) | Vu ACI (kN) | Vu ECP (kN) | Vu exp./Vu ACI | Vu exp./Vu ECP |
|---|---|---|---|---|---|
| B1 | 33.13 | 25.65 | 22.04 | 1.29 | 1.50 |
| B2 | 60.63 | 48.31 | 44.69 | 1.26 | 1.36 |
| B3 | 37.43 | 27.03 | 23.22 | 1.38 | 1.61 |
| B4 | 67.90 | 49.68 | 45.87 | 1.37 | 1.48 |
| B5 | 39.76 | 27.51 | 23.63 | 1.45 | 1.68 |
| B6 | 72.17 | 50.16 | 46.29 | 1.44 | 1.56 |
| B7 | 42.56 | 27.77 | 23.86 | 1.53 | 1.78 |
| B8 | 75.66 | 50.42 | 46.51 | 1.50 | 1.63 |
| Average value | 1.40 | 1.59 | |||
| Parameter | Value |
|---|---|
| Angle of dilatation | 37° |
| Eccentricity | 0.1 |
| The ratio of initial equibiaxial compressive yield stress to initial uniaxial compressive yield stress (fbo/fco) | 1.16 |
| The ratio of the second stress invariant on the tensile meridian (K) | 0.667 |
| Viscosity parameter | 0.0001 |
| Specimen | Failure Load Pu, kN | Maximum Mid-Span Displacement (mm) | ||||||
|---|---|---|---|---|---|---|---|---|
| Finite Element | EXP./Finite Element (Medium) | Finite Element | EXP./Finite Element (Medium) | |||||
| Fine | Medium | Coarse | Fine | Medium | Coarse | |||
| B1 | 67.57 | 64.26 | 62.92 | 0.97 | 2.92 | 2.69 | 2.59 | 1.12 |
| B2 | 122.32 | 116.40 | 114.02 | 0.96 | 3.36 | 3.10 | 2.99 | 1.10 |
| B3 | 75.55 | 71.86 | 70.37 | 0.96 | 2.78 | 2.55 | 2.45 | 1.13 |
| B4 | 138.41 | 131.72 | 129.04 | 0.97 | 3.19 | 2.94 | 2.83 | 1.12 |
| B5 | 80.25 | 76.33 | 74.75 | 0.96 | 2.70 | 2.48 | 2.38 | 1.13 |
| B6 | 145.58 | 138.55 | 135.73 | 0.96 | 3.07 | 2.83 | 2.72 | 1.09 |
| B7 | 84.10 | 80.00 | 78.35 | 0.94 | 2.57 | 2.35 | 2.25 | 1.11 |
| B8 | 154.22 | 146.78 | 143.79 | 0.97 | 3.00 | 2.76 | 2.65 | 1.10 |
| Average | 0.96 | Average | 1.11 | |||||
Publisher’s Note: MDPI stays neutral with regard to jurisdictional claims in published maps and institutional affiliations. |
© 2022 by the authors. Licensee MDPI, Basel, Switzerland. This article is an open access article distributed under the terms and conditions of the Creative Commons Attribution (CC BY) license (https://creativecommons.org/licenses/by/4.0/).
Share and Cite
El-Mandouh, M.A.; Hu, J.-W.; Mohamed, A.S.; Abd El-Maula, A.S. Assessment of Waste Marble Powder on the Mechanical Properties of High-Strength Concrete and Evaluation of Its Shear Strength. Materials 2022, 15, 7125. https://doi.org/10.3390/ma15207125
El-Mandouh MA, Hu J-W, Mohamed AS, Abd El-Maula AS. Assessment of Waste Marble Powder on the Mechanical Properties of High-Strength Concrete and Evaluation of Its Shear Strength. Materials. 2022; 15(20):7125. https://doi.org/10.3390/ma15207125
Chicago/Turabian StyleEl-Mandouh, Mahmoud A., Jong-Wan Hu, Ayman S. Mohamed, and Ahmed S. Abd El-Maula. 2022. "Assessment of Waste Marble Powder on the Mechanical Properties of High-Strength Concrete and Evaluation of Its Shear Strength" Materials 15, no. 20: 7125. https://doi.org/10.3390/ma15207125
APA StyleEl-Mandouh, M. A., Hu, J.-W., Mohamed, A. S., & Abd El-Maula, A. S. (2022). Assessment of Waste Marble Powder on the Mechanical Properties of High-Strength Concrete and Evaluation of Its Shear Strength. Materials, 15(20), 7125. https://doi.org/10.3390/ma15207125