Article

Prediction of Rapid Chloride Penetration Resistance to Assess the Influence of Affecting Variables on Metakaolin-Based Concrete Using Gene Expression Programming

by
Muhammad Nasir Amin
1,*,
Muhammad Raheel
2,
Mudassir Iqbal
3,
Kaffayatullah Khan
1,
Muhammad Ghulam Qadir
4,
Fazal E. Jalal
5,
Anas Abdulalim Alabdullah
1,
Ali Ajwad
6,
Majdi Adel Al-Faiad
7 and
Abdullah Mohammad Abu-Arab
1
1
Department of Civil and Environmental Engineering, College of Engineering, King Faisal University, Al-Hofuf 31982, Saudi Arabia
2
Department of Civil Engineering, University of Engineering and Technology, Mardan 23200, Pakistan
3
Department of Civil Engineering, University of Engineering and Technology, Peshawar 25120, Pakistan
4
Department of Environmental Sciences, Abbottabad Campus, COMSATS University Islamabad, Abbottabad 22060, Pakistan
5
Department of Civil Engineering, Shanghai Jiao Tong University, Shanghai 200240, China
6
Civil Engineering Department, University of Management and Technology, Lahore 54770, Pakistan
7
Department of Chemical Engineering, College of Engineering, King Faisal University, Al-Ahsa 31982, Saudi Arabia
*
Author to whom correspondence should be addressed.
Materials 2022, 15(19), 6959; https://doi.org/10.3390/ma15196959
Submission received: 30 July 2022 / Revised: 25 August 2022 / Accepted: 31 August 2022 / Published: 7 October 2022
(This article belongs to the Special Issue Advanced Research Progress of Concrete)

Abstract

:
The useful life of a concrete structure is highly dependent upon its durability, which enables it to withstand the harsh environmental conditions. Resistance of a concrete specimen to rapid chloride ion penetration (RCP) is one of the tests to indirectly measure its durability. The central aim of this study was to investigate the influence of different variables, such as, age, amount of binder, fine aggregate, coarse aggregate, water to binder ratio, metakaolin content and the compressive strength of concrete on the RCP resistance using a genetic programming approach. The number of chromosomes (Nc), genes (Ng) and, the head size (Hs) of the gene expression programming (GEP) model were varied to study their influence on the predicted RCP values. The performance of all the GEP models was assessed using a variety of performance indices, i.e., R2, RMSE and comparison of regression slopes. The optimal GEP model (Model T3) was obtained when the Nc = 100, Hs = 8 and Ng = 3. This model exhibits an R2 of 0.89 and 0.92 in the training and testing phases, respectively. The regression slope analysis revealed that the predicted values are in good agreement with the experimental values, as evident from their higher R2 values. Similarly, parametric analysis was also conducted for the best performing Model T3. The analysis showed that the amount of binder, compressive strength and age of the sample enhanced the RCP resistance of the concrete specimens. Among the different input variables, the RCP resistance sharply increased during initial stages of curing (28-d), thus validating the model results.

1. Introduction

Concrete is a widely used construction material owing to its high compressive strength, ability to mold in any desired shape, and easy availability of its constituent materials. The different mechanical and durability properties of concrete depend upon its constituent materials, such as; (i) gradation, (ii) physical properties of fine and coarse aggregates, (iii) type of cement, (iv) other pozzolanic materials used in conjunction with cement, and (v) the amount of water added to it, among others [1,2,3]. For instance, cement and water react to form binder gel, such as, calcium-silicate hydrate (C-S-H) and calcium-aluminate hydrate (C-A-H), in addition to formation of portlandite. The binder gel acts as a glue to hold the fine and coarse aggregates together [4,5]. Pozzolanic materials, such as fly ash [6], silica fume [7], blast furnace slag [8], pumice [9], metakaolin (MK) [10], etc., have been used in mortar and concrete since they ameliorate the mechanical and durability properties. This also results in the formation of secondary binder gel (i.e., C-S-H, C-A-H or C-A-S-H) depending upon the chemical composition of the pozzolanic material, thus improving the mechanical and microstructural characteristics of concrete [11,12].
MK is a highly reactive pozzolanic material that has been extensively used for performance improvement of mortar and concrete. It is produced by the calcination of kaolinite at elevated temperature ranging between 700–900 °C [13]. Unlike other pozzolanic materials, such as, fly ash, blast furnace slag and silica fume, which are directly obtained from industrial wastes, MK is produced under a controlled environment. Therefore, myriad studies have been conducted to study the influence of MK on pore size distribution and compressive strength of cementitious composites [14,15,16]. It was found that MK-incorporated concrete attained high early strength by accelerating the hydration process and subsequent reaction with portlandite due to MK’s filler effect [17]. This indirectly leads to improved performance of concrete against harsh environmental conditions. For example, Parande et al. [18] found that the water absorption and corrosion resistance of MK-based concrete specimens were reduced in case of 15% cement replacement. The reduced porosity and dense microstructure of the specimens resist chloride and sulfate attacks efficaciously [19]. This implies that the resistance against chloride significantly depends on the mechanical and microstructural characteristics of concrete. The rapid chloride penetration test (RCPT) is a measure of electric conductivity of a concrete sample, and can be determined in accordance with ASTM C 1202 [20]. During this test, the instrument robustly measures the resistance of a particular specimen to chloride ion ingress, which is an indirect measure of the permeability. The microstructural aspects of concrete specimens may be correlated with the mix design of concrete containing cementitious materials. Badogiannis et al. [21] and Reza et al. [22] concluded that the replacement of cement with MK significantly reduced the chloride ingress. This implies that inclusion of MK alongside other constituent materials of concrete tends to quantitatively correlate with the resistance against chloride penetration.
As stated earlier, the performance of cementitious composites is highly dependent on the constituent materials and their mixing proportions. Hence, several trials must be conducted to assess the influence of the properties and the amount of a particular constituent on the cementitious composites. However, such experiments are laborious, as well as time- and resource-consuming [23]. Recently, artificial intelligence (AI) techniques have gained popularity due to their quick learning abilities to model a particular process or phenomenon [24]. These abilities enable the AI model to accurately predict the output considering a number of inputs [25]. For example, Baykasoglu et al. [26] used an artificial neural network (ANN) and gene expression programming (GEP) for predicting the compressive strength of high-strength concrete. Topcu et al. [27] deployed an ANN and adaptive neuro-fuzzy inference system (ANFIS) to estimate the compressive strength of cement mortar containing MK. Following the same methodology, Saridemir [28] studied the influence of fly ash on the compressive strength of concrete. In addition to these AI models, a variety of other models, such as multi-layer neural network (MLNN) [29,30], extreme learning machine (ELM) [31], decision tree (DT) and gradient boosting tree (GBT) models [32] have been successfully used for modelling the compressive strength of concrete with different constituents. Similarly, Kumar et al. [33] successfully employed a multivariate adaptive regression spline and minimax probability machine regression approach to study the influence of elevated temperature curing, fly ash and silica fumes on the RCPT value of self-compacting concrete. Ge et al. [34] employed hybrid models, i.e., random forest combined with particle swarm optimization, whale optimization algorithm and Harris hawk optimization technique for predicting the RCPT of self-compacting concrete by considering different input parameters such as the amount of cement, fly ash, silica fumes, ratio of coarse to fine aggregate, water-to-cement ratio and temperature. It was observed that the random forest-based Harris hawk optimization hybrid model outperformed other models with the highest value of R2 = 0.98 and 0.96, and RMSE = 28.6 and 41.4 for the training and testing phases, respectively. Similarly, Yaman et al. [35] employed ANN for predicting the constituents of self-compacting concrete. For this purpose, two different methodologies viz., ANN model with multi input–multi output and ANN model with multi input–single output network were developed using 28 days of compressive strength and diameter of slump flow as the input parameters. It was found that the ANN model with multi input–single output methodology produced better results for the outputs, as evident from their higher R2 values (0.63–1.0).
A literature survey found that different AI models exhibit the capability to model the mechanical properties of concrete containing different constituents; however, there are some problems associated with their prediction capabilities, such as producing unexpected outcomes for newer datasets and overfitting of data, which inhibit their extensive use. Similarly, ANN and a few other traditional machine learning (ML) techniques are considered as black-box models [36,37], since these predict output(s) from the input(s) without revealing information about its internal workings, such as how the predictions were produced, and other information related to the influencing variables. Contrary to this, white box models do not have these shortcomings, and the related information about their workings and the influencing variables can be extracted. For example, GEP is a white-box model whose algorithm creates complex tree structures and that can learn and adapt by changing their sizes, shapes and composition [38]. Different researchers have used GEP for modelling different properties of concrete incorporating various materials. For example, the study conducted by [39] used GEP for modelling the mechanical properties of green concrete incorporating waste foundry sand. Similarly, GEP has also been successfully used for modelling the resilient modulus of stabilized soils [40]. The GEP algorithm enabled the researchers to accurately predict the output (R2 > 0.85) and, at the same time, derive a new empirical equation for the output in terms of input variables.
In summary, GEP is a promising AI technique for the solution of engineering problems, yielding simple mathematical equations for future prediction. The RCP resistance of concrete was previously investigated using the black box AI model. Considering the black-box nature of different AI methods, this research study sought to model the RCP resistance of concrete specimens using different input variables such as age of the sample, amount of binder, fine aggregate and coarse aggregate, water-to-binder ratio, MK and the compressive strength value. In addition, GEP, being white-box model, was further used for deriving an empirical equation for RCP resistance of concrete in terms of the above-mentioned inputs. The developed GEP models were statistically evaluated, followed by a sensitivity and parametric analysis of the input variables.

2. Methodology

2.1. Database Compilation

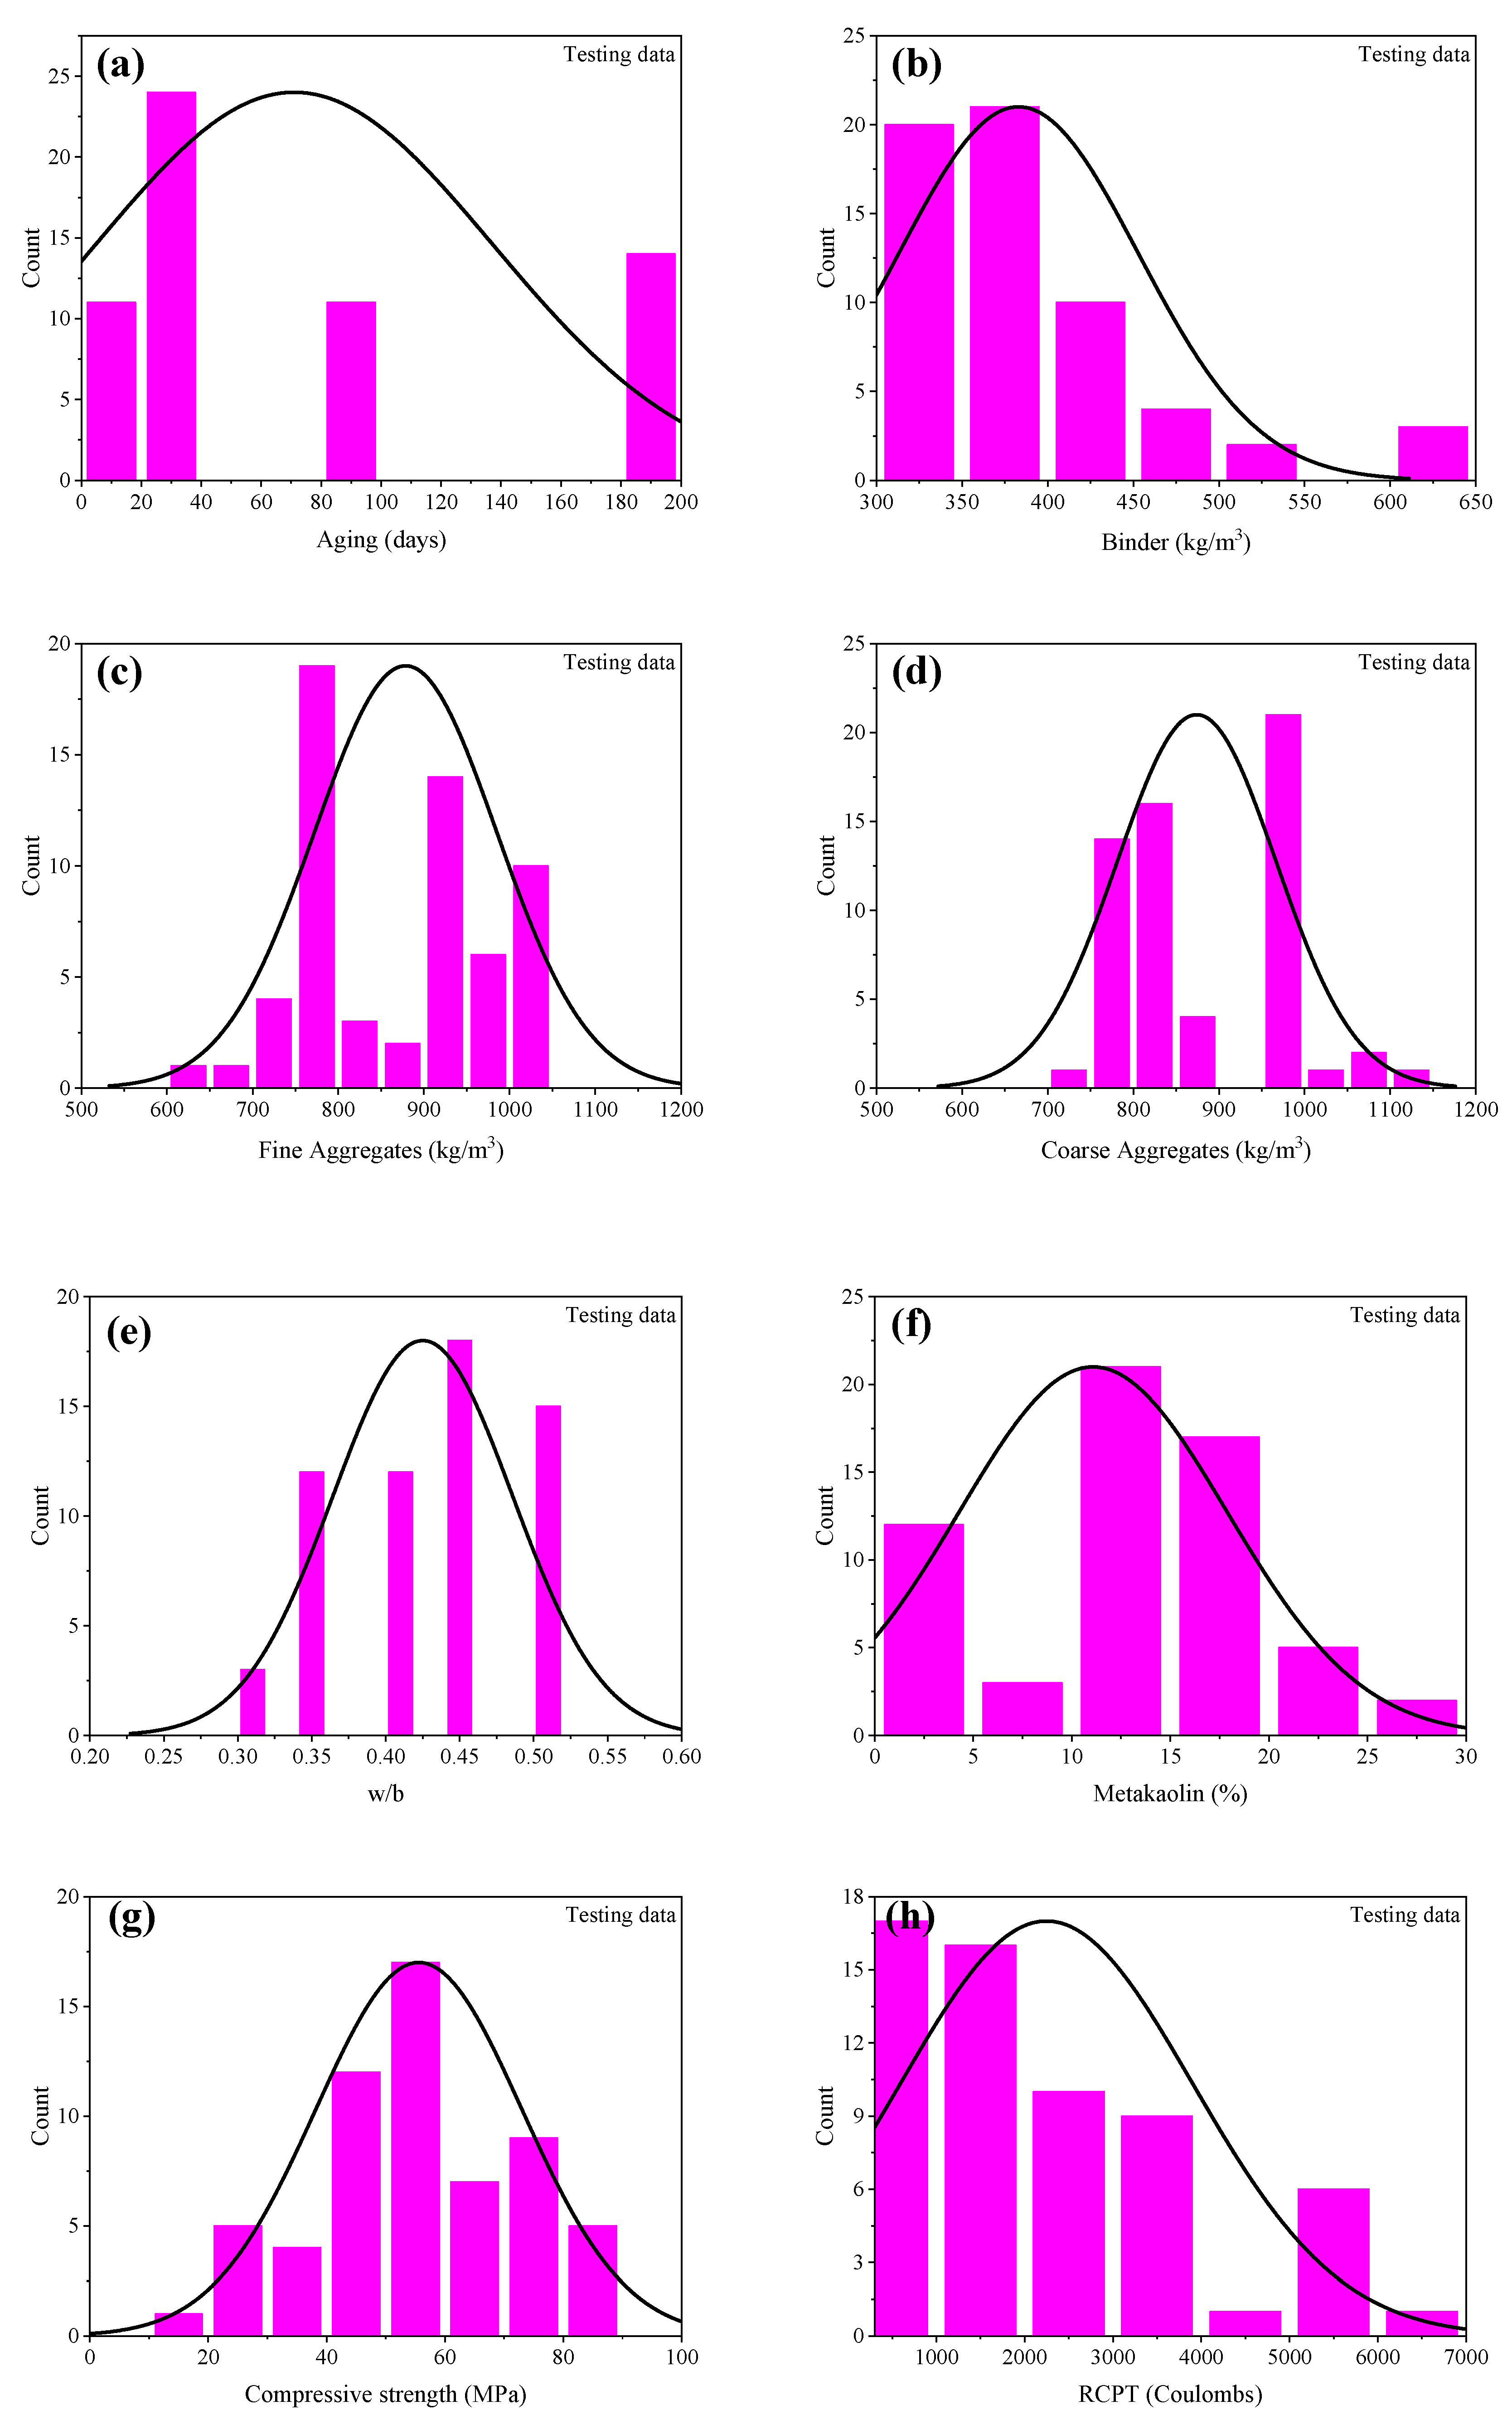
For an accurate model to precisely predict the output(s) based on a number of inputs, the database must be broad. The input variables must be evaluated statistically in order to determine their degree of influence on the output(s). In this study, the database was compiled from the experimental data of Al-Alaily and Hassan [41], Gilan et al. [42] and Ramezanianpour and Jovein [43]. The database comprised a total of 201 datapoints with seven different input variables and one output i.e., RCPT. The input variables included age of the sample (days), amount of binder (b), fine aggregate (Fag) and coarse aggregate (Cag) (Kg/m3), water-to-binder (w/b) ratio, MK (%) and the compressive strength value. Table 1 shows the descriptive statistics of the database that was used to develop the GEP models. Moreover, Figure 1 illustrates the frequency histograms of the input variables. It can be inferred from the histograms that except for the compressive strength, a majority of the input variables, such as age of the sample, b, Fag, Cag and w/b, were not normally distributed. Since the distribution of data depends upon the source used, it is not necessary that the data be normally distributed [23]. Similarly, it can be seen from Table 2 that the kurtosis value of binder was positive, while all other values of the input parameters were negative. Since, kurtosis represents the deviation of the distribution’s tail from the normal distribution tail, these values are also in accordance with the plots in Figure 1.

2.2. GEP Modelling

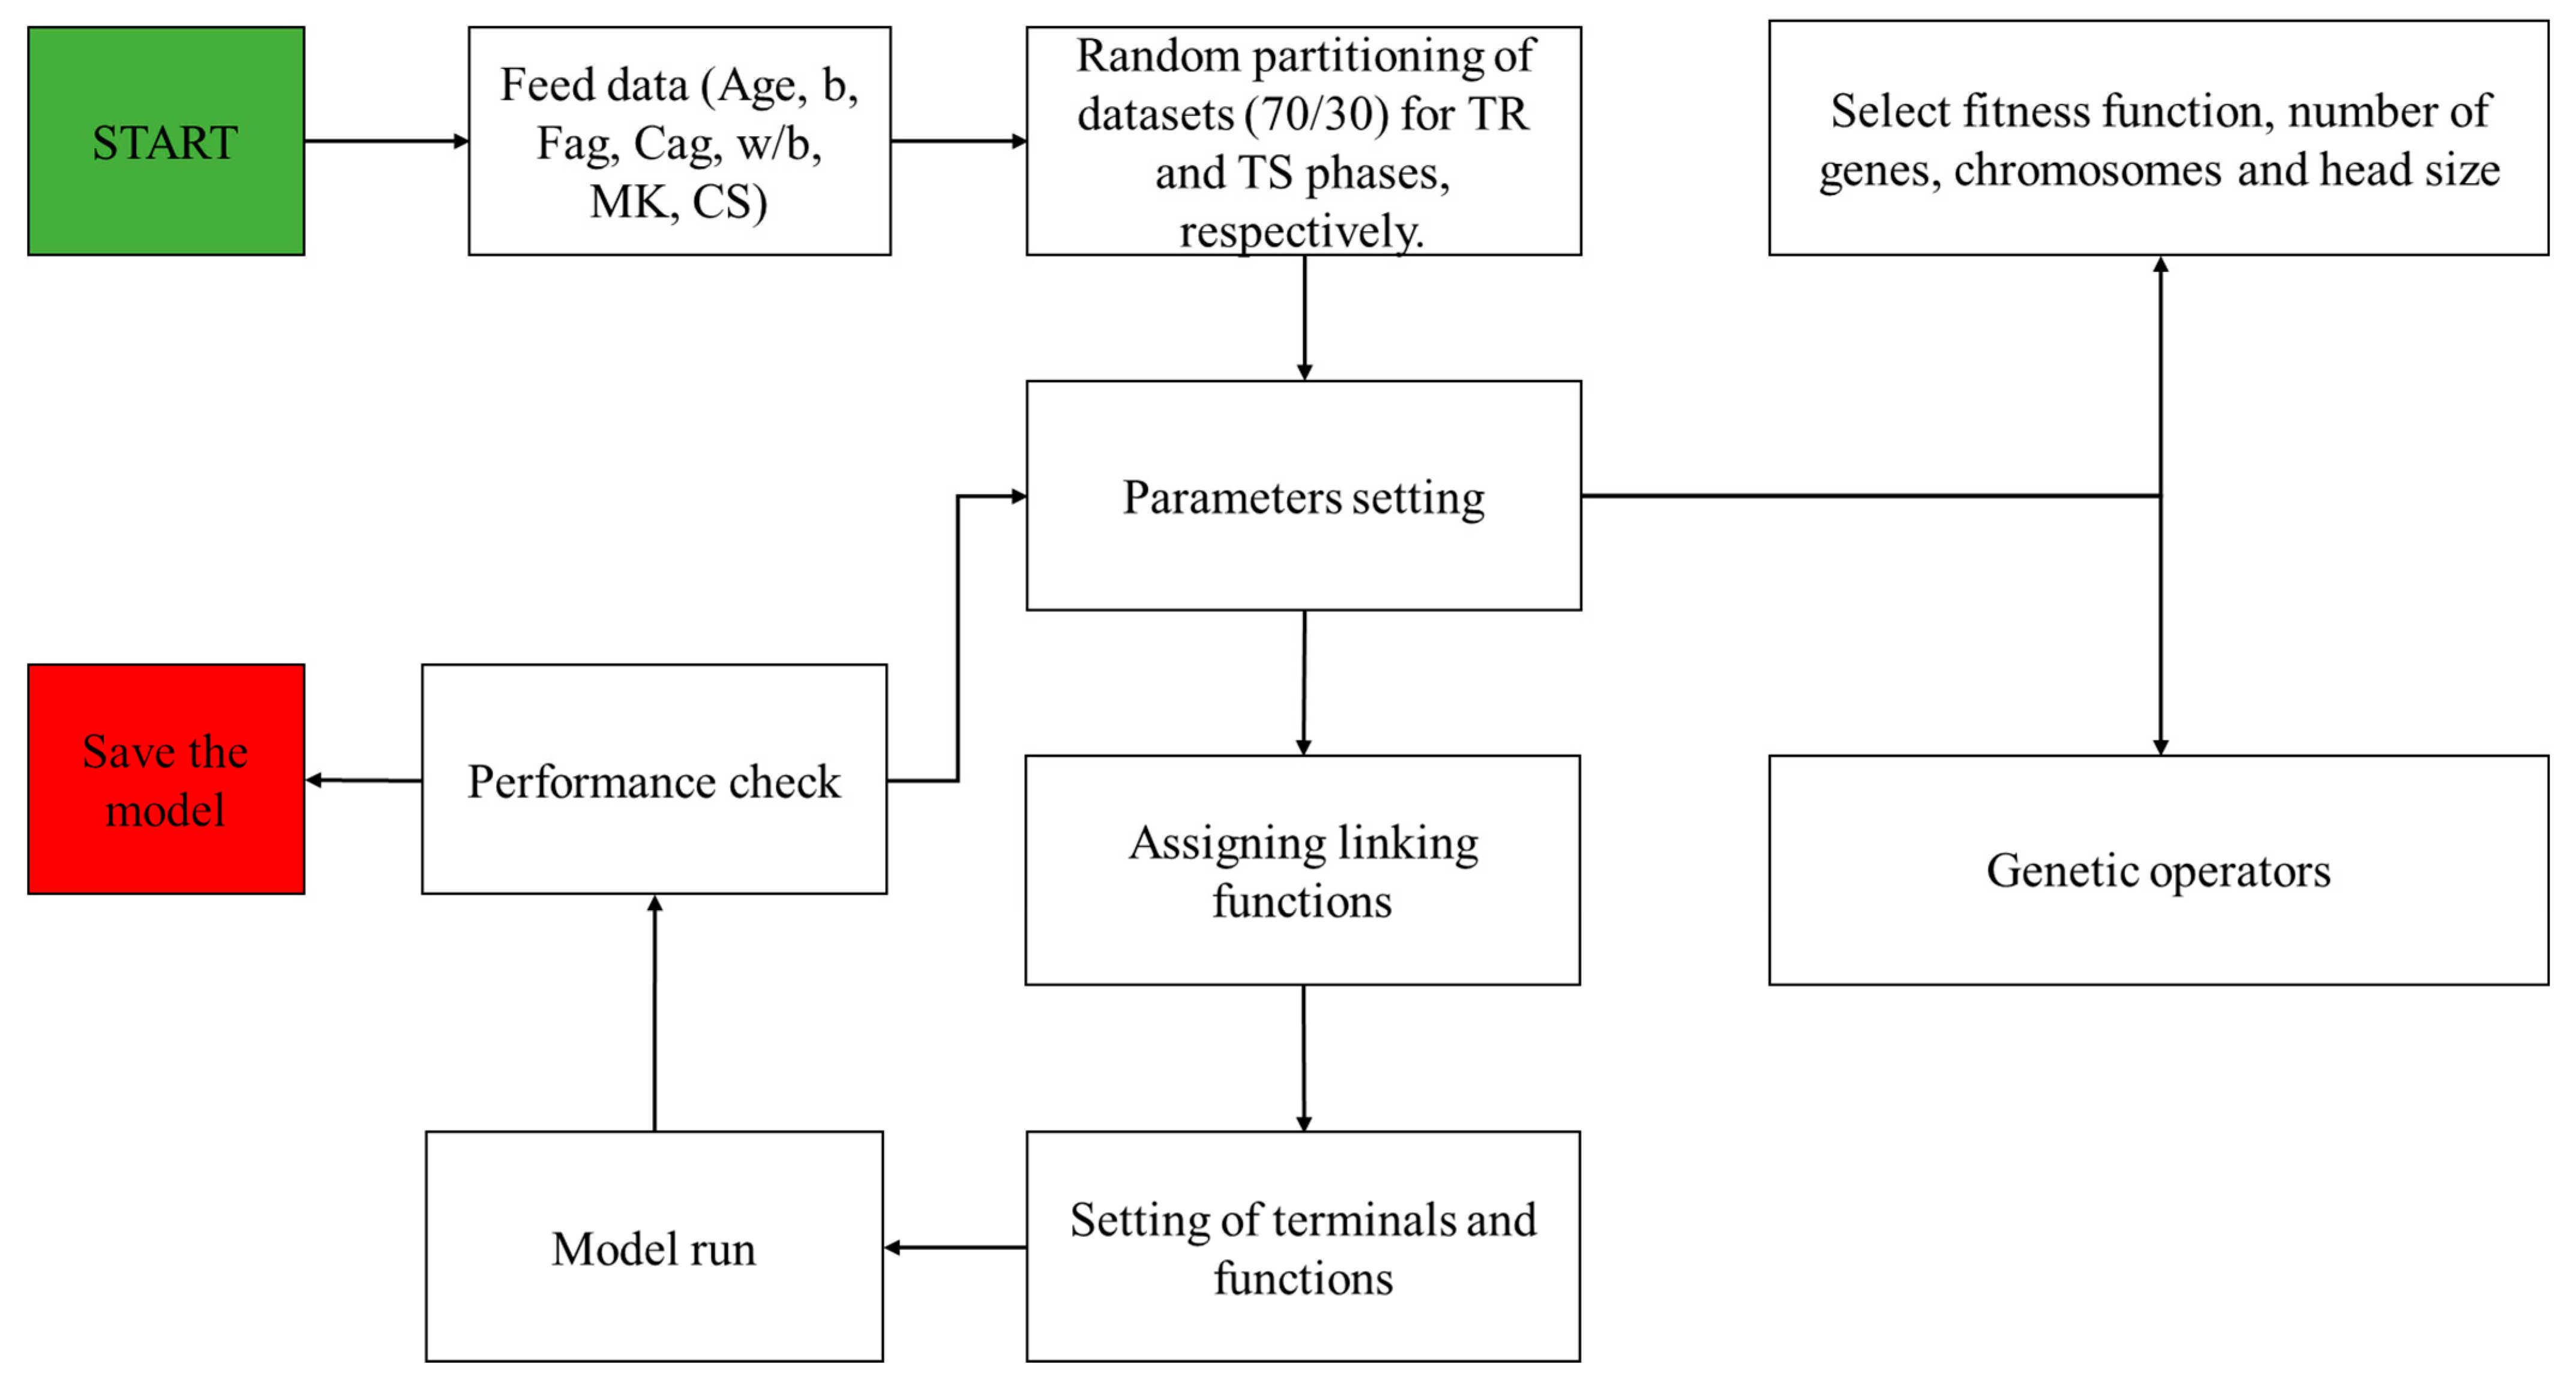
The GEP models were created with the help of GeneXprotools. Firstly, the data were fed into the GEP interface. The dataset was divided into two sets, namely the training (TR) dataset (70%) and the testing (TS) dataset (30%). As a result, 141 datapoints were used for the TR phase, whereas 60 datapoints were used for the TS phase. After that, the hyperparameter settings of GEP parameters was adjusted in order to formulate the most optimal model. For this reason, the numbers of chromosomes (Nc) were varied from 30 to 200, numbers of genes (Ng) from 3 to 5, and the Hs from 8 to 12. Different linking functions (+, −, ×, /) between the Ng were explored during the performance of trials, and it was found that the addition function provided the best performance. The flowchart of GEP modelling is shown in Figure 2, while the details of the undertaken trials are given in Table 2.
The parameters for GEP modelling were set using trial and error. As a result, the developed models overfit the data during the TR process and, subsequently, improved their performance in the TS phase. Gandomi and Roke [38] selected a model with a minimum objective function (OF) in order to address the problem of overfitting [39]. The OF varies from 0 to a maximum value, such that a model having OF ≈ 0 is deemed to yield the best performance. Different performance indices, such as coefficient of determination (R2), RMSE and mean absolute error (MAE), have been employed for evaluating the performance of the proposed GEP model. Table 3 shows the ideal values of these indices.
In the search for the best hyperparameters of the GEP model, a total of 11 trials (Models T1 to T11) were undertaken with varying Nc, Ng and Hs (Table 2). Initially, the Nc were changed from 30 to 200 while keeping the Hs and Ng constant (i.e., 8 and 3, respectively). Similarly, the Hs was changed from 8 to 12, keeping the other two variables constant. A similar procedure was followed to find the optimal number of Ng. Thus, the Nc, Hs and Ng for an optimally performing GEP model (Model T3) were recorded to be 100, 8 and 3, respectively.

3. Results & Discussion

3.1. Effect of Variable Genetic Parameters

Table 2 depicts the influence of Nc, Hs, and Ng on the performance of the models (T1–T11) evaluated using different indices such as R2, RMSE and MAE, for both the TR and TS phases, respectively. The hyperparameter investigation was carried out in 11 distinct trials by varying the genetic parameters, i.e., Nc, Hs, and Ng. The performance was observed in terms of the aforementioned statistical indices. It can be seen from Table 2 that initially the Nc was varied from 30 to 200, maintaining the other two genetic parameters constant (Hs = 8 and Ng = 3). Subsequently, the optimum model (Model T3) obtained during this investigation was further subjected to an increase in the Hs from 8 to 12. The Ng was changed from 3 to 5 in Models T9, T10, and T11 in order to obtain the optimal Ng value.
Figure 3 depicts the performance in terms of MAE, RMSE, and R2 with changing Nc for TR phase, TS phase, and in case of the overall dataset. Figure 3 shows that when the Nc was increased from 30 to 200, the optimal Nc was revealed to be 100. Moreover, the detailed illustration of the Nc variation in Figure 3a–c shows that the overall values of MAE, RMSE, and R2 (i.e., 375.05, 489, and 0.905, respectively) indicated improved accuracy for Nc equaling 100. Afterwards, the performance of the other models plummeted. Similarly, the optimal values of Hs and Ng were observed as 8 and 3, as shown in Figure 4 and Figure 5, respectively. This strongly suggests that the hyperparameter tuning in the GEP modelling is solely a trial and error process, and there are no concrete recommendations regarding the effect of changing the genetic parameters. Furthermore, it is evident from the previous studies that increasing Ng and employing complex linking functions may increase the robustness of the models, but perplexes the traceable output mathematical equation [38,40].
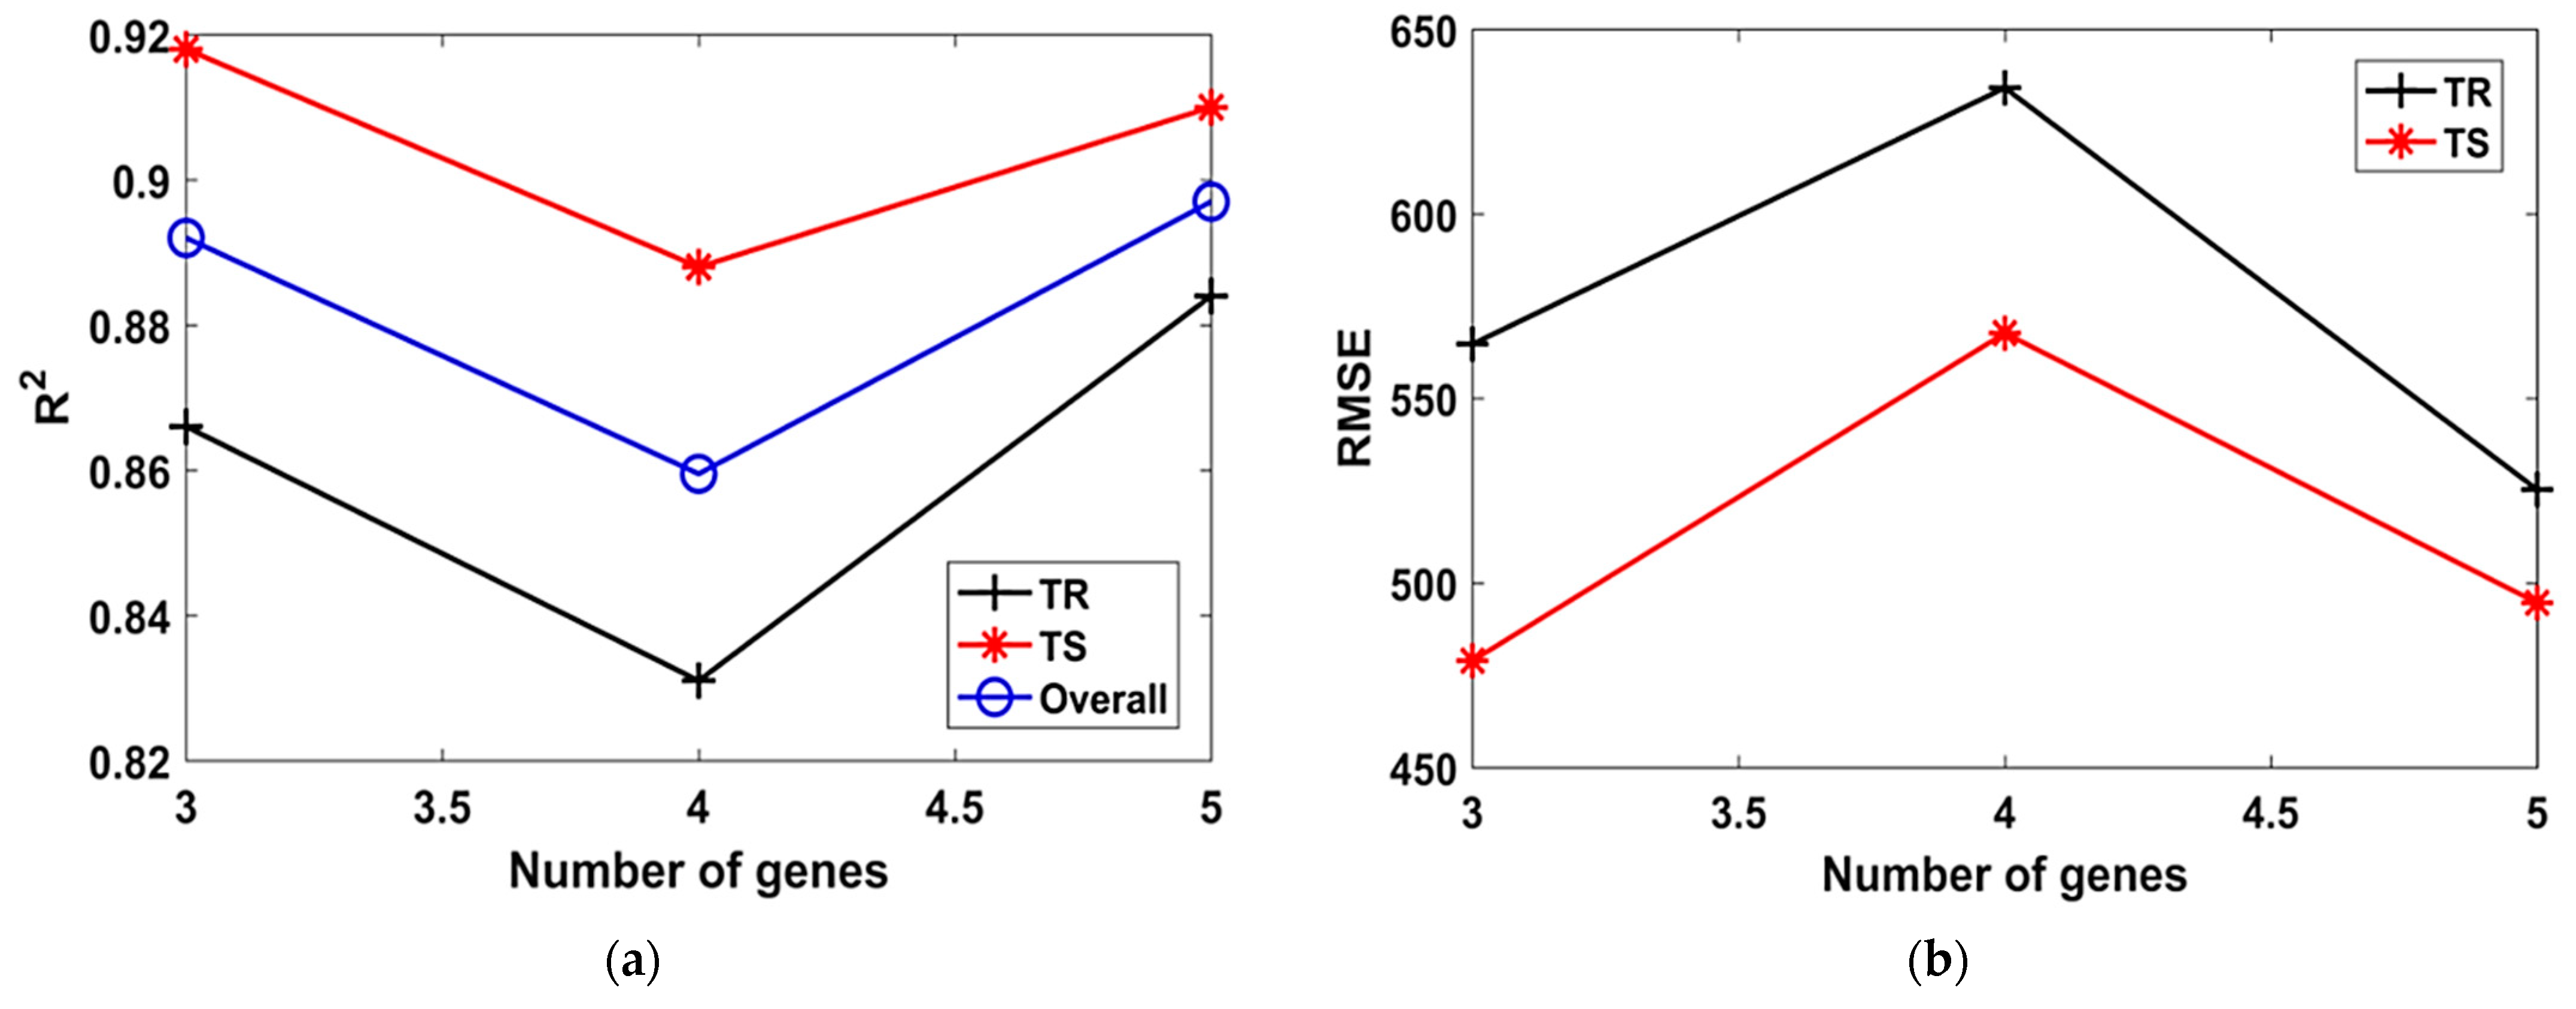
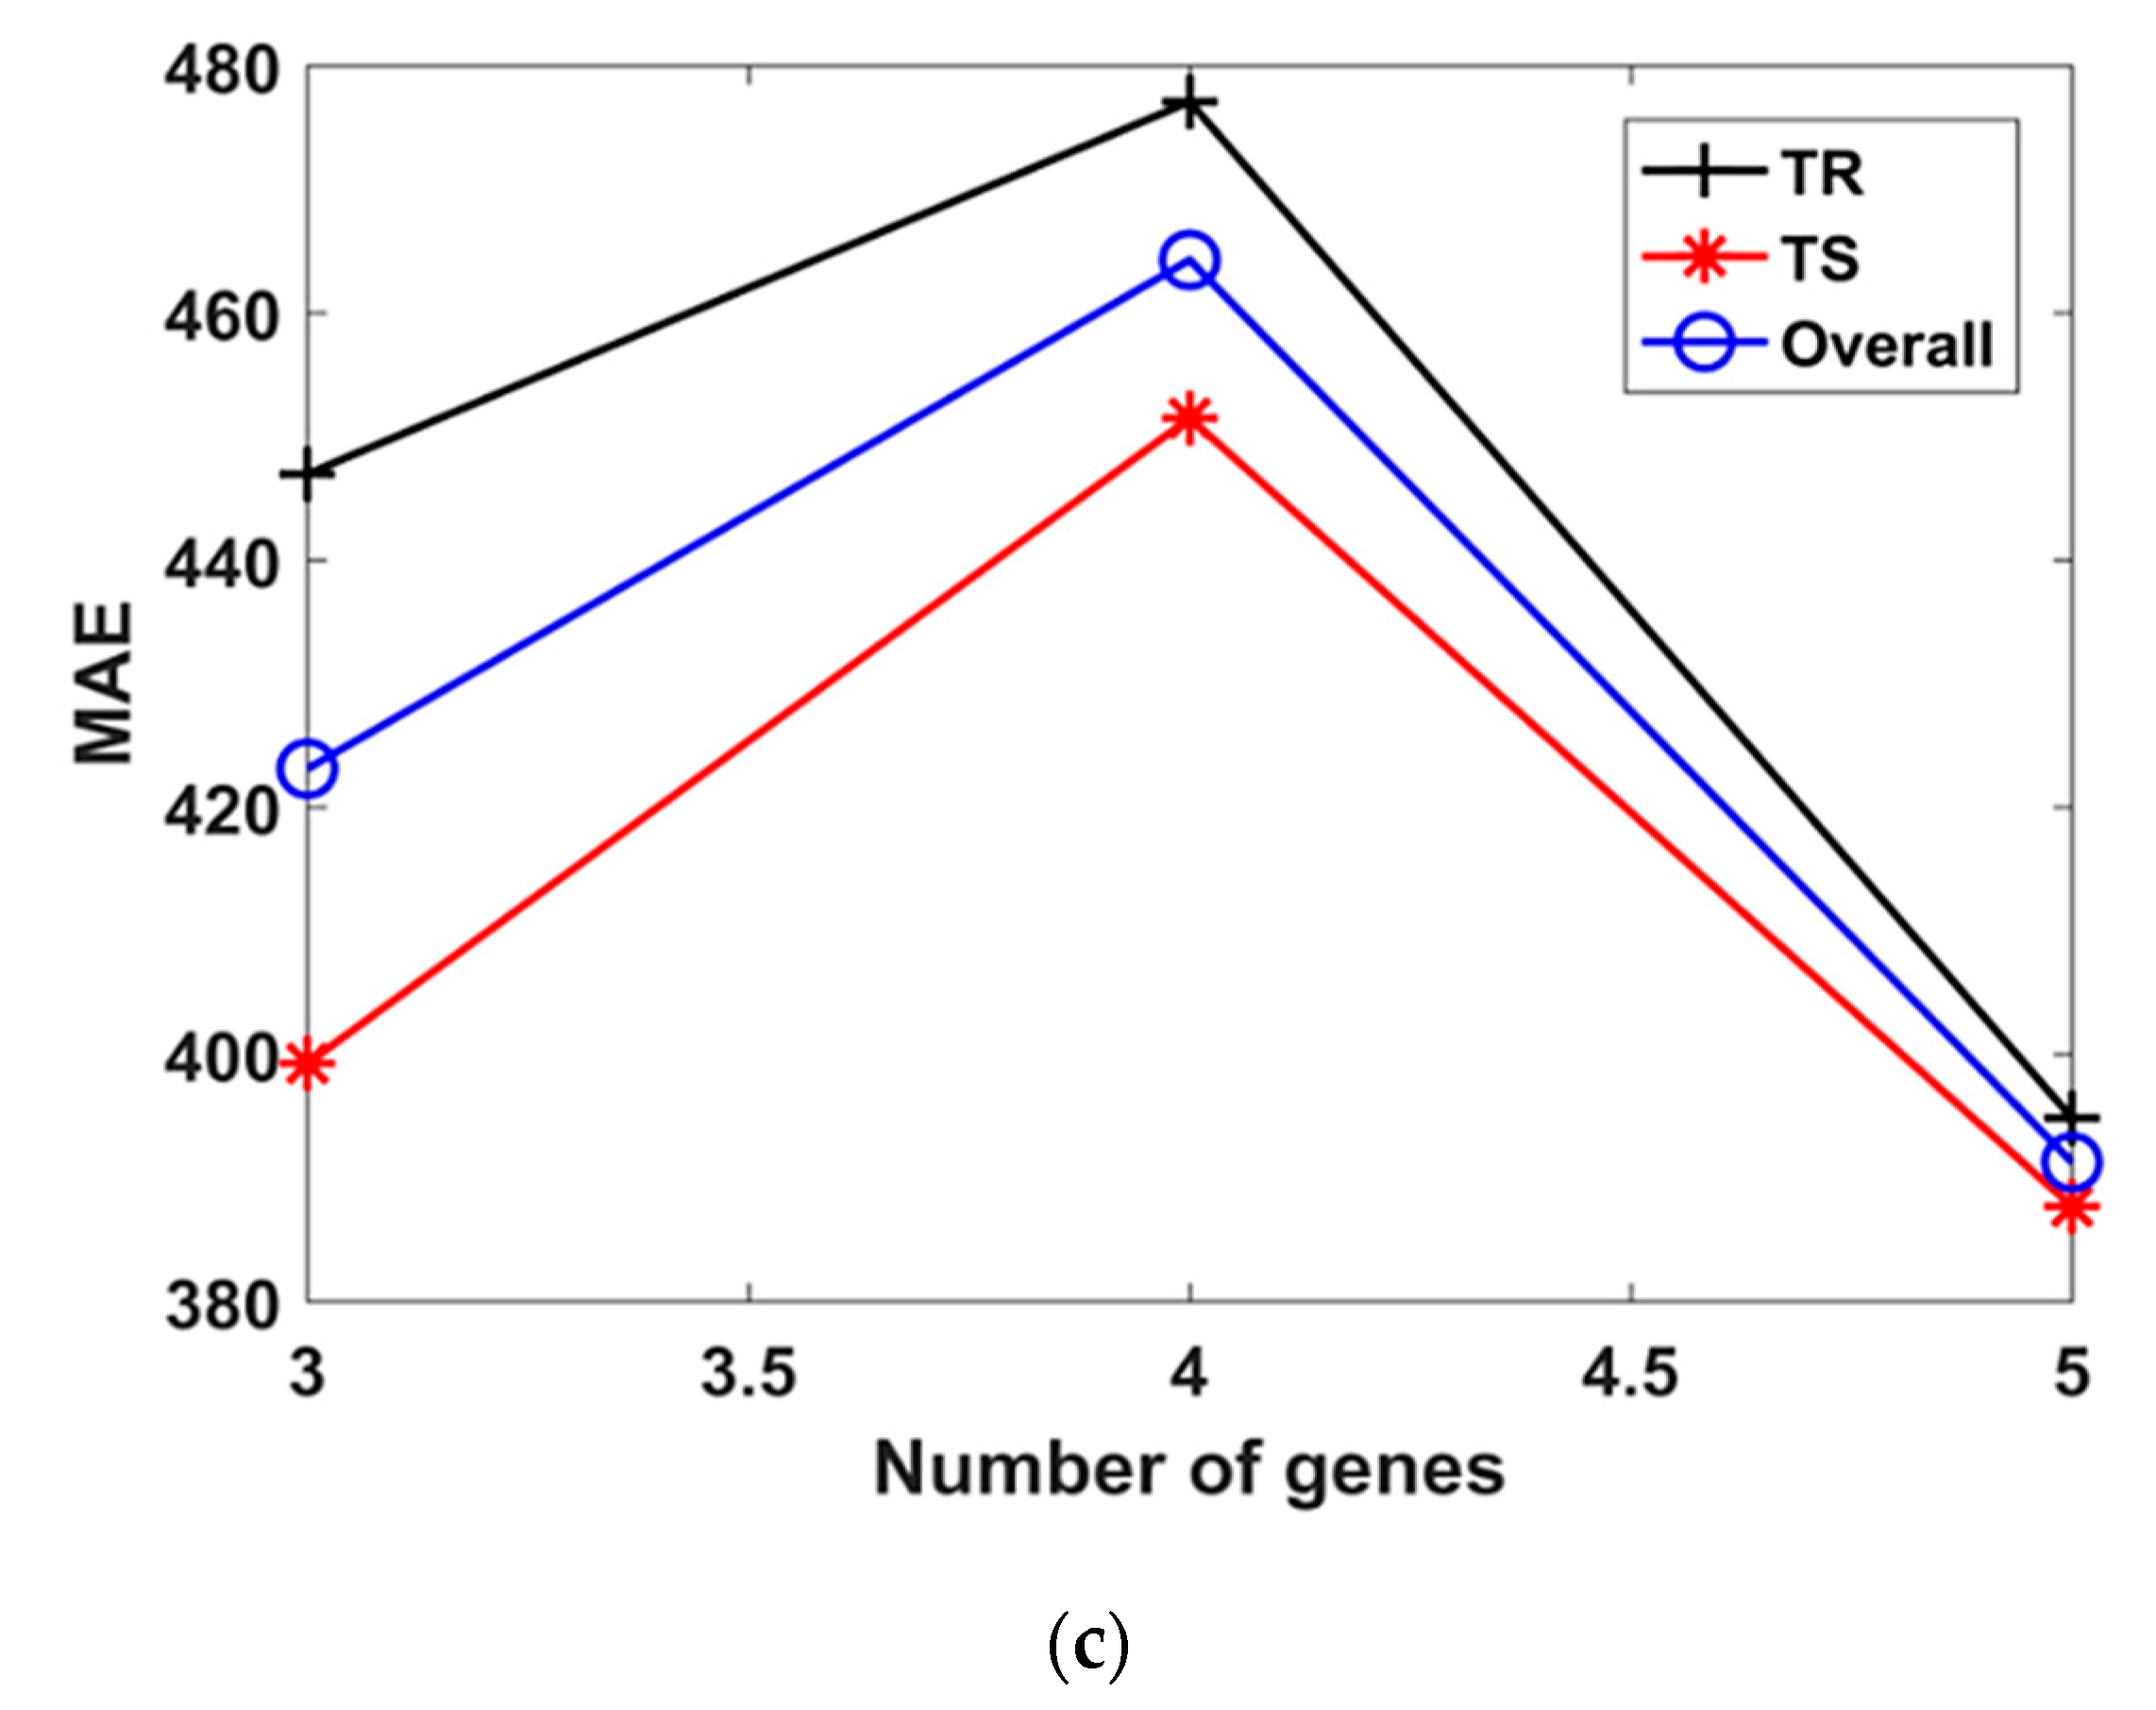
Similarly, when the number of genes was increased from 3 to 5 in Model T9 to Model T11, and the number of chromosomes were kept constant at 100. It was found that the highest value of R2 = 0.88 in the TR phase and R2 = 0.92 in TS phase, as evident from Table 2. Lower values of R2 and higher values of RMSE and MAE were observed when the number of genes was 5. The effect of number of genes on the performance of the models can also be seen in Figure 4. It is evident that the models had lower R2 (Figure 4a) and higher RMSE (Figure 4b) when the number of genes was equal to 4.
Similarly, it can also be observed from Table 2 and Figure 5 that the value of Hs changed from 8 to 12 in Model T6 to Model T9. It can be inferred that when the Hs is increased while keeping the other two parameters constant, the R2 value increases for both the TR and TS phases (Figure 5b). The highest value of R2 = 0.87 and 0.92, can be observed for both TR and TS phase, respectively, in Model T9. Similarly, smaller values of RMSE = 564.8 and 478.9 and MAE = 447 and 399.3 were observed for both TR and TS phase, respectively, in Model T9. Looking at the performance of the model in different trials, it can be concluded from Table 2 that the trial T3 was the most optimal compared to the others since it had the highest R2 value and a smaller RMSE and MAE value.

3.2. Performance of Models

In order to evaluate the performance of the proposed models, a variety of statistical indices, such as the slope of regression line [39], statistical evaluation [44] and predicted to experimental (P/E) ratio [45], were employed.

3.2.1. Statistical Evaluation

As discussed previously, Model T3 performed better (R2 = 0.89 for TR phase, and 0.92 for TS phase), followed by Model T11 (R2 = 0.88 for TR phase, and 0.91 for TS phase). The observed values of R2 indicate a good agreement between the predicted and actual values. However, deciding about the performance of a model based on “R2” alone is not sufficient, and other statistical error indices must also be considered. In this regard, the values of RMSE and MAE were studied to evaluate the performance of the different models, in addition to the R2 value (Table 2). It is evident from Table 2 that besides having a higher R2 value, Model T3 exhibited the lowest RMSE (513.9 in TR phase, and 464.1 in TS phase) and MAE (385.2 in TR phase and 364.9 in TS phase). Similarly, Model T11 performed as the second-best model with R2 = 0.88, RMSE = 525.3 and MAE = 394.8 in the TR phase, while Model T1 performed as second-best model with R2 = 0.92, RMSE = 478.2, and MAE = 386.6 in the TS phase, respectively. The ranking of the models based on the different statistical indices is shown in Table 4.

3.2.2. Comparison of Regression Slopes

AI models can be assessed using the slope of the line trending between the actual and forecasted values. A similar assessment method was employed for this study, and regression slopes were plotted for all 11 trials. It is pertinent to mention that, an ideal line having slope value of unity can be shown by plotting a line at an angle of 45 degrees with the x-axis. The performance of the model is expected to be superior, i.e., the predicted values will be closer to the actual values if the plotted points are close to the standard line. A regression line whose slope approaches the value 1 and its correlation value (i.e., R) 0.8 are considered reliable in predicting new data [46,47,48].
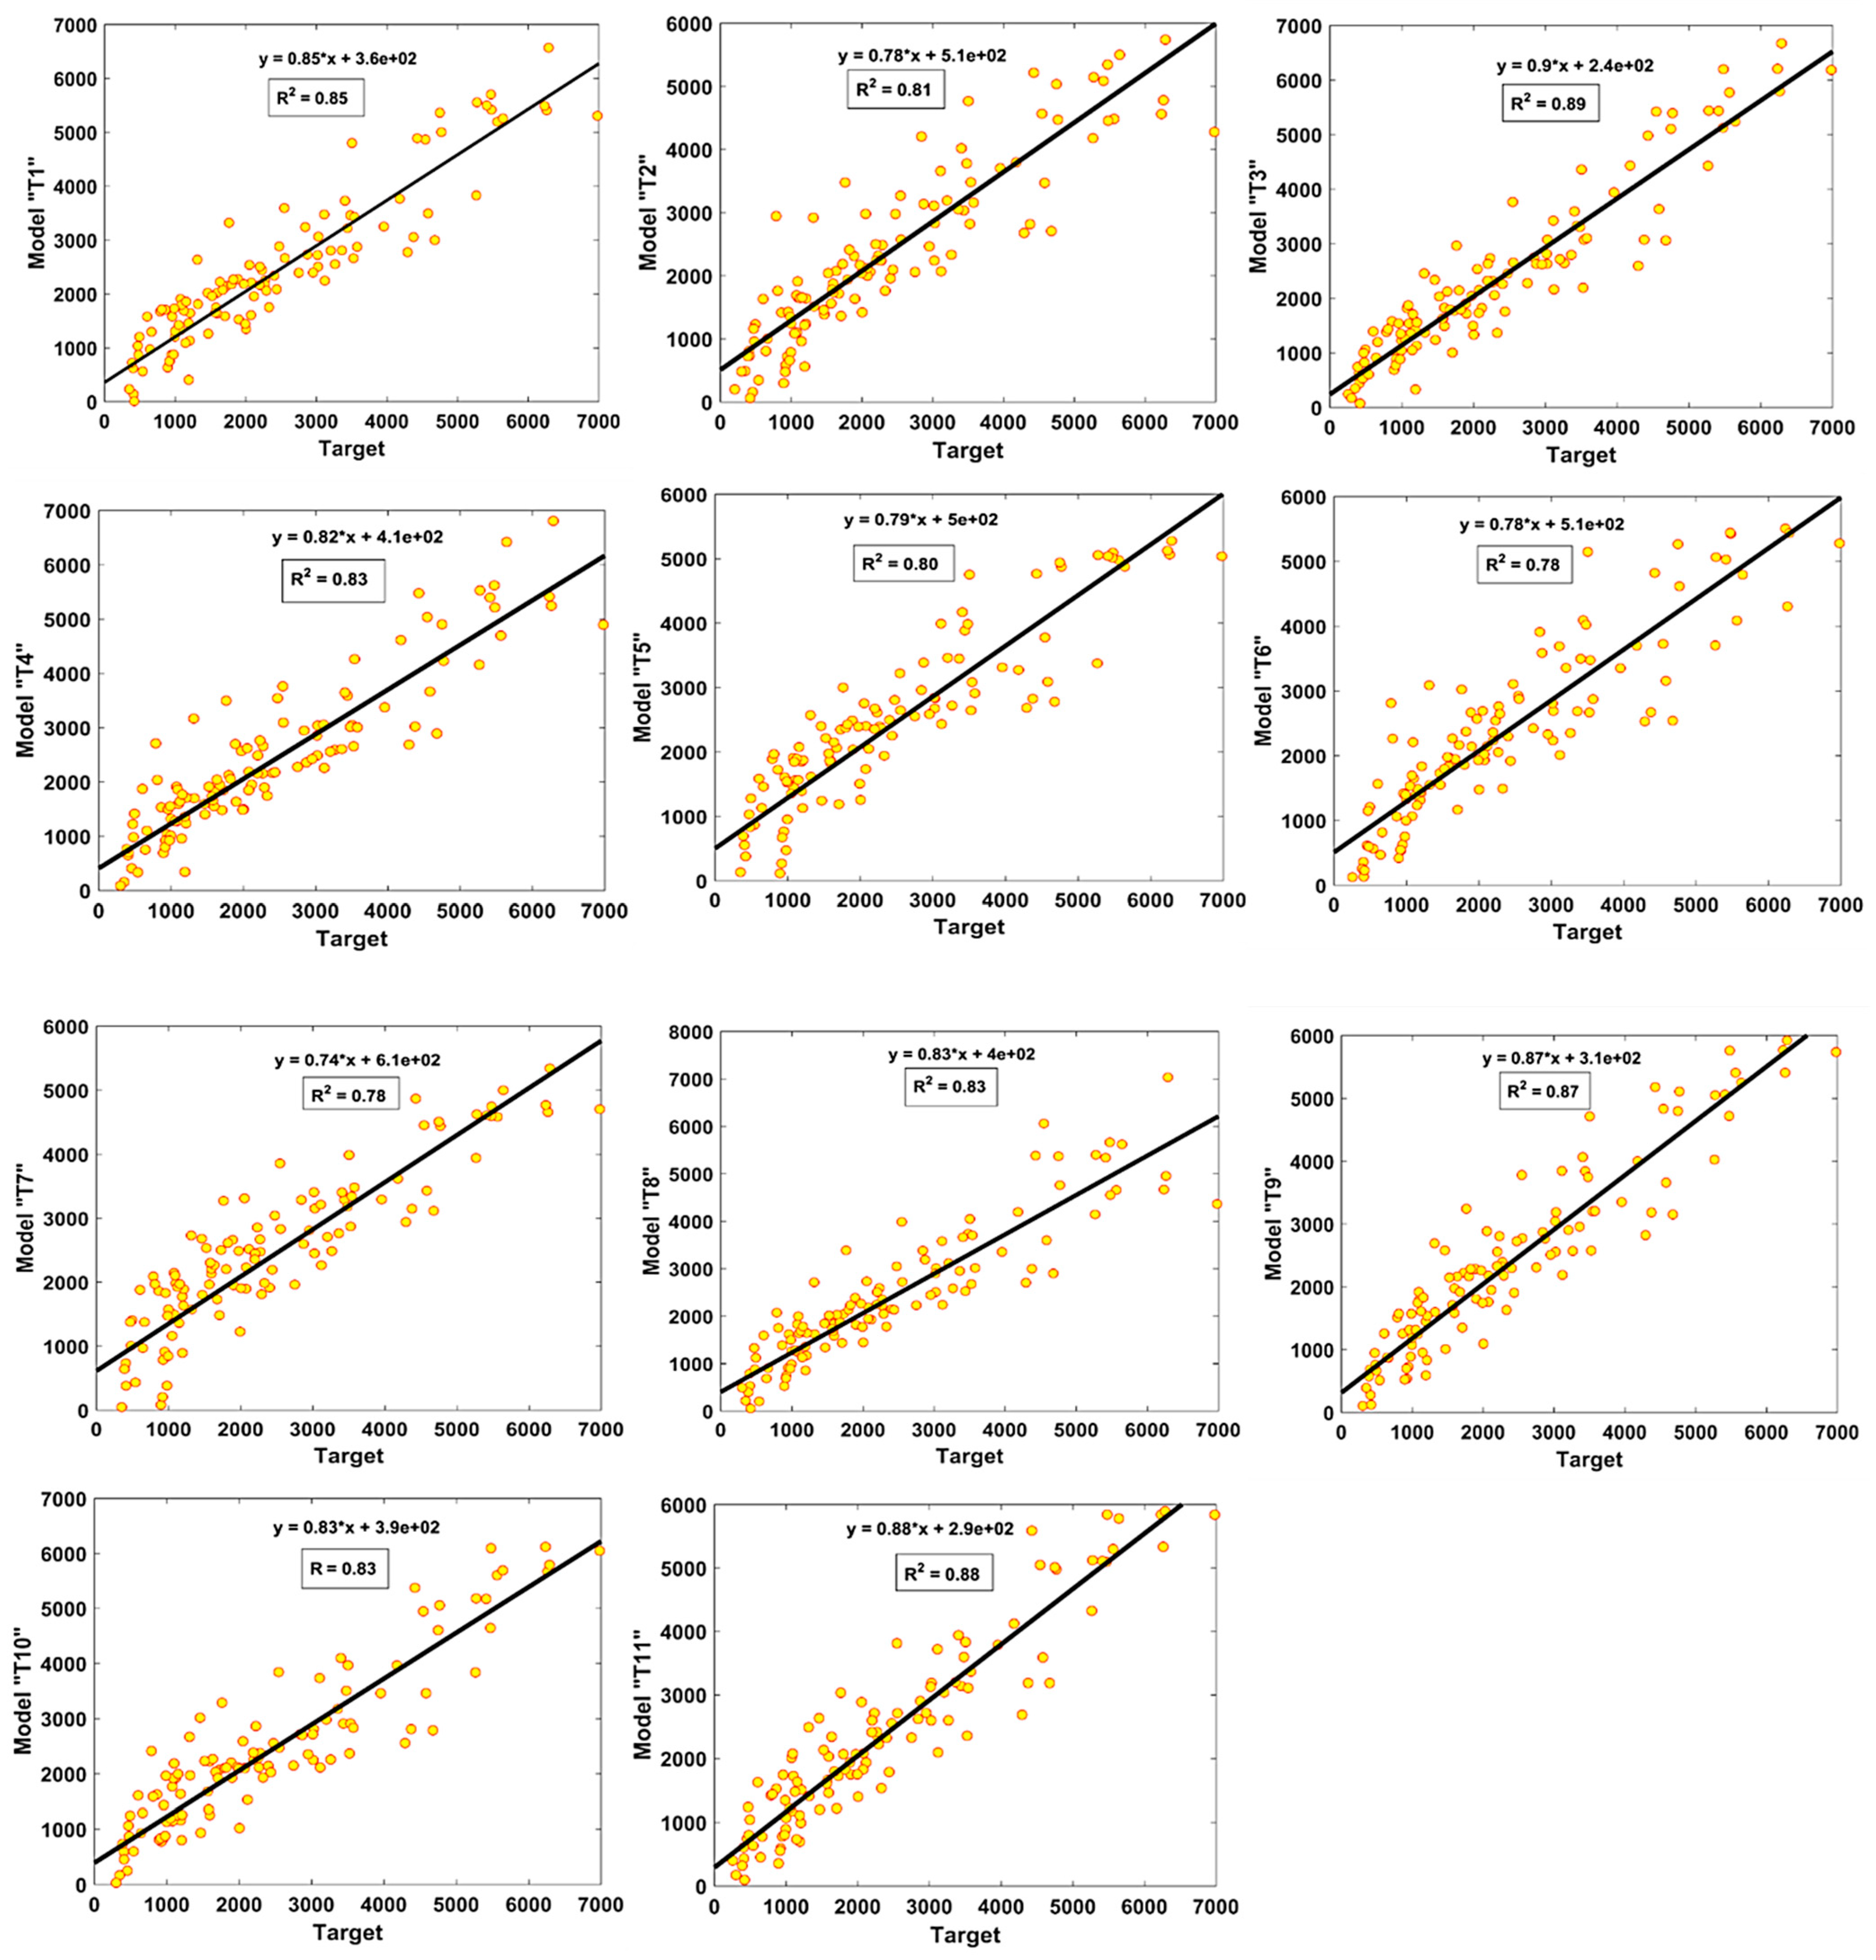
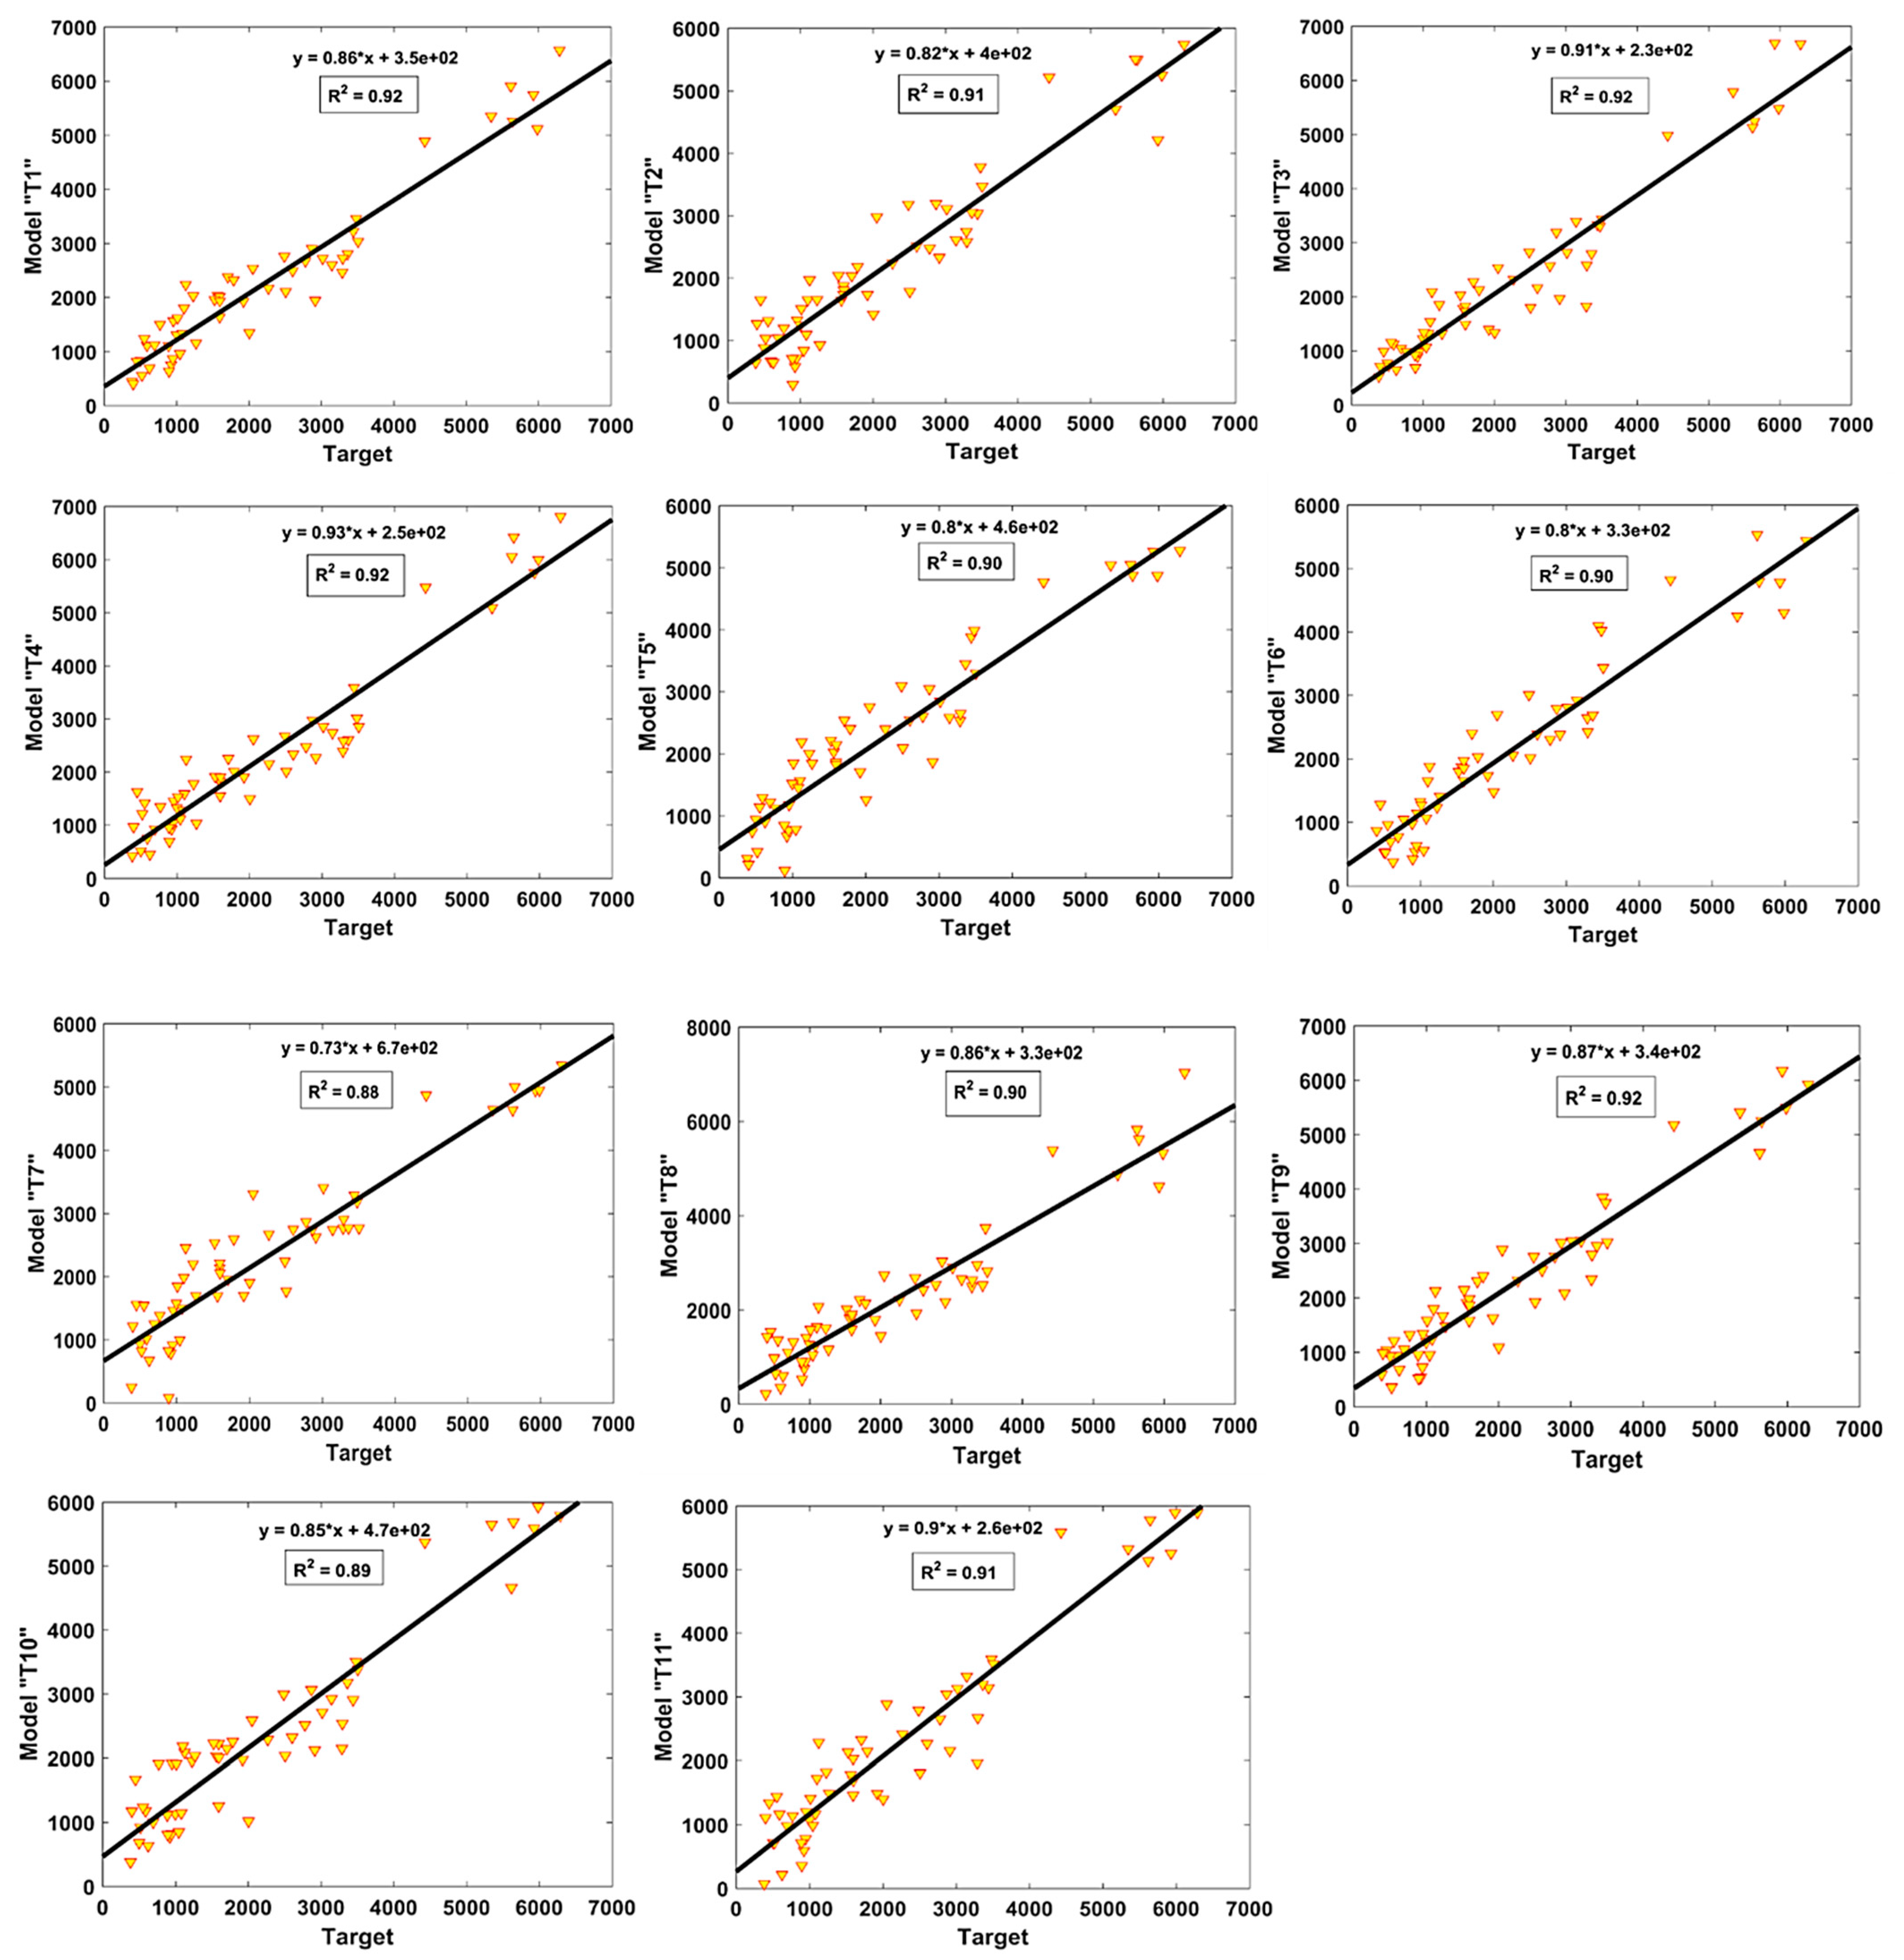
Figure 6 and Figure 7 show the value of R2 and regression slopes for both the TR and TS phases, respectively. It is evident that the value of R2 exceeded 0.8 for most of the models. In the TR phase, Model T3 had the finest fit with an R2 value of 0.89, whereas Model T6 and Model T7 had lower values of R2 = 0.78, each. Similarly, the performance of the models seemed to be better in the TS phase, as evident from their higher R2 values, and all the models had R2 ≥ 0.85. Similarly, it can also be observed from Figure 6 and Figure 7 that the highest values of slope “m” = 0.89 and 0.92 were obtained for the optimal model “T3” in both the TR and TS phases, respectively. It is important to mention here that for m = 1, the slope of the regression line will be exactly 45°. The values of “m” observed for the model “T3” were closer to one as compared to other models; therefore, it can be concluded from the higher R2 and m values that this was the optimal performing model compared to the others.

3.2.3. Model Predicted to Experimental (P/E) Ratio

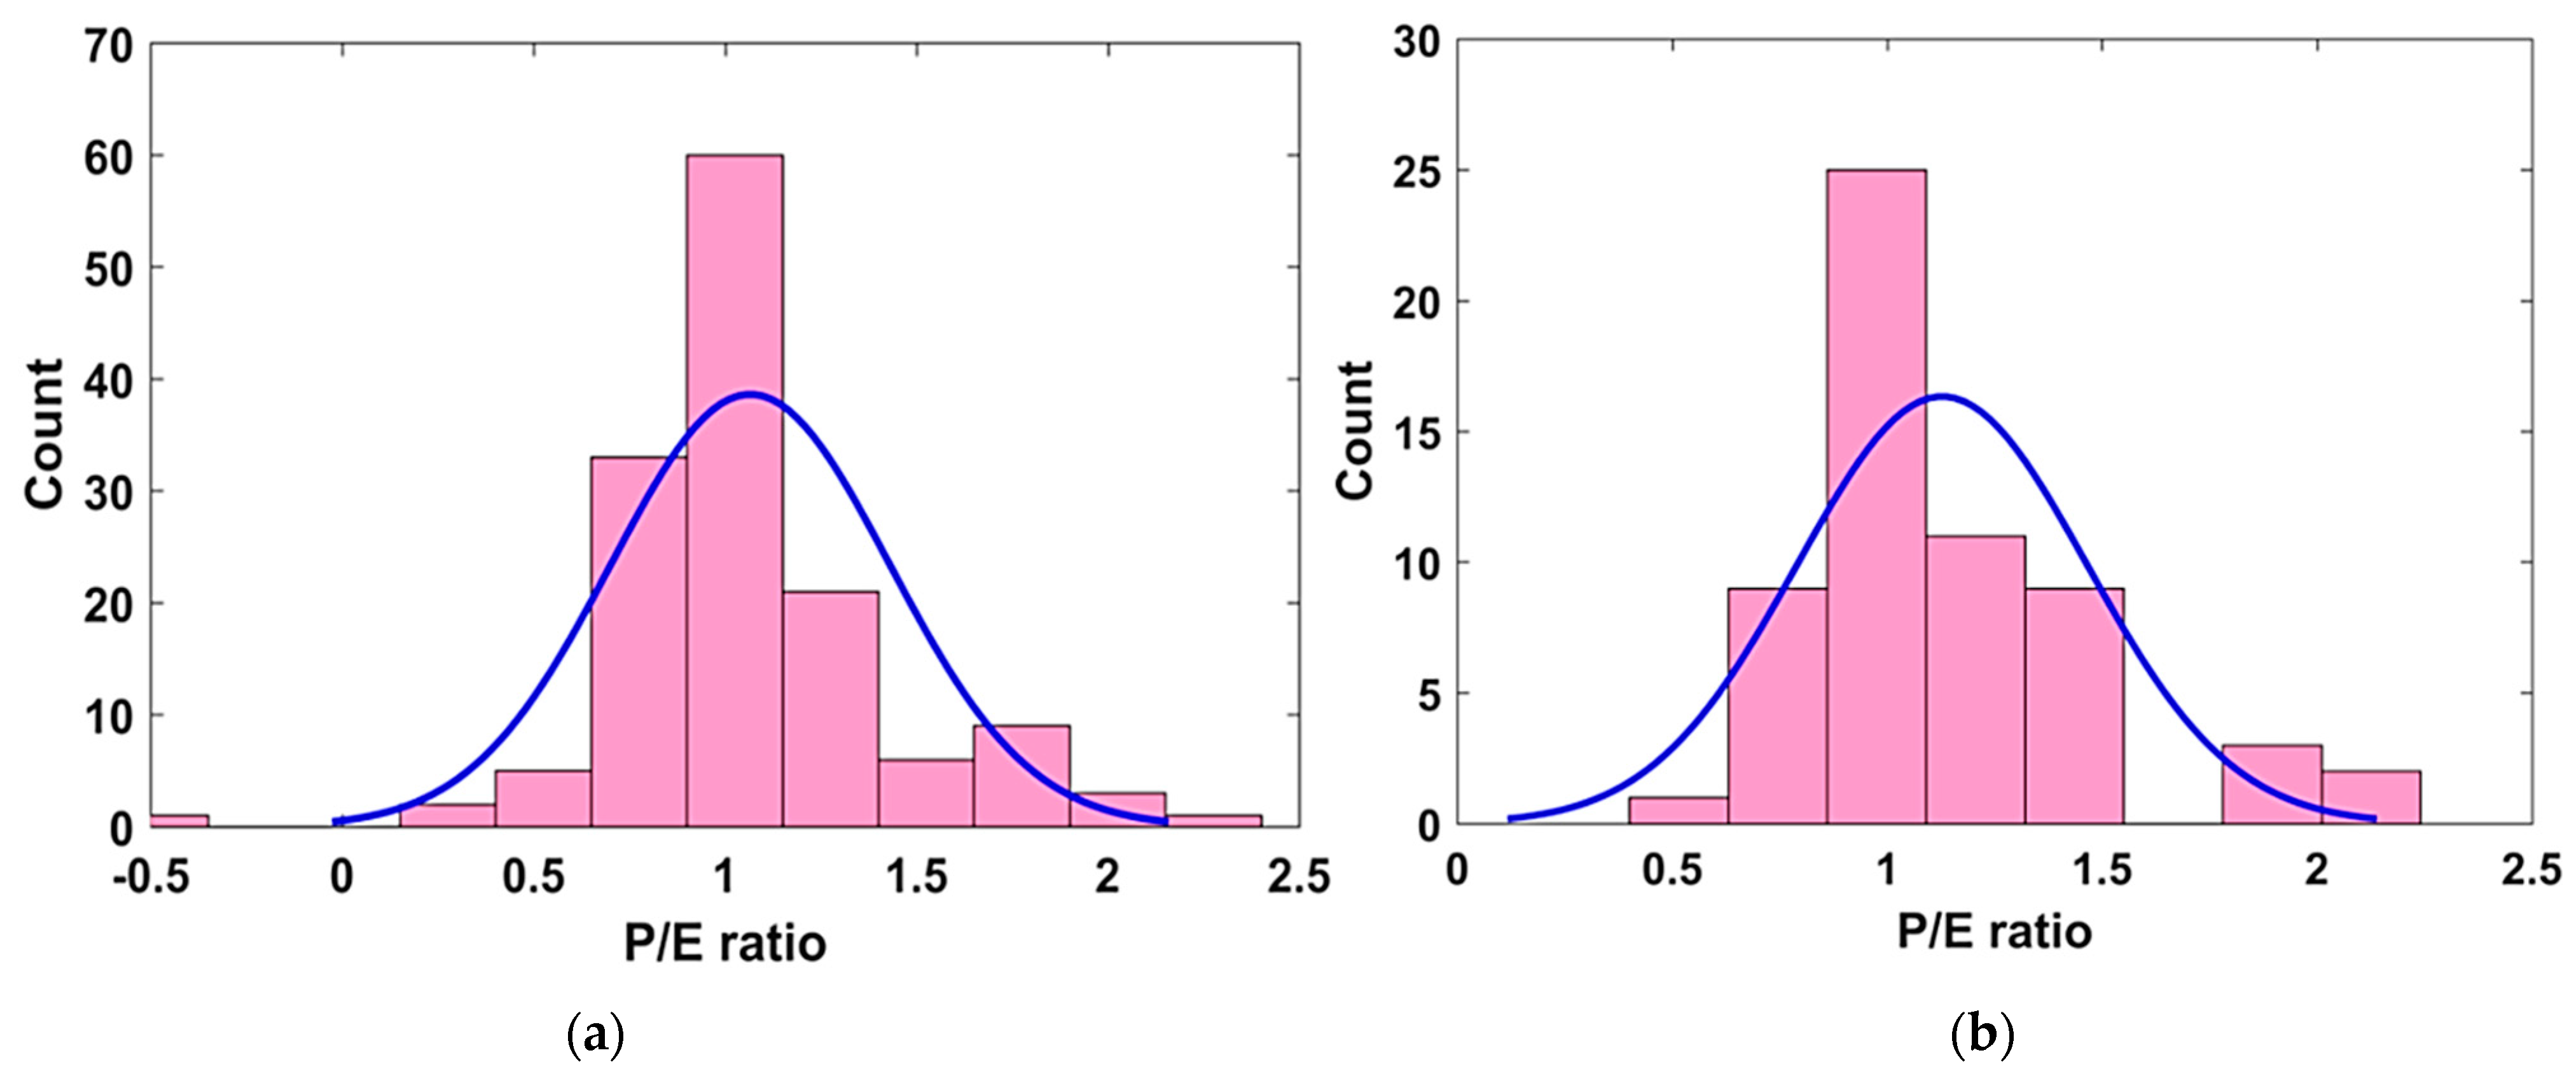
The performance of the different models formulated during different trials was further investigated using the P/E ratio. Figure 8 shows the distribution of the P/E ratio for the best performing Model T3. The bin range was kept as 0, 0.5, 1.0, 1.5, 2.0, and 2.5. It can be seen that most of the P/E values in predicting RCP values were concentrated mainly in the bin range proximal to one, in both the TR and TS phases. This aided another statistical check in evaluating the performance of the model and served as visual confirmation of the best performance model, i.e., Model T3.

3.2.4. Visual Interpretation of Results via Taylor Diagram

To better visualize the results of the 11 proposed models, a Taylor diagram was employed. It is a two-dimensional graph providing a concise overview of a model’s accuracy. It represents the relationship between the actual and forecasted values using the correlation coefficient, RMSE and the standard deviation ratio. For performance comparison, the developed model’s value is marked on the diagram, and its performance is compared against the reference/benchmark point, which has already been plotted on the diagram. Figure 9 shows the Taylor diagram of the developed models for both TR and TS phases, respectively. It is evident that model T3 had the highest correlation coefficient value and a lower RMSE, as shown in Figure 9a, followed by model T11, whose standard deviation value was second closest to the reference value, as shown in Figure 9a. This visual interpretation of the model’s performance from the Taylor diagram supported the ranking of the proposed models, as shown in Table 4. Similarly, in the TS phase, model T3’s correlation coefficient value was the highest among all models, as shown in Figure 9b; however, the standard deviation of model T4 was closer to the reference value compared to model T3.

3.3. GEP Formulations

In order to obtain an empirical equation for predicting the RCP of concrete using the different input variables considered in this study, the best performing model, i.e., Model T3, was used for generating the empirical equation. For this purpose, the expression tree for Model T3 (Appendix A) and the MATLAB model were utilized to obtain the mathematical expression that could be further used for forecasting the RCP values and performing the sensitivity as well as parametric analysis. As a result, we derived Equation (1), which can predict the RCP values of concrete specimens using various input variables (i.e., age, amount of binder, Fag, Cag, w/b, MK and compressive strength). It is highly recommended to use the prediction equation for input variables whose ranges and mechanical properties are discussed in Section 2.1 (Database compilation) [48,49].
R C P T = ( F a g + A ) + ( ( C a g T ) ( w / b ) ) B + M K 2 + F a g 370.95 C W h e r e , A = ( ( w / b ) / T ) 2 ( C a g + b ) ( C a g b ) , b = ( 13.68 M K ) ( w / b ) 2 40.9 , C = C a g + ( 6.18 C S )

3.4. Parametric and Sensitivity Analyses

Parametric analysis is generally performed to verify the reliability of various AI models. Parametric analysis of all of the input parameters (age, b, Fag, Cag, w/b, MK and compressive strength) was carried out in order to assess their influence on the resulting RCPT of concrete specimens. Table 5 shows the possible combinations of the different input features that were adopted for the parametric analysis. For this purpose, the simulated dataset was generated such that one of the input variables (first variable, age) was varied between its extreme values in equal increments while keeping the remaining variables at their average values. In the next step, the amount of binder (second variable, and so on) was changed in a similar manner. This procedure was performed for all of the input variables. The corresponding change in the target variable was calculated using the prediction equation (Equation (1)). The changing input variables and the corresponding variation in the RCP values were plotted to obtain the parametric analysis. The net change in the target variable due to changing a particular input attribute was calculated in terms of weighted percentage in order to obtain the sensitivity of each variable. Note that the sensitivity analysis showed the response of the prediction model by varying the input features [40,50].
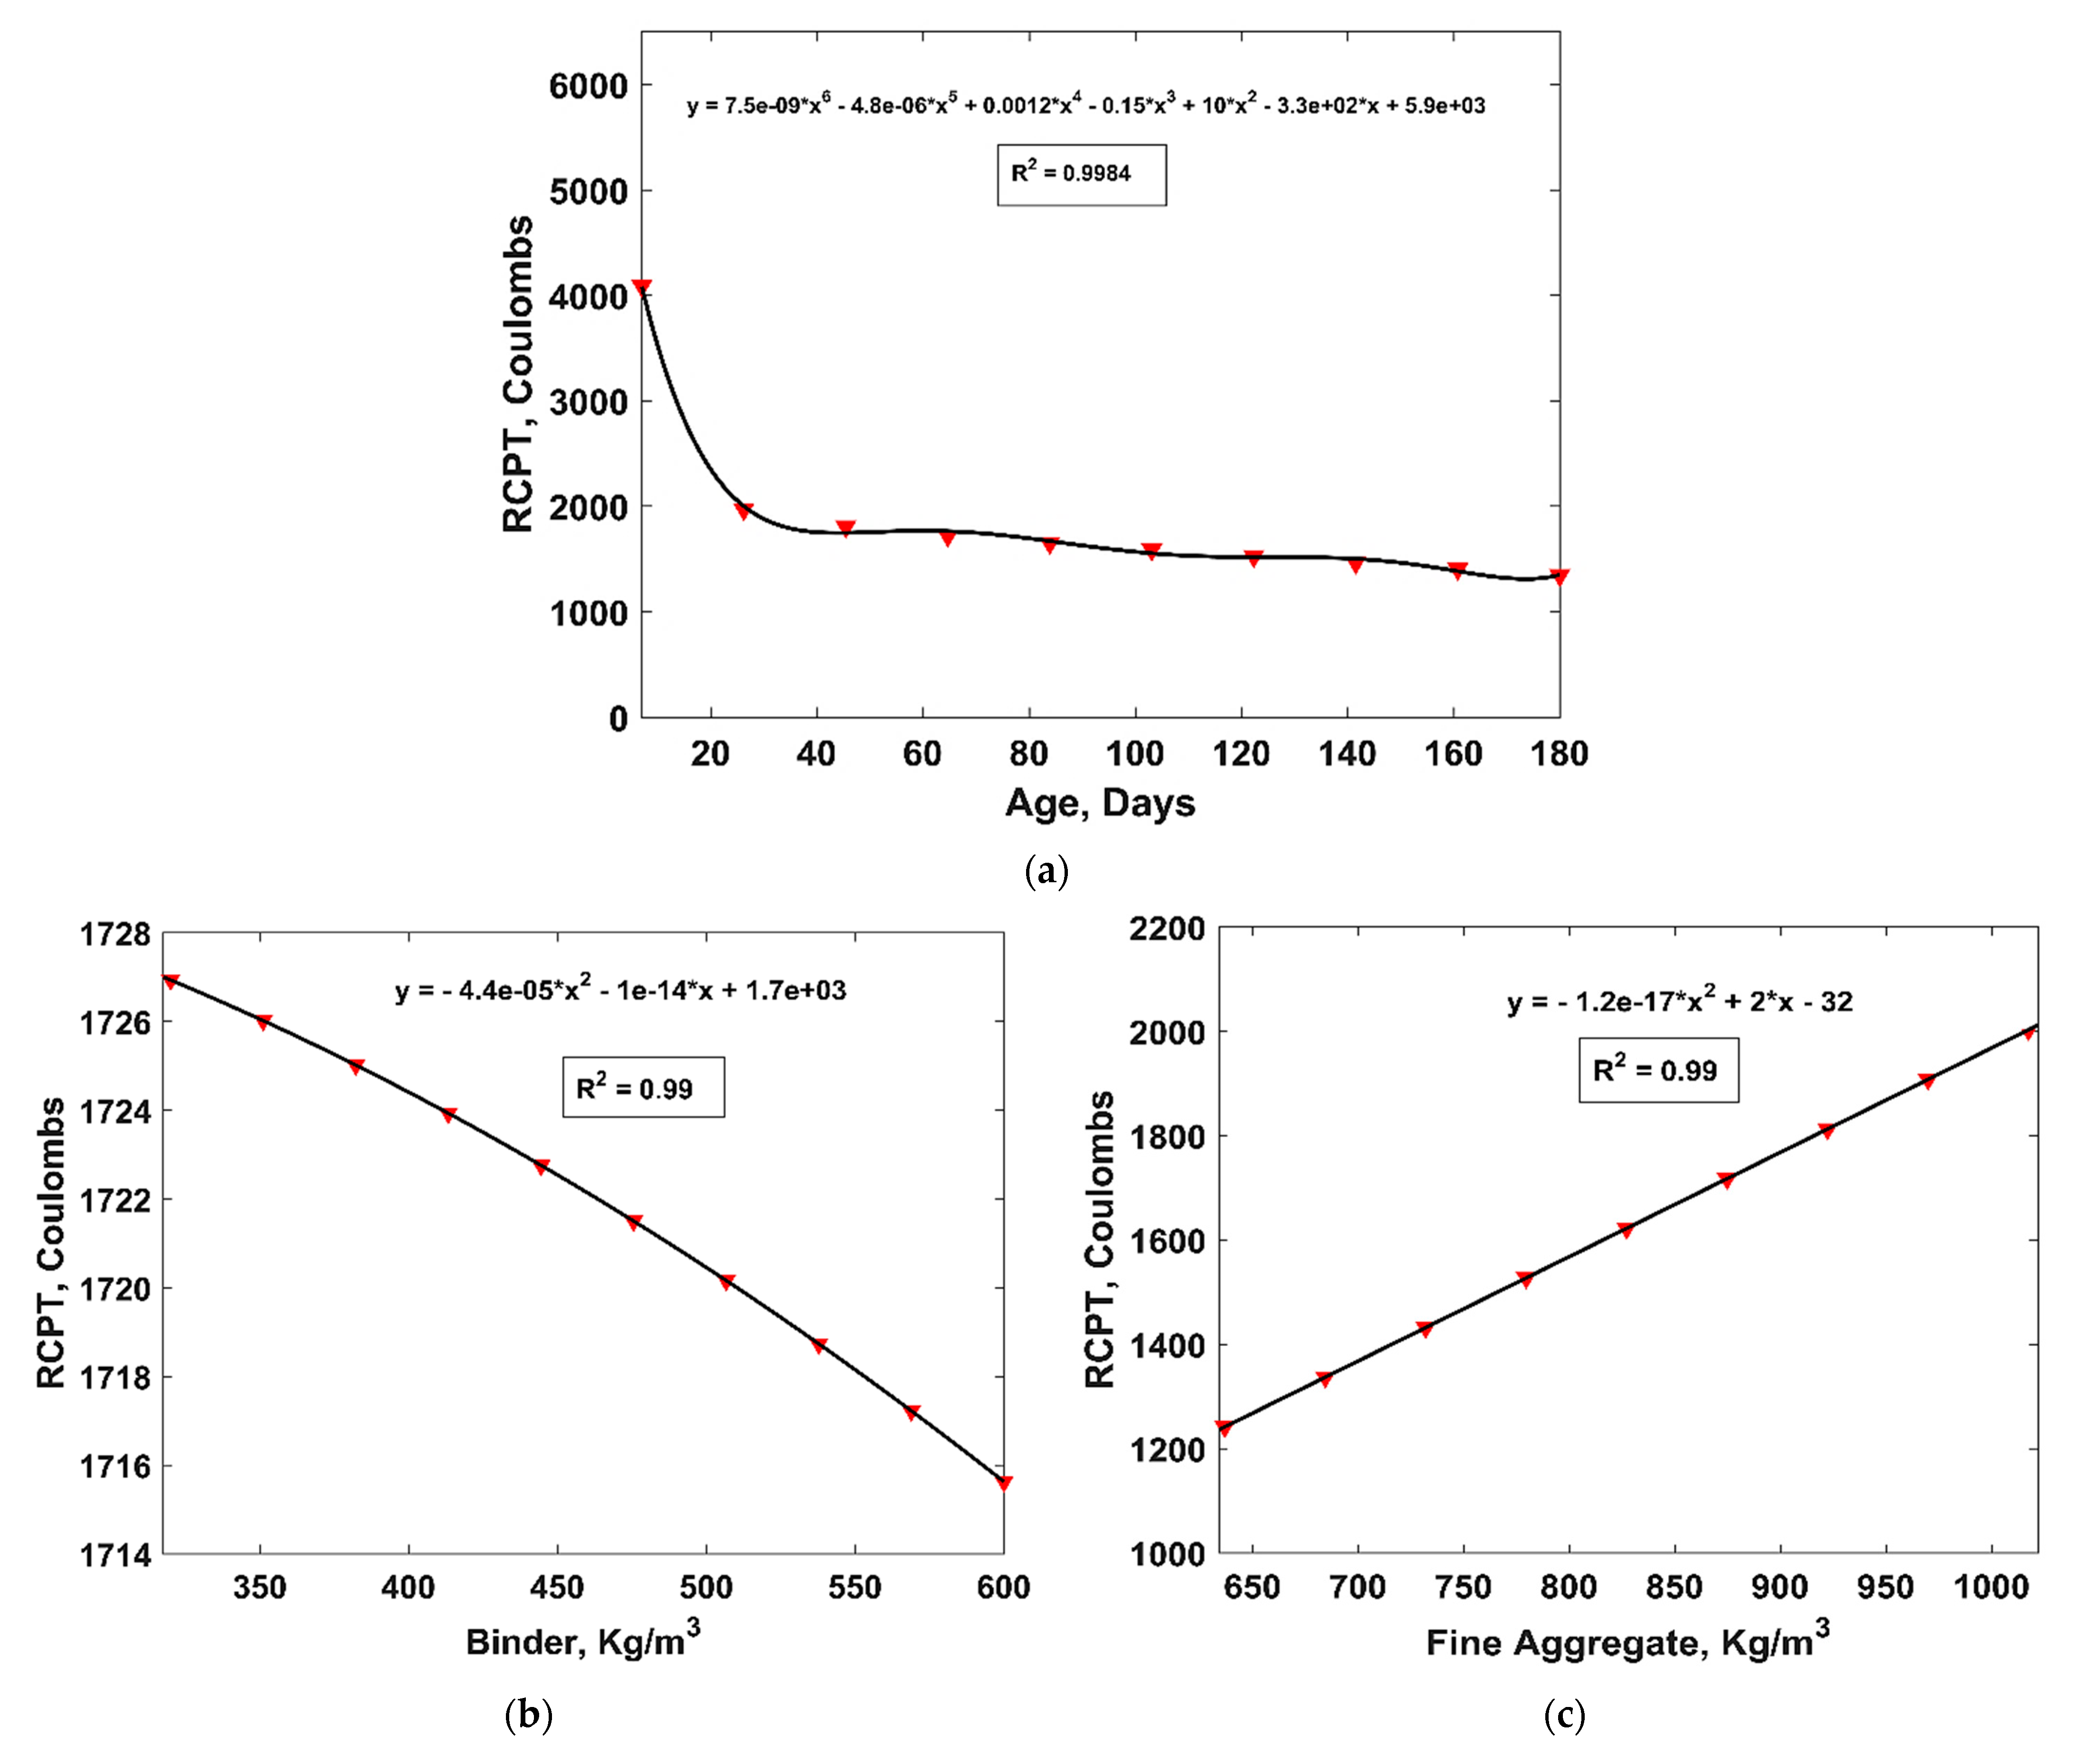
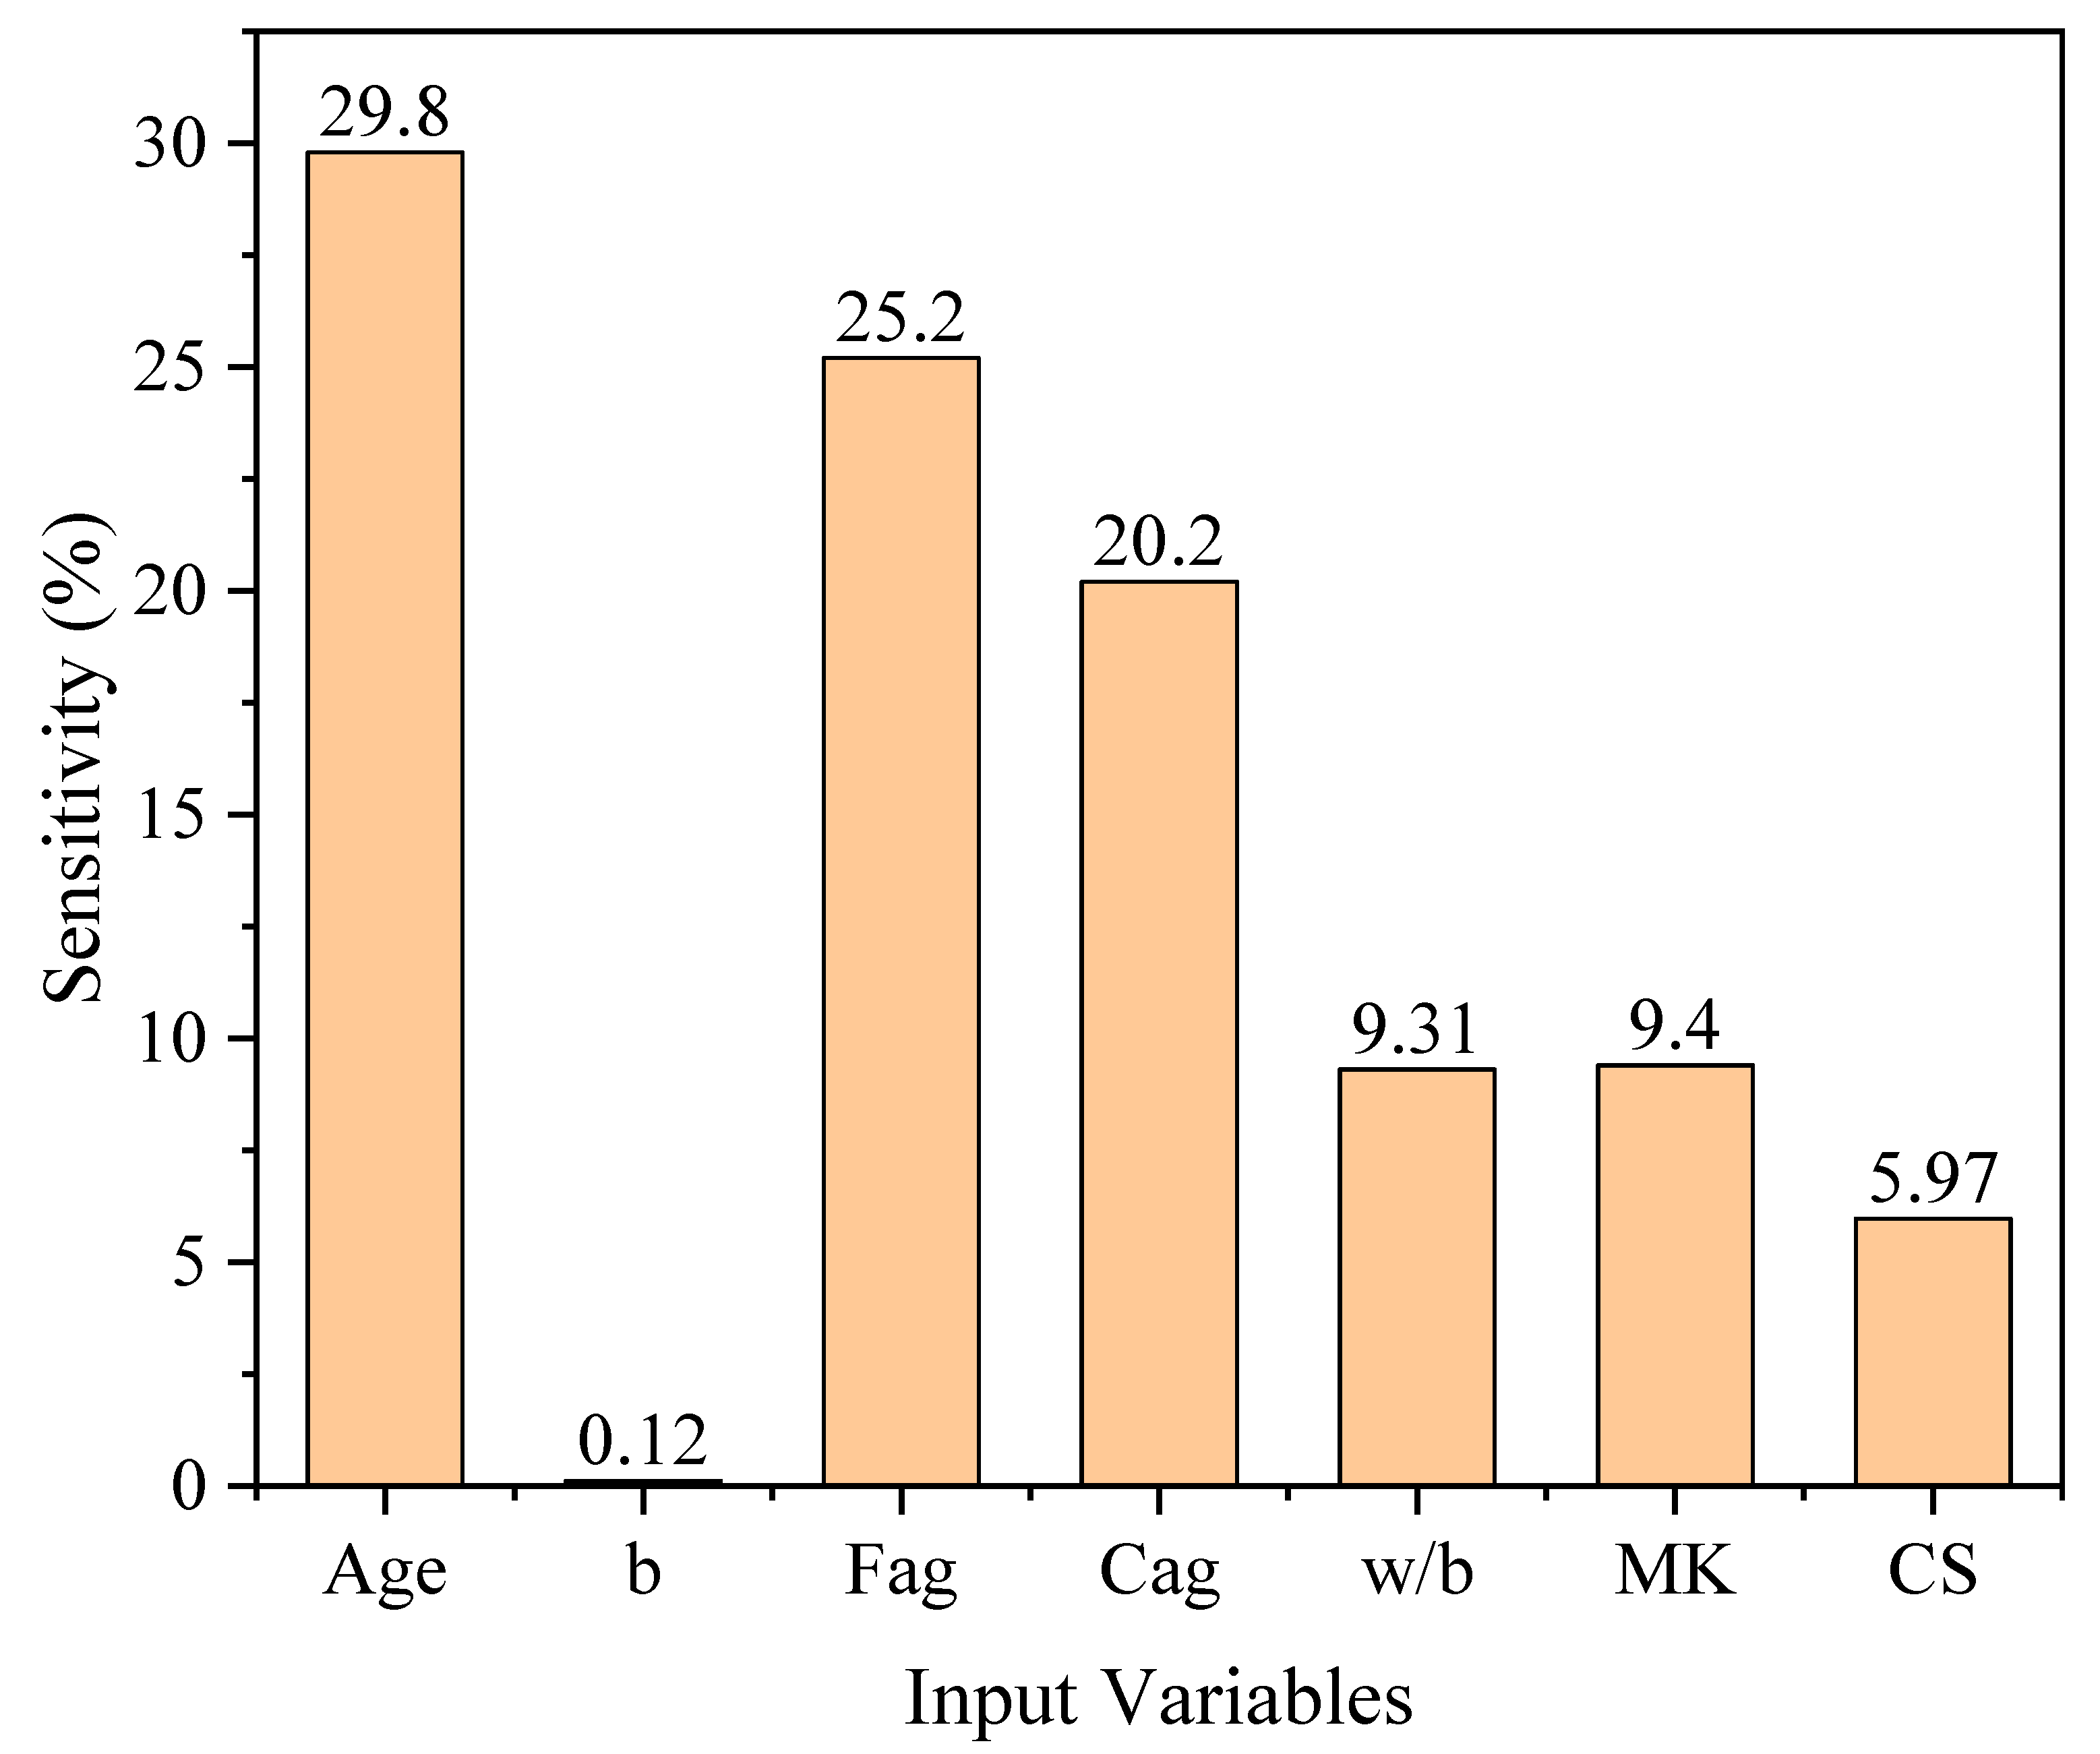
Figure 10 shows the variation in the RCP values in response to the change in each input variable. It is evident from Figure 10 that the RCP value decreased with the curing duration and increasing amount of b, compressive strength, and MK, while it increased with the amount of Fag, Cag and w/b ratio. The parametric analysis of the age of sample showed that the resistance of concrete specimens to RCP increases rapidly within the first 28 days after casting; however, it remains almost the same after 120 days. Similarly, polynomial equations were fitted to the resulting parametric analysis, which depicted good agreement with the datapoints, i.e., all of the cases had R2 above 0.97. Figure 11 shows the sensitivity of each variable in resisting chloride penetration. Concrete age is the most significant parameter that influences RCP values, followed by Fag, Cag, w/b ratio, MK content, and finally, the compressive strength of concrete.

4. Conclusions

This study was undertaken to evaluate the influence of different variables, such as age of the sample (age), amount of binder (b), fine aggregate (Fag) and coarse aggregate (Cag), water to binder ratio (w/b), metakaolin (MK), and the compressive strength on the RCP resistance of concrete using gene expression programming (GEP). For this purpose, the number of chromosomes (Nc), head size (Hs), and number of genes (Ng) of the GEP model were varied to study their influence on the predicted values of the RCP. Following are the main conclusions drawn from this study:
  • The tuning of the hyperparameter settings for the GEP model revealed that the model with Nc = 100, Hs = 8 and Ng = 3 (Model T3) resulted in an optimal GEP model, as evident from its high R2 values (i.e., 0.89 in the TR phase and 0.92 in the TS phase, respectively). Similarly, the values of RMSE = 513.9 and 464.1, and of MAE = 385.2 and 364.9, were also comparatively smaller than in all the other models in the TR and TS phases, respectively.
  • The regression slope analysis showed that the predicted values were in good agreement with the experimental values, as indicated from the higher R2 values. It was also observed that the performance of the models improved in the TS phase, which was reflected in their higher R2 values, with the majority of developed models having R2 > 0.8. In addition, the P/E ratio analysis revealed that Model T3 was the best performing model, because a larger frequency was observed for the P/E ratio proximal to one.
  • Similarly, the parametric analysis for the best performing Model T3 revealed that the amount of binder, compressive strength and age of the sample enhanced the RCP resistance of concrete specimens. However, among the different input variables, the RCP resistance sharply increased within the first 28 days of age of the concrete specimen.

Author Contributions

M.N.A.: Conceptualization, Funding acquisition, Resources, Project administration, Supervision, Writing—Review and Editing. M.R.: Conceptualization, Data curation, Software, Methodology, Investigation, Validation, Writing—Review and Editing, Writing—original draft. M.I.: Conceptualization, Funding acquisition, Resources, Project administration, Supervision, Writing—Review and Editing. K.K.: Funding acquisition, Resources, Project administration, Supervision. M.G.Q.: Funding acquisition, Resources. F.E.J.: Validation, Visualization. A.A.A.: Resources, Visualization. A.A.: Validation, Visualization. M.A.A.-F.: Funding acquisition, Resources. A.M.A.-A.: Resources, Visualization. All authors have read and agreed to the published version of the manuscript.

Funding

This work was supported by the Deanship of Scientific Research, Vice Presidency for Graduate Studies and Scientific Research, King Faisal University, Saudi Arabia (Project No. GRANT1553). All authors have read and agreed to the published version of the manuscript.

Institutional Review Board Statement

Not applicable.

Informed Consent Statement

Not applicable.

Data Availability Statement

The data used in this research have been properly cited and reported in the main text.

Acknowledgments

The authors acknowledge the Deanship of Scientific Research, Vice Presidency for Graduate Studies and Scientific Research, King Faisal University, Saudi Arabia (Project No. GRANT1553).

Conflicts of Interest

The authors declare no conflict of interest.

Abbreviations

Rapid chloride ion penetration RCP
Number of chromosomes Nc
Number of genes Ng
Head size Hs
Gene expression programmingGEP
Amount of binderb
Fine aggregateFag
Coarse aggregateCag
Water to binder ratiow/b
MetakaolinMK
Model predicted to experimentalP/E

Appendix A

Expression Trees Derived for GEP Modelling Used for the Development of Mathematical Equation are Given Below. Materials 15 06959 i001

References

  1. Szostak, B.; Golewski, G.L. Improvement of Strength Parameters of Cement Matrix with the Addition of Siliceous Fly Ash by Using Nanometric C-S-H Seeds. Energies 2020, 13, 6734. [Google Scholar] [CrossRef]
  2. Gruszczyński, M.; Lenart, M. Durability of mortars modified with the addition of amorphous aluminum silicate and silica fume. Theor. Appl. Fract. Mech. 2020, 107, 102526. [Google Scholar] [CrossRef]
  3. Szostak, B.; Golewski, G.L. Rheology of Cement Pastes with Siliceous Fly Ash and the CSH Nano-Admixture. Materials 2021, 14, 3640. [Google Scholar] [CrossRef]
  4. Neville, A.M.; Brooks, J.J. Concrete Technology, 2nd ed.; Pearson Education Canada: Toronto, ON, Canada, 2010; ISBN 978-0273732198. Available online: https://www.pearson.com/en-gb/subject-catalog/p/concrete-technology/P200000005115/9780273732198 (accessed on 30 August 2022).
  5. Neville, A.M. Properties of Concrete, 5th ed.; Prentice Hall: Hoboken, NJ, USA, 1963. [Google Scholar]
  6. Zhou, Z.; Sofi, M.; Liu, J.; Li, S.; Zhong, A.; Mendis, P. Nano-CSH modified high volume fly ash concrete: Early-age properties and environmental impact analysis. J. Clean. Prod. 2021, 286, 124924. [Google Scholar] [CrossRef]
  7. Tiwari, N.; Satyam, N. An experimental study on the behavior of lime and silica fume treated coir geotextile reinforced expansive soil subgrade. Eng. Sci. Technol. Int. J. 2020, 23, 1214–1222. [Google Scholar] [CrossRef]
  8. Aydin, S. Development of a high-temperature-resistant mortar by using slag and pumice. Fire Saf. J. 2008, 43, 610–617. [Google Scholar] [CrossRef]
  9. Kabay, N.; Miyan, N.; Özkan, H. Utilization of pumice powder and glass microspheres in cement mortar using paste replacement methodology. Constr. Build. Mater. 2021, 282, 122691. [Google Scholar] [CrossRef]
  10. Mehdipour, S.; Nikbin, I.M.; Dezhampanah, S.; Mohebbi, R.; Moghadam, H.H.; Charkhtab, S.; Moradi, A. Mechanical properties, durability and environmental evaluation of rubberized concrete incorporating steel fiber and metakaolin at elevated temperatures. J. Clean. Prod. 2020, 254, 120126. [Google Scholar] [CrossRef]
  11. Coffetti, D.; Crotti, E.; Gazzaniga, G.; Carrara, M.; Pastore, T.; Coppola, L. Pathways towards sustainable concrete. Cem. Concr. Res. 2022, 154, 106718. [Google Scholar] [CrossRef]
  12. Pachideh, G.; Gholhaki, M.; Ketabdari, H. Effect of pozzolanic wastes on mechanical properties, durability and microstructure of the cementitious mortars. J. Build. Eng. 2020, 29, 101178. [Google Scholar] [CrossRef]
  13. Wei, J.; Gencturk, B.; Jain, A.; Hanifehzadeh, M. Mitigating alkali-silica reaction induced concrete degradation through cement substitution by metakaolin and bentonite. Appl. Clay Sci. 2019, 182, 105257. [Google Scholar] [CrossRef]
  14. Sabir, B.; Wild, S.; Bai, J. Metakaolin and calcined clays as pozzolans for concrete: A review. Cem. Concr. Compos. 2001, 23, 441–454. [Google Scholar] [CrossRef]
  15. Khatib, J.M.; Hibbert, J.J. Selected engineering properties of concrete incorporating slag and metakaolin. Constr. Build. Mater. 2005, 19, 460–472. [Google Scholar] [CrossRef]
  16. Seleem, H.E.D.H.; Rashad, A.M.; El-Sabbagh, B.A. Durability and strength evaluation of high-performance concrete in marine structures. Constr. Build. Mater. 2010, 24, 878–884. [Google Scholar] [CrossRef]
  17. Vejmelková, E.; Pavlíková, M.; Keppert, M.; Keršner, Z.; Rovnaníková, P.; Ondráček, M.; Sedlmajer, M.; Černý, R. High performance concrete with Czech metakaolin: Experimental analysis of strength, toughness and durability characteristics. Constr. Build. Mater. 2010, 24, 1404–1411. [Google Scholar] [CrossRef]
  18. Parande, A.K.; Ramesh Babu, B.; Aswin Karthik, M.; Deepak Kumaar, K.K.; Palaniswamy, N. Study on strength and corrosion performance for steel embedded in metakaolin blended concrete/mortar. Constr. Build. Mater. 2008, 22, 127–134. [Google Scholar] [CrossRef]
  19. Sharma, R.; Khan, R.A. Sulfate resistance of self compacting concrete incorporating copper slag as fine aggregates with mineral admixtures. Constr. Build. Mater. 2021, 287, 122985. [Google Scholar] [CrossRef]
  20. ASTM C1202-19; Standard Test Method for Electrical Indication of Concrete’s Ability to Resist Chloride Ion Penetration. ASTM International: West Conshohocken, PA, USA, 2019. [CrossRef]
  21. Badogiannis, E.; Aggeli, E.; Papadakis, V.G.; Tsivilis, S. Evaluation of chloride-penetration resistance of metakaolin concrete by means of a diffusion—Binding model and of the k-value concept. Cem. Concr. Compos. 2015, 63, 1–7. [Google Scholar] [CrossRef]
  22. Homayoonmehr, R.; Ramezanianpour, A.A.; Mirdarsoltany, M. Influence of metakaolin on fresh properties, mechanical properties and corrosion resistance of concrete and its sustainability issues: A review. J. Build. Eng. 2021, 44, 103011. [Google Scholar] [CrossRef]
  23. Armaghani, D.J.; Asteris, P.G. A Comparative Study of ANN and ANFIS Models for the Prediction of Cement-Based Mortar Materials Compressive Strength; Springer: London, UK, 2021; Volume 33, ISBN 0123456789. [Google Scholar]
  24. Bardhan, A.; Biswas, R.; Kardani, N.; Iqbal, M.; Samui, P.; Singh, M.P.; Asteris, P.G. A novel integrated approach of augmented grey wolf optimizer and ANN for estimating axial load carrying-capacity of concrete-filled steel tube columns. Constr. Build. Mater. 2022, 337, 127454. [Google Scholar] [CrossRef]
  25. Koopialipoor, M.; Fallah, A.; Armaghani, D.J.; Azizi, A.; Mohamad, E.T. Three hybrid intelligent models in estimating flyrock distance resulting from blasting. Eng. Comput. 2019, 35, 243–256. [Google Scholar] [CrossRef] [Green Version]
  26. Baykasoǧlu, A.; Öztaş, A.; Özbay, E. Prediction and multi-objective optimization of high-strength concrete parameters via soft computing approaches. Expert Syst. Appl. 2009, 36, 6145–6155. [Google Scholar] [CrossRef]
  27. Topçu, I.B.; Saridemir, M. Prediction of compressive strength of concrete containing fly ash using artificial neural networks and fuzzy logic. Comput. Mater. Sci. 2008, 41, 305–311. [Google Scholar] [CrossRef]
  28. Saridemir, M. Predicting the compressive strength of mortars containing metakaolin by artificial neural networks and fuzzy logic. Adv. Eng. Softw. 2009, 40, 920–927. [Google Scholar] [CrossRef]
  29. Mohammadi Golafshani, E.; Arashpour, M.; Behnood, A. Predicting the compressive strength of green concretes using Harris hawks optimization-based data-driven methods. Constr. Build. Mater. 2022, 318, 125944. [Google Scholar] [CrossRef]
  30. Tien Bui, D.; Nhu, V.H.; Hoang, N.D. Prediction of soil compression coefficient for urban housing project using novel integration machine learning approach of swarm intelligence and Multi-layer Perceptron Neural Network. Adv. Eng. Inform. 2018, 38, 593–604. [Google Scholar] [CrossRef]
  31. Shariati, M.; Mafipour, M.S.; Ghahremani, B.; Azarhomayun, F.; Ahmadi, M.; Trung, N.T.; Shariati, A. A novel hybrid extreme learning machine–grey wolf optimizer (ELM-GWO) model to predict compressive strength of concrete with partial replacements for cement. Eng. Comput. 2022, 38, 757–779. [Google Scholar] [CrossRef]
  32. Khan, K.; Salami, B.A.; Iqbal, M.; Amin, M.N.; Ahmed, F.; Jalal, F.E. Compressive Strength Estimation of Fly Ash/Slag Based Green Concrete by Deploying Artificial Intelligence Models. Materials 2022, 15, 3722. [Google Scholar] [CrossRef]
  33. Kumar, S.; Rai, B.; Biswas, R.; Samui, P.; Kim, D. Prediction of rapid chloride permeability of self-compacting concrete using Multivariate Adaptive Regression Spline and Minimax Probability Machine Regression. J. Build. Eng. 2020, 32, 101490. [Google Scholar] [CrossRef]
  34. Ge, D.-M.; Zhao, L.-C.; Esmaeili-Falak, M. Estimation of rapid chloride permeability of SCC using hyperparameters optimized random forest models. J. Sustain. Cem.-Based Mater. 2022, 1–19. [Google Scholar] [CrossRef]
  35. Abu Yaman, M.; Abd Elaty, M.; Taman, M. Predicting the ingredients of self compacting concrete using artificial neural network. Alex. Eng. J. 2017, 56, 523–532. [Google Scholar] [CrossRef]
  36. Mohammadzadeh, S.D.; Bolouri Bazaz, J.; Alavi, A.H. An evolutionary computational approach for formulation of compression index of fine-grained soils. Eng. Appl. Artif. Intell. 2014, 33, 58–68. [Google Scholar] [CrossRef]
  37. Alavi, A.H.; Gandomi, A.H.; Sahab, M.G.; Gandomi, M. Multi expression programming: A new approach to formulation of soil classification. Eng. Comput. 2010, 26, 111–118. [Google Scholar] [CrossRef]
  38. Gandomi, A.H.; Roke, D.A. Assessment of artificial neural network and genetic programming as predictive tools. Adv. Eng. Softw. 2015, 88, 63–72. [Google Scholar] [CrossRef]
  39. Iqbal, M.F.; Liu, Q.F.; Azim, I.; Zhu, X.; Yang, J.; Javed, M.F.; Rauf, M. Prediction of mechanical properties of green concrete incorporating waste foundry sand based on gene expression programming. J. Hazard. Mater. 2020, 384, 121322. [Google Scholar] [CrossRef]
  40. Hanandeh, S.; Ardah, A.; Abu-Farsakh, M. Using artificial neural network and genetics algorithm to estimate the resilient modulus for stabilized subgrade and propose new empirical formula. Transp. Geotech. 2020, 24, 100358. [Google Scholar] [CrossRef]
  41. Al-Alaily, H.S.; Hassan, A.A.A. Refined statistical modeling for chloride permeability and strength of concrete containing metakaolin. Constr. Build. Mater. 2016, 114, 564–579. [Google Scholar] [CrossRef]
  42. Safarzadegan Gilan, S.; Bahrami Jovein, H.; Ramezanianpour, A.A. Hybrid support vector regression—Particle swarm optimization for prediction of compressive strength and RCPT of concretes containing metakaolin. Constr. Build. Mater. 2012, 34, 321–329. [Google Scholar] [CrossRef]
  43. Ramezanianpour, A.A.; Bahrami Jovein, H. Influence of metakaolin as supplementary cementing material on strength and durability of concretes. Constr. Build. Mater. 2012, 30, 470–479. [Google Scholar] [CrossRef]
  44. Asteris, P.G.; Skentou, A.D.; Bardhan, A.; Samui, P.; Pilakoutas, K. Predicting concrete compressive strength using hybrid ensembling of surrogate machine learning models. Cem. Concr. Res. 2021, 145, 106449. [Google Scholar] [CrossRef]
  45. Feng, D.-C.; Wang, W.-J.; Mangalathu, S.; Taciroglu, E. Interpretable XGBoost-SHAP Machine-Learning Model for Shear Strength Prediction of Squat RC Walls. J. Struct. Eng. 2021, 147, 04021173. [Google Scholar] [CrossRef]
  46. Onyelowe, K.C.; Iqbal, M.; Jalal, F.E.; Onyia, M.E.; Onuoha, I.C. Application of 3-algorithm ANN programming to predict the strength performance of hydrated-lime activated rice husk ash treated soil. Multiscale Multidiscip. Model. Exp. Des. 2021, 4, 259–274. [Google Scholar] [CrossRef]
  47. Iqbal, M.; Onyelowe, K.C.; Jalal, F.E. Smart computing models of California bearing ratio, unconfined compressive strength, and resistance value of activated ash-modified soft clay soil with adaptive neuro-fuzzy inference system and ensemble random forest regression techniques. Multiscale Multidiscip. Model. Exp. Des. 2021, 4, 207–225. [Google Scholar] [CrossRef]
  48. Wang, Z.; Zhao, X.L.; Xian, G.; Wu, G.; Singh Raman, R.K.; Al-Saadi, S.; Haque, A. Long-term durability of basalt- and glass-fibre reinforced polymer (BFRP/GFRP) bars in seawater and sea sand concrete environment. Constr. Build. Mater. 2017, 139, 467–489. [Google Scholar] [CrossRef]
  49. Kafodya, I.; Xian, G.; Li, H. Durability study of pultruded CFRP plates immersed in water and seawater under sustained bending: Water uptake and effects on the mechanical properties. Compos. Part B Eng. 2015, 70, 138–148. [Google Scholar] [CrossRef]
  50. Liu, Q.F.; Iqbal, M.F.; Yang, J.; Lu, X.Y.; Zhang, P.; Rauf, M. Prediction of chloride diffusivity in concrete using artificial neural network: Modelling and performance evaluation. Constr. Build. Mater. 2021, 268, 121082. [Google Scholar] [CrossRef]
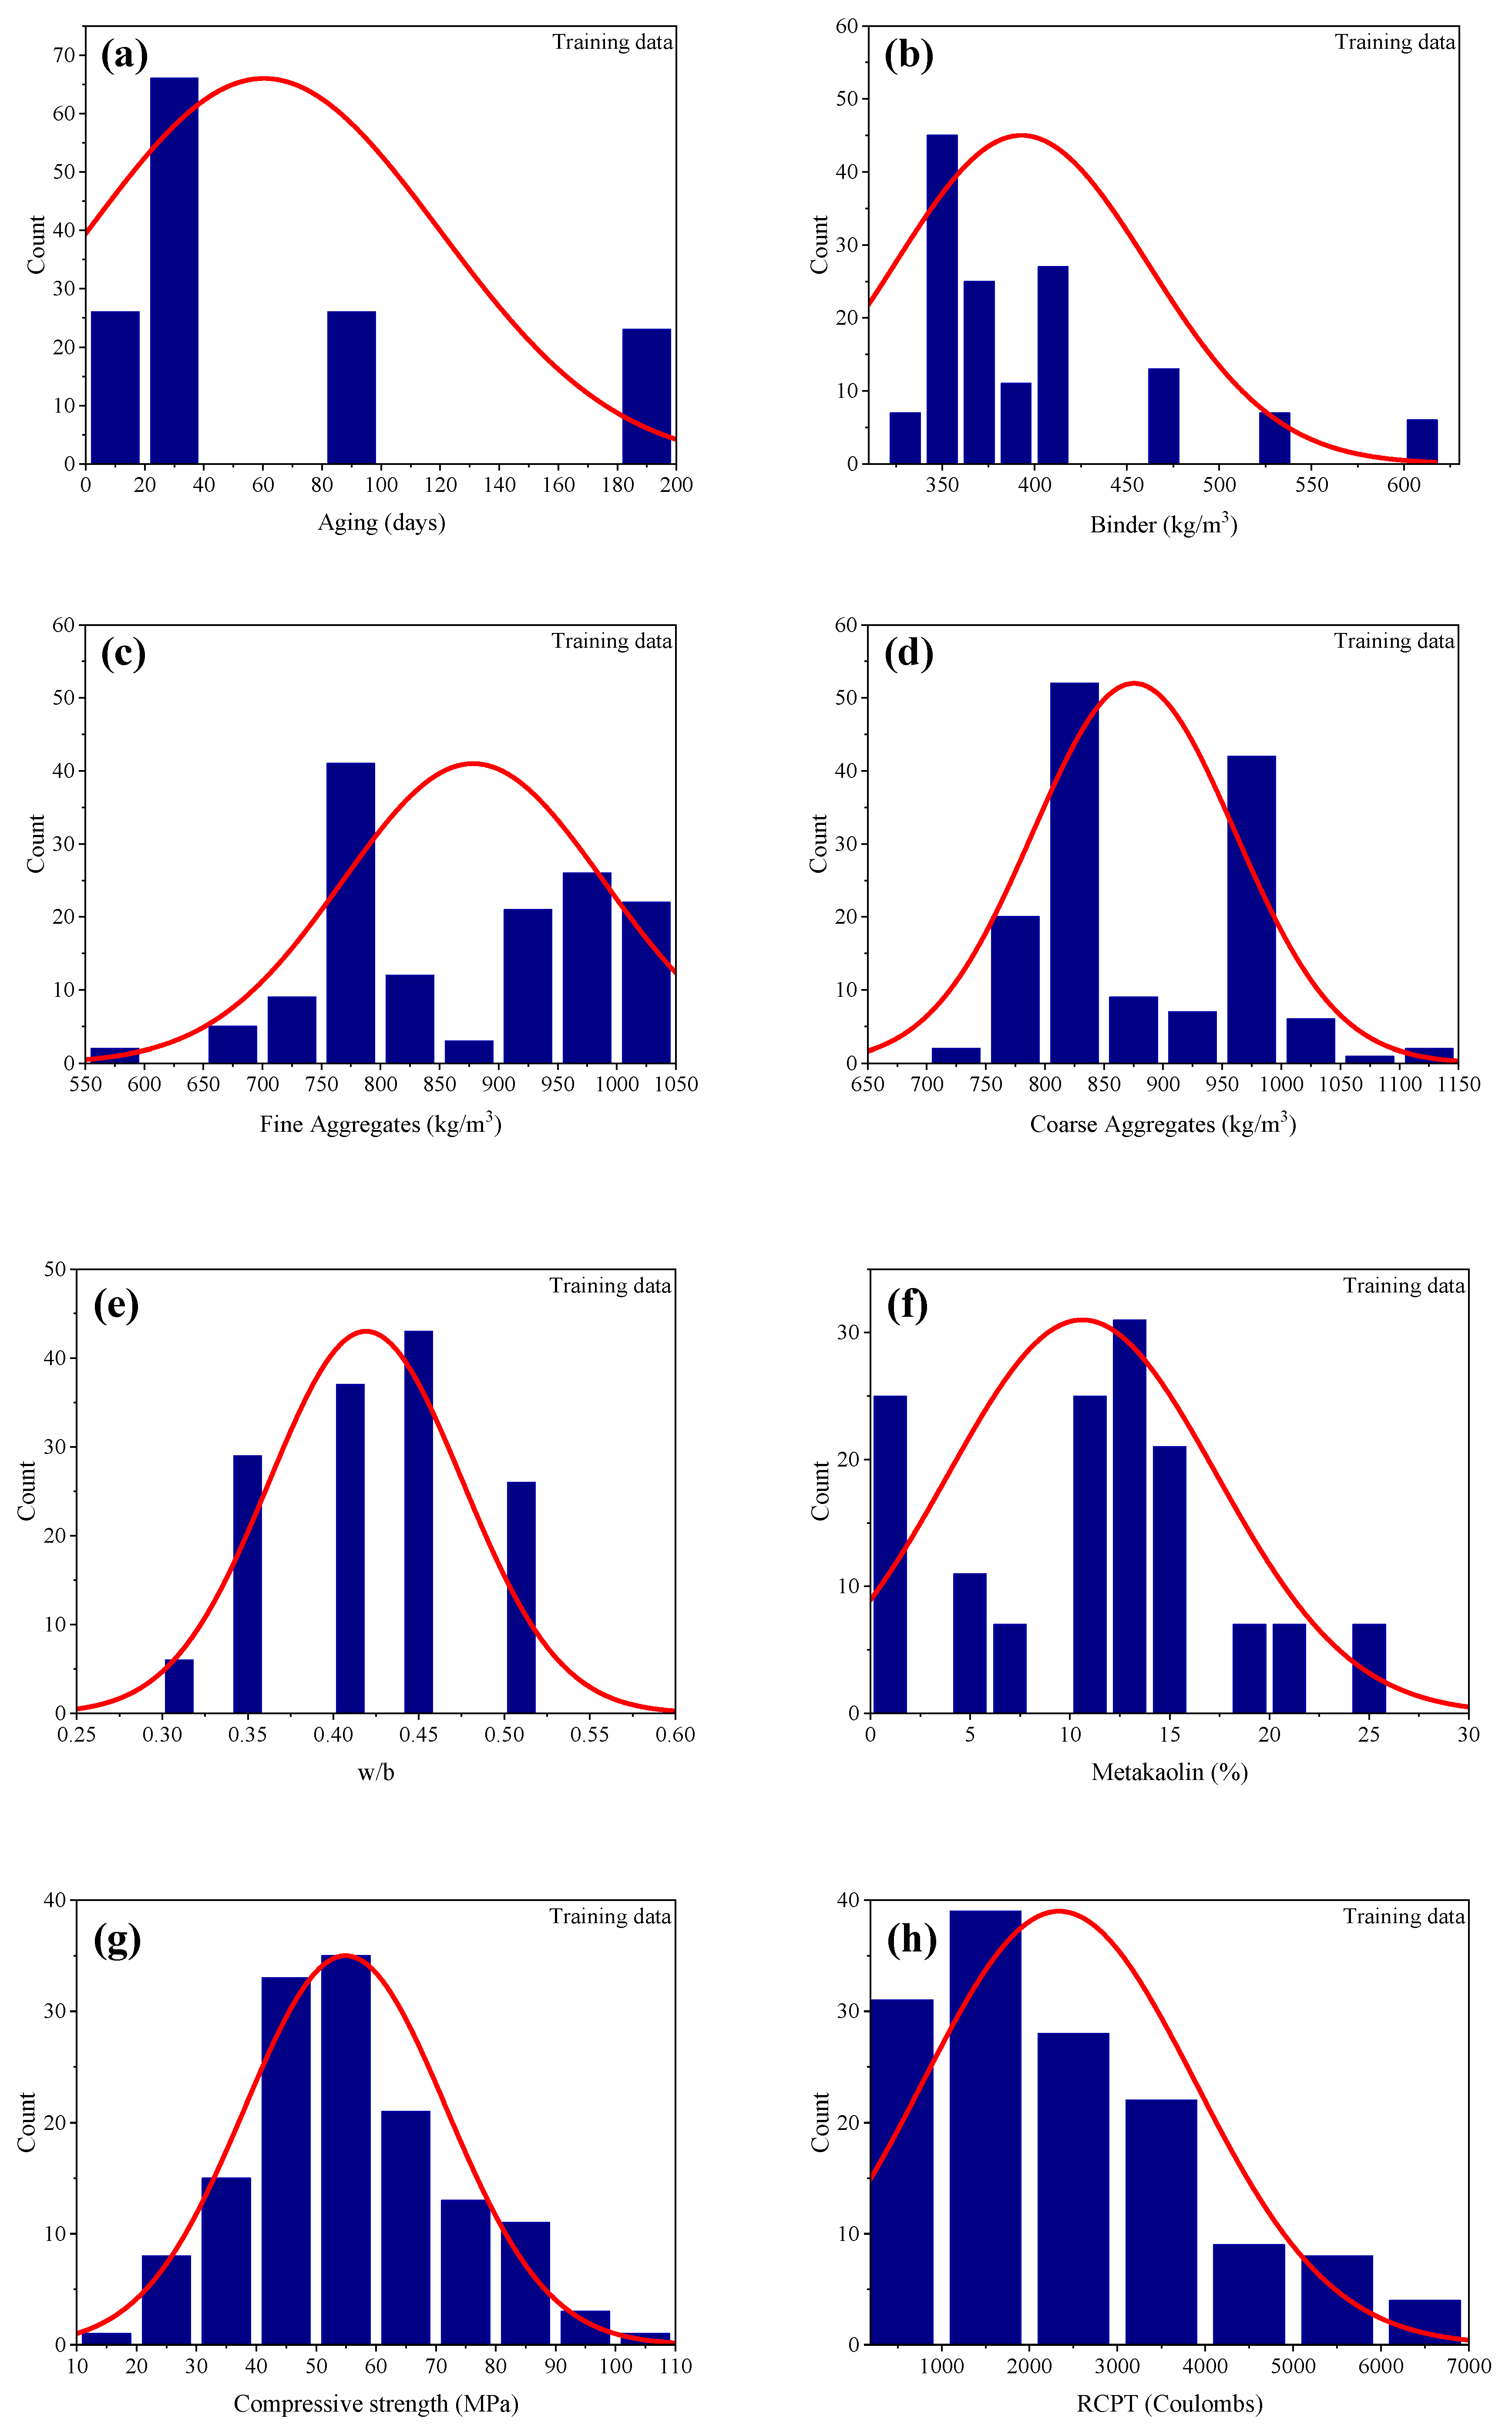
Figure 1. Frequency histograms of input and output variables; Training dataset (dark blue histograms) and test data (pink colored histograms) (ah) for age, binder, fine aggregate, coarse aggregate, w/b ratio, metakaolin, compression strength and RCPT, respectively.
Materials 15 06959 g001aMaterials 15 06959 g001b
Figure 2. Flowchart of GEP modelling.
Materials 15 06959 g002
Figure 3. Effect of number of chromosomes on the performance of models. (a) MAE, (b) RMSE, (c) R2.
Materials 15 06959 g003
Figure 4. Effect of number of genes on the performance of models. (a) R2, (b) RMSE, (c) MAE.
Materials 15 06959 g004aMaterials 15 06959 g004b
Figure 5. Effect of head size on the performance of models. (a) RMSE, (b) R2, (c) MAE.
Materials 15 06959 g005
Figure 6. Comparison of regression slopes for the developed models in TR phase.
Materials 15 06959 g006
Figure 7. Comparison of regression slopes for the developed models in TS phase.
Materials 15 06959 g007
Figure 8. P/E ratio distribution of best performing model T3. (a) TR phase, (b) TS phase.
Materials 15 06959 g008
Figure 9. Taylor diagram for the proposed models. (a) Training phase, (b) Testing phase.
Materials 15 06959 g009
Figure 10. Parametric analysis of input variables. (a) age, (b) binder, (c) Fag, (d) Cag, (e) w/b ratio, (f) MK, and (g) compressive strength.
Materials 15 06959 g010aMaterials 15 06959 g010b
Figure 11. Sensitivity analysis of all input variables.
Materials 15 06959 g011
Table 1. Descriptive statistics of the input variables.
Descriptive StatisticsAgebFagCagw/bMKCompressive StrengthRCPT
Average63.53389.920.4210.76878.46874.9755.112309.98
Standard Error4.354.880.0040.487.706.181.19111.36
Median283600.4512.5881.30832.552.71973
Standard Deviation61.6369.210.0586.74109.2187.6917.011578.79
Sample Variance3798.464790.430.00345.4111,925.887689.79289.302492.57 × 103
Kurtosis−0.422.19−0.90−0.49−0.99−0.82−0.310.11
Skewness1.041.69−0.24−0.10−0.250.340.250.93
Minimum73200.30589.270719203
Maximum1806000.5251017.51111.71086982
Table 2. Details of 11 GEP trials conducted for evaluating the most optimal model.
Trial/Model No. of VariablesNo. of ChromosomesHead SizeNo. of GenesTR PhaseTS Phase
R2RMSEMAER2RMSEMAE
T1730830.84602.1475.30.92478.2386.6
T2650830.81681.3483.30.90526.6424
T37100830.89513.9385.20.92464.1364.9
T47150830.83641.3483.30.92482.7383.1
T56200830.79641.3568.30.89562.2477.3
T67100930.78723.3538.00.89561.9433.1
T771001030.78728.7593.50.88625.6521.3
T871001130.83641.2469.60.89527.2423.5
T971001230.87564.84470.92478.9399.3
T106100840.83634.2477.10.89567.7451.5
T117100850.88525.3394.80.91494.6387.7
Table 3. Ideal values of performance indices.
IndexRange/Ideal Value
R2(0–1)/1
RMSE(0)/0
MAE(0)/0
Table 4. Ranking of the GEP models (for 11 trials) based on R2 and RMSE.
StatisticR2RMSEMAE
Rank1st2nd1st2nd1st2nd
TR PhaseT3T11T3T11T3T11
TS PhaseT3, T1-T3T1T3T4
Table 5. Dataset used for parametric analysis.
Input VariablesConstant Input ParametersNo. of Datapoints
ParameterRange
Age7–180B = 389.93, w/b = 0.42, MK = 10.76, Fag = 878.46, Cag = 874.97, compressive strength = 55.129
b320–600Age = 63.53, w/b = 0.42, MK = 10.76, Fag = 878.46, Cag = 874.97, compressive strength = 55.12
Fag589.2–1017.5Age = 63.53, B = 389.93, w/b = 0.42, MK = 10.76, Cag = 874.97, compressive strength = 55.12
Cag707–1111.7Age = 63.53, B = 389.93, w/b = 0.42, MK = 10.76, Fag = 878.46, compressive strength = 55.12
w/b0.3–0.5Age = 63.53, B = 389.93, MK = 10.76, Fag = 878.46, Cag = 874.97, compressive strength = 55.12
MK0–25Age = 63.53, B = 389.93, w/b = 0.42, Fag = 878.46, Cag = 874.97, compressive strength = 55.12
compressive strength19–108Age = 63.53, B = 389.93, w/b = 0.42, MK = 10.76, Fag = 878.46, Cag = 874.97
Publisher’s Note: MDPI stays neutral with regard to jurisdictional claims in published maps and institutional affiliations.