
Enhancement of Efficiency of a TiO2-BiFeO3 Dye-Synthesized Solar Cell through Magnetization


Abstract
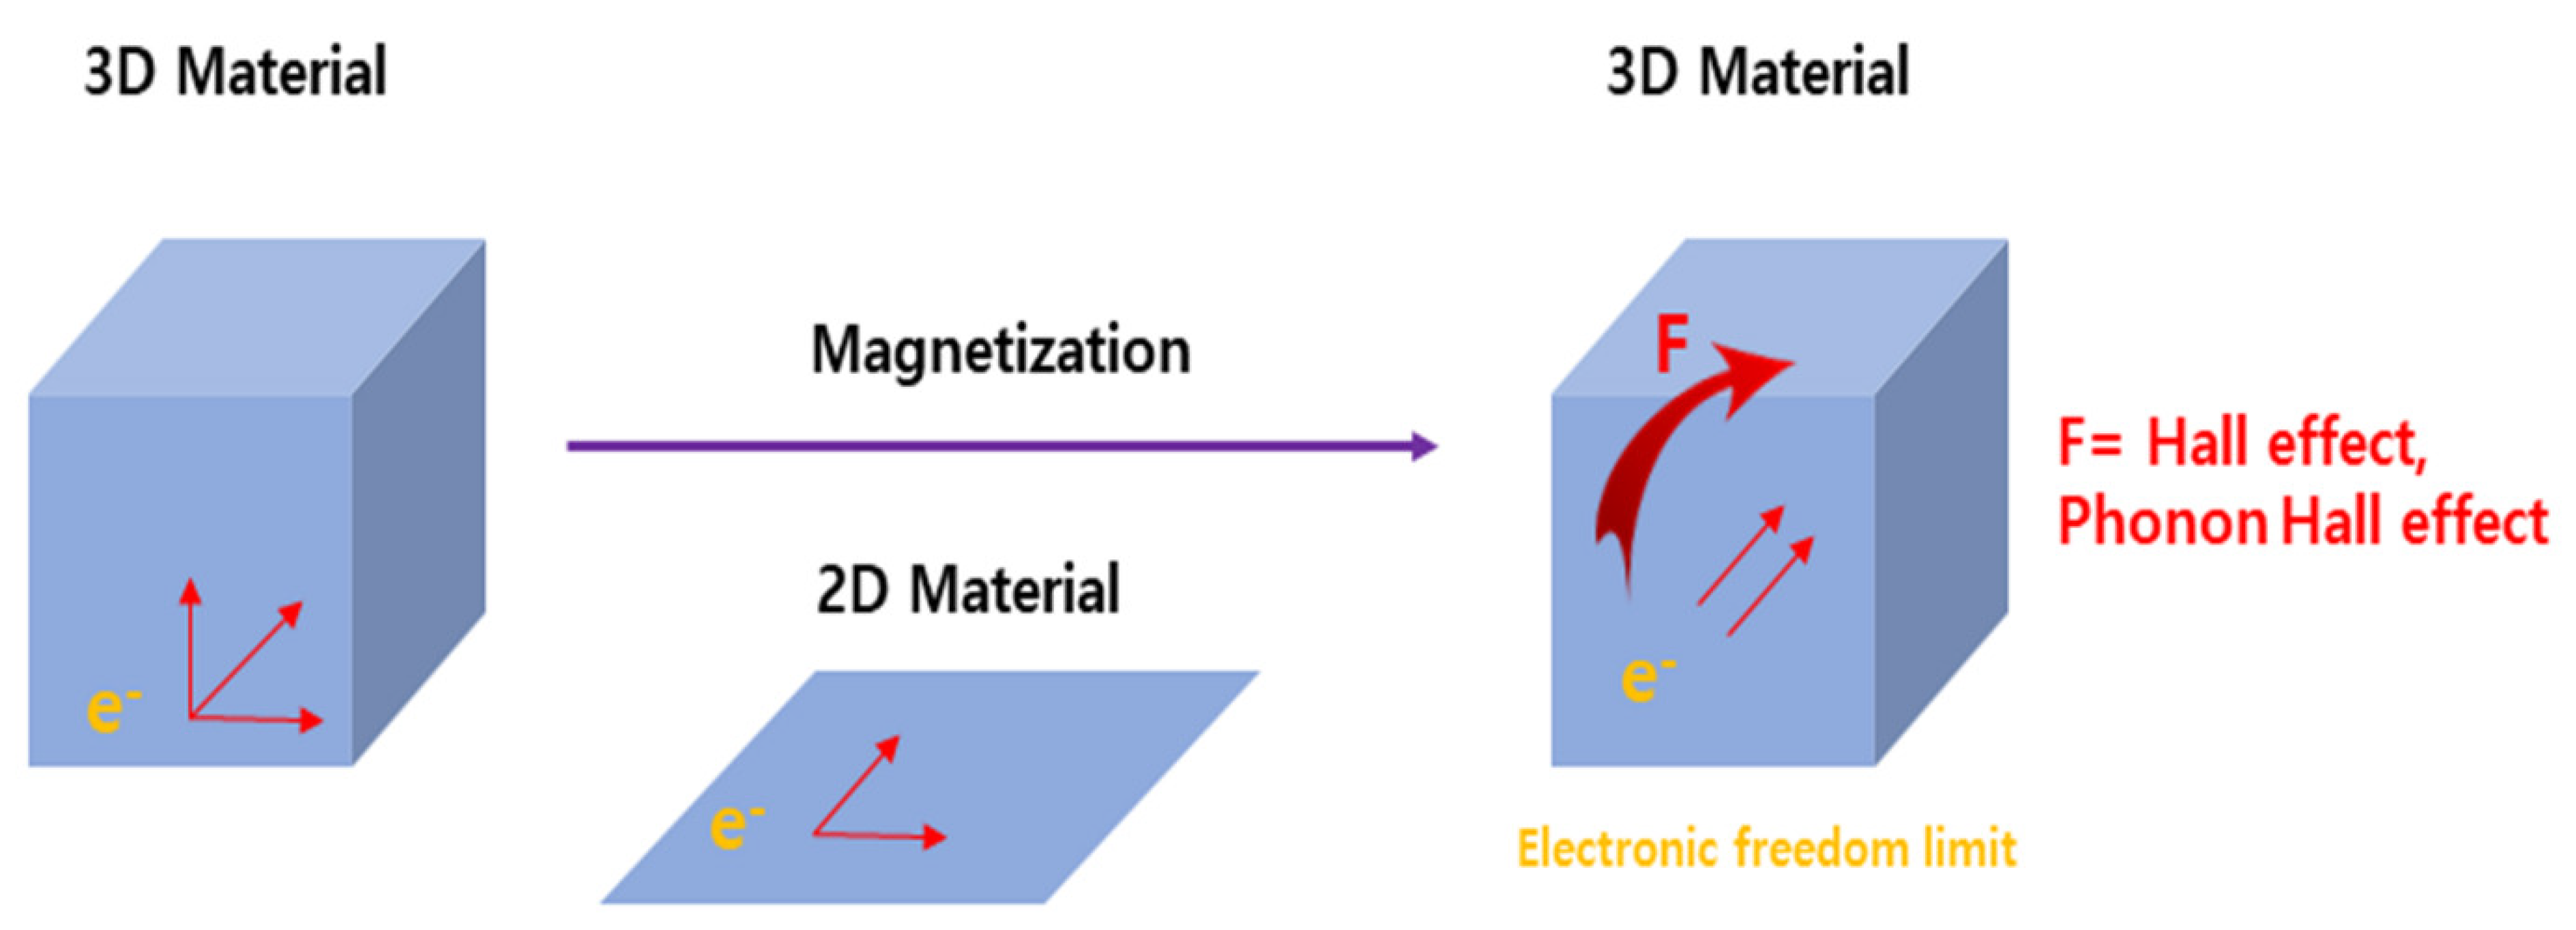
:1. Introduction
2. Materials and Methods
2.1. Synthesis of BiFeO3
2.2. Synthesis of TiO2-BiFeO3 Paste
2.3. Fabrication of the TiO2-BiFeO3 DSSC
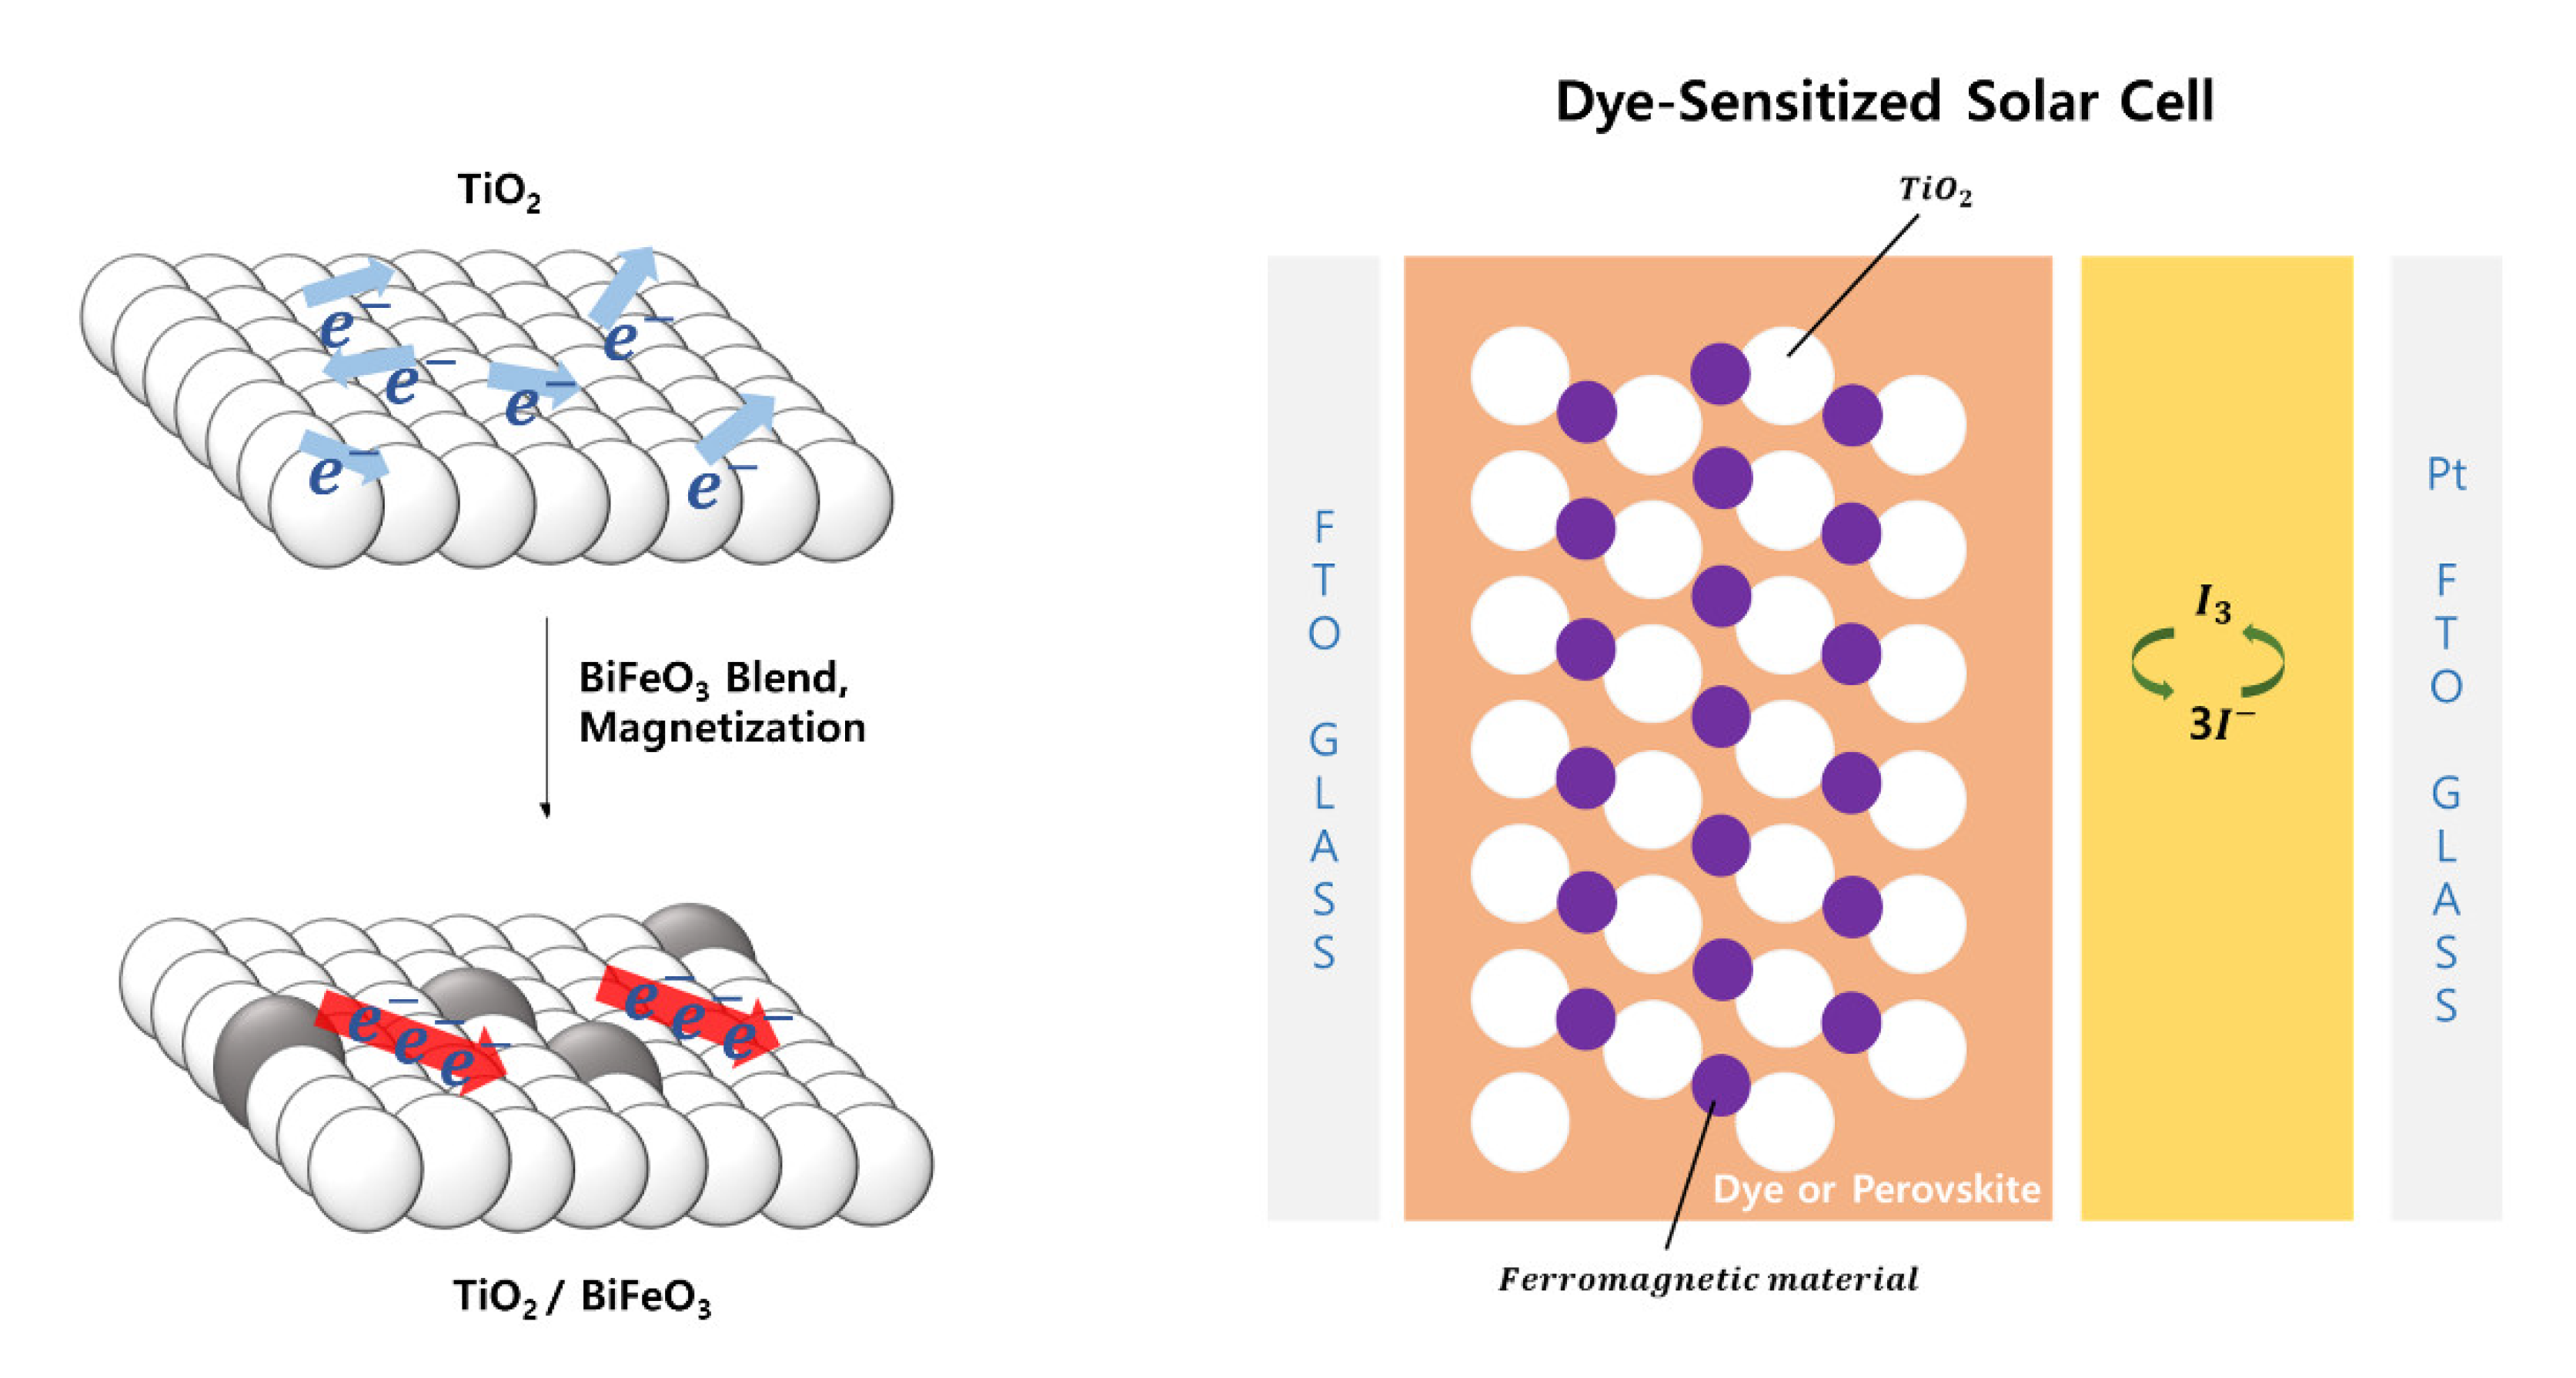
2.4. Fabrication of the Magnetized TiO2-BiFeO3 DSSC
2.5. Characterization
3. Result and Discussion
3.1. XRD Analysis
3.2. BiFeO3 Hysteresis and SEM Analysis
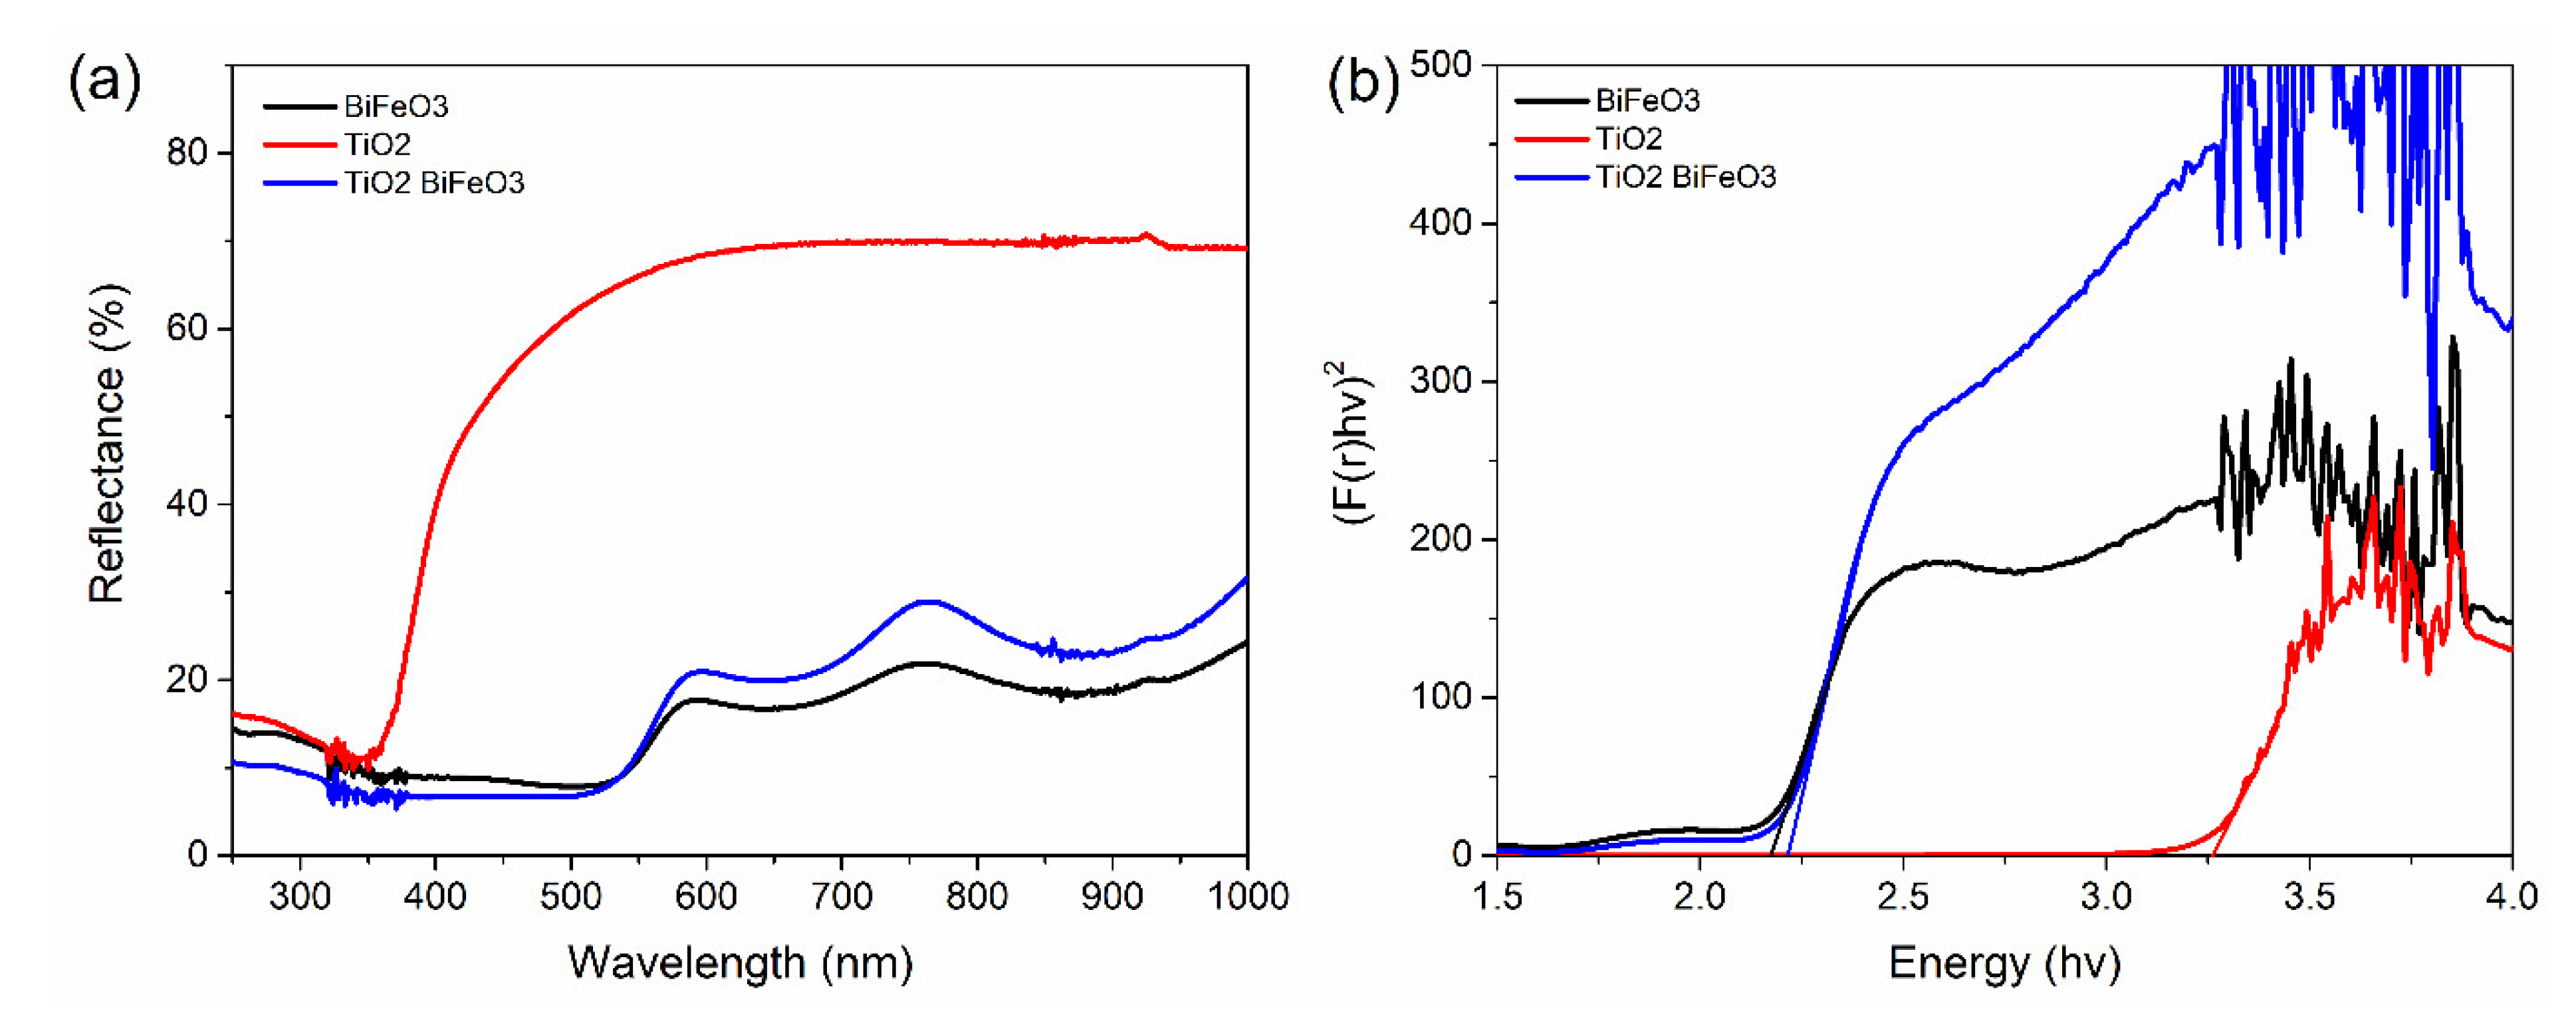
3.3. Absorption Spectra
3.4. FTIR Spectrum
3.5. Raman Spectrum
3.6. Photoelectrical Performance of an As-Fabricated and Magnetized TiO2-BiFeO3 DSSC
3.6.1. As-Fabricated TiO2-BiFeO3 DSSC
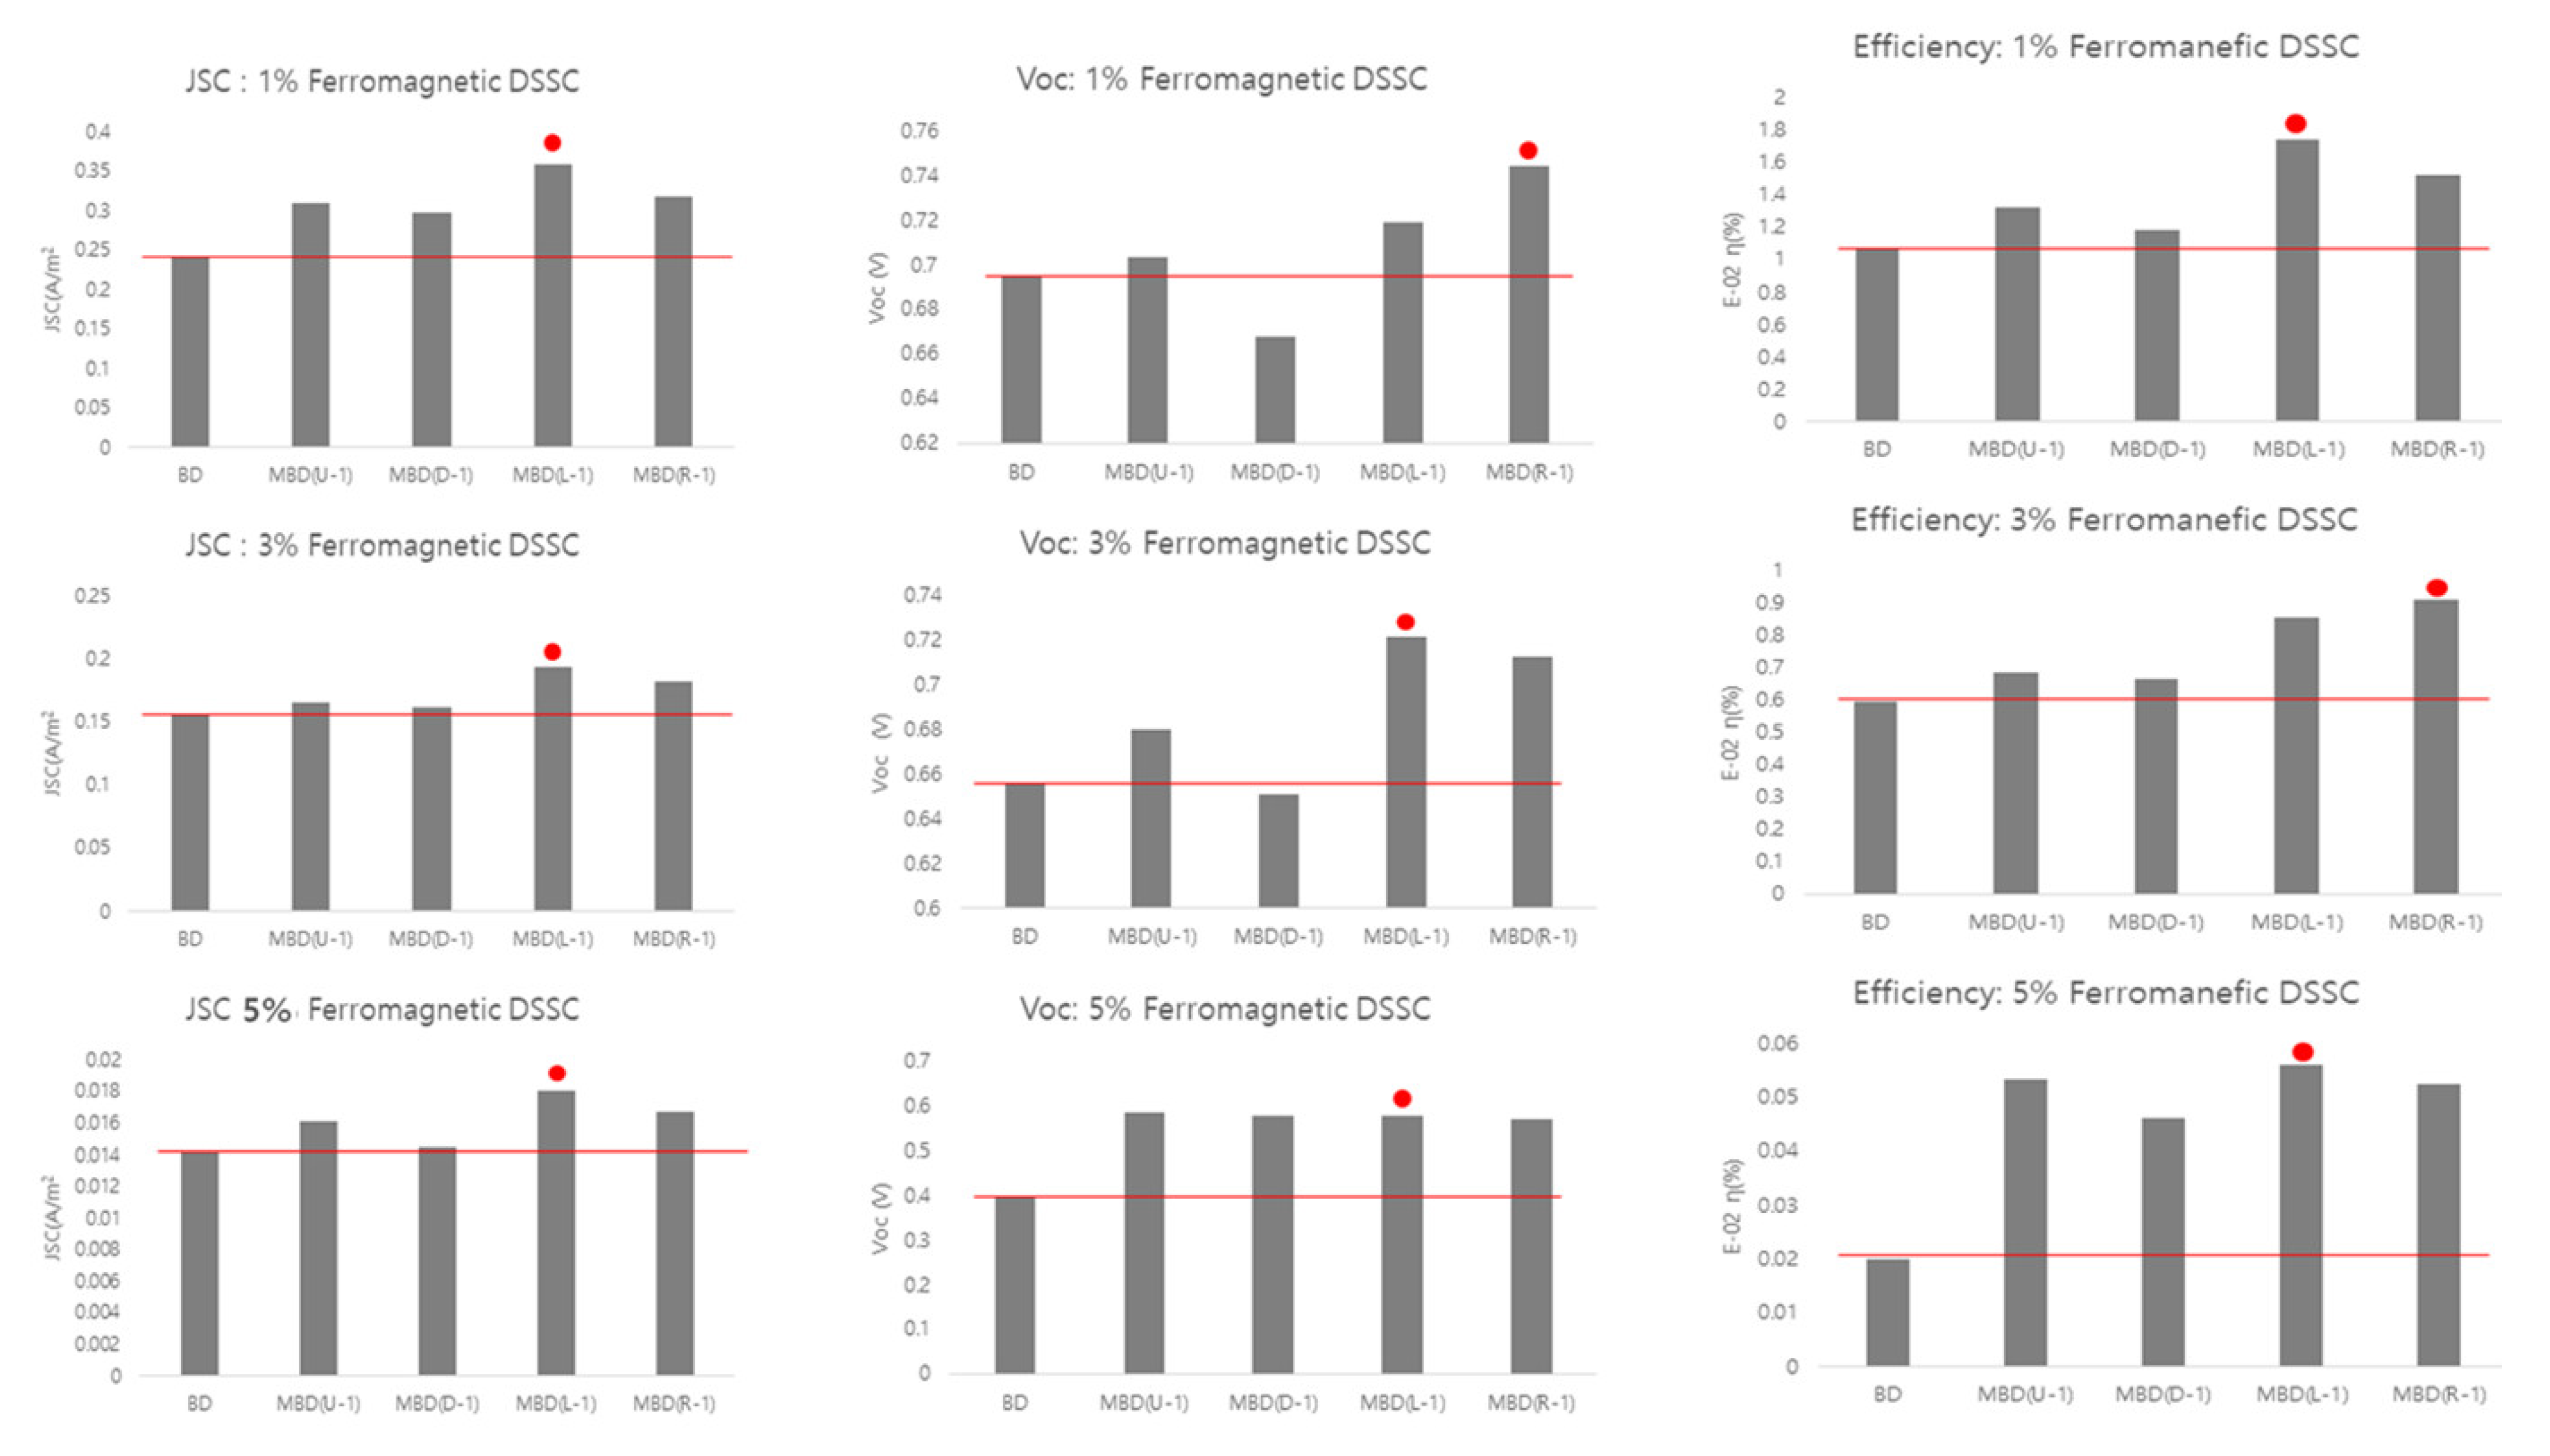
3.6.2. Magnetized TiO2-BiFeO3 DSSC
4. Conclusions
Supplementary Materials
Author Contributions
Funding
Institutional Review Board Statement
Informed Consent Statement
Data Availability Statement
Acknowledgments
Conflicts of Interest
References
- Khan, K.; Tareen, A.K.; Aslam, M.; Wang, R.; Zhang, Y.; Mahmood, A.; Ouyang, Z.; Zhang, H.; Guo, Z. Recent Developments in Emerging Two-Dimensional Materials and Their Applications. J. Mater. Chem. C 2020, 8, 387–440. [Google Scholar] [CrossRef]
- Zavabeti, A.; Jannat, A.; Zhong, L.; Haidry, A.A.; Yao, Z.; Ou, J.Z. Two-Dimensional Materials in Large-Areas: Synthesis, Properties and Applications. Nano-Micro Lett. 2020, 12, 66. [Google Scholar] [CrossRef] [PubMed]
- Li, X.; Tao, L.; Chen, Z.; Fang, H.; Li, X.; Wang, X.; Xu, J.-B.; Zhu, H. Graphene and Related Two-Dimensional Materials: Structure-Property Relationships for Electronics and Optoelectronics. Appl. Phys. Rev. 2017, 4, 021306. [Google Scholar] [CrossRef]
- Wang, L.; Hu, P.; Long, Y.; Liu, Z.; He, X. Recent Advances in Ternary Two-Dimensional Materials: Synthesis, Properties and Applications. J. Mater. Chem. A 2017, 5, 22855–22876. [Google Scholar] [CrossRef]
- Wang, J.; Ma, F.; Sun, M. Graphene, Hexagonal Boron Nitride, and Their Heterostructures: Properties and Applications. RSC Adv. 2017, 7, 16801–16822. [Google Scholar] [CrossRef]
- Schmid, H. Multi-Ferroic Magnetoelectrics. Ferroelectrics 1994, 162, 317–338. [Google Scholar] [CrossRef]
- Yin, L.; Mi, W. Progress in BiFeO3-Based Heterostructures: Materials, Properties and Applications. Nanoscale 2020, 12, 477–523. [Google Scholar] [CrossRef]
- Kim, S.J.; Han, S.H.; Kim, H.G.; Kim, A.Y.; Kim, J.S.; Cheon, C.I. Multiferroic Properties of Ti-Doped BiFeO3 Ceramics. J. Korean Phys. Soc. 2010, 56, 439–442. [Google Scholar] [CrossRef]
- Silva, J.; Reyes, A.; Esparza, H.; Camacho, H.; Fuentes, L. BiFeO3: A Review on Synthesis, Doping and Crystal Structure. Integr. Ferroelectr. 2011, 126, 47–59. [Google Scholar] [CrossRef]
- Yun, K.Y.; Noda, M.; Okuyama, M.; Saeki, H.; Tabata, H.; Saito, K. Structural and Multiferroic Properties of BiFeO3 Thin Films at Room Temperature. J. Appl. Phys. 2004, 96, 3399–3403. [Google Scholar] [CrossRef]
- Čebela, M.; Zagorac, D.; Batalović, K.; Radaković, J.; Stojadinović, B.; Spasojević, V.; Hercigonja, R. BiFeO3 Perovskites: A Multidisciplinary Approach to Multiferroics. Ceram. Int. 2017, 43, 1256–1264. [Google Scholar] [CrossRef]
- Shalybkov, D.A.; Urpin, V.A. The Hall Effect and Oscillating Decay of a Magnetic Field. Tech. Phys. 2000, 45, 147–152. [Google Scholar] [CrossRef]
- Ortiz-Quiñonez, J.L.; Díaz, D.; Zumeta-Dubé, I.; Arriola-Santamaría, H.; Betancourt, I.; Santiago-Jacinto, P.; Nava-Etzana, N. Easy Synthesis of High-Purity BiFeO3 Nanoparticles: New Insights Derived from the Structural, Optical, and Magnetic Characterization. Inorg. Chem. 2013, 52, 10306–10317. [Google Scholar] [CrossRef]
- Ito, S.; Chen, P.; Comte, P.; Nazeeruddin, M.K.; Liska, P.; Péchy, P.; Grätzel, M. Fabrication of Screen-Printing Pastes from TiO2 Powders for Dye-Sensitised Solar Cells. Prog. Photovolt. Res. Appl. 2007, 15, 603–612. [Google Scholar] [CrossRef]
- Hao, N.H.; Gyawali, G.; Sekino, T.; Lee, S.W. Fabrication of a TiO2-P25/(TiO2-P25+TiO2 Nanotubes) Junction for Dye Sensitized Solar Cells. Prog. Nat. Sci. Mater. Int. 2016, 26, 375–379. [Google Scholar] [CrossRef]
- Wu, J.; Mao, S.; Ye, Z.G.; Xie, Z.; Zheng, L. Room-Temperature Ferromagnetic/Ferroelectric BiFeO3 Synthesized by a Self-Catalyzed Fast Reaction Process. J. Mater. Chem. 2010, 20, 6512–6516. [Google Scholar] [CrossRef]
- Sathyajothi, S.; Jayavel, R.; Dhanemozhi, A.C. The Fabrication of Natural Dye Sensitized Solar Cell (Dssc) Based on TiO2 Using Henna And Beetroot Dye Extracts. Mater. Today Proc. 2017, 4, 668–676. [Google Scholar] [CrossRef]
- Pérez-Gutiérrez, E.; Lozano, J.; Gaspar-Tánori, J.; Maldonado, J.-L.; Gómez, B.; López, L.; Amores-Tapia, L.-F.; Barbosa-García, O.; Percino, M.-J. Organic Solar Cells All Made by Blade and Slot–Die Coating Techniques. Sol. Energy 2017, 146, 79–84. [Google Scholar] [CrossRef]
- Sosnowska, I.; Neumaier, T.P.; Steichele, E. Spiral Magnetic Ordering in Bismuth Ferrite. J. Phys. C Solid State Phys. 1982, 15, 4835–4846. [Google Scholar] [CrossRef]
- Moriya, T. Anisotropic Superexchange Interaction and Weak Ferromagnetism. Phys. Rev. 1960, 120, 91–98. [Google Scholar] [CrossRef]
- Park, T.; Papaefthymiou, G.C.; Viescas, A.J.; Moodenbaugh, A.R.; Wong, S.S. Size-Dependent Magnetic Properties of Single-Crystalline Multiferroic BiFeO3 Nanoparticles. Nano Lett. 2007, 7, 766–772. [Google Scholar] [CrossRef] [PubMed]
- Mahesh Kumar, M.; Srinath, S.; Kumar, G.S.; Suryanarayana, S.V. Spontaneous Magnetic Moment in BiFeO3-BaTiO3 Solid Solutions at Low Temperatures. J. Magn. Magn. Mater. 1998, 188, 203–212. [Google Scholar] [CrossRef]
- Han, S.H.; Kim, K.S.; Kim, H.G.; Lee, H.G.; Kang, H.W.; Cheon, C.; Kim, J.S. Crystal Structure and Spontaneous Magnetism of BiFeO3 Powder Synthesized by Hydrothermal Method. J. Nanosci. Nanotechnol. 2010, 10, 6650–6654. [Google Scholar] [CrossRef] [PubMed]
- Enneffati, M.; Mohammed, R.; Bassem, L.; Kamel, G.; Régis, B. Morphology, UV–visible and ellipsometric studies of sodium lithium orthovanadate. Opt. Quantum Electron. 2019, 51, 299. [Google Scholar] [CrossRef]
- Komandin, G.A.; Torgashev, V.I.; Volkov, A.A.; Porodinkov, O.E.; Spektor, I.E.; Bush, A.A. Optical Properties of BiFeO3 Ceramics in the Frequency Range 0.3–30.0 THz. Phys. Solid State 2010, 52, 734–743. [Google Scholar] [CrossRef]
- Cebela, M.; Jankovic, B.; Hercigonja, R.; Lukic, M.; Dohcevic-Mitrovic, Z.; Milivojevic, D.; Matovic, B. Comprehensive Characterization of BiFeO3 Powder Synthesized by the Hydrothermal Procedure. Process. Appl. Ceram. 2016, 10, 201–208. [Google Scholar] [CrossRef]
- Hlinka, J.; Pokorny, J.; Karimi, S.; Reaney, I.M. Angular Dispersion of Oblique Phonon Modes in BiFeO3 from Micro-Raman Scattering. Phys. Rev. B 2011, 83, 020101. [Google Scholar] [CrossRef]
- Bielecki, J.; Svedlindh, P.; Tibebu, D.T.; Cai, S.; Eriksson, S.-G.; Börjesson, L.; Knee, C.S. Structural and Magnetic Properties of Isovalently Substituted Multiferroic BiFeO3: Insights from Raman Spectroscopy. Phys. Rev. B 2012, 86, 184422. [Google Scholar] [CrossRef]
- Hermet, P.; Goffinet, M.; Kreisel, J.; Ghosez, P. Raman and Infrared Spectra of Multiferroic Bismuth Ferrite from First Principles. Phys. Rev. B 2007, 75, 220102. [Google Scholar] [CrossRef]
- Sun, X.; Vélez, S.; Atxabal, A.; Bedoya-Pinto, A.; Parui, S.; Zhu, X.; Llopis, R.; Casanova, F.; Hueso, L.E. A Molecular Spin-Photovoltaic Device. Science 2017, 357, 677–680. [Google Scholar] [CrossRef] [Green Version]
- Wang, K.; Yi, C.; Liu, C.; Hu, X.; Chuang, S.; Gong, X. Effects of Magnetic Nanoparticles and External Magnetostatic Field on the Bulk Heterojunction Polymer Solar Cells. Sci. Rep. 2015, 5, 9265. [Google Scholar] [CrossRef]
- Oviedo-Casado, S.; Urbina, A.; Prior, J. Magnetic Field Enhancement of Organic Photovoltaic Cells Performance. Sci. Rep. 2017, 7, 4297. [Google Scholar] [CrossRef]
- Emna, K.; Monem, K.; Rasheed, M.; Abdelaziz, Z.; Kamel, K. Electrical transport mechanisms in amorphous silicon/crystalline silicon germanium heterojunction solar cell:impact of passivation layer in conversion efficiency. Opt. Quant. Electron. 2016, 48, 546. [Google Scholar] [CrossRef]


| Sample | Jsc (A/m2) | Voc (V) | FF | η (%) |
|---|---|---|---|---|
| TiO2_1 | 10.7 | 0.662 | 0.610 | 4.31 |
| TiO2_2 | 9.35 | 0.642 | 0.607 | 3.64 |
| TiO2_3 | 10.1 | 0.650 | 0.600 | 4.94 |
| TiO2_4 | 9.25 | 0.651 | 0.624 | 3.76 |
| TiO2_5 | 8.63 | 0.657 | 0.619 | 3.51 |
| Sample | Jsc (A/m2) (±0.001) | Voc (V) (±0.001) | FF (±0.001) | η (%) | |
|---|---|---|---|---|---|
| 1% | BD | 0.242 | 0.695 | 0.633 | 1.07 × 10⁻² |
| MBD(U-1) | 0.309 | 0.713 | 0.586 | 1.32 × 10⁻² | |
| MBD(D-1) | 0.297 | 0.668 | 0.594 | 1.18 × 10⁻² | |
| MBD(L-1) | 0.358 | 0.719 | 0.676 | 1.74 × 10⁻² | |
| MBD(R-1) | 0.317 | 0.744 | 0.644 | 1.52 × 10⁻² | |
| 3% | BD | 0.156 | 0.656 | 0.583 | 0.60 × 10⁻² |
| MBD(U-2) | 0.165 | 0.680 | 0.61 | 0.68 × 10⁻² | |
| MBD(D-2) | 0.162 | 0.651 | 0.627 | 0.66 × 10⁻² | |
| MBD(L-2) | 0.194 | 0.722 | 0.611 | 0.85 × 10⁻² | |
| MBD(R-2) | 0.182 | 0.713 | 0.703 | 0.91 × 10⁻² | |
| 5% | BD | 0.014 | 0.397 | 0.35 | 0.02 × 10⁻² |
| MBD(U-3) | 0.016 | 0.585 | 0.564 | 0.05 × 10⁻² | |
| MBD(D-3) | 0.015 | 0.576 | 0.552 | 0.05 × 10⁻² | |
| MBD(L-3) | 0.019 | 0.577 | 0.540 | 0.06 × 10⁻² | |
| MBD(R-3) | 0.017 | 0.568 | 0.554 | 0.05 × 10⁻² | |
Publisher’s Note: MDPI stays neutral with regard to jurisdictional claims in published maps and institutional affiliations. |
© 2022 by the authors. Licensee MDPI, Basel, Switzerland. This article is an open access article distributed under the terms and conditions of the Creative Commons Attribution (CC BY) license (https://creativecommons.org/licenses/by/4.0/).
Share and Cite
Kang, H.S.; Kim, W.S.; Kshetri, Y.K.; Kim, H.S.; Kim, H.H. Enhancement of Efficiency of a TiO2-BiFeO3 Dye-Synthesized Solar Cell through Magnetization. Materials 2022, 15, 6367. https://doi.org/10.3390/ma15186367
Kang HS, Kim WS, Kshetri YK, Kim HS, Kim HH. Enhancement of Efficiency of a TiO2-BiFeO3 Dye-Synthesized Solar Cell through Magnetization. Materials. 2022; 15(18):6367. https://doi.org/10.3390/ma15186367
Chicago/Turabian StyleKang, Hyun Sik, Woo Seoung Kim, Yuwaraj K. Kshetri, Hak Soo Kim, and Hak Hee Kim. 2022. "Enhancement of Efficiency of a TiO2-BiFeO3 Dye-Synthesized Solar Cell through Magnetization" Materials 15, no. 18: 6367. https://doi.org/10.3390/ma15186367
APA StyleKang, H. S., Kim, W. S., Kshetri, Y. K., Kim, H. S., & Kim, H. H. (2022). Enhancement of Efficiency of a TiO2-BiFeO3 Dye-Synthesized Solar Cell through Magnetization. Materials, 15(18), 6367. https://doi.org/10.3390/ma15186367