
Aluminum Bronze/Udimet 500 Composites Prepared by Electron-Beam Additive Double-Wire-Feed Manufacturing


 , , ,
, , , 

Abstract
:1. Introduction
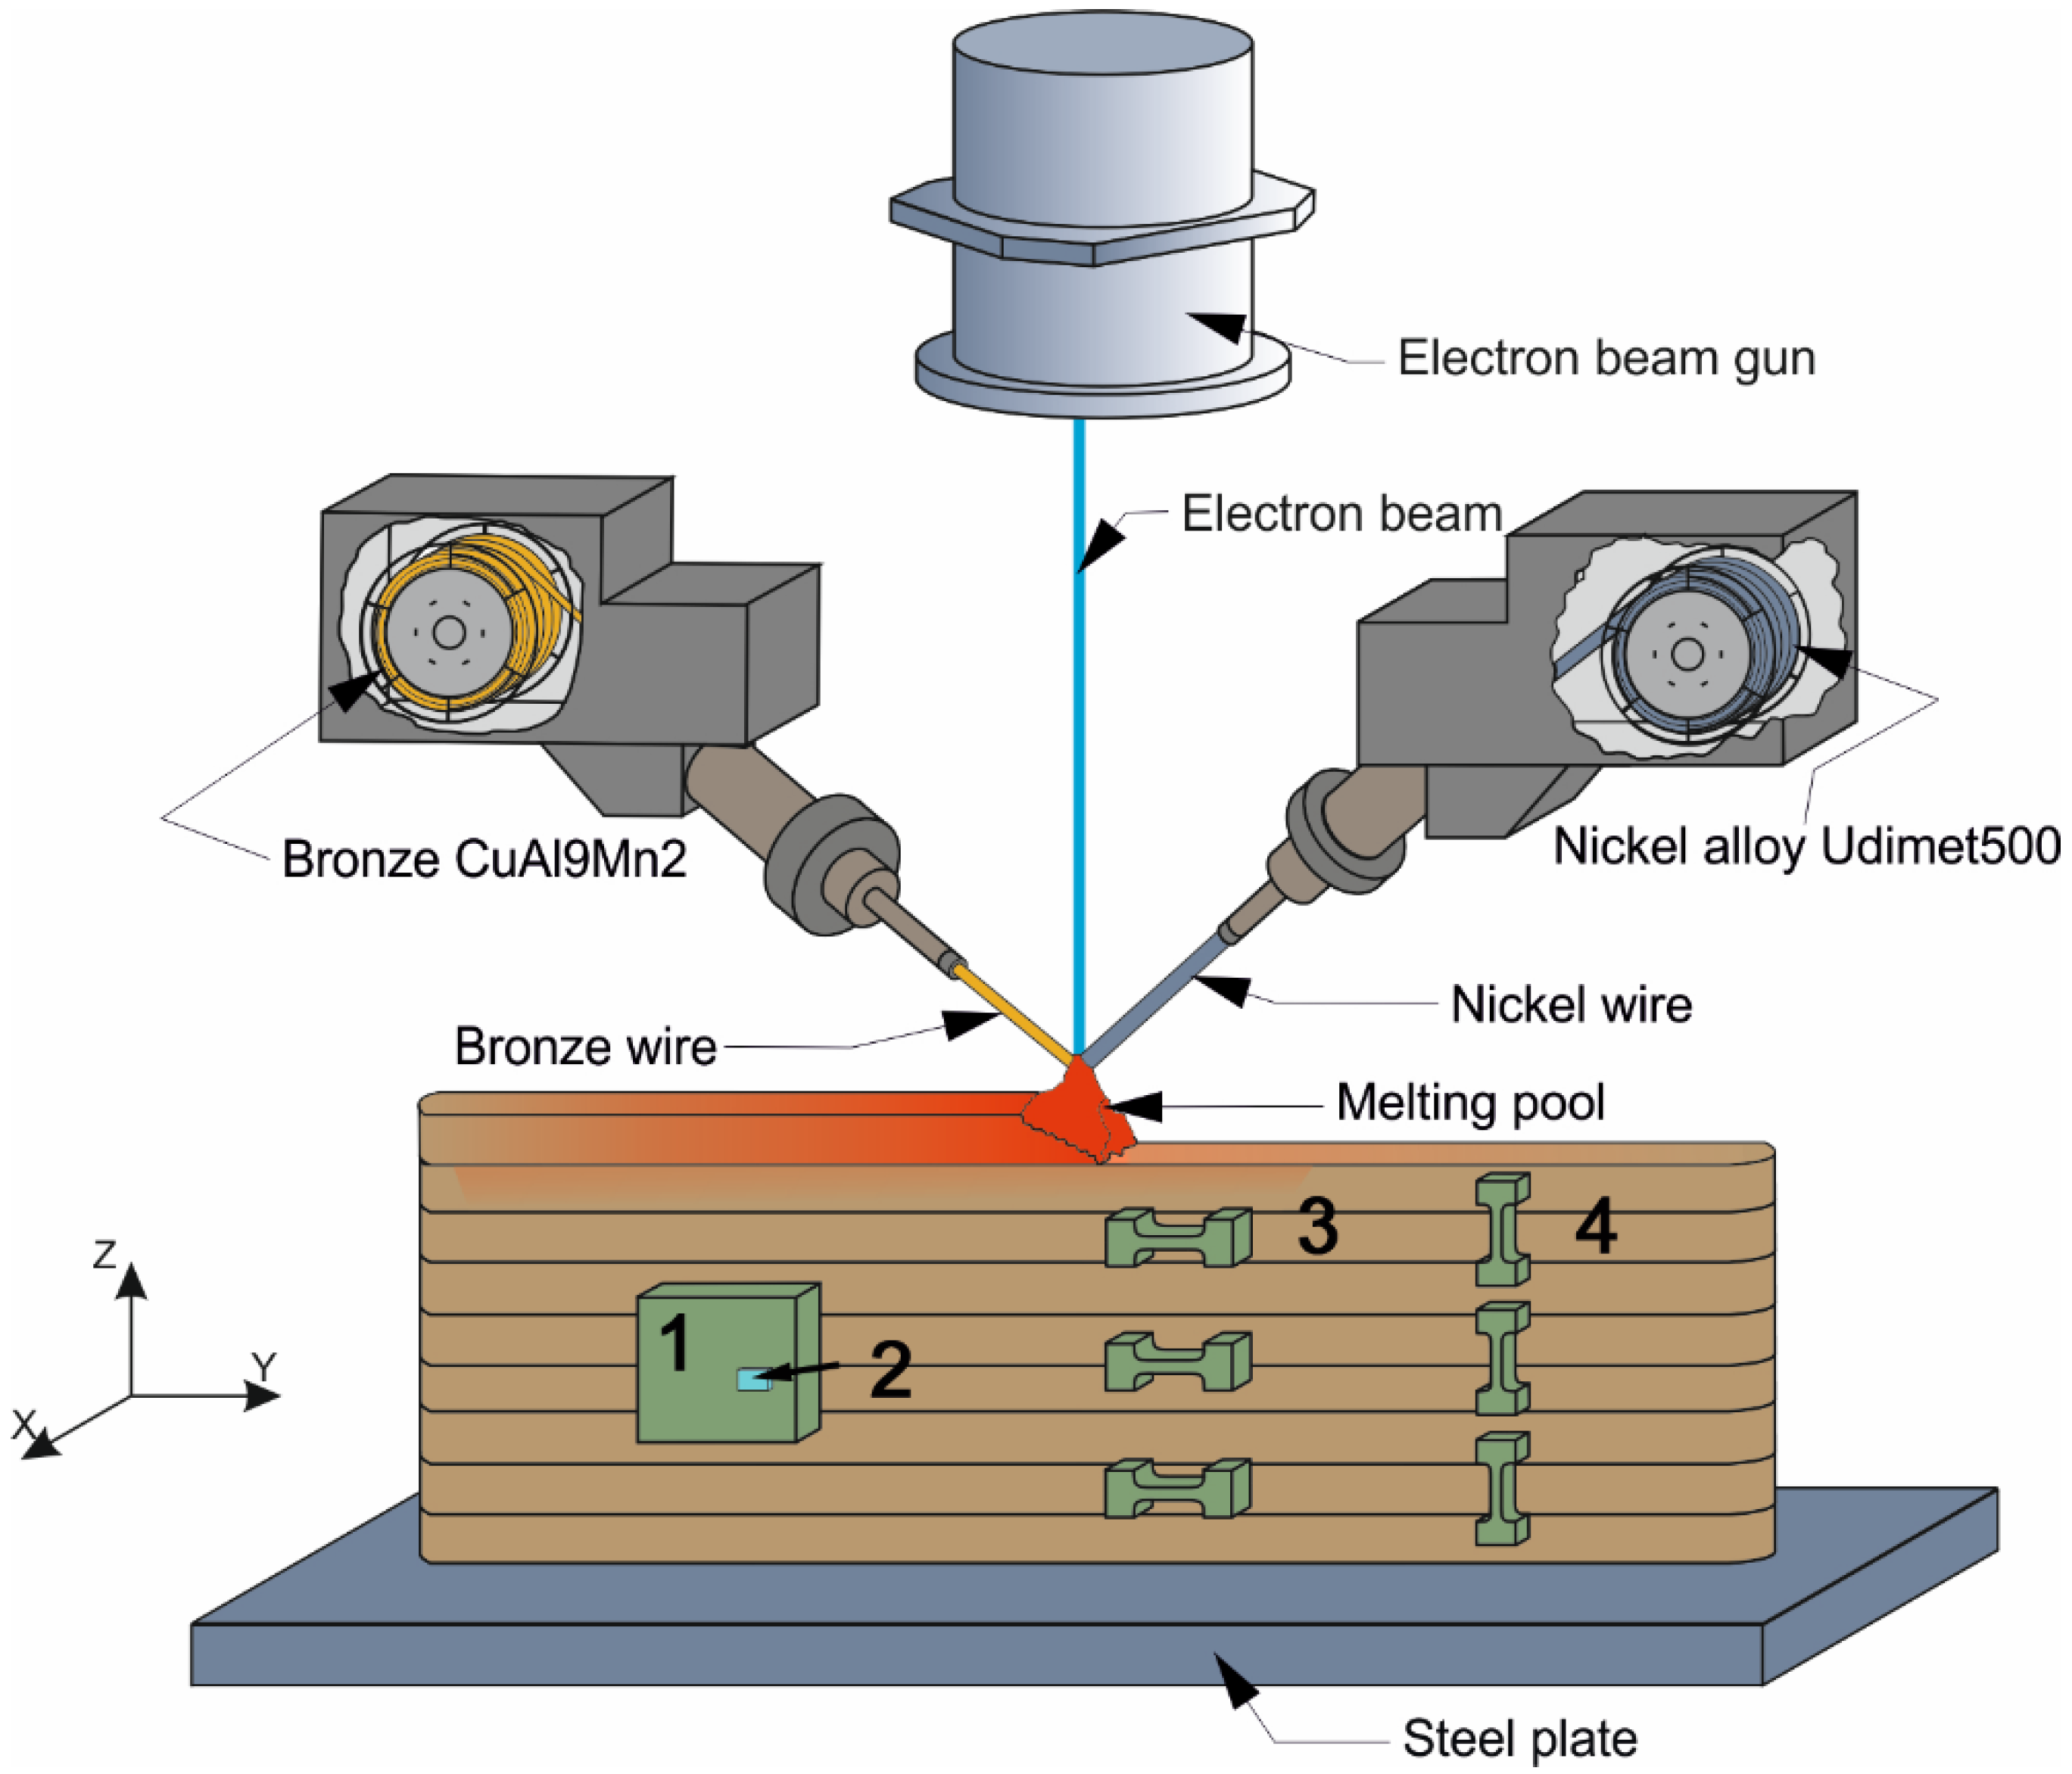
2. Materials and Methods
3. Results
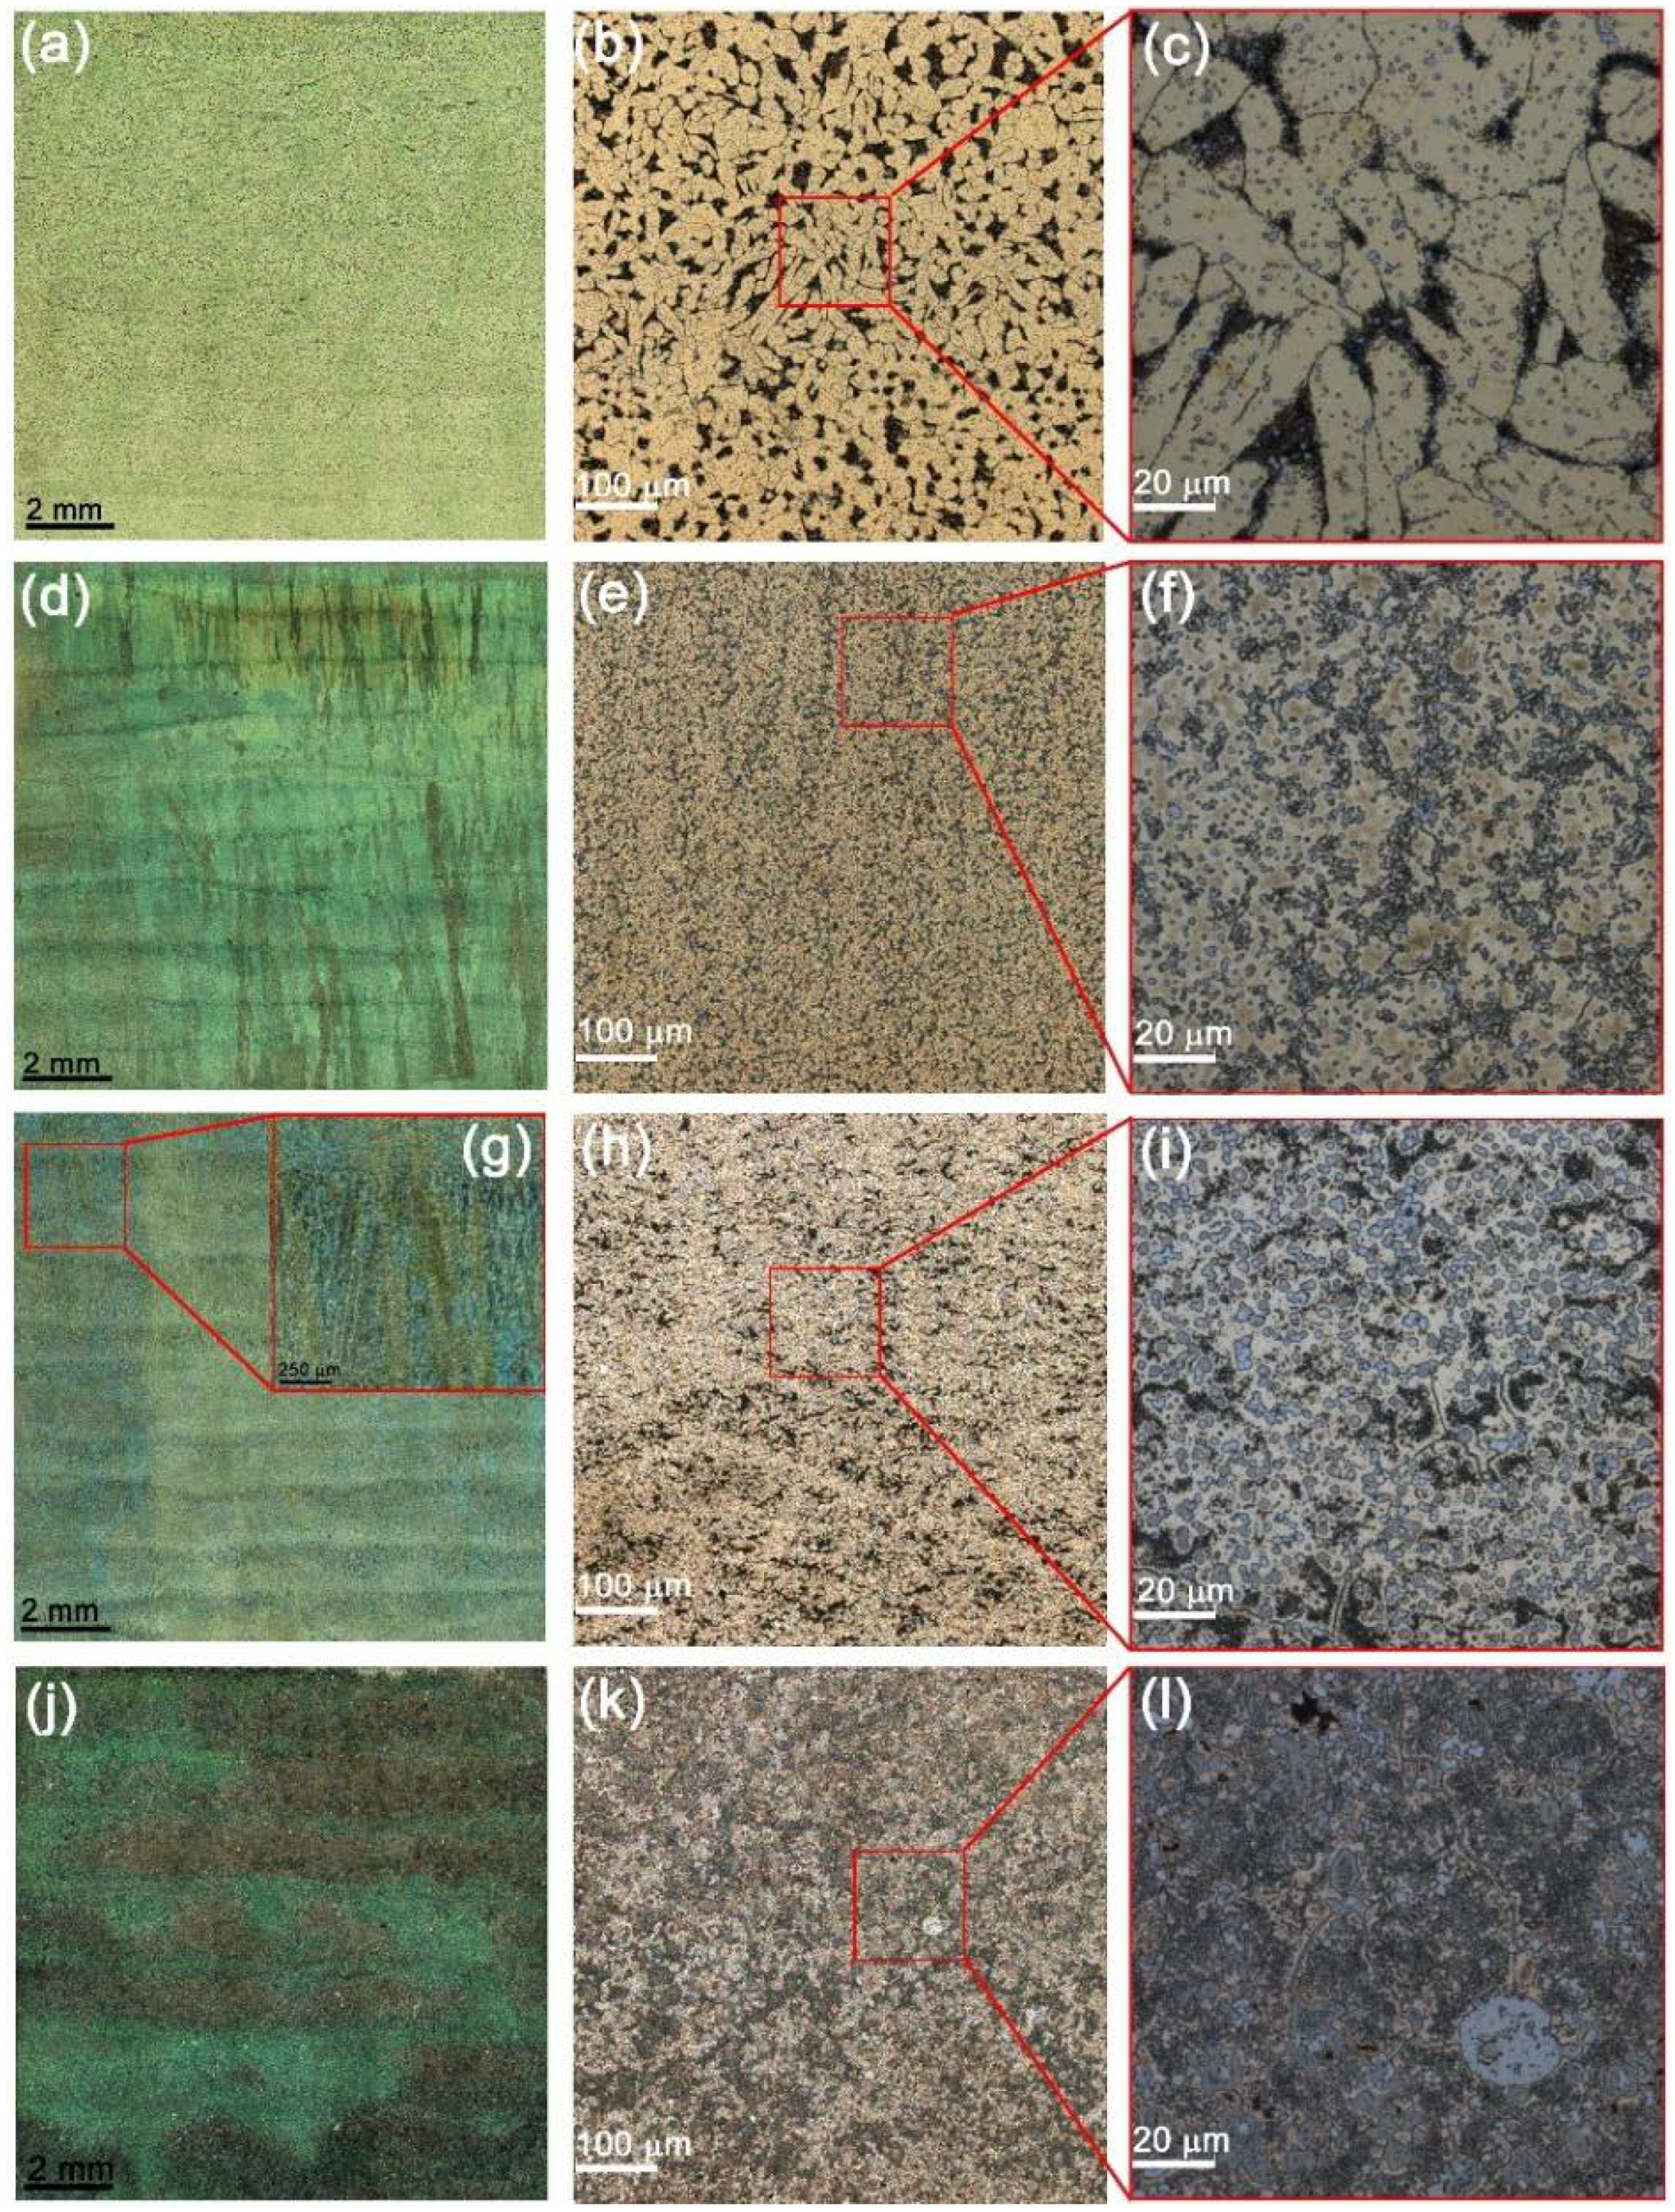
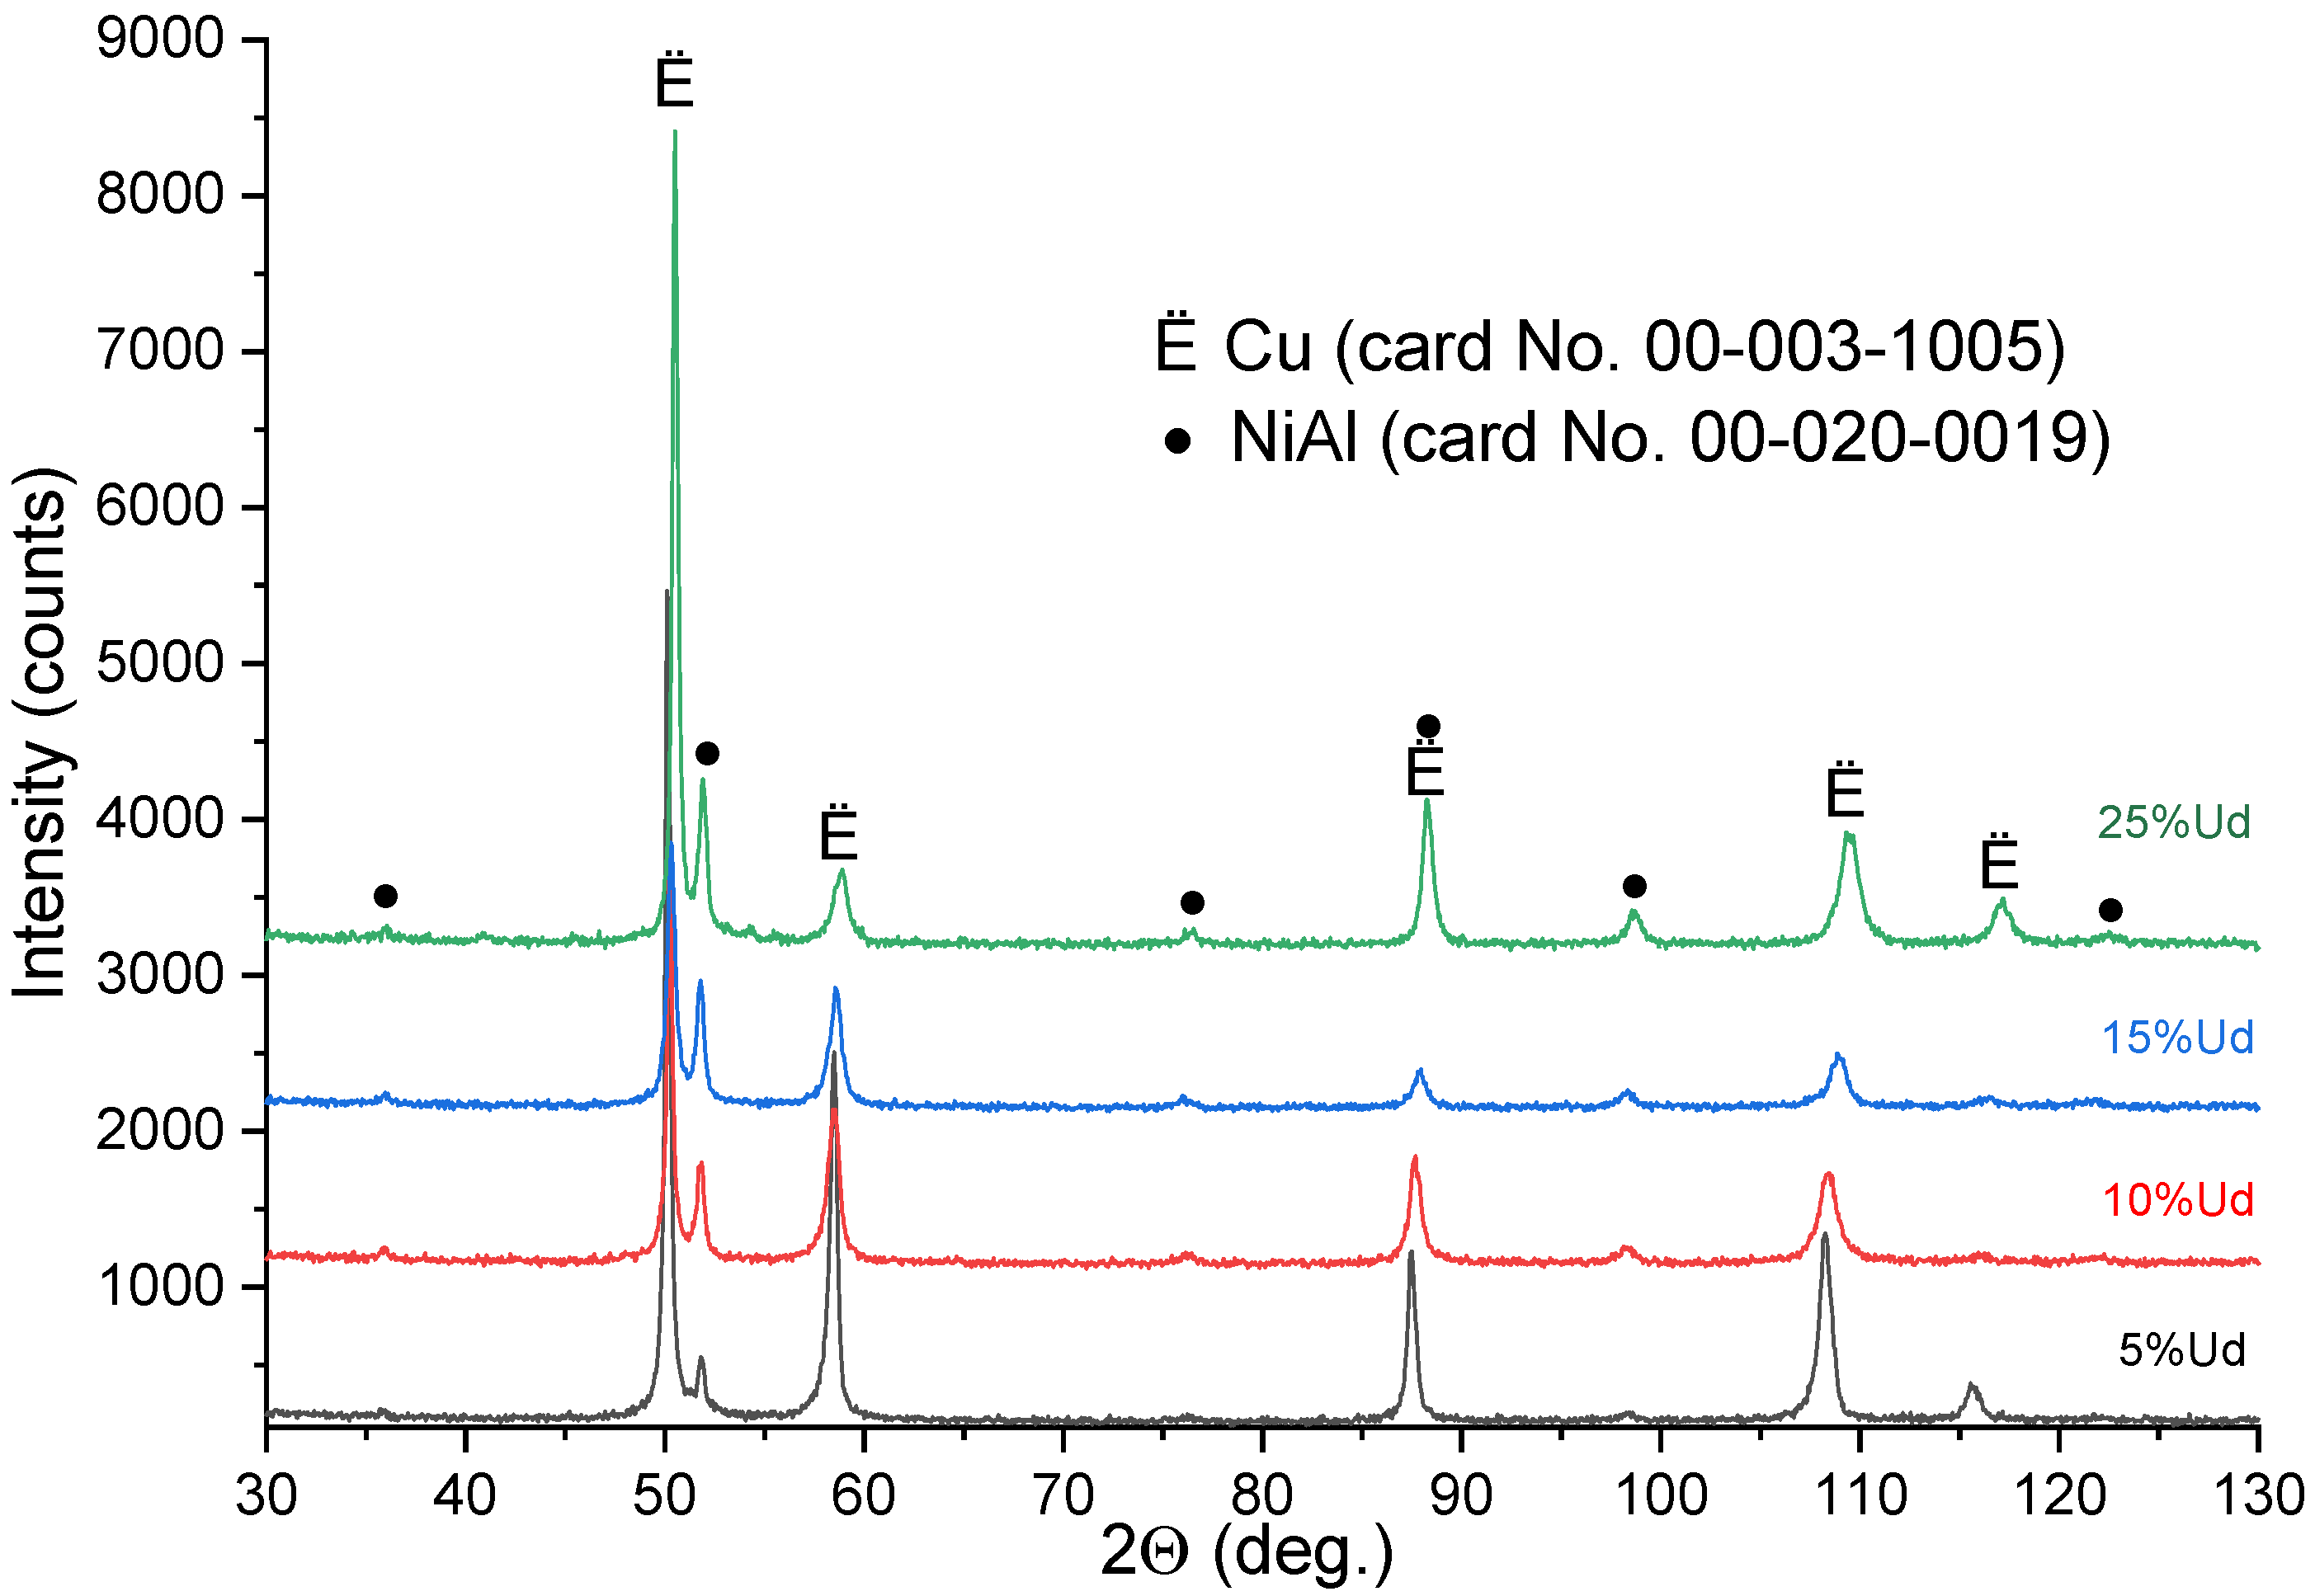
3.1. Macrostructure and XRD of the Bronze/Udimet-500
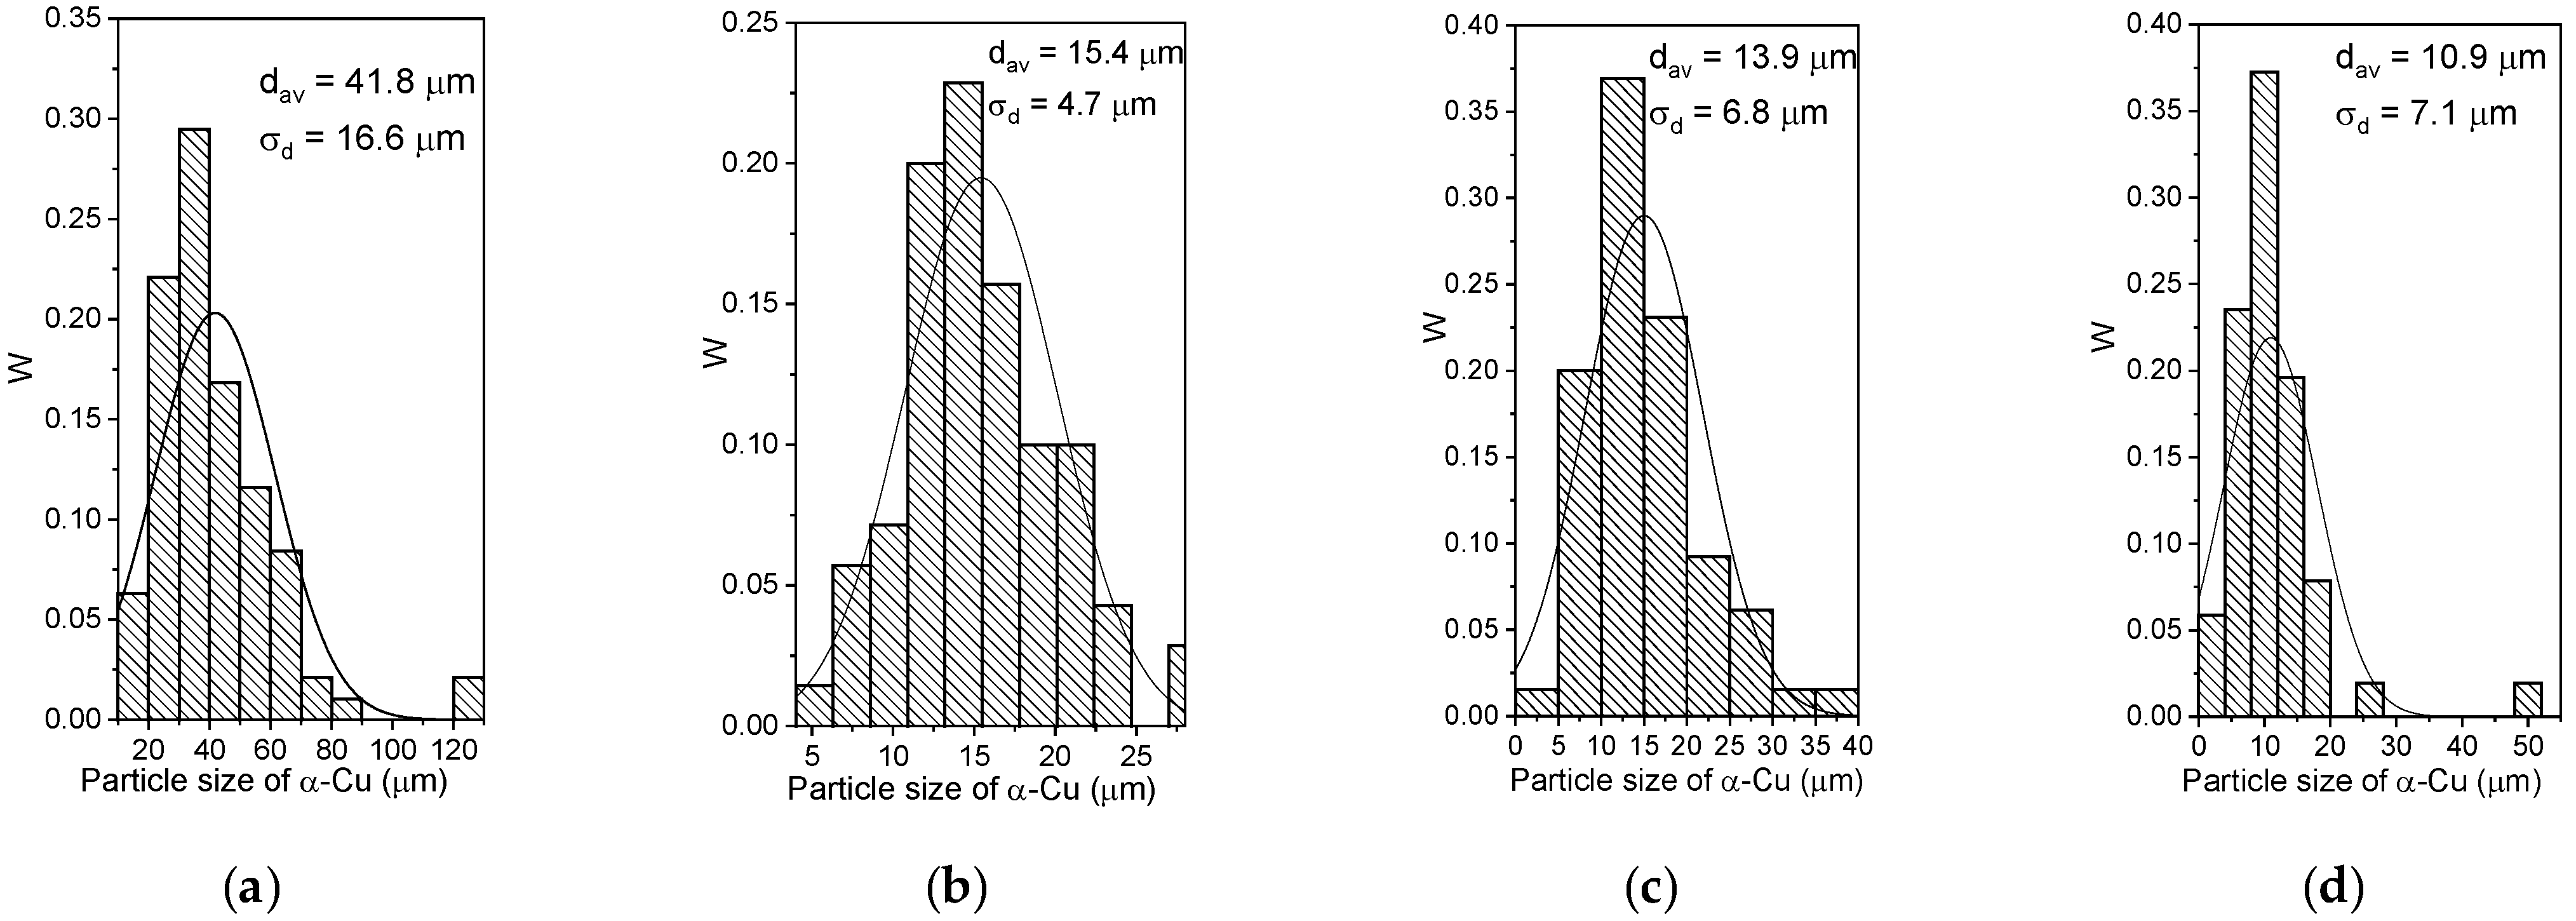
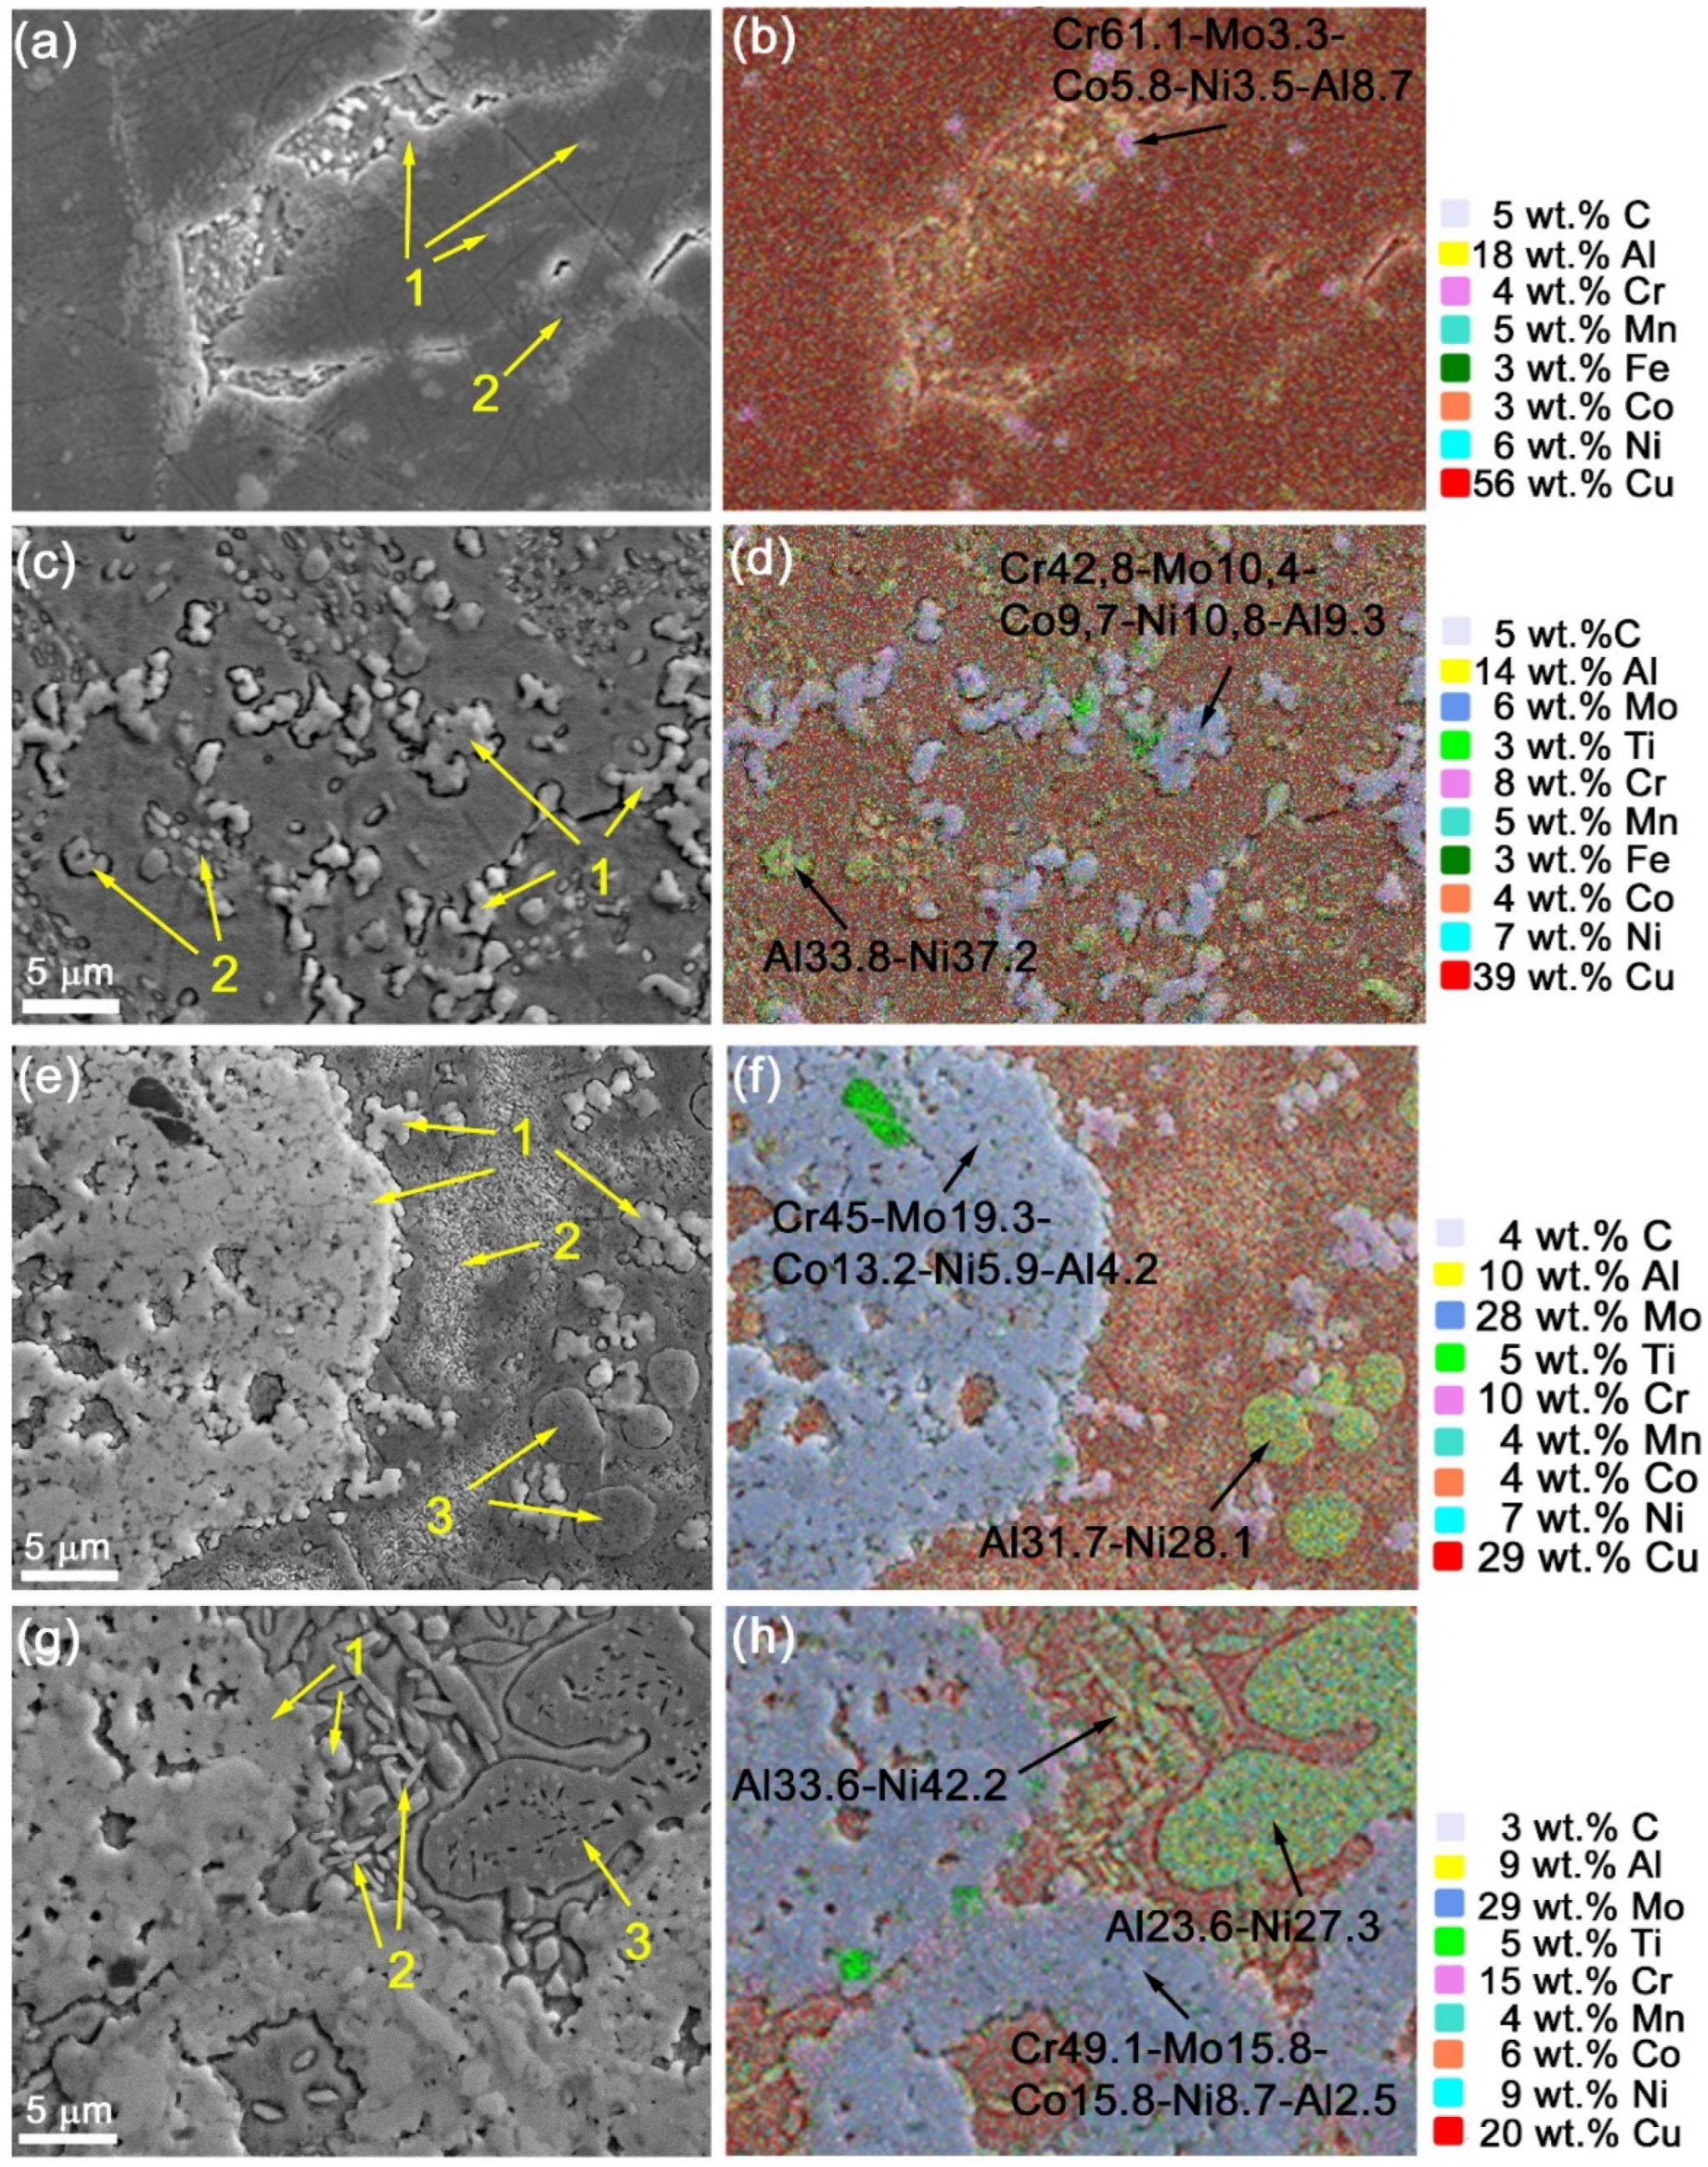
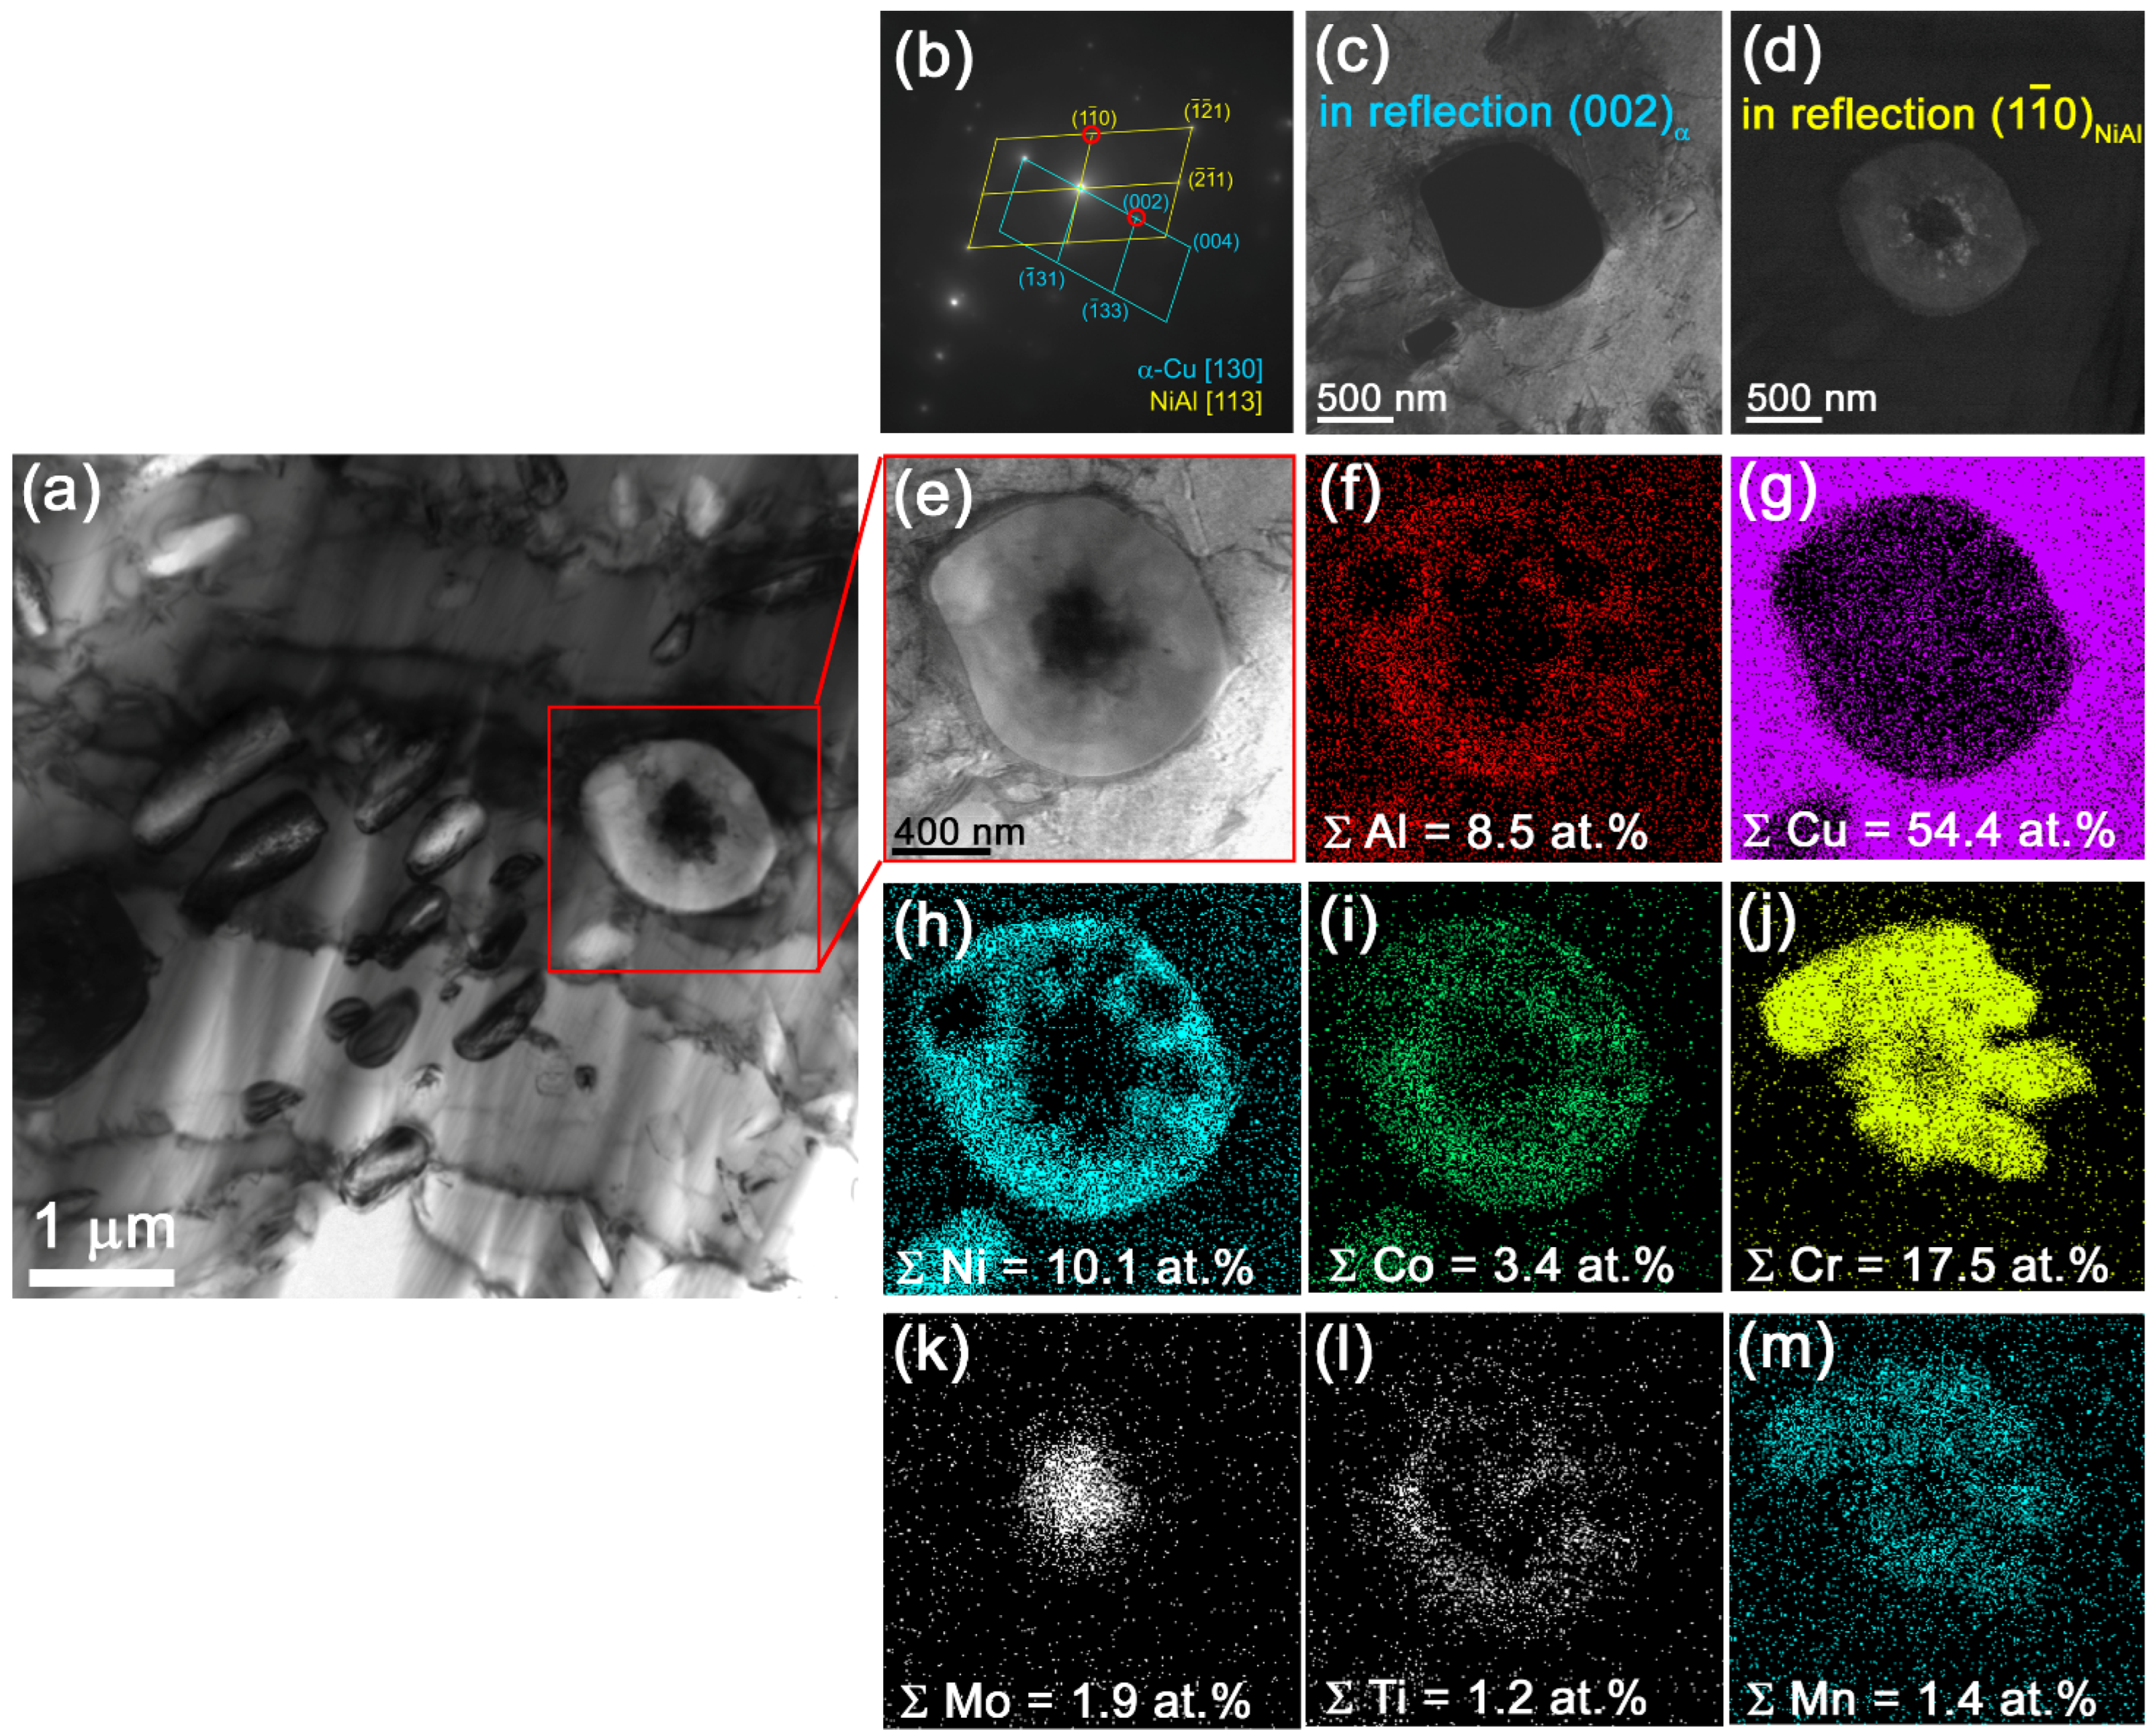
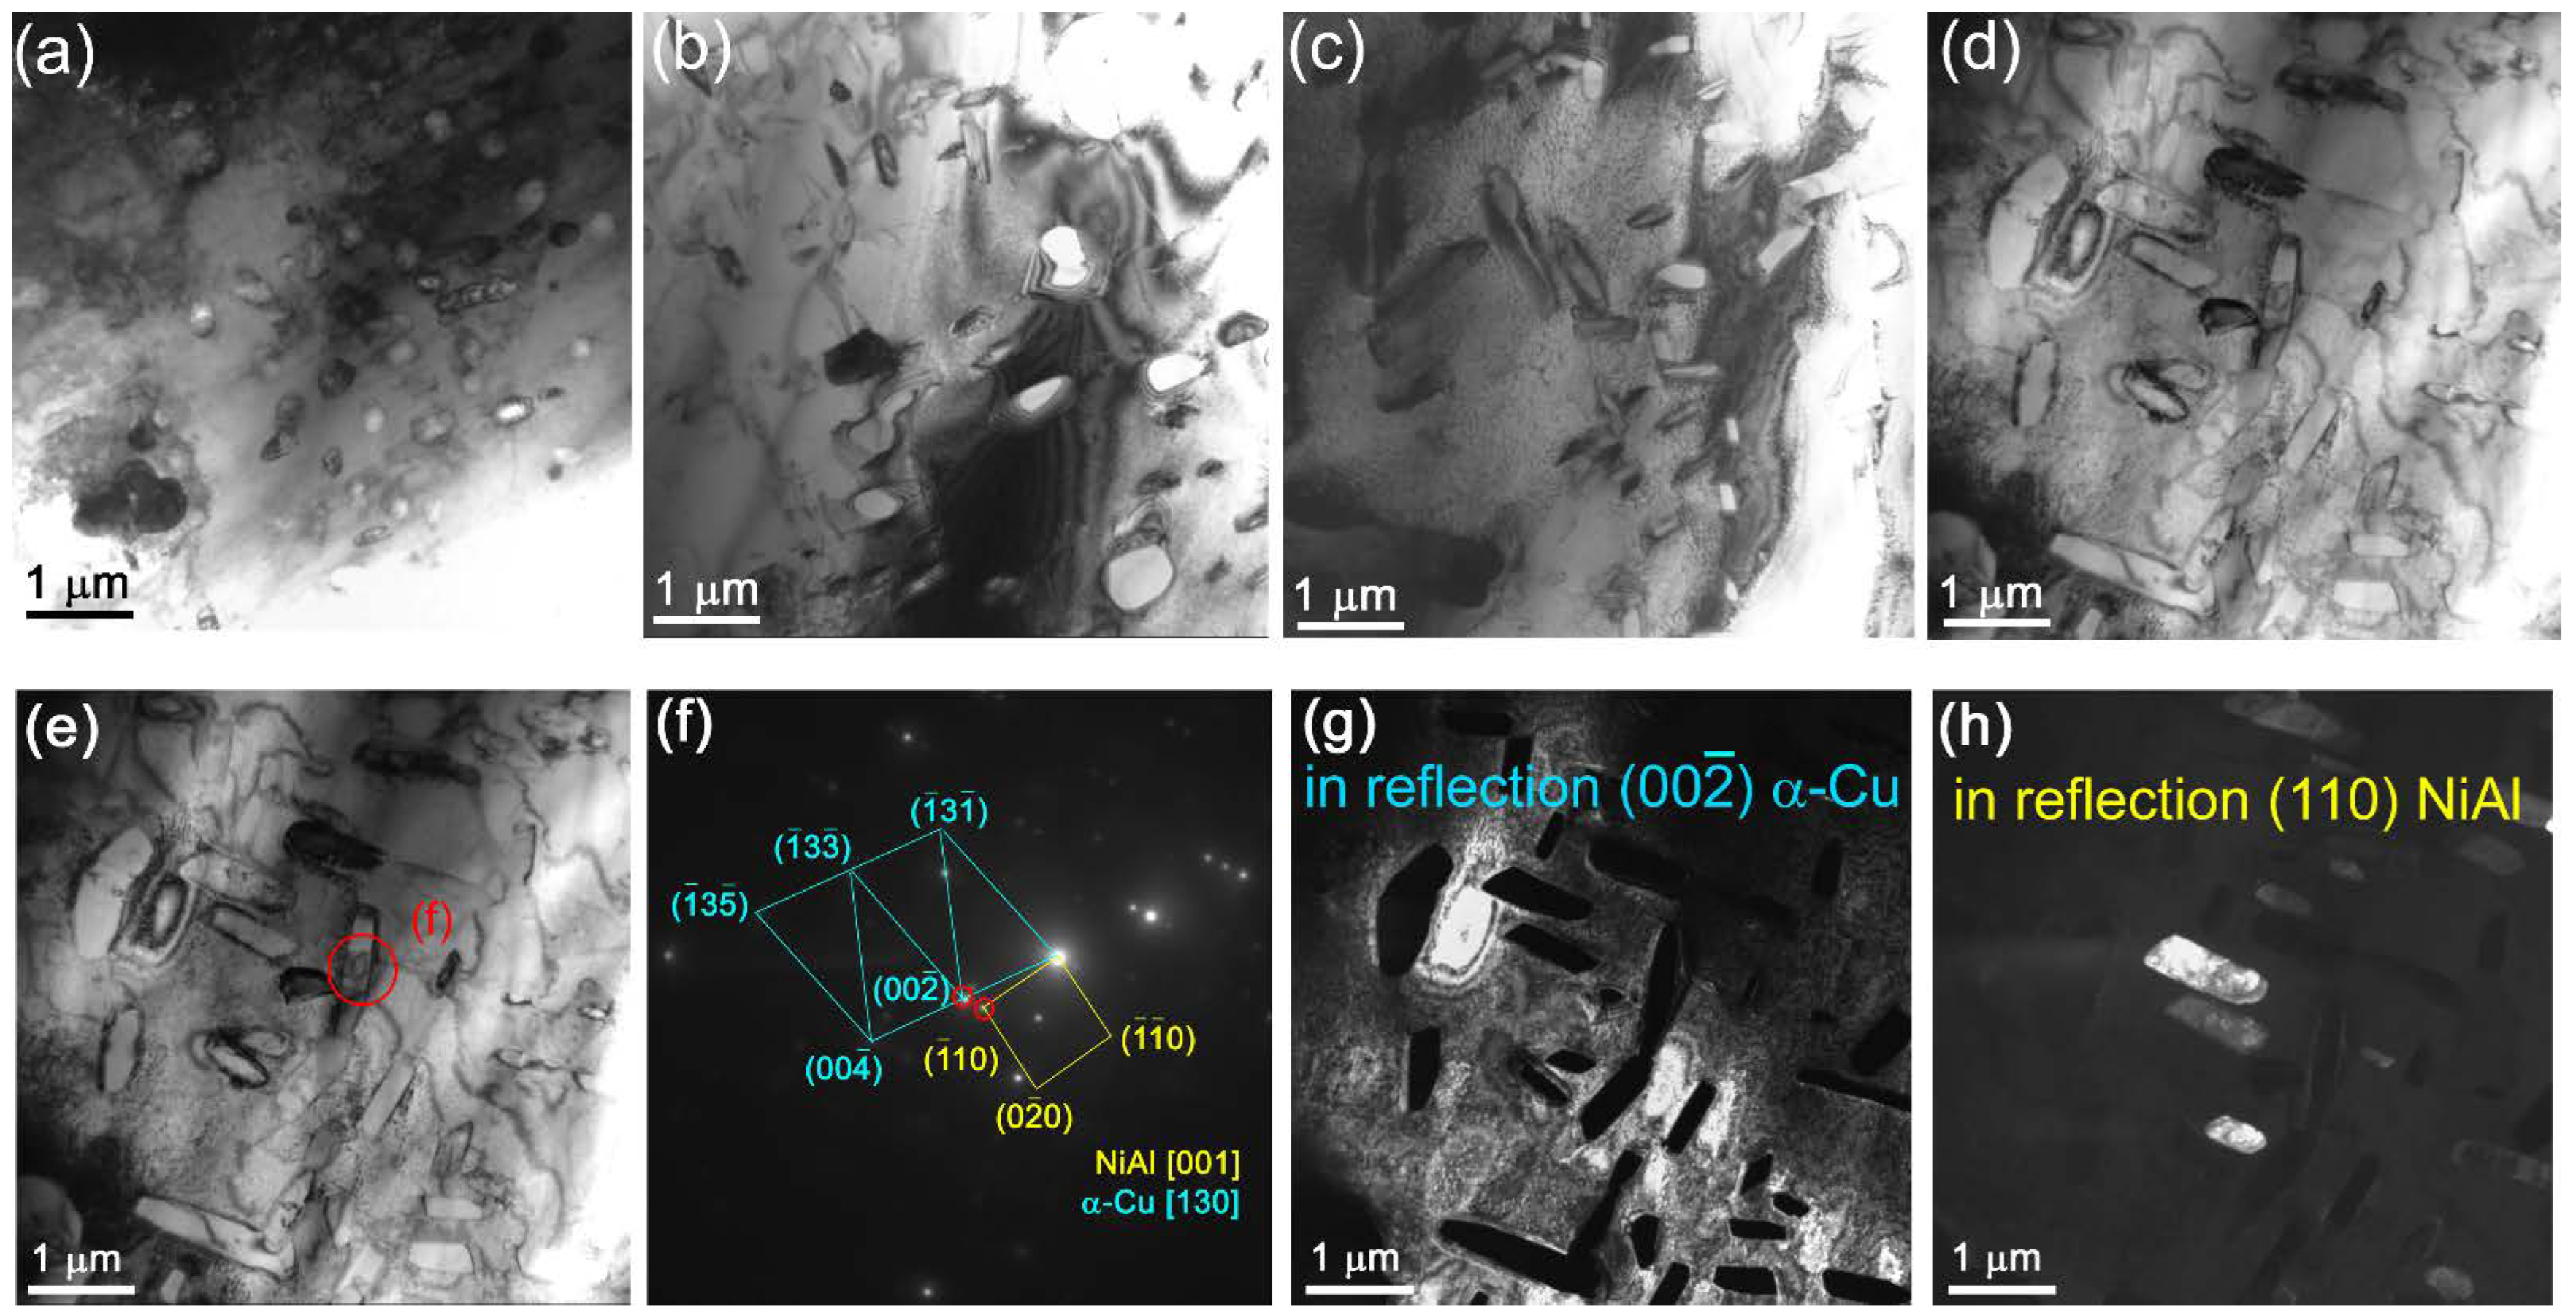
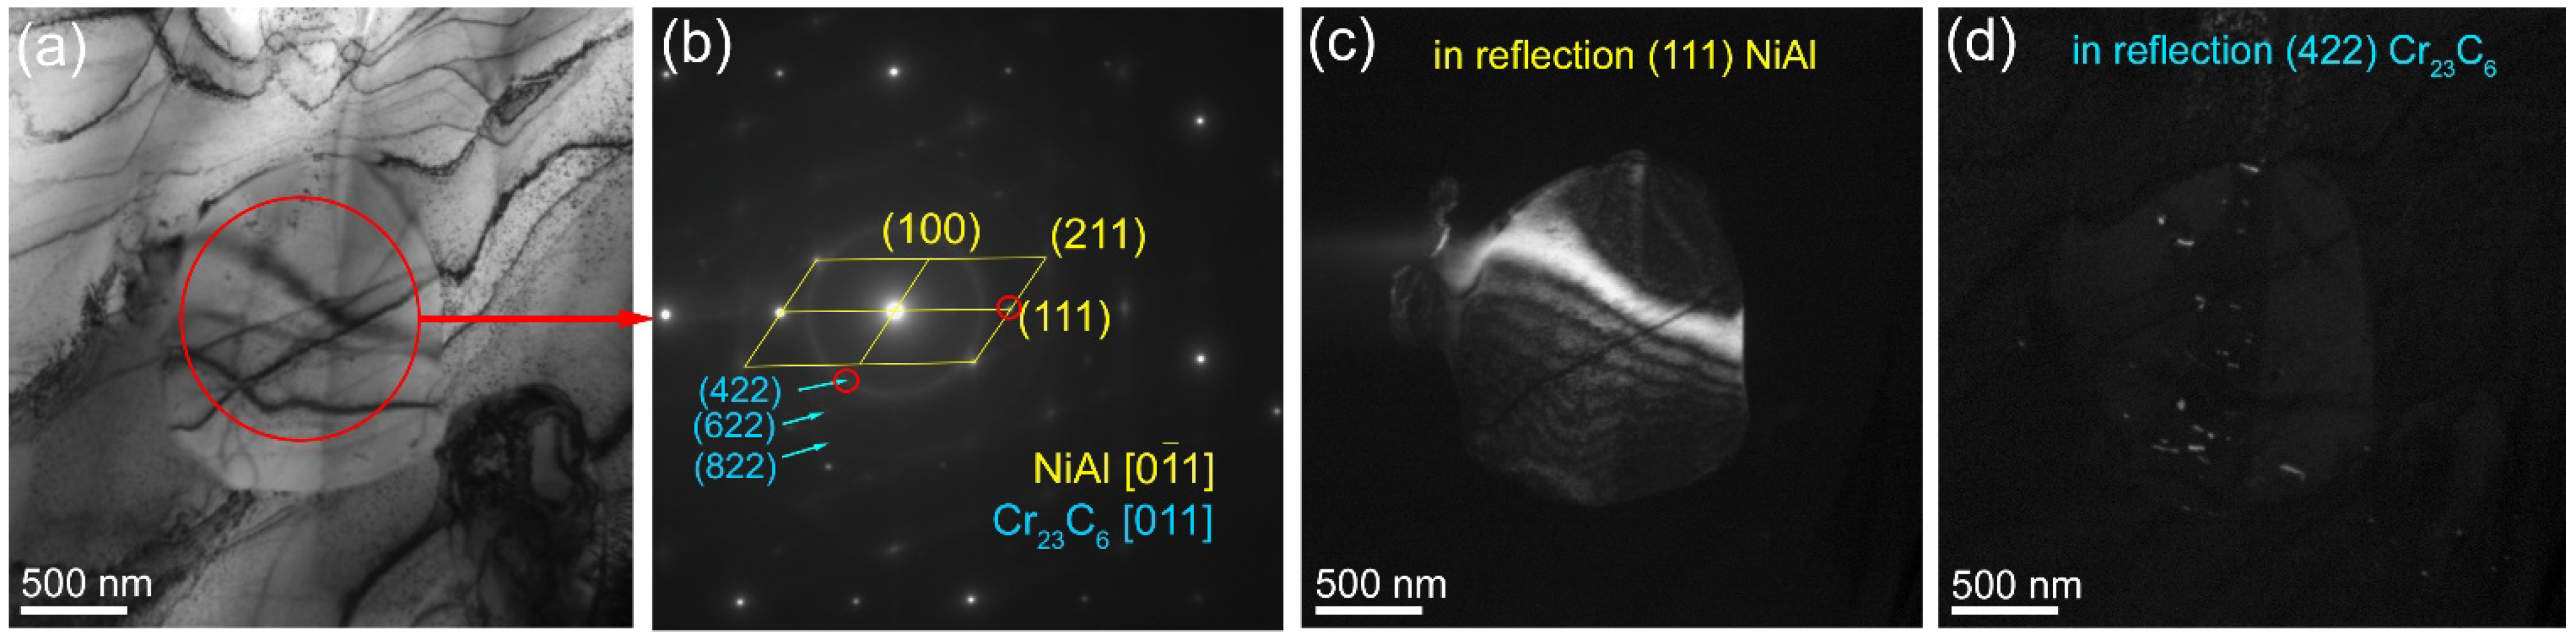
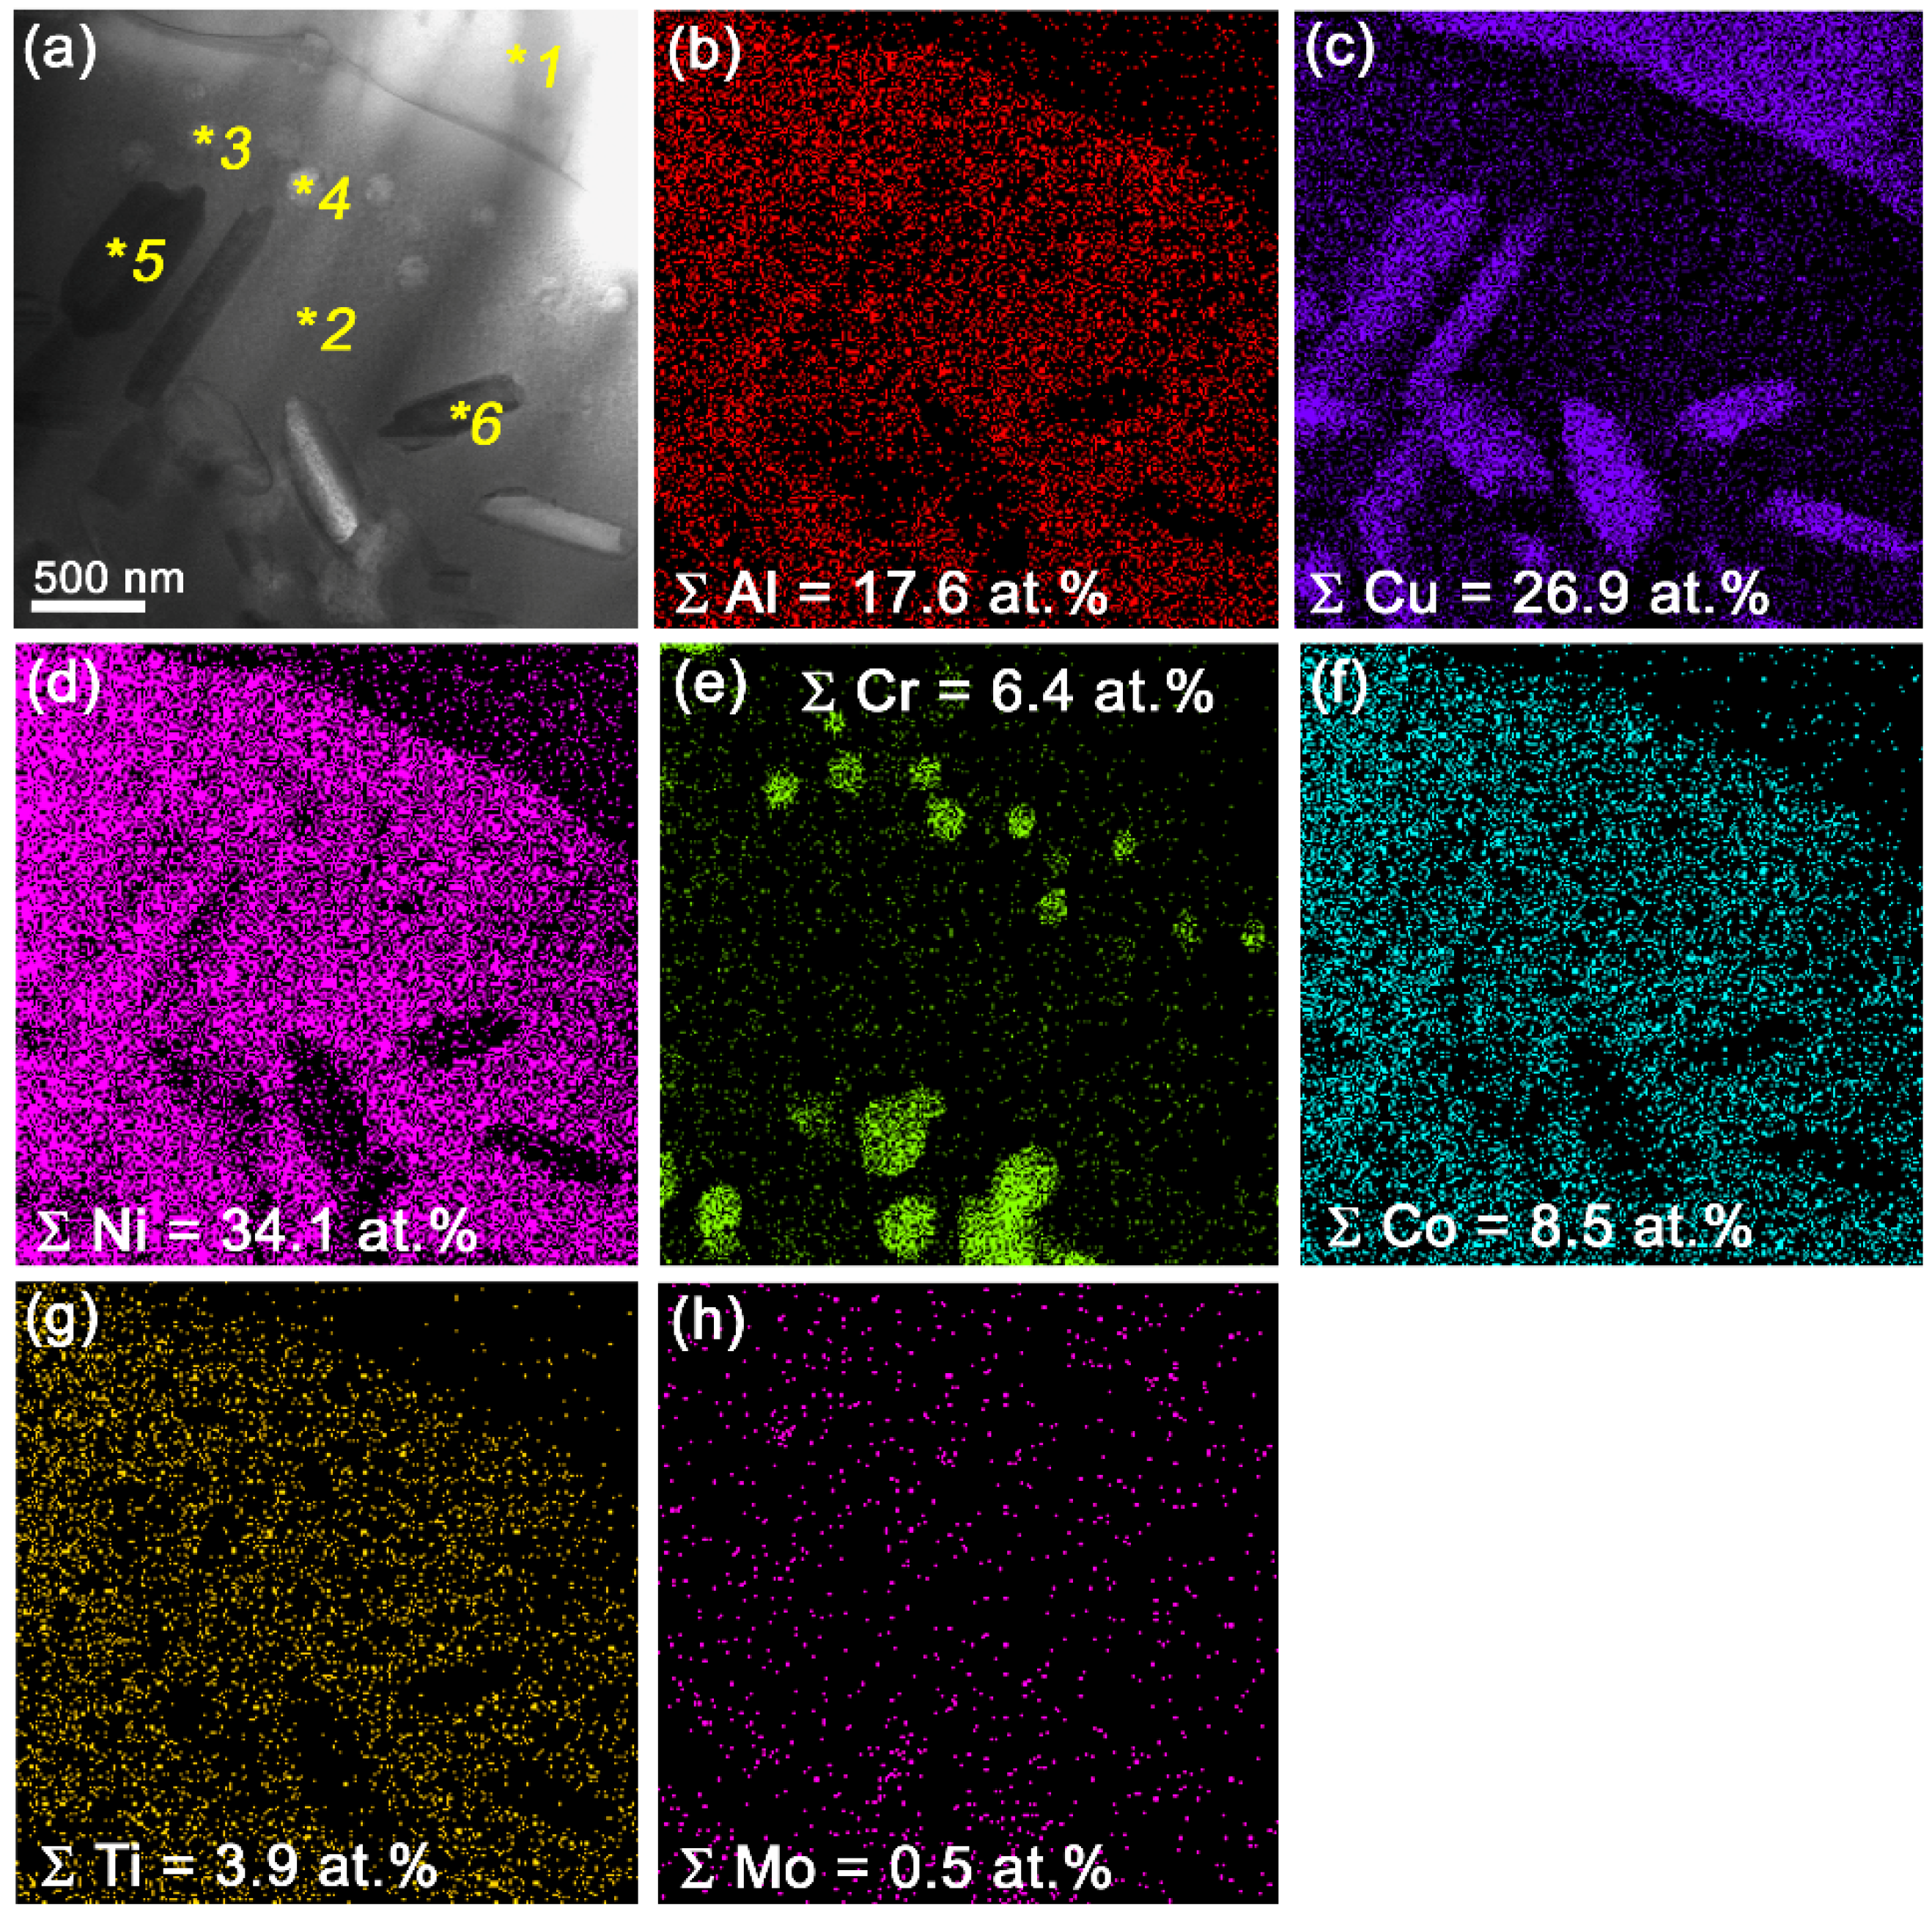
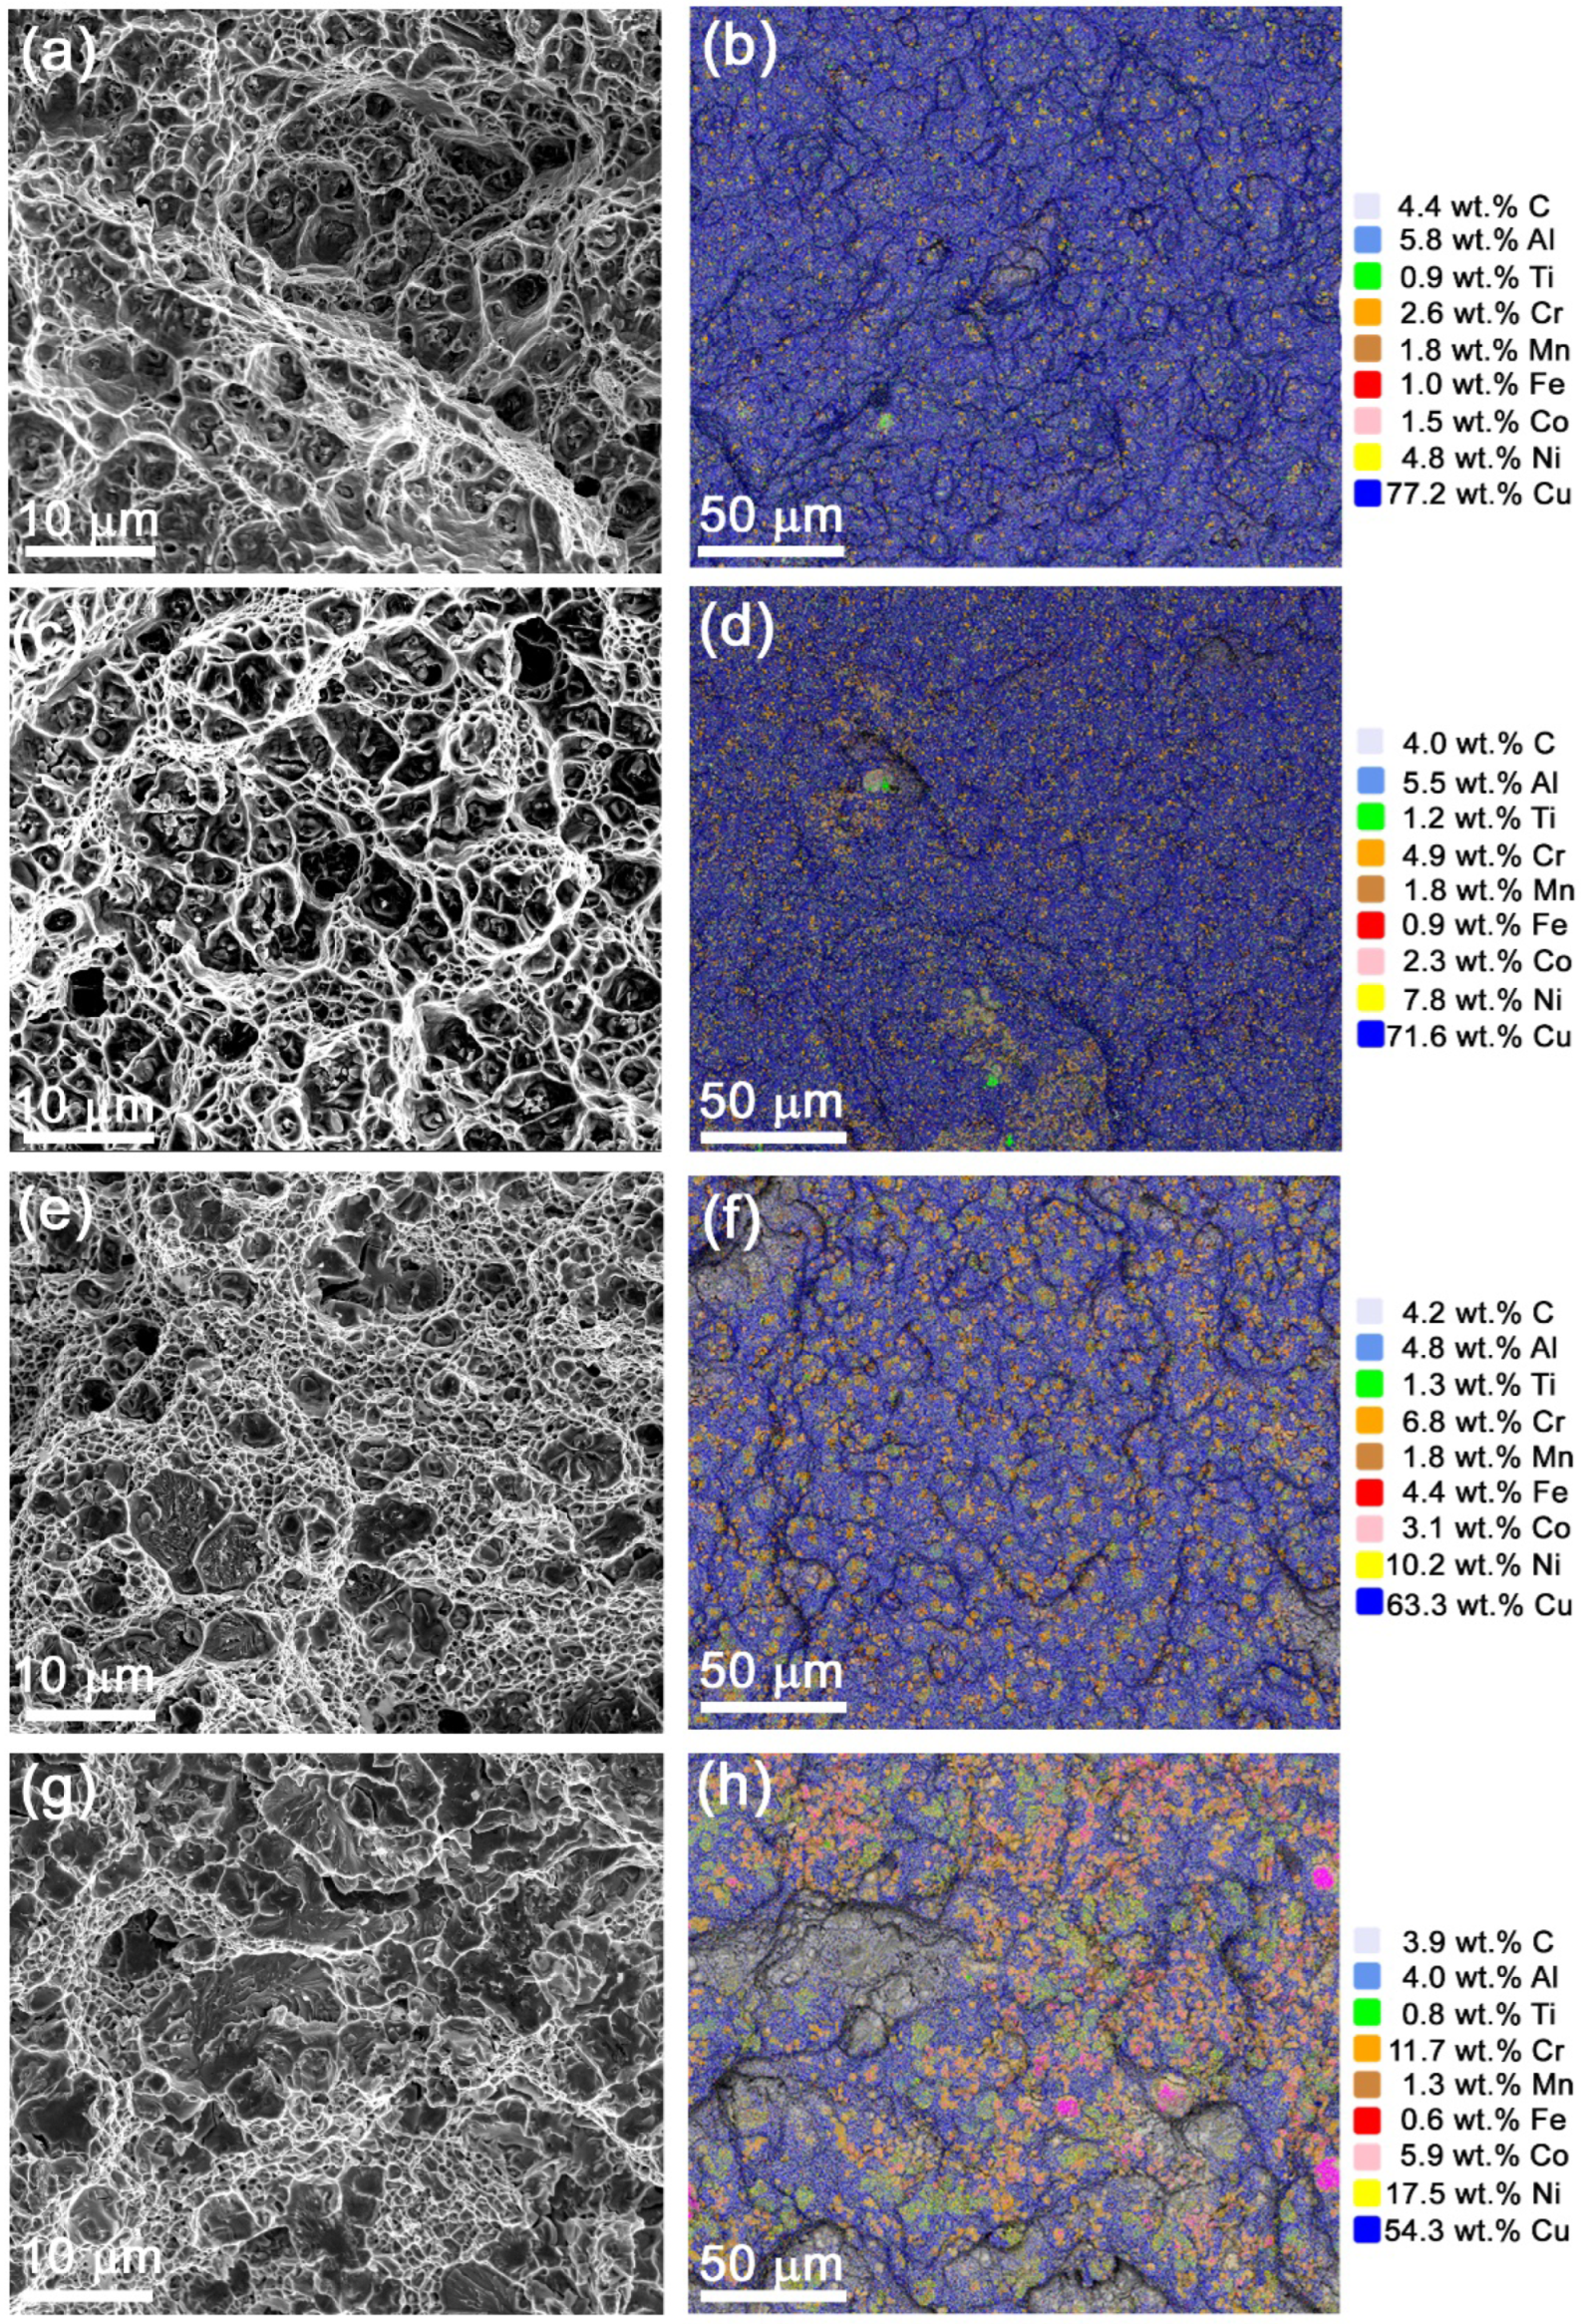
3.2. Microstructure of the Bronze/Udimet-500 Composites
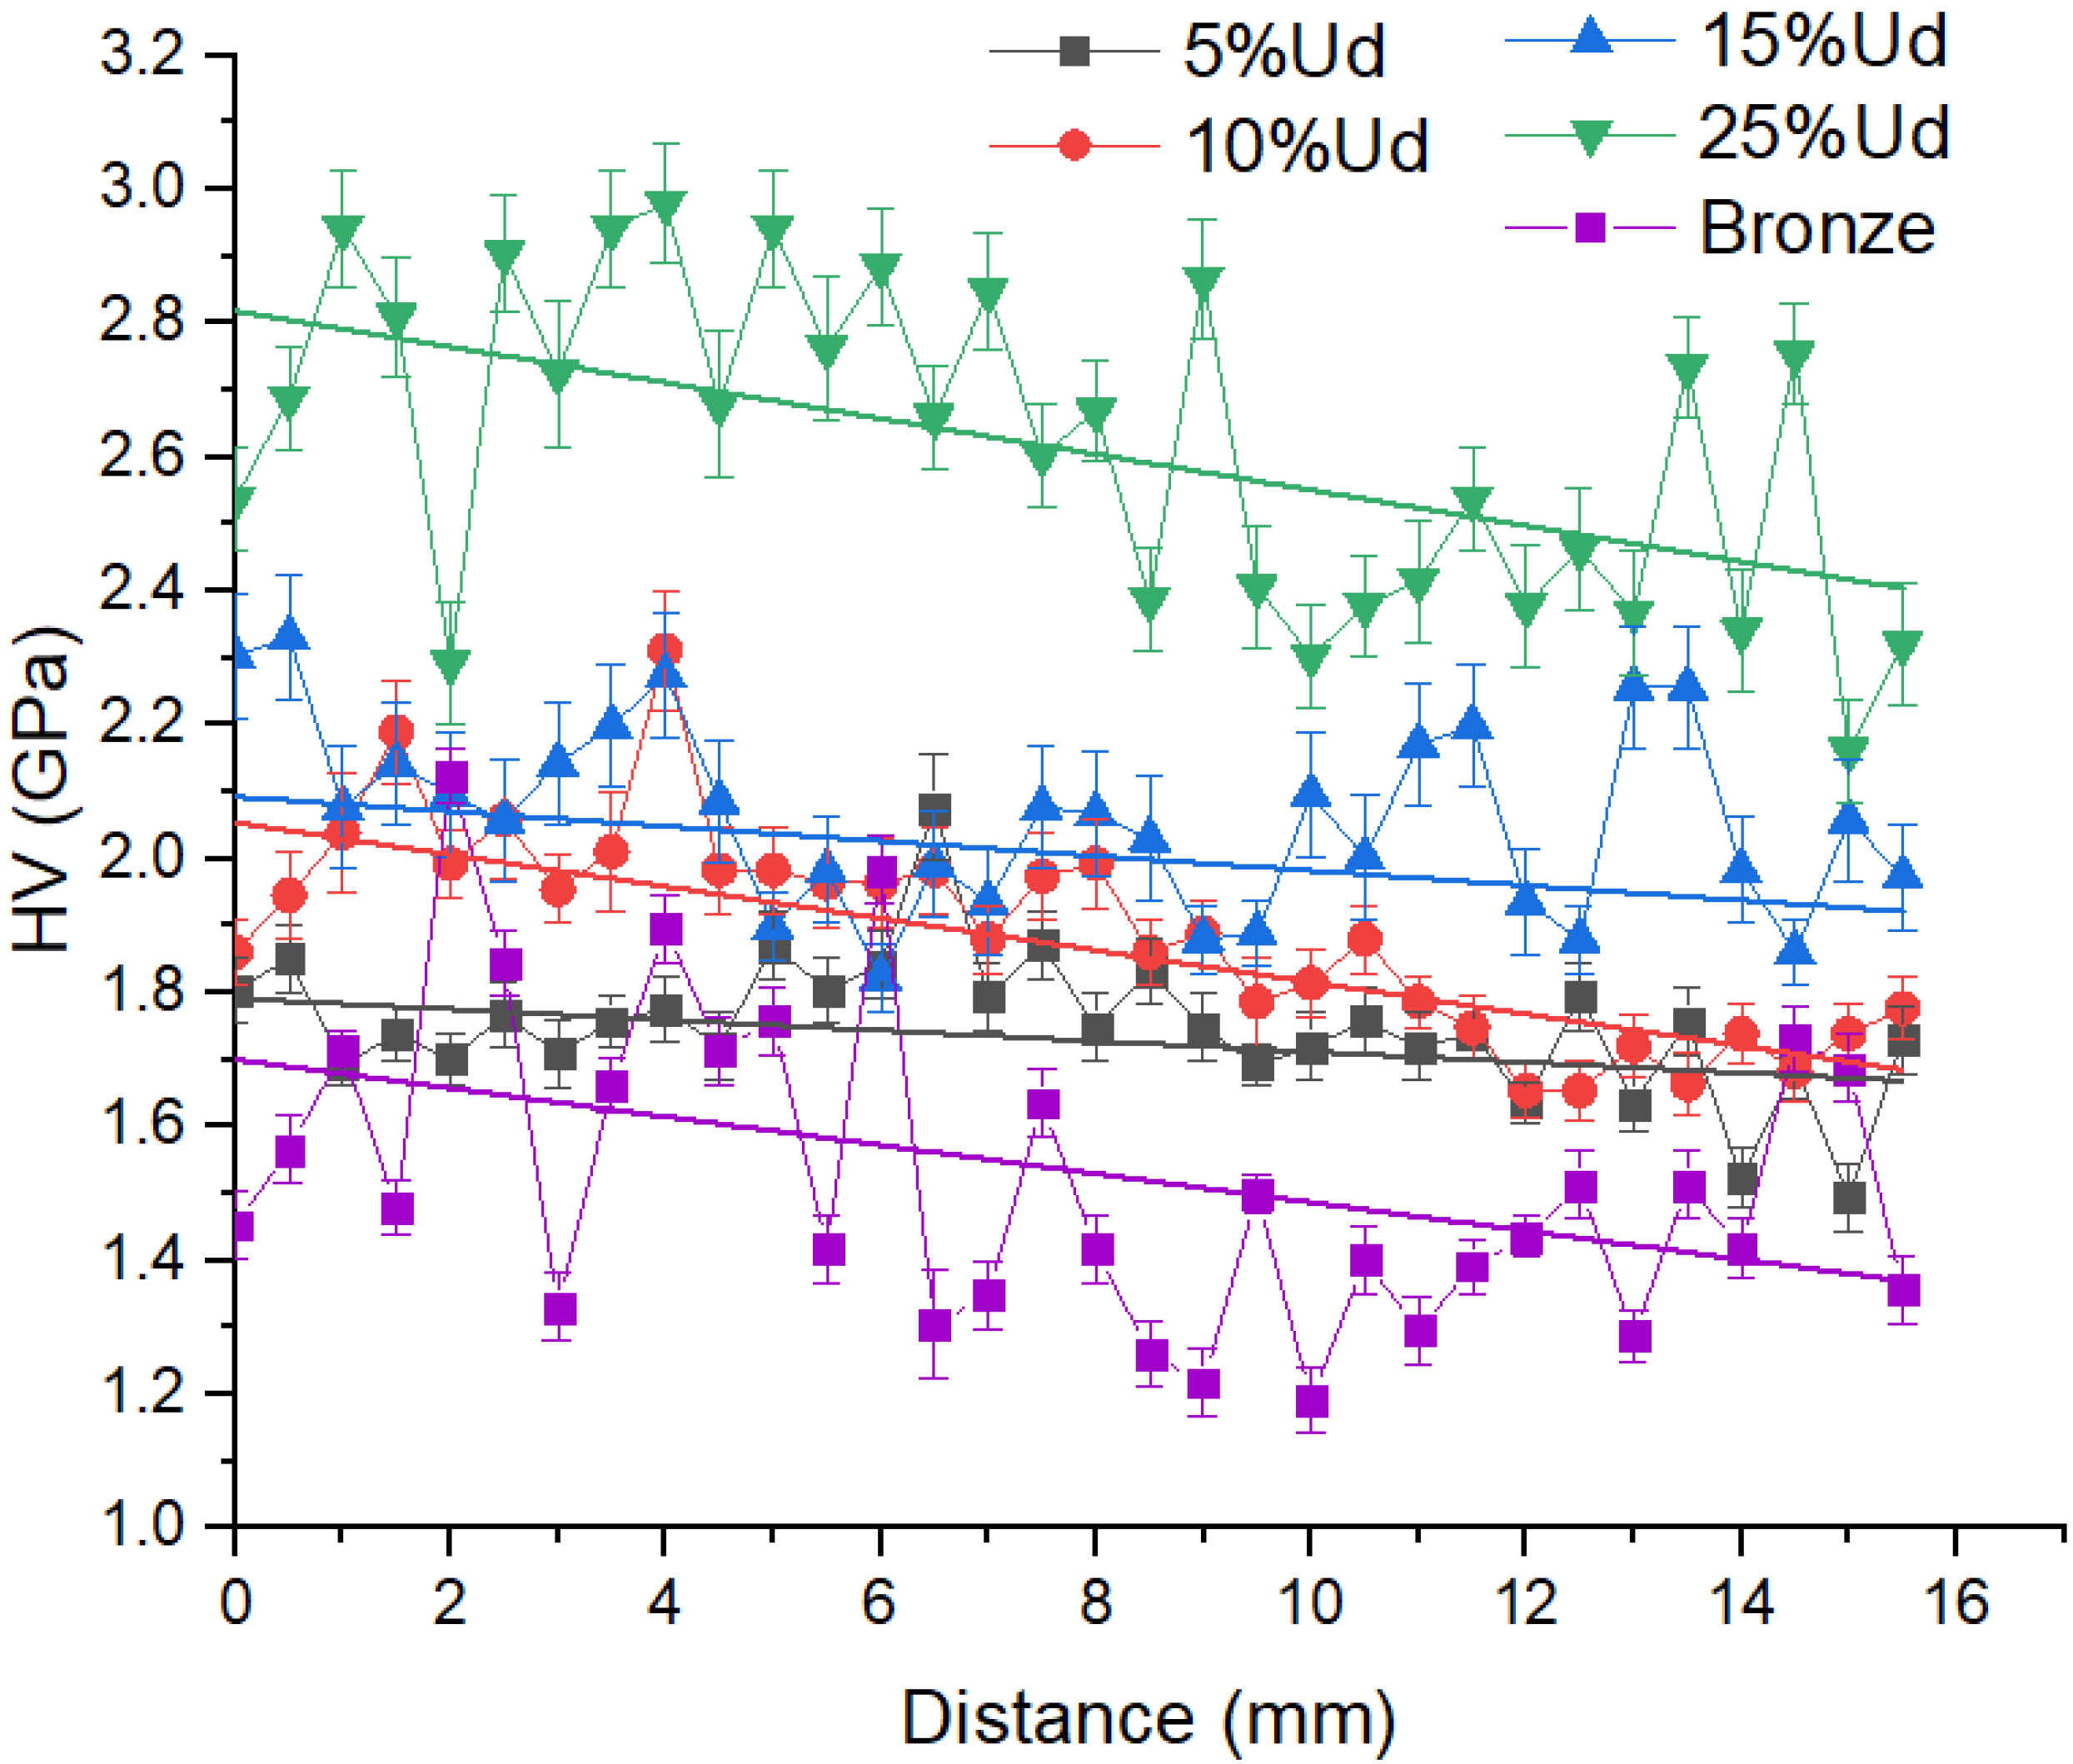
3.3. Microhardness of the Composites “Bronze/Udimet-500”
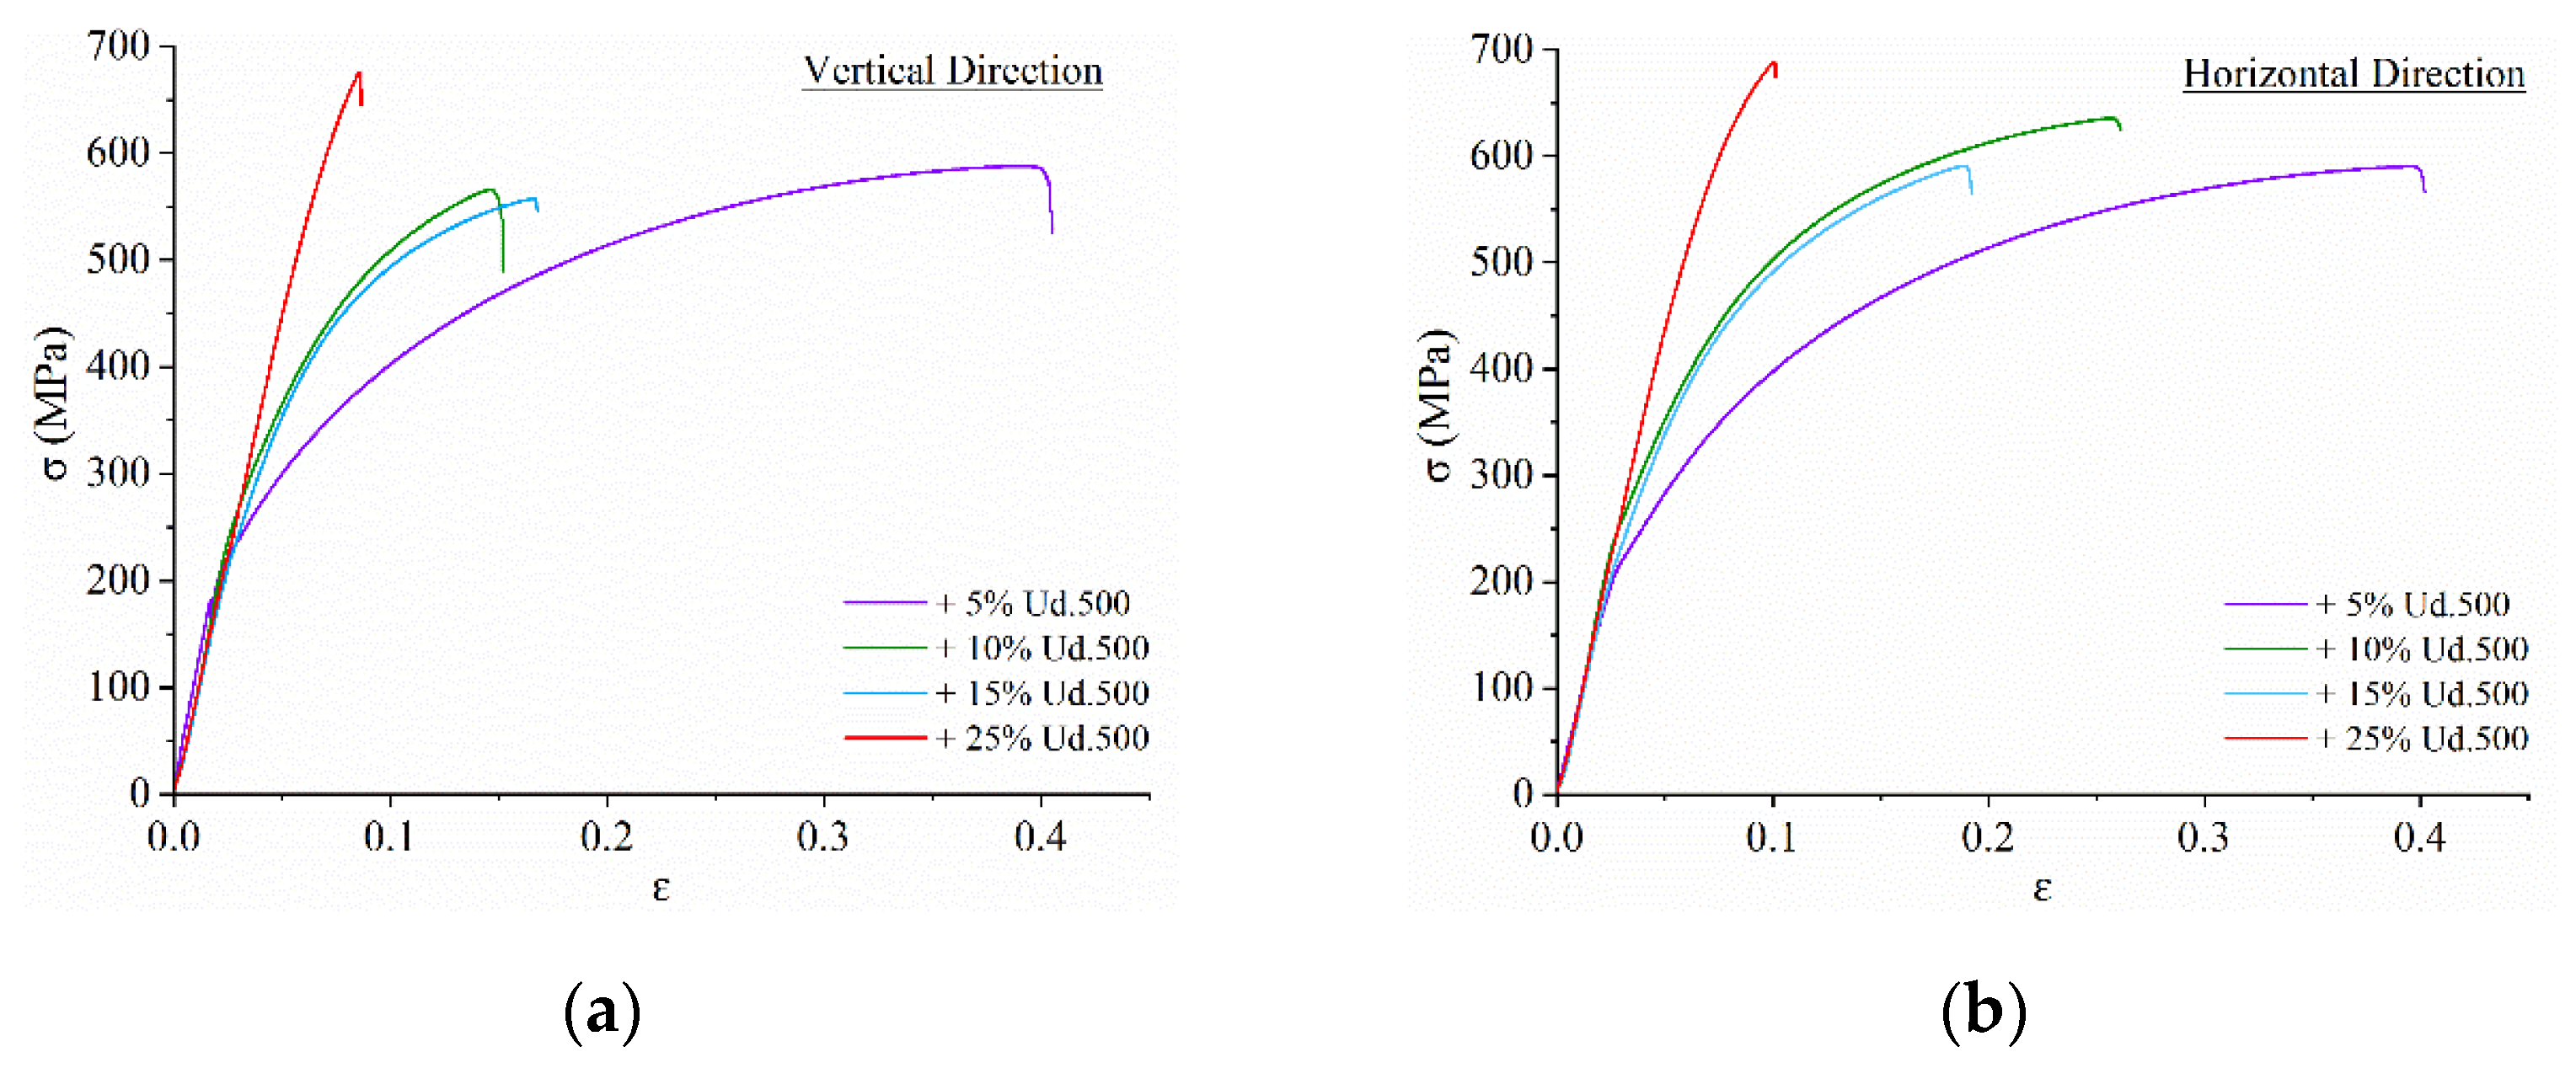
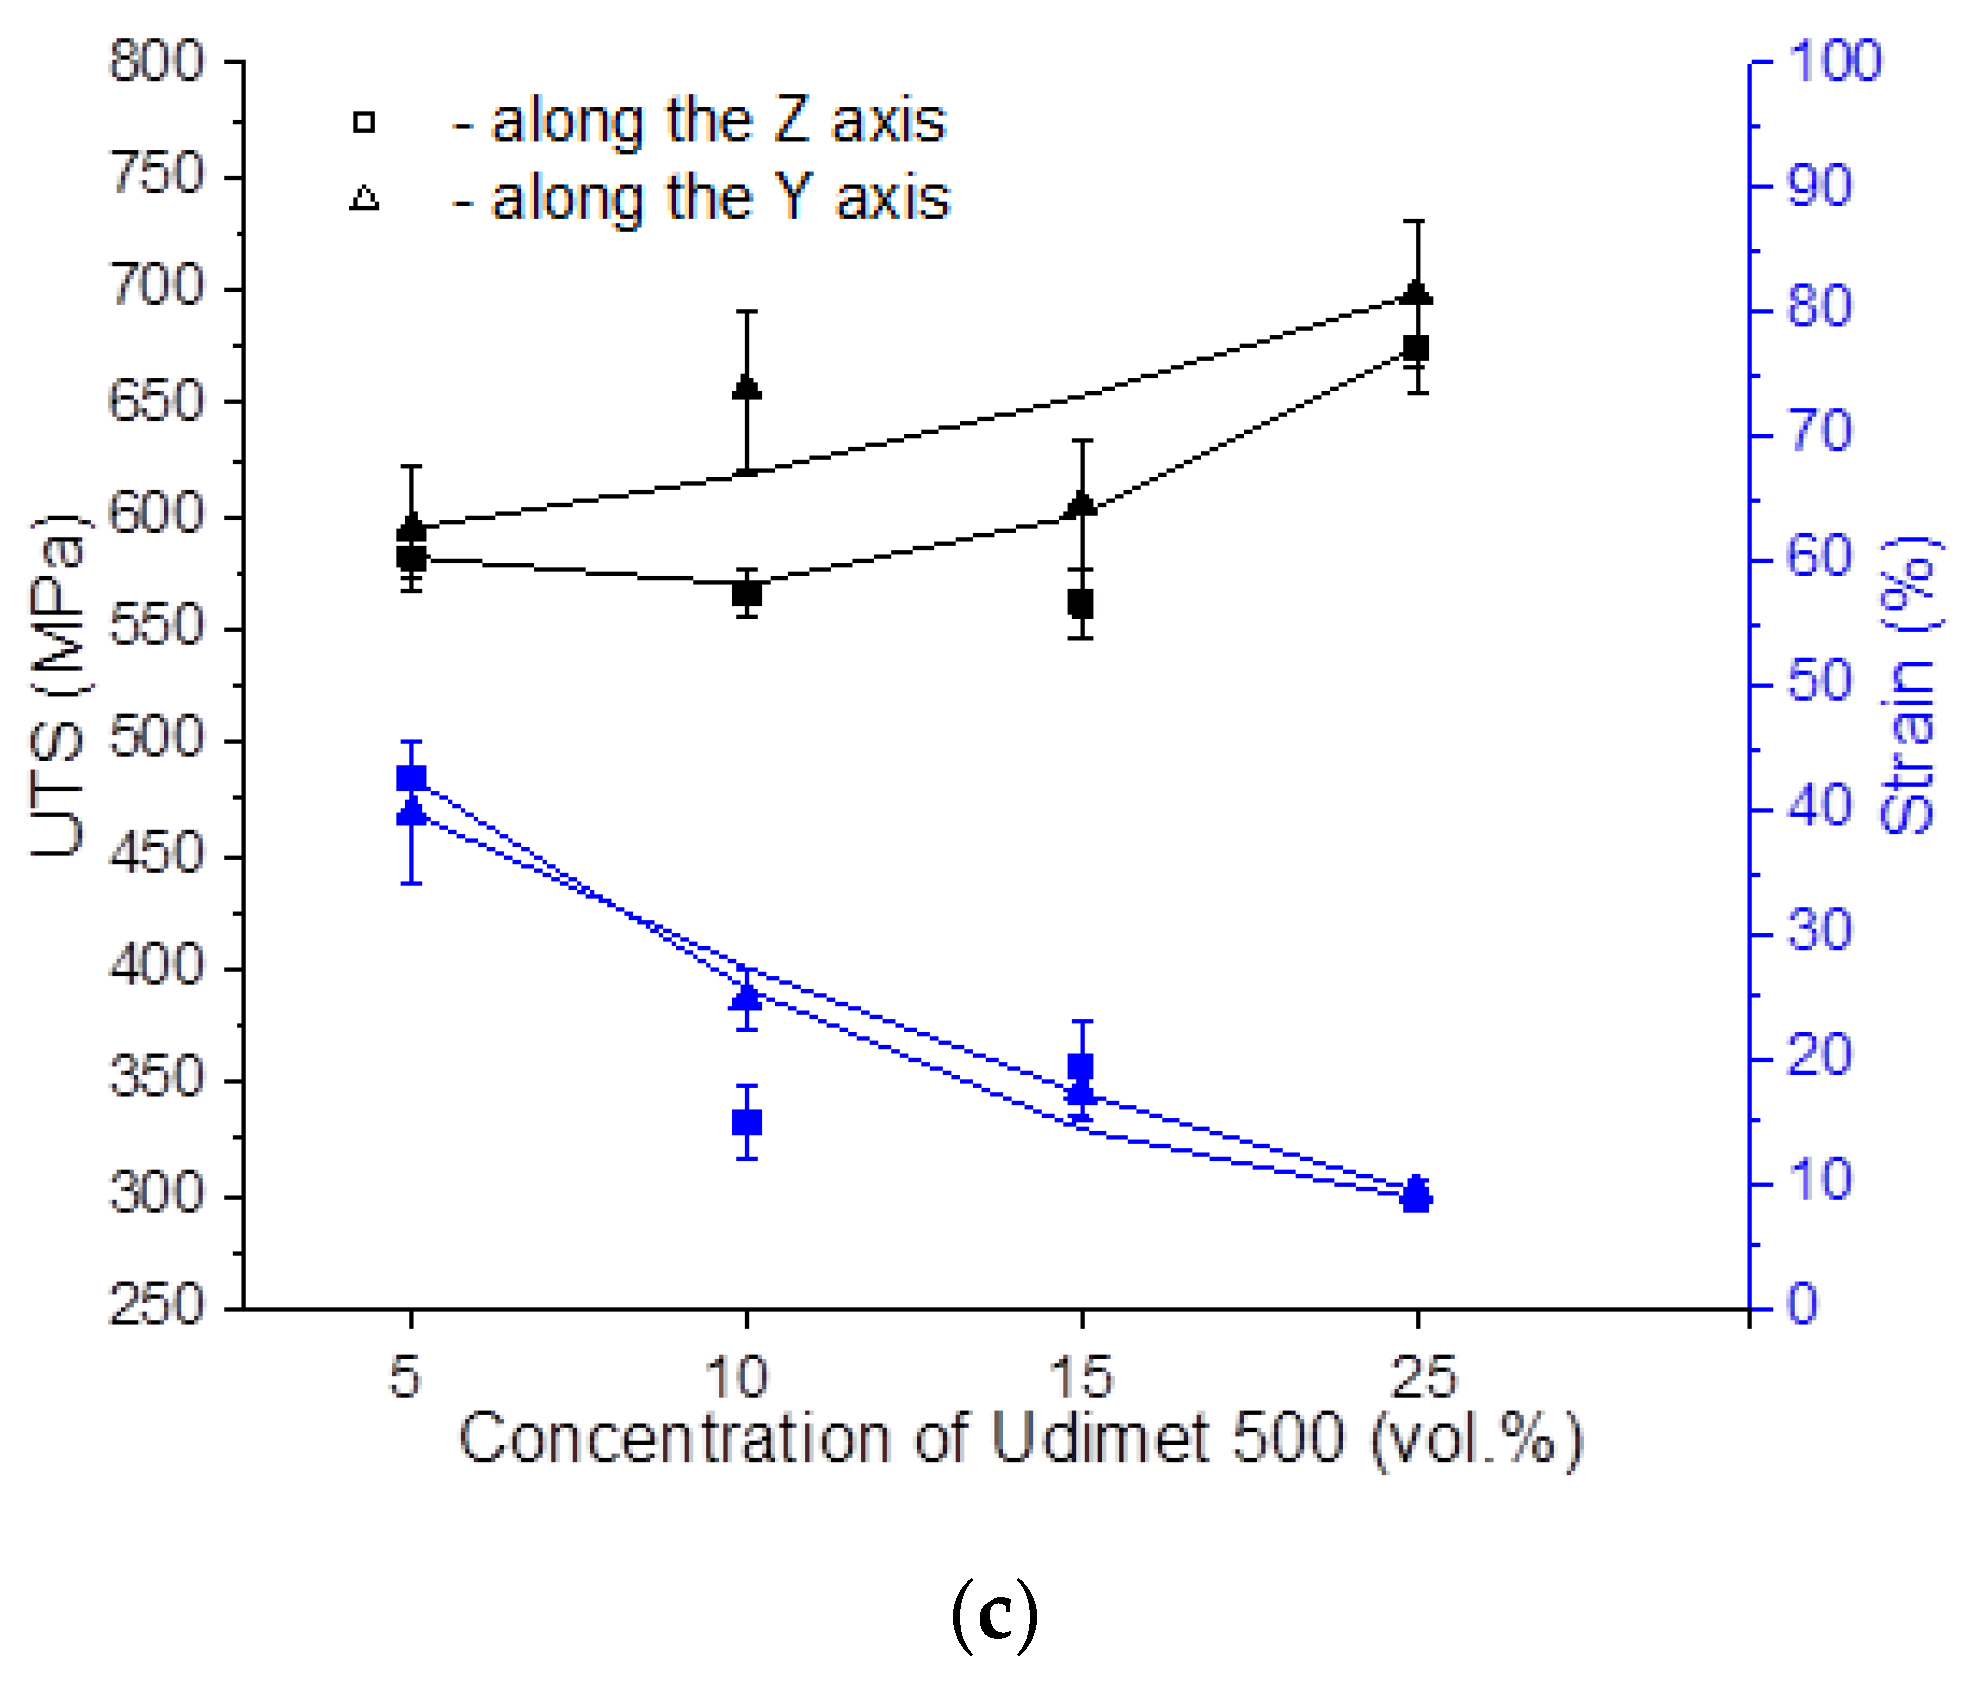
3.4. Mechanical Properties of the Composites “Bronze/Udimet-500”
3.5. Sliding Wear Testing
4. Discussion
5. Conclusions
Author Contributions
Funding
Institutional Review Board Statement
Informed Consent Statement
Data Availability Statement
Acknowledgments
Conflicts of Interest
References
- Cui, S.; Lu, S.; Tieu, K.; Meenashisundaram, G.K.; Wang, L.; Li, X.; Wei, J.; Li, W. Detailed assessments of tribological properties of binder jetting printed stainless steel and tungsten carbide infiltrated with bronze. Wear 2021, 477, 203788. [Google Scholar] [CrossRef]
- Dharmendra, C.; Shakerin, S.; Ram, G.D.J.; Mohammadi, M. Wire-arc additive manufacturing of nickel aluminum bronze/stainless steel hybrid parts—Interfacial characterization, prospects, and problems. Materialia 2020, 13, 100834. [Google Scholar] [CrossRef]
- Dong, L.; Chen, W.; Hou, L.; Liu, Y.; Luo, Q. Metallurgical process analysis and microstructure characterization of the bonding interface of QAl9-4 aluminum bronze and 304 stainless steel composite materials. J. Mater. Process. Technol. 2016, 238, 325–332. [Google Scholar] [CrossRef]
- Karnati, S.; Liou, F.F.; Newkirk, J.W. Characterization of copper–nickel alloys fabricated using laser metal deposition and blended powder feedstocks. Int. J. Adv. Manuf. Technol. 2019, 103, 239–250. [Google Scholar] [CrossRef]
- Li, B.; Han, C.; Lim, C.W.J.; Zhou, K. Interface formation and deformation behaviors of an additively manufactured nickel-aluminum-bronze/15-5 PH multimaterial via laser-powder directed energy deposition. Mater. Sci. Eng. A 2022, 829, 142101. [Google Scholar] [CrossRef]
- Lu, S.L.; Meenashisundaram, G.K.; Wang, P.; Nai, S.M.L.; Wei, J. The combined influence of elevated pre-sintering and subsequent bronze infiltration on the microstructures and mechanical properties of 420 stainless steel additively manufactured via binder jet printing. Addit. Manuf. 2020, 34, 101266. [Google Scholar] [CrossRef]
- Makarenko, K.; Dubinin, O.; Shornikov, P.; Shishkovsky, I. Specific aspects of the transitional layer forming in the aluminium bronze—Stainless steel functionally graded structures after laser metal deposition. Procedia CIRP 2020, 94, 346–351. [Google Scholar] [CrossRef]
- Osipovich, K.S.; Astafurova, E.G.; Chumaevskii, A.V.; Kalashnikov, K.N.; Astafurov, S.V.; Maier, G.G.; Melnikov, E.V.; Moskvina, V.A.; Panchenko, M.Y.; Tarasov, S.Y.; et al. Gradient transition zone structure in “steel–copper” sample produced by double wire-feed electron beam additive manufacturing. J. Mater. Sci. 2020, 55, 9258–9272. [Google Scholar] [CrossRef]
- Zhang, C.; Shirzadi, A. Fail-Safe Joints between Copper Alloy (C18150) and Nickel-Based Superalloy (GH4169) Made by Transient Liquid Phase (TLP) Bonding and Using Boron-Nickel (BNi-2) Interlayer. Metals 2021, 11, 1504. [Google Scholar] [CrossRef]
- Davis, J.R. ASM Specialty Handbook—Copper and Copper Alloys; ASM International: Novelty, OH, USA, 2001; p. 133. [Google Scholar]
- Meigh, H.J. Cast and Wrought Aluminium Bronzes: Properties, Processes and Structure; CRC Press: London, UK, 2000; p. 404. [Google Scholar]
- Dharmendra, C.; Hadadzadeh, A.; Amirkhiz, B.S.; Janaki Ram, G.D.; Mohammadi, M. Microstructural evolution and mechanical behavior of nickel aluminum bronze Cu-9Al-4Fe-4Ni-1Mn fabricated through wire-arc additive manufacturing. Addit. Manuf. 2019, 30, 100872. [Google Scholar] [CrossRef]
- Tao, X.P.; Zhang, S.; Zhang, C.H.; Wu, C.L.; Chen, J.; Abdullah, A.O. Effect of Fe and Ni contents on microstructure and wear resistance of aluminum bronze coatings on 316 stainless steel by laser cladding. Surf. Coat. Technol. 2018, 342, 76–84. [Google Scholar] [CrossRef]
- Zykova, A.; Panfilov, A.; Chumaevskii, A.V.; Nikonov, S.; Moskvichev, E.; Gurianov, G.; Savchenko, N.; Tarasov, S.; Kolubaev, E. Formation of microstructures and mechanical characteristics in electron beam additive manufacturing of an aluminum bronze with in-situ adjusting the heat input. Russ. Phys. J. 2022, 65, 2022. (In Russian) [Google Scholar] [CrossRef]
- Amato, K.N.; Gaytana, S.M.; Murra, L.E.; Martinez, E.; Shindo, P.W.; Hernandez, J.; Collins, S.; Medina, F. Microstructures and mechanical behavior of Inconel 718 fabricated by selective laser melting. Acta Mater. 2012, 60, 2229–2239. [Google Scholar] [CrossRef]
- Lu, F.; Wan, H.; Ren, X.; Huang, L.; Liu, H.; Yi, X. Mechanical and microstructural characterization of additive manufactured Inconel 718 alloy by selective laser melting and laser metal deposition. J. Iron Steel Res. Int. 2022, 29, 1322–1333. [Google Scholar] [CrossRef]
- Hales, S.J.; Domack, C.S.; Taminger, K.M. Electron Beam Freeform Fabrication of Dissimilar Materials: Cracking in Inconel625 Deposited on GRCop-84; NASA/TP–2020-5005040; NASA: Washington, DC, USA, 2020.
- Onuike, B.; Bandyopadhyay, A. Bond strength measurement for additively manufactured Inconel 718- GRCop84 copper alloy bimetallic joints. Addit. Manuf. 2019, 27, 576–585. [Google Scholar] [CrossRef] [PubMed]
- Pretorius, R.; Vredenberg, A.M.; Saris, F.W.; de Reus, R. Prediction of phase formation sequence and phase stability in binary metal-aluminum thin-film systems using the effective heat of formation rule. J. Appl. Phys. 1991, 70, 3636–3646. [Google Scholar] [CrossRef]


| Material | Elements, wt.% | |||||||||||
|---|---|---|---|---|---|---|---|---|---|---|---|---|
| Al | Mn | Fe | Zn | Cu | Cr | Co | Mo | Ti | Si | Zr | Ni | |
| CuAl9Mn2 | 9.3 ± 1.4 | 1.9 ± 0.04 | 0.3 ± 0.01 | 0.4 ± 0.02 | bal. | - | - | - | - | - | - | - |
| Udimet-500 | 1.6 ± 0.2 | 0.1 ± 0.04 | 0.4 ± 0.02 | 0.04 ± 0.01 | - | 17.3 ± 0.1 | 13.2 ± 0.1 | 4.3 ± 0.03 | 2.7 ± 0.1 | 0.3 ± 0.03 | 0.04 ± 0.002 | bal. |
| 5% Ud | 6.1 ± 0.6 | 1.5 ± 0.03 | 0.3 ± 0.01 | 0.3 ± 0.01 | 85.9 ± 0.6 | 0.9 ± 0.02 | 0.8 ± 0.01 | 0.3 ± 0.01 | 0.2 ± 0.01 | - | - | 3.6 ± 0.05 |
| 10% Ud | 6.4 ± 0.5 | 1.4 ± 0.03 | 0.3 ± 0.01 | 0.2 ± 0.01 | 80.4 ± 0.4 | 2.1 ± 0.04 | 1.5 ± 0.02 | 0.5 ± 0.01 | 0.4 ± 0.02 | - | - | 6.7 ± 0.1 |
| 15% Ud | 5.9 ± 0.5 | 1.4 ± 0.03 | 0.3 ± 0.01 | 0.1 ± 0.02 | 75.3 ± 0.4 | 3.2 ± 0.05 | 2.2 ± 0.03 | 0.8 ± 0.01 | 0.5 ± 0.02 | - | - | 10.1 ± 0.1 |
| 25% Ud | 6.1 ± 0.6 | 1.1 ± 0.03 | 0.3 ± 0.01 | - | 64.1 ± 0.5 | 5.2 ± 0.06 | 3.7 ± 0.03 | 1.0 ± 0.02 | 0.9 ± 0.03 | - | - | 17.6 ± 0.1 |
| Spectrum | Chemical Composition | |||||||||||||||||
|---|---|---|---|---|---|---|---|---|---|---|---|---|---|---|---|---|---|---|
| Al | Ti | Cr | Mn | Fe | Co | Ni | Cu | Mo | ||||||||||
| wt.% | at.% | wt.% | at.% | wt.% | at.% | wt.% | at.% | wt.% | at.% | wt.% | at.% | wt.% | at.% | wt.% | at.% | wt.% | at.% | |
| 1 | 8.7 | 17.3 | 2.9 | 3.4 | 8.2 | 8.5 | 1.9 | 1.9 | 1.3 | 1.3 | 10.8 | 9.9 | 33.9 | 31.1 | 29.9 | 25.4 | 2.3 | 1.3 |
| 2 | 8.3 | 16.9 | 3.1 | 3.5 | 1.9 | 2.0 | 1.9 | 1.9 | 0.8 | 0.8 | 9.2 | 8.5 | 27.2 | 25.3 | 47.6 | 41.0 | - | - |
| 3 | 6.9 | 14.3 | 2.6 | 3.1 | 1.1 | 1.1 | 1.6 | 1.6 | 0.8 | 0.8 | 7.7 | 7.3 | 23.7 | 22.7 | 55.6 | 49.1 | - | - |
| 4 | 2.5 | 5.2 | 1.2 | 1.4 | 53.8 | 57.3 | 1.1 | 1.1 | 1.6 | 1.6 | 6.3 | 5.9 | 10.3 | 9.7 | 14.9 | 13.0 | 8.2 | 4.7 |
| Spectrum | Chemical Composition | |||||||||||||||||
|---|---|---|---|---|---|---|---|---|---|---|---|---|---|---|---|---|---|---|
| Al | Ti | Cr | Mn | Fe | Co | Ni | Cu | Mo | ||||||||||
| wt.% | at.% | wt.% | at.% | wt.% | at.% | wt.% | at.% | wt.% | at.% | wt.% | at.% | wt.% | at.% | wt.% | at.% | wt.% | at.% | |
| 1 | 2.6 | 5.8 | - | - | - | - | 1.0 | 1.1 | 0.4 | 0.5 | 0.9 | 0.9 | 7.5 | 7.7 | 87.6 | 83.9 | - | - |
| 2 | 11.6 | 22.1 | 5.1 | 5.5 | 2.2 | 2.3 | 1.7 | 1.6 | 0.8 | 0.7 | 12.3 | 10.7 | 50.5 | 44.3 | 15.9 | 12.9 | - | - |
| 3 | 9.3 | 17.6 | 2.7 | 2.9 | 37.7 | 37.1 | 1.3 | 1.2 | 0.9 | 0.9 | 8.0 | 7.0 | 28.2 | 24.5 | 9.6 | 7.7 | 2.3 | 1.1 |
| 4 | 3.1 | 6.0 | 1.3 | 1.4 | 71.3 | 72.5 | - | - | 0.9 | 0.8 | 5.8 | 5.2 | 8.5 | 7.7 | 4.9 | 4.1 | 4.2 | 2.3 |
| 5 | 6.4 | 13.5 | 1.9 | 2.2 | 1.2 | 1.3 | 1.0 | 1.1 | 0.6 | 0.6 | 5.8 | 5.6 | 24.9 | 24.1 | 58.2 | 51.8 | - | - |
| 6 | 4.3 | 9.3 | 1.8 | 2.1 | 0.9 | 1.1 | 0.9 | 1.0 | 0.6 | 0.7 | 4.7 | 4.7 | 20.6 | 20.4 | 66.1 | 60.7 | - | - |
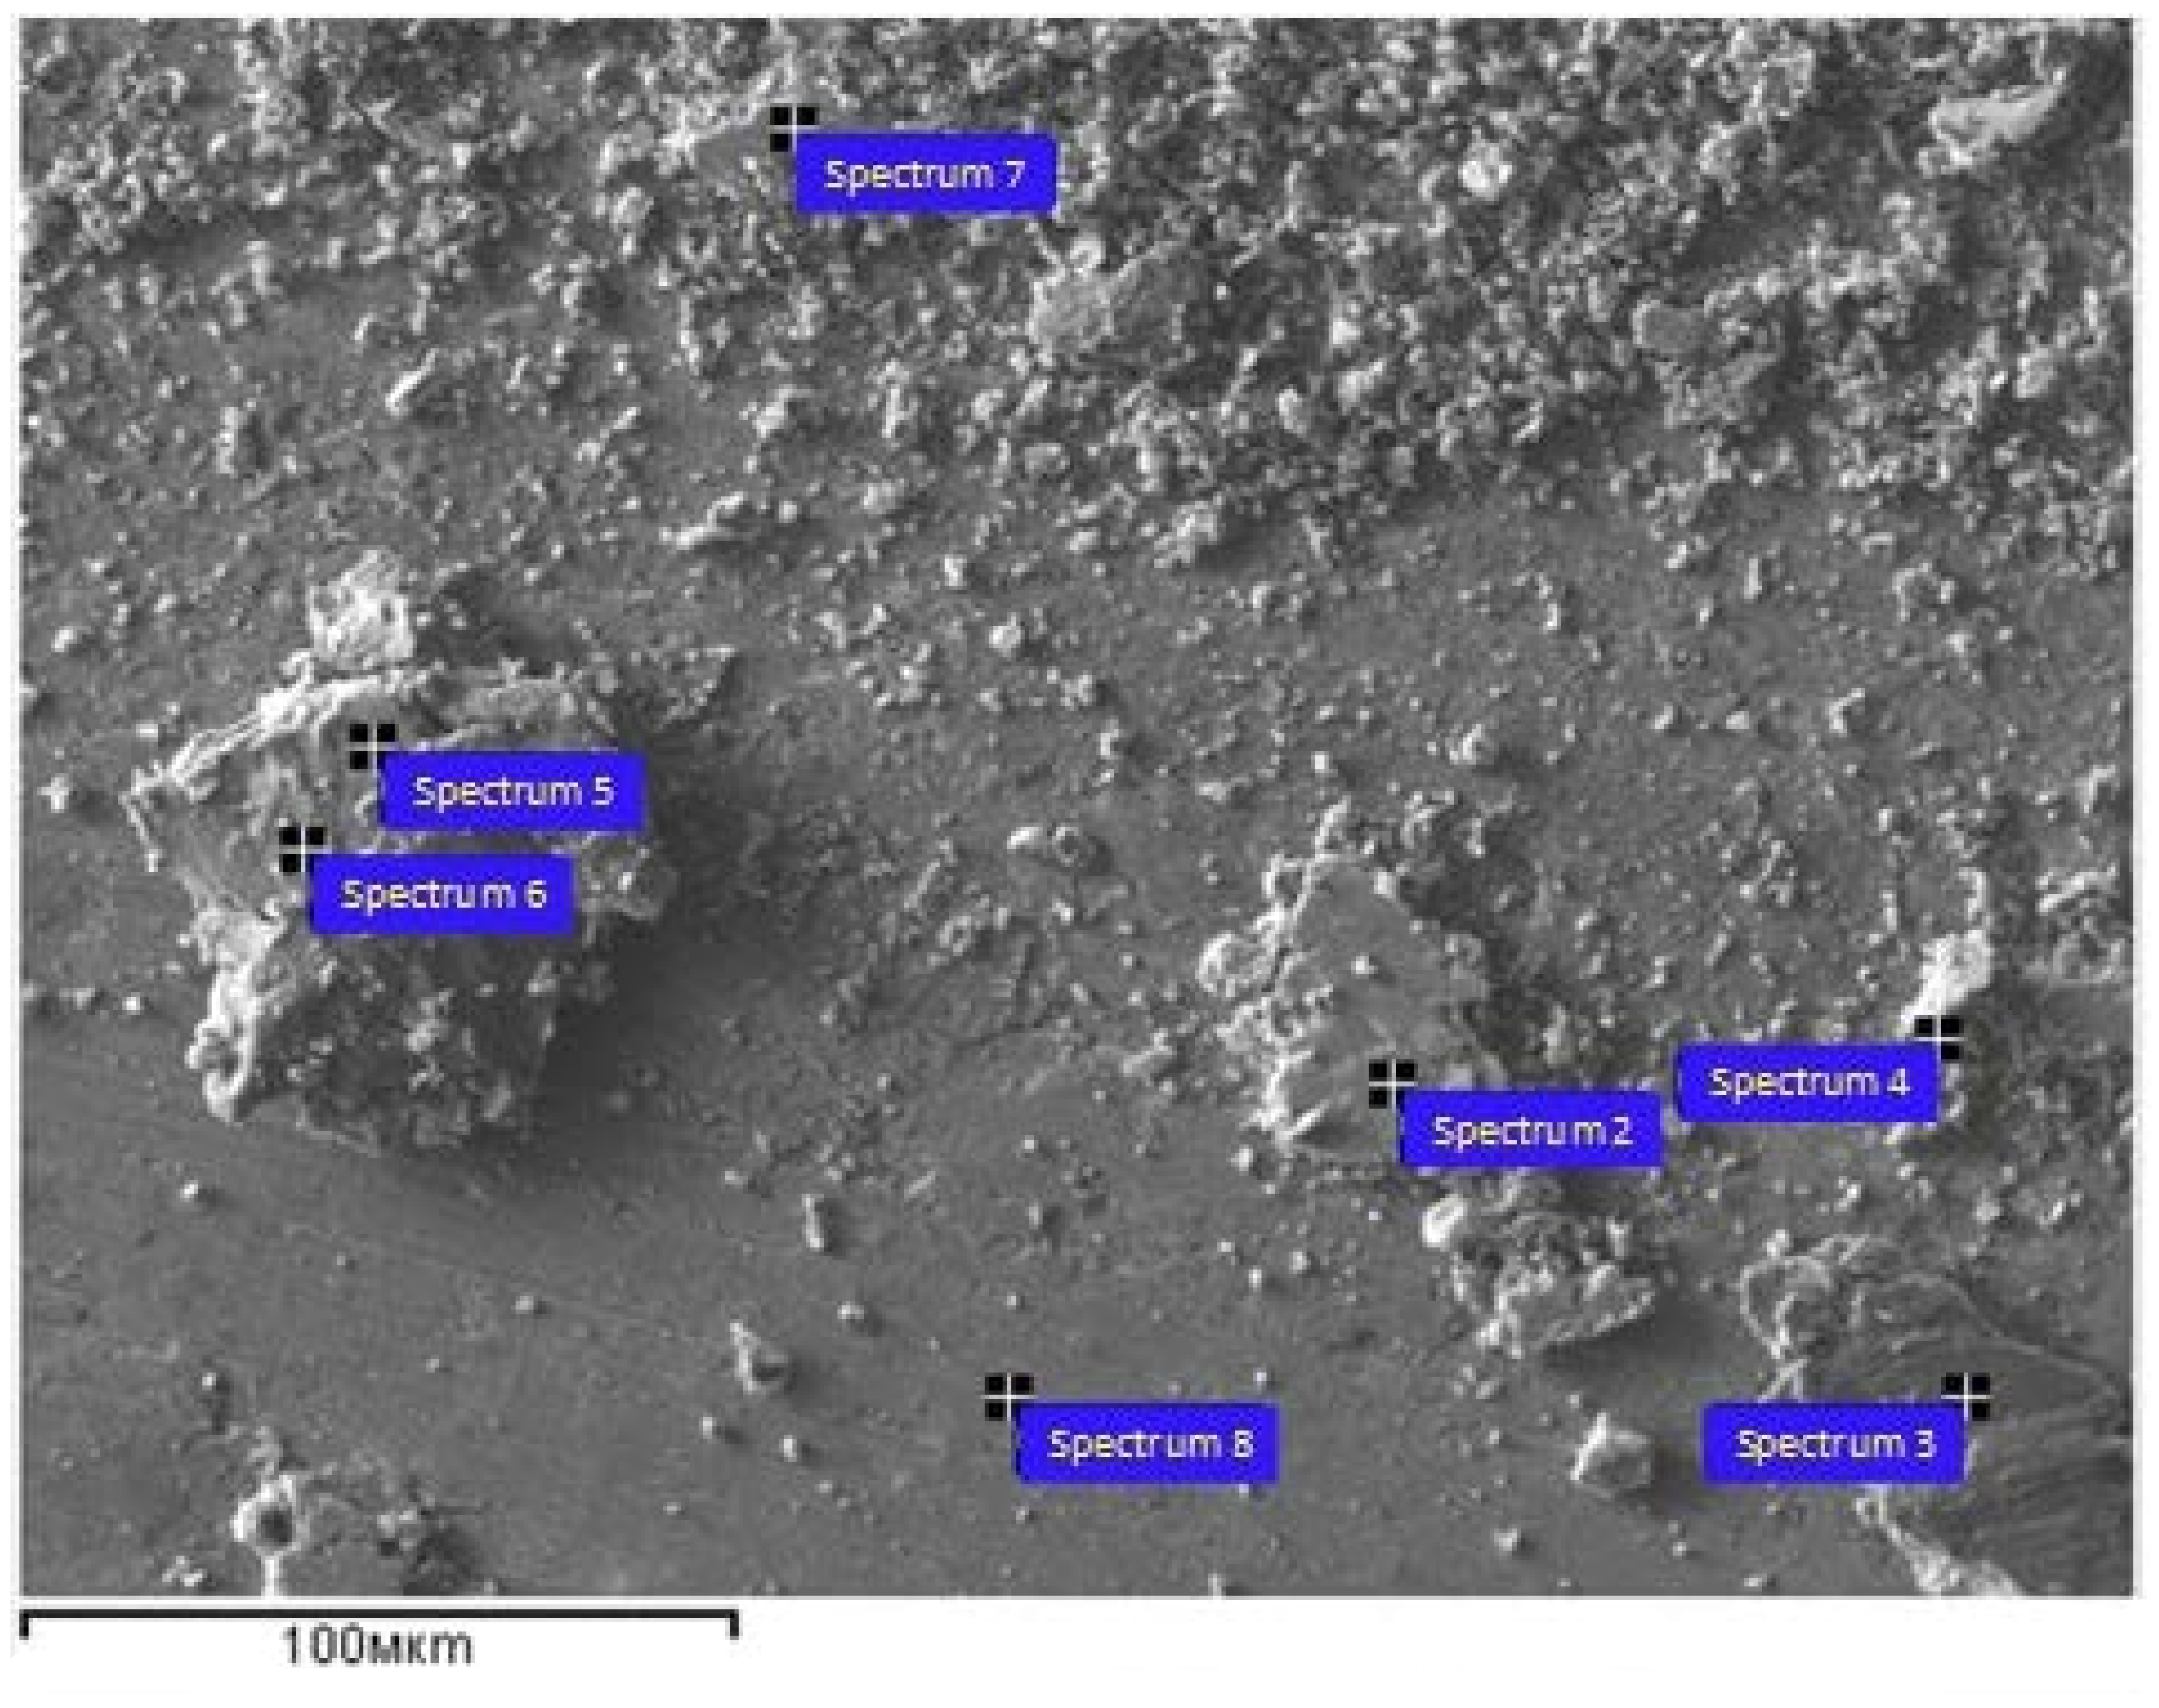
| Spectrum | Chemical Composition | |||||||||||||
|---|---|---|---|---|---|---|---|---|---|---|---|---|---|---|
| O | Al | Cr | Mn | Co | Ni | Cu | ||||||||
| wt.% | at.% | wt.% | at.% | wt.% | at.% | wt.% | at.% | wt.% | at.% | wt.% | at.% | wt.% | at.% | |
| 2 | 8.0 | 23.8 | 7.1 | 12.5 | 0.2 | 0.2 | 1.4 | 1.2 | 0.4 | 0.4 | 2.9 | 2.4 | 79.9 | 59.6 |
| 3 | 5.1 | 16.1 | 7.6 | 14.2 | 1.0 | 0.9 | 1.4 | 1.2 | 0.3 | 0.3 | 2.8 | 2.4 | 81.8 | 64.8 |
| 4 | - | - | 0.3 | 0.7 | 0.8 | 0.9 | 1.8 | 2.1 | 0.6 | 0.6 | 2.8 | 4.2 | 93.5 | 94.5 |
| 5 | 0.9 | 3.0 | 6.6 | 13.8 | 0.2 | 0.2 | 1.4 | 1.5 | 0.2 | 0.2 | 3.0 | 2.9 | 87.8 | 78.4 |
| 6 | 2.6 | 8.7 | 7.2 | 14.4 | 0.7 | 0.8 | 1.7 | 1.7 | 0.7 | 0.7 | 3.9 | 3.6 | 83.1 | 70.2 |
| 7 | 9.6 | 27.6 | 6.5 | 11.1 | 0.5 | 0.4 | 1.3 | 1.1 | 0.5 | 0.4 | 3.4 | 2.7 | 78.2 | 56.7 |
| 8 | 0.6 | 2.2 | 6.9 | 14.7 | 0.3 | 0.4 | 1.3 | 1.4 | 0.3 | 0.3 | 2.7 | 2.6 | 87.8 | 78.5 |
Publisher’s Note: MDPI stays neutral with regard to jurisdictional claims in published maps and institutional affiliations. |
© 2022 by the authors. Licensee MDPI, Basel, Switzerland. This article is an open access article distributed under the terms and conditions of the Creative Commons Attribution (CC BY) license (https://creativecommons.org/licenses/by/4.0/).
Share and Cite
Zykova, A.; Chumaevskii, A.; Panfilov, A.; Vorontsov, A.; Nikolaeva, A.; Osipovich, K.; Gusarova, A.; Chebodaeva, V.; Nikonov, S.; Gurianov, D.; et al. Aluminum Bronze/Udimet 500 Composites Prepared by Electron-Beam Additive Double-Wire-Feed Manufacturing. Materials 2022, 15, 6270. https://doi.org/10.3390/ma15186270
Zykova A, Chumaevskii A, Panfilov A, Vorontsov A, Nikolaeva A, Osipovich K, Gusarova A, Chebodaeva V, Nikonov S, Gurianov D, et al. Aluminum Bronze/Udimet 500 Composites Prepared by Electron-Beam Additive Double-Wire-Feed Manufacturing. Materials. 2022; 15(18):6270. https://doi.org/10.3390/ma15186270
Chicago/Turabian StyleZykova, Anna, Andrey Chumaevskii, Aleksandr Panfilov, Andrey Vorontsov, Aleksandra Nikolaeva, Kseniya Osipovich, Anastasija Gusarova, Valentina Chebodaeva, Sergey Nikonov, Denis Gurianov, and et al. 2022. "Aluminum Bronze/Udimet 500 Composites Prepared by Electron-Beam Additive Double-Wire-Feed Manufacturing" Materials 15, no. 18: 6270. https://doi.org/10.3390/ma15186270
APA StyleZykova, A., Chumaevskii, A., Panfilov, A., Vorontsov, A., Nikolaeva, A., Osipovich, K., Gusarova, A., Chebodaeva, V., Nikonov, S., Gurianov, D., Filippov, A., Dobrovolsky, A., Kolubaev, E., & Tarasov, S. (2022). Aluminum Bronze/Udimet 500 Composites Prepared by Electron-Beam Additive Double-Wire-Feed Manufacturing. Materials, 15(18), 6270. https://doi.org/10.3390/ma15186270