Abstract
To study the small strain shear modulus (Gmax) of saturated sand-silt mixed soil materials, a series of tests were conducted using the bender element apparatus, and the influences of fines content (FC), relative density (Dr), and effective confining pressure () were taken into consideration. The test results indicate that the Gmax of the mixed soil materials decreases first and then increases with the FC up to 100% with Dr = 35% and 50%, while the Gmax decreases with the increasing FC when Dr = 60%. Moreover, for a given Dr, the Gmax increases with the increasing , and the increase rate keeps constant under various FCs. The Gmax of specimens under various FCs decreases with the increase of the void ratio (e). The decrease rate between the Gmax and e differs when the is given, which is influenced by the FC. The Gmax of the mixed soil materials can be evaluated by the Hardin model when the FC is determined. The best-fitting parameter A of the Hardin model first decreases and then increases as FC increases. The revised Hardin model, considering the influence of FC, , and e, can be used to evaluate the Gmax for different types of sand-silt mixed soil materials. The error between the evaluated and tested Gmax is less than 10%.
1. Introduction
Small strain shear modulus Gmax, which is denoted as the shear modulus at small strain (i.e., below 10−5), is often used as an important mechanical index in soil material stability evaluation and numerical simulation [1,2]. Simultaneously, the angle of repose and packing fraction are most often considered as observables characterizing the mechanics of a granular material. The angle of repose is used for the determination of slope stability and design of retaining structures. Elekes and Parteli [3] established a model for predicting the angle of repose both on Earth and in other planetary environments by systematically considering the effect of sliding and rolling resistance, and nonbonded attractive particle–particle interactions. On the other hand, packing fraction can be used to develop a relationship between the particle-level interactions and the macroscopic structure [4]. In this paper, the dynamic properties of soil materials were investigated from the view of Gmax, regardless of the angle of repose and packing fraction.
Gmax is influenced by various factors, such as void ratio (e) [5], particle properties [6,7,8], uniformity coefficient (Cu) [9], fines content [10,11,12], fabric [13,14], stress history, and state [15,16], etc. Moreover, Gmax is proved to be incredibly sensitive to e and effective confining pressure (). Considerable investigations have been performed on clean sand [6,17]. The fact is, most of the soil materials in nature are not pure sand or silt. Instead, sand-silt mixed soil materials with various fines content (FC, the mass percentage of soil with a particle size less than 0.075 mm) not only extensively exist in natural strata such as colluvium deposits, alluvial deposits, and glacial tills, but also have many applications in man-made constructions, including land reclamation, dams, and subgrades [18,19]. Therefore, the evaluation of sand-silt behavior as a common geomaterial-mixed material could be of particular interest. Many scholars have researched the impact of FC on Gmax. For instance, Iwasaki and Tatsuoka [20] first revealed that the Gmax of Iruma Sand with the same Cu decreased with FC up to 15%. Yang and Liu [21] also observed a similar phenomenon in quartz sand with FC of up to 30%. Choo and Burns [22] performed bender element tests on sand-silt mixed soil materials and found that the shear velocity (Vs) decreased with increasing FC under the same relative density (Dr). Wichtmann et al. [23] conducted resonant column tests on quartz sand with different Cu and FC and established the empirical formulas for parameters A, n, and c with FC and Cu. Cheng et al. [11] reported that the Gmax of silty sand initially decreases and then increases with increasing plastic FC from 0 to 50%. Thevanayagam and Liang [24] and Goudarzy et al. [25,26] adopted the equivalent granular void ratio (e∗) instead of e in Equation (1). However, the relationships that many scholars have attempted to establish are discrepant and dependent on special sand and fines materials in specific areas. Therefore, the Gmax behavior of mixed soil materials still deserves further investigation.
There exist various kinds of Gmax test methods, such as the resonant column method and the bender element method. The bender element method is widely applied to the test Gmax, because of its simple principle, convenient operation, and non-destructive inspection [27,28]. A series of bender element tests were conducted to study the Gmax of the saturated sand-silt mixed soil materials with a wider range of FC in this study than that in previous studies. The influences of FC, Dr, and were taken into consideration. The empirical Gmax evaluation model of various mixed soil materials was finally proposed.
2. Bender Element Test
2.1. Test Apparatus
The measurement of shear wave velocity (Vs) and associated Gmax was implemented using a pair of piezoceramic bender elements (BEs) installed in the GCTS HCA-300 (Tempe, AZ, USA) dynamic hollow cylinder-TSH testing system to excite the sample in the form of a sinusoidal wave. The test apparatus is shown in Figure 1. The confining and back pressure are measured by the standard pressure/volume controller. The axial static and dynamic forces can be controlled independently. The maximum range of the dynamic force can be 10 kN/5 Hz. The sensor for the axial force and displacement is placed at the top of the sample. The back pressure is applied at the top of the sample, and the excess pore water pressure is measured at the bottom of the sample. The testing principle of the bender element system is detailed in Hardin and Black [15] and Goudarzy et al. [26].
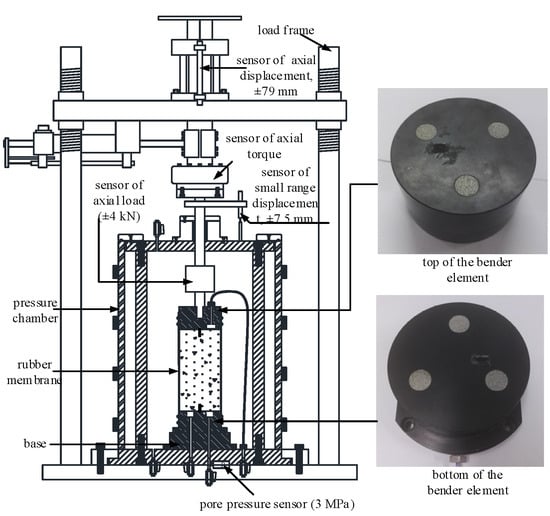
Figure 1.
Bender element test apparatus.
First, the Vs is calculated as following:
where d is the effective distance of the shear wave propagation and its unit is m; t is the time of the shear wave propagation and its unit is s. The time domain method was used to determine t considering the simplicity and accuracy [29,30]. Then, the Gmax value can be determined:
where the unit of Gmax is MPa, the unit of Vs is m/s, and ρ is the dry density and its unit is kg/m3.
2.2. Test Material
The tested sand-silt mixed soil materials were taken from the tidal flat sediment in Nantong Gulf in China. The mixed materials with a particle size of less than 0.075 mm obtained by sieving are regarded as pure fines, and the rest of the particles are regarded as clean sand. The clean sand is a fine-grained, angular siliceous sand, and the pure fines is a non-plastic, sub-angular fines. Table 1 presents the basic index properties of the tested clean sand and pure fines according to ASTM D422, D4253, and D4254, and Figure 2 shows the particle size distributions of clean sand and pure fines. The non-plastic Nantong silt (pure fines) is added into the clean sands to achieve the mixed materials with FC from 0% to 100% by mass. The grain size distribution curves of the mixtures with various FC are also shown in Figure 2. The variation of the minimum void ratio (emin) and maximum void ratio (emax) versus FC of the mixtures is shown in Figure 3. It illustrates that when FC ≤ 30%, the values of emin and emax decrease with the increasing FC, and when FC > 30%, the values of emin and emax increase with the increasing FC, which indicates the presence of a threshold (around FC = 30%) for the effect of FC on emin and emax.

Table 1.
The basic physical properties of the sand and fines.
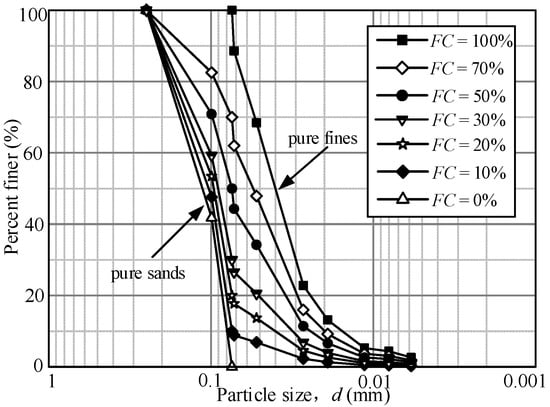
Figure 2.
The particle size distribution curves of the sand-silt mixtures.
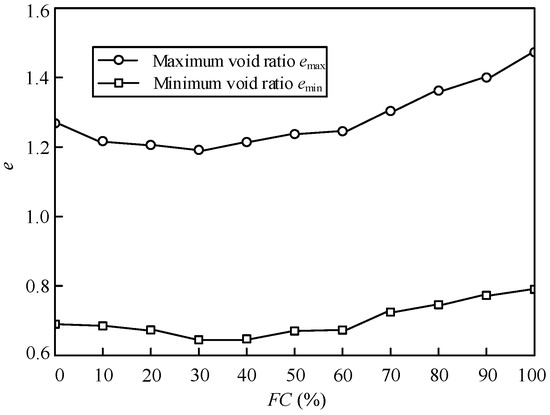
Figure 3.
Variation of emin and emax versus FC of the sand-silt mixtures.
2.3. Test Procedure
The tested specimen is a solid cylinder with a 100 mm diameter and a 200 mm height, and the moist tamping method was introduced to prepare the specimens [31]. All specimens were tested after saturation. Carbon dioxide flushing and de-aired water flushing were carried out first, then the back pressure saturation followed. When Skempton’s B > 0.95 [32], the specimen was considered fully saturated. Following saturation, each specimen was isotropically consolidated by keeping the effective principal stress = = .
2.4. Testing Programe
In order to investigate the influences of FC, Dr, and on Gmax of the mixed materials. FC = 0, 10, 20, 30, 50, 70, and 100% were considered, and three specimens were prepared at different Dr (=35%, 50%, and 60%) at a fixed FC. The Gmax was measured and subjected to at 100, 200, 250, 300, and 400 kPa in five stages, Table 2 details the test conditions and the corresponding Gmax. The typical signal wave of the bender element test of S11 specimen ( = 100 kPa) was illustrated in Figure 4. As shown in Figure 4, the t = 5.18 ms for the specific test condition can be determined by the time domain initial wave method clarity and precision.
Table 2.
The detailed test scheme of the bender element test.
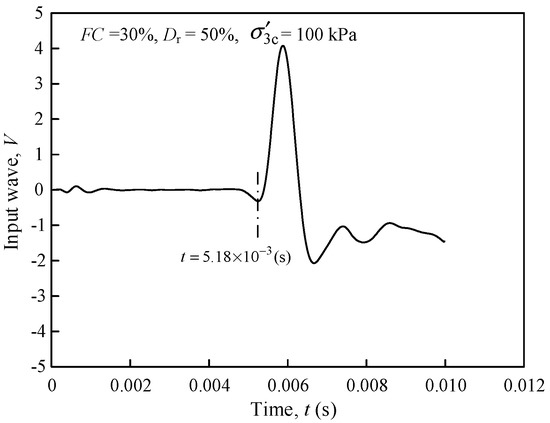
Figure 4.
The typical signal wave of the bender element test.
3. Test Results and Analysis
3.1. Factors Influencing Maximum Shear Modulus
The measured Gmax versus FC of the sand-silt mixed soil mixtures is illustrated in Figure 5. For the samples of 35% and 50% Dr under various , the Gmax decreased and then increased with the increasing FC, reaching the minimum when the FC was 30%. For the samples of 60% Dr under various , the Gmax decreased with the increasing FC. The FC of the inflection point of the Gmax was changed with the increase of . The reason can be that the transformation process of the contact state of the particles of the various Dr samples is different, which leads to the different interparticle structures [33]. When FC ≤ 30%, the fines will decrease the contact of skeleton particles formed by sand to form an unstable structure, which leads to a decrease in Gmax. When FC > 30%, the soil skeleton is borne by fine particles, and the shear resistance will recover.
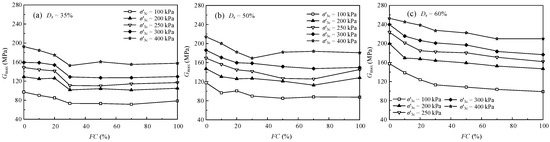
Figure 5.
The relationship between the Gmax and FC.
The relationship between the Gmax and of the samples is illustrated in Figure 6. For the samples under a given Dr and FC, the Gmax almost increased linearly with the increasing , which was in accordance with Salgado’s test results [34]. For the samples under various Dr, the increase rate of the Gmax with respect to was varied. Yang et al. [21] found that the increase rate of the Gmax with respect to decreased when the samples were under a given Dr and FC. However, Wichtmann et al. [35] obtained a different conclusion. They found that the increase rate of the Gmax with respect to increased when the samples were under a given Dr and FC. The opposite conclusions mean that the degree of association between the Gmax and is related to the physical properties of the sand-silt mixed soil materials.
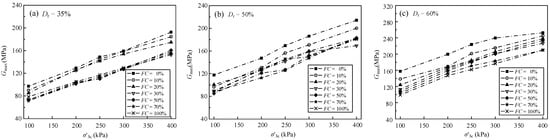
Figure 6.
The relationship between the Gmax and .
The relationship between the Gmax and e of the samples were illustrated in Figure 7. For the samples under a given and FC, the Gmax decreased with the increasing e. The decreasing rate of the Gmax with respect to e was distinctly influenced by FC when the was the same. Yang et al. [21] found that the relationship between the Gmax and e of the samples under various FC or was linear, and the decreased rate of the Gmax with respect to e was unrelated to FC. The different conclusions mean that the correlation between the Gmax and e is related to the material type of the mixed soils, which needs further study to find the influence factors.
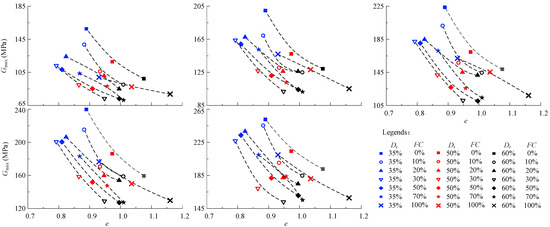
Figure 7.
The relationship between the Gmax and e.
3.2. The Evaluation Method of the Gmax of the Sand-Silt Mixtures
The acknowledged empirical relationship among the , e, and Gmax of the non-cohesive soil is shown in Equation (3):
where, A is the parameter influenced by the property of the soil material type. Pa is the standard atmospheric pressure (≈100 kPa). n is the empirical constant, and the value is between 0.4 and 0.6 for the pluvial sand, and many researchers have observed that the value can be taken as 0.5 [35,36]. F(e) is the function of e, which is decreased with the increase of e. Hardin and Black 15 described the F(e) as Equation (4):
where c is the parameter influenced by the shape of the soil particle, and the values are 2.17 and 2.97 for the angular and rounded sand particles, respectively. The shape of Nantong sand particles is angular, and the value of c is 2.17 as a result. The reasonability of Equation (4) is verified by many scholars, such as Iwasaki et al. [20], Yamashita et al. [37]. According to Equations (3) and (4), the Hardin evaluation model of the Gmax of the Nantong sand-silt mixed soil materials can be described by Equation (5):
The normalized relationship between the Gmax~F(e)~/Pa is shown in Figure 8. The data of the Gmax~F(e)~/Pa is at the top when the FC is 0 (pure sand). The data of the Gmax~F(e)~/Pa is at the bottom when the FC is 30% (pure sand). The data of the Gmax~F(e)~/Pa is above the evaluation of the Hardin model when the FC is 100% (pure silt). The results mean that the influence of the FC on the relationship between Gmax~F(e)~/Pa is not monotonic. The fitted results of the Gmax~F(e)~/Pa data under various FC via the Hardin model are improper.
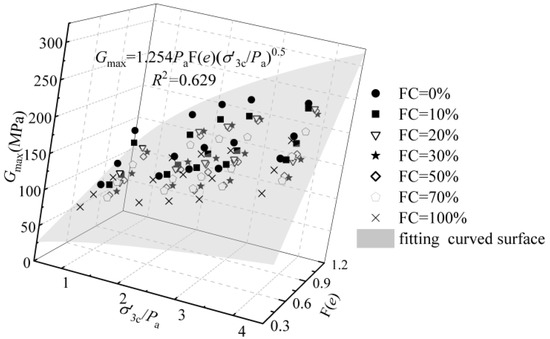
Figure 8.
The relationship between the Gmax~F(e)~/Pa of the sand-silt mixed soil materials.
The relationship between the Gmax/F(e) and (/Pa)0.5 of the sand-silt mixed soil materials under various FC is shown in Figure 9. The Gmax/F(e) increases almost linearly with the increased (/Pa)0.5 when the FC is given. The Gmax of the mixed soil materials under a given FC can be evaluated via the Hardin model. The data points (black square) and evaluation lines of the Gmax of the mixed soil materials by the Hardin model are shown in Figure 9. It can be seen from the table that the R2 of mixture under various FC is almost all greater than 0.9, which means the Gmax evaluation of the Hardin model is effective. In addition, the relationship between the parameters A and FC is not monotonous.
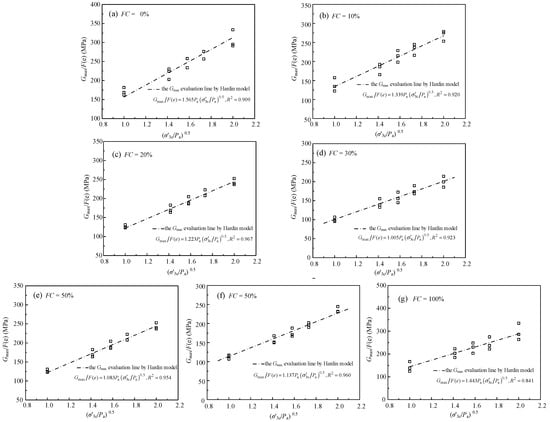
Figure 9.
The relationship between the Gmax/F(e) and (/Pa)0.5 the sand-silt mixed soil materials with different FC. The □ represents a data point.
Thevanayagam and Martin [33] proposed the definition of the particle contact state of the mixed materials in order to describe the influence of FC on the mechanical behavior. The mixed materials are composed of sand and fines particles of various sizes, and the contact state of the sand and fines particles influences the mechanical behavior. The sand particles contact each other and constitute the skeleton of the mixed materials when the FC is low. The fines fill the voids left by the mixed materials. The mechanical behavior of the mixed materials is dependent on the framework of the sand particles, and the materials under such a particle contact state are called sand-like soil materials. The fines particles contact each other and constitute the skeleton of the mixed materials when the FC is high. The sand particles are suspended in the fines. The mechanical behavior of the mixed materials is dependent on the framework of the fines particles, and the mixed materials under such a particle contact state is called silt-like soil materials. As a result, there is a threshold fines content (FCth) for the mixed materials [33]. The mixtures are called sand-like soil materials when the FC is smaller than the FCth. The mixtures are called silt-like soil materials when the FC is larger than the FCth. The FCth is a critical parameter which can distinguish the particle contact state and influence the mechanical behavior of the mixed materials. Rahman et al. [38] proposed an empirical function to determine the FCth.
α and β are the fitted parameters and the values are suggested as 0.50 and 0.13, respectively. , is the effective size of the sand and is the average size of the fines. The FCth used in the study is about 35% which can be calculated according to the data of Table 1 and Equation (5).
The relationship between parameter A and FC is shown in Figure 10. Parameter A decreases with the increasing FC when the FC is smaller than FCth. Parameter A increases with the increasing FC when the FC is larger than FCth. As a result, parameter A can be described by Equation (6):
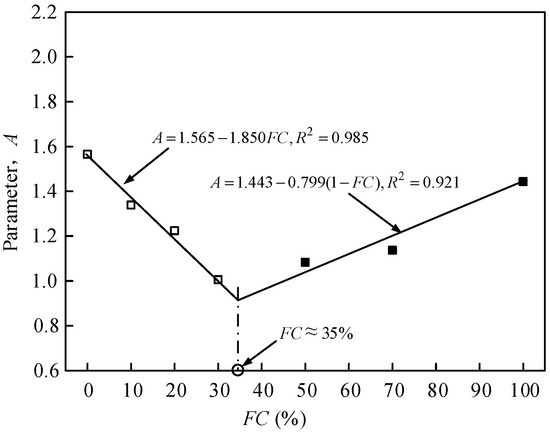
Figure 10.
The relationship between the parameter A and FC of the sand-silt mixed soil materials. The □ represents a data point.
The m and n are the fitted parameters. A(FC=0) is the parameter A fitted by Hardin model of pure sand. A(FC=100%) is the parameter A fitted by the Hardin model of pure fines. The m and n are 1.850 and 0.799, respectively, for the mixed materials tested in the study.
As a result, the revised Hardin model, which considered the influence of e, , and FC, can be described by Equation (7):
The relationship between the tested Gmax and the evaluated Gmax by the revised Hardin model of the various mixed soil materials in the study is shown in Figure 11, and the error between them is less than 10%. In addition, the test data of Payan et al. [39] is used to verify the reasonability of the revised Hardin model. The test data of Payan et al. [39] is fitted by the revised Hardin model and the fitted parameters are shown in Table 3. The relationship between the tested Gmax and evaluated Gmax by the revised Hardin model of the data of Payan et al. is shown in Figure 12, and the error between them is less than 10%. As a result, the revised Hardin model can be used to evaluate the Gmax of the mixed soil materials.
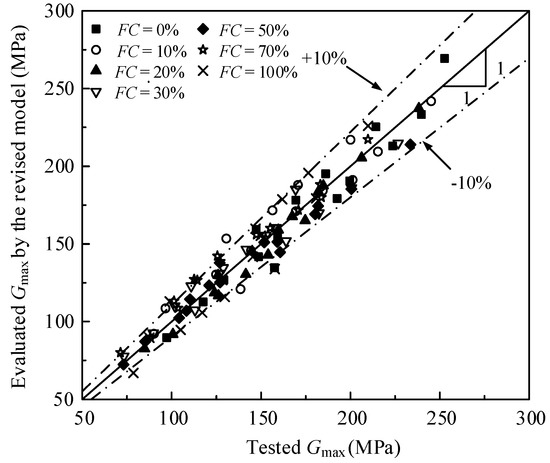
Figure 11.
The relationship between the tested Gmax and evaluated Gmax by the revised model in the study.
Table 3.
The fitted parameters by the revised Hardin model of Payan et al.
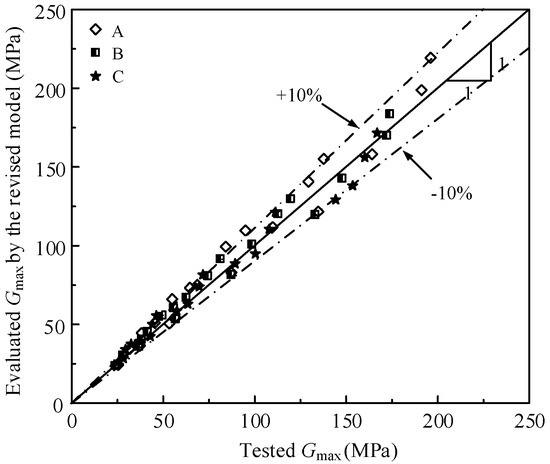
Figure 12.
The relationship between the tested Gmax and evaluated Gmax by the revised model of Payan et al.
4. Conclusions
A series of bender element tests were conducted to study the Gmax of the saturated sand-silt mixed soil materials, and the influence of FC, relative density Dr and were taken into consideration. The revised Hardin model was proposed to evaluate the Gmax of the materials based on the test data. The Gmax of the mixed materials increases linearly with the increased and the increase rate almost stays constant. The relationship between the Gmax and FC is related to the Dr when the is given. The Gmax decreases with the increased e and the decrease rate is influenced by the FC when the is given. The Hardin model can be used to evaluate the Gmax of the mixed materials when the FC is given. The parameter A decreases and then increases with the increased FC. The revised Hardin model, which is based on the threshold fines content (FCth) can be used to evaluate the Gmax of the mixed materials under various FC, e, and , and the error between the evaluated and tested value is less than 10%. This study can provide reference data for seismic response analysis for Nantong sites with different levels of fine-grained and valuable references for other related research.
It should be noted that there may be differences in Gmax between wet and dry soil materials. In engineering practice, the soil materials are mostly wet and especially saturated below the groundwater level. Thus, this study focuses on the Gmax of wet soil materials, and the difference between wet and saturated soils will be investigated in the near future.
Author Contributions
Data curation, X.X.; Funding acquisition, Q.W.; Investigation, H.W.; Validation, Q.W.; Visualization, Z.-L.Z.; Writing—original draft, J.B.; Writing—review & editing, Z.-L.Z. All authors have read and agreed to the published version of the manuscript.
Funding
This research was funded by National Natural Science Foundation of China (52008206, 51508270) and the China Postdoctoral Science Foundation (2021M690279).
Institutional Review Board Statement
Not applicable.
Informed Consent Statement
Not applicable.
Acknowledgments
This work was supported by the National Natural Science Foundation of China (52008206,51508270) and the China Postdoctoral Science Foundation (2021M690279).
Conflicts of Interest
The authors declare no conflict of interest.
References
- Chen, G.X.; Wang, Y.Z.; Zhao, D.F.; Zhao, K.; Yang, J. A new effective stress method for nonlinear site response analyses. Earthq. Eng. Struct. Dyn. 2021, 50, 1595–1611. [Google Scholar] [CrossRef]
- Turner, M.M.; Ghayoomi, M. Site response analysis of induced seismic events in the CENA region. Soil Dyn. Earthq. Eng. 2022, 153, 107118. [Google Scholar] [CrossRef]
- Elekes, F.; Parteli, E.J.R. An expression for the angle of repose of dry cohesive granular materials on Earth and in planetary environments. Proc. Natl. Acad. Sci. USA 2021, 118, e2107965118. [Google Scholar] [CrossRef]
- Baule, A.; Morone, F.; Herrmann, H.J.; Makse, H.A. Edwards statistical mechanics for jammed granular matter. Rev. Mod. Phys. 2018, 90, 015006. [Google Scholar] [CrossRef]
- Asadi, M.B.; Asadi, M.S.; Orense, R.P.; Pender, M.J. Small-Strain Stiffness of Natural Pumiceous Sand. J. Geotech. Geoenviron. Eng. 2020, 146, 06020006. [Google Scholar] [CrossRef]
- Ha Giang, P.H.; Van Impe, P.O.; Van Impe, W.F.; Menge, P.; Haegeman, W. Small-strain shear modulus of calcareous sand and its dependence on particle characteristics and gradation. Soil Dyn. Earthq. Eng. 2017, 100, 371–379. [Google Scholar] [CrossRef]
- Liu, X.; Yang, J. Influence of size disparity on small-strain shear modulus of sand-fines mixtures. Soil Dyn. Earthq. Eng. 2018, 115, 217–224. [Google Scholar] [CrossRef]
- Shi, J.Q.; Haegeman, W.; Cnudde, V. Anisotropic small strain stiffness of calcareous sand affected by sample preparation, particle characteristic and gradation. Géotechnique 2019, 71, 305–319. [Google Scholar] [CrossRef]
- Liu, X.Y.; Zou, D.G.; Liu, J.M.; Zheng, B.W.; Zhou, C.G.; Bai, J.S. A gradation-dependent particle shape factor for characterizing small-strain shear modulus of sand-gravel mixtures. Transp. Geotech. 2021, 28, 100548. [Google Scholar] [CrossRef]
- Liu, X.; Yang, J. Shear wave velocity in sand: Effect of grain shape. Géotechnique 2018, 68, 742–748. [Google Scholar] [CrossRef]
- Cheng, K.; Zhang, J.; Miao, Y.; Ruan, B.; Peng, T. The effect of plastic fines on the shear modulus and damping ratio of silty sands. Bull. Eng. Geol. Environ. 2019, 78, 5865–5876. [Google Scholar] [CrossRef]
- Shi, J.Q.; Haegeman, W.; Xu, T. Effect of non-plastic fines on the anisotropic small strain stiffness of a calcareous sand. Soil Dyn. Earthq. Eng. 2020, 139, 106381. [Google Scholar] [CrossRef]
- Otsubo, M.; Liu, J.M.; Kawaguchi, Y.; Dutta, T.T.; Kuwano, R. Anisotropy of elastic wave velocity influenced by particle shape and fabric anisotropy under K0 condition. Comp. Geotech. 2020, 128, 103775. [Google Scholar] [CrossRef]
- Liu, J.; Otsubo, M.; Kawaguchi, Y.; Kuwano, R. Anisotropy in small-strain shear modulus of granular materials: Effects of particle properties and experimental conditions. Soils Found. 2022, 62, 101105. [Google Scholar] [CrossRef]
- Hardin, B.O.; Black, W.L. Sand stiffness under various triaxial stresses. J. Soil Mech. Found. Div. 1966, 92, 27–42. [Google Scholar] [CrossRef]
- Jafarian, Y.; Javdanian, H. Small-strain dynamic properties of siliceous-carbonate sand under stress anisotropy. Soil Dyn. Earthq. Eng. 2020, 131, 106045. [Google Scholar] [CrossRef]
- Wichtmann, T.; Triantafyllidis, T. Small-strain constrained elastic modulus of clean quartz sand with various grain size distribution. Soil Dyn. Earthq. Eng. 2013, 55, 130–139. [Google Scholar] [CrossRef]
- Doi, I.; Kamai, T.; Azuma, R.; Wang, G. A landslide induced by the 2016 Kumamoto Earthquake adjacent to tectonic displacement—Generation mechanism and long-term monitoring. Eng. Geol. 2019, 248, 80–88. [Google Scholar] [CrossRef]
- Janalizadeh, C.A.; Selatahneh, H.; Karimi, P.M. Effect of fines on liquefaction resistance of sand. Innov. Infrastruct. Solut. 2020, 5, 87. [Google Scholar] [CrossRef]
- Iwasaki, T.; Tatsuoka, F. Effects of grain size and grading on dynamic shear moduli of sands. Soils Found. 1977, 17, 19–35. [Google Scholar] [CrossRef] [Green Version]
- Yang, J.; Liu, X. Shear wave velocity and stiffness of sand: The role of non-plastic fines. Géotechnique 2016, 66, 500–514. [Google Scholar] [CrossRef]
- Choo, H.; Burns, S.E. Shear wave velocity of granular mixtures of silica particles as a function of fine fraction, size ratios and void ratios. Granul. Matter 2015, 17, 567–578. [Google Scholar] [CrossRef]
- Wichtmann, T.; Hernández, M.A.N.; Triantafyllidis, T. On the influence of a noncohesive fines content on small strain stiffness, modulus degradation and damping of quartz sand. Soil Dyn. Earthq. Eng. 2015, 69, 103–114. [Google Scholar] [CrossRef]
- Thevanayagam, S.; Liang, J. Shear wave velocity relations for silty and gravel soils. In Proceedings of the 4th International Conference on Recent Advances in Geotechnical Earthquake Engineering and Soil Dynamics, San Diego, CA, USA, 29 March 2001; p. 26. Available online: https://scholarsmine.mst.edu/icrageesd/04icrageesd/session01/26 (accessed on 29 March 2001).
- Goudarzy, M.; Konig, D.; Schanz, T. Small strain stiffness of granular materials containing fines. Soils Found. 2016, 56, 756–764. [Google Scholar] [CrossRef]
- Goudarzy, M.; Rahman, M.M.; Konig, D.; Schanza, T. Influence of non-plastic fines content on maximum shear modulus of granular materials. Soils Found. 2016, 56, 973–983. [Google Scholar] [CrossRef]
- Payan, M.; Khoshghalb, A.; Senetakis, K.; Khalili, N. Effect of particle shape and validity of Gmax models for sand: A critical review and a new expression. Comp. Geotech. 2016, 72, 28–41. [Google Scholar] [CrossRef]
- Pan, K.; Yuan, Z.H.; Zhao, C.F.; Tong, J.H.; Yang, Z.X. Undrained shear and stiffness degradation of intact marine clay under monotonic and cyclic loading. Eng. Geol. 2021, 297, 106502. [Google Scholar] [CrossRef]
- Brignoli, E.G.M.; Gotti, M.; Stokoe, K.H. Measurement of shear waves in laboratory specimens by means of piezoelectric transducers. Geotech. Test. J. 1996, 19, 384–397. [Google Scholar] [CrossRef]
- Gu, X.Q.; Yang, J. A discrete element analysis of elastic properties of granular materials. Granul. Matter 2013, 15, 139–147. [Google Scholar] [CrossRef]
- Ishihara, K. Liquefaction and flow failure during earthquakes. Geotechnique 1993, 43, 351–451. [Google Scholar] [CrossRef]
- Skempton, A.W. The pore-pressure coefficients A and B. Geotechnique 1954, 4, 143–147. [Google Scholar] [CrossRef]
- Thevanayagam, S.; Martin, G.R. Liquefaction in silty soils-screening and remediation issue. Soil Dyn. Earthq. Eng. 2002, 22, 1035–1042. [Google Scholar] [CrossRef]
- Salgado, R.; Bandini, P.; Karim, A. Shear strength and stiffness of silty sand. J. Geotech. Geoenviron. Eng. 2000, 126, 451–462. [Google Scholar] [CrossRef]
- Wichtmann, T.; Triantafyllidis, T. Influence of the grain-size distribution curve of quartz sand on the small strain shear modulus Gmax. J. Geotech. Geoenviron. Eng. 2009, 135, 1404–1418. [Google Scholar] [CrossRef]
- Mcdowell, G.R.; Bolton, M.D. Micro mechanics of elastic soil. Soils Found. 2001, 41, 147–152. [Google Scholar] [CrossRef]
- Yamashita, S.; Kawaguchi, T.; Nakata, Y.; Mikami, T.; Shibuya, S. Interpretation of international parallel test on the measurement of Gmax using bender elements. Soils Found. 2009, 49, 631–650. [Google Scholar] [CrossRef]
- Rahman, M.M.; Lo, S.R.; Gnanendran, C.T. On equivalent granular void ratio and steady state behaviour of loose sand with fines. Can. Geotech. J. 2008, 45, 1439–1456. [Google Scholar] [CrossRef]
- Payan, M.; Senetakis, K.; Khoshghalb, A.; Khalili, N. Characterization of the small-strain dynamic behaviour of silty sands; contribution of silica non-plastic fines content. Soil Dyn. Earthq. Eng. 2017, 102, 232–240. [Google Scholar] [CrossRef]
Publisher’s Note: MDPI stays neutral with regard to jurisdictional claims in published maps and institutional affiliations. |
© 2022 by the authors. Licensee MDPI, Basel, Switzerland. This article is an open access article distributed under the terms and conditions of the Creative Commons Attribution (CC BY) license (https://creativecommons.org/licenses/by/4.0/).