

Chitosan-Modified Biochars to Advance Research on Heavy Metal Ion Removal: Roles, Mechanism and Perspectives


Abstract
:1. Introduction
2. Materials and Methods
2.1. Sorbent Preparation and Characterization
2.2. Kinetic and Adsorption Investigations
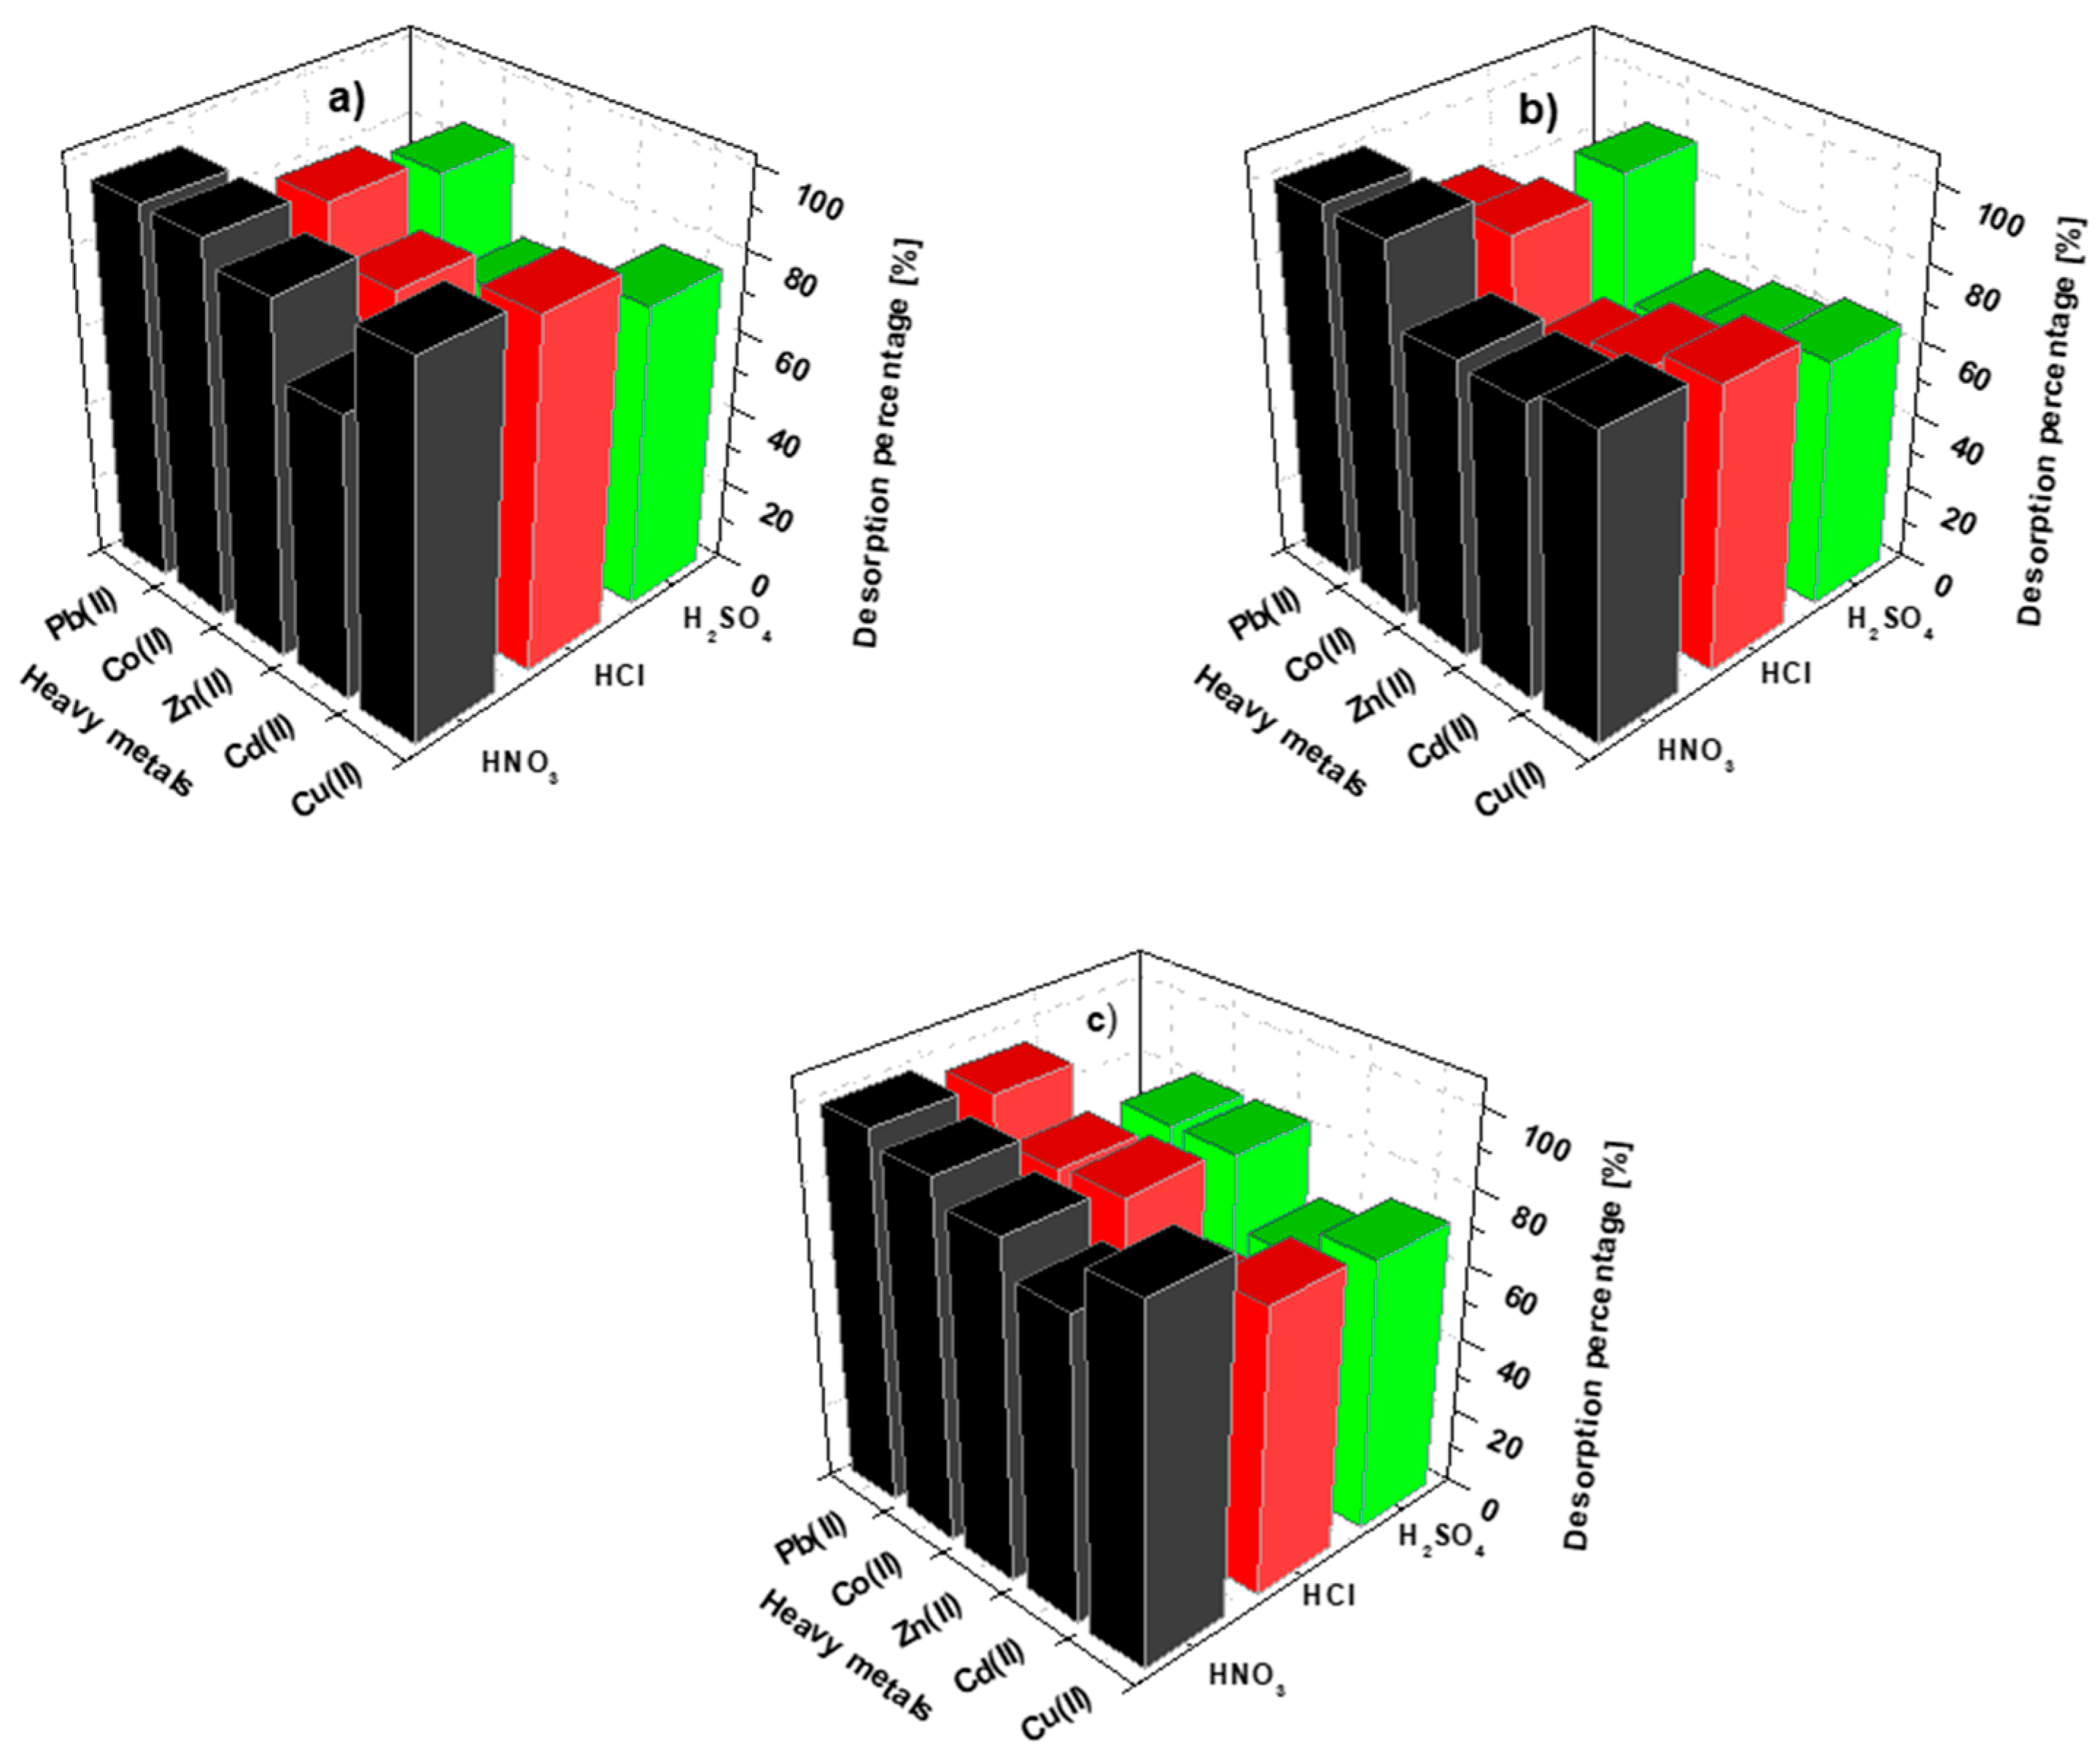
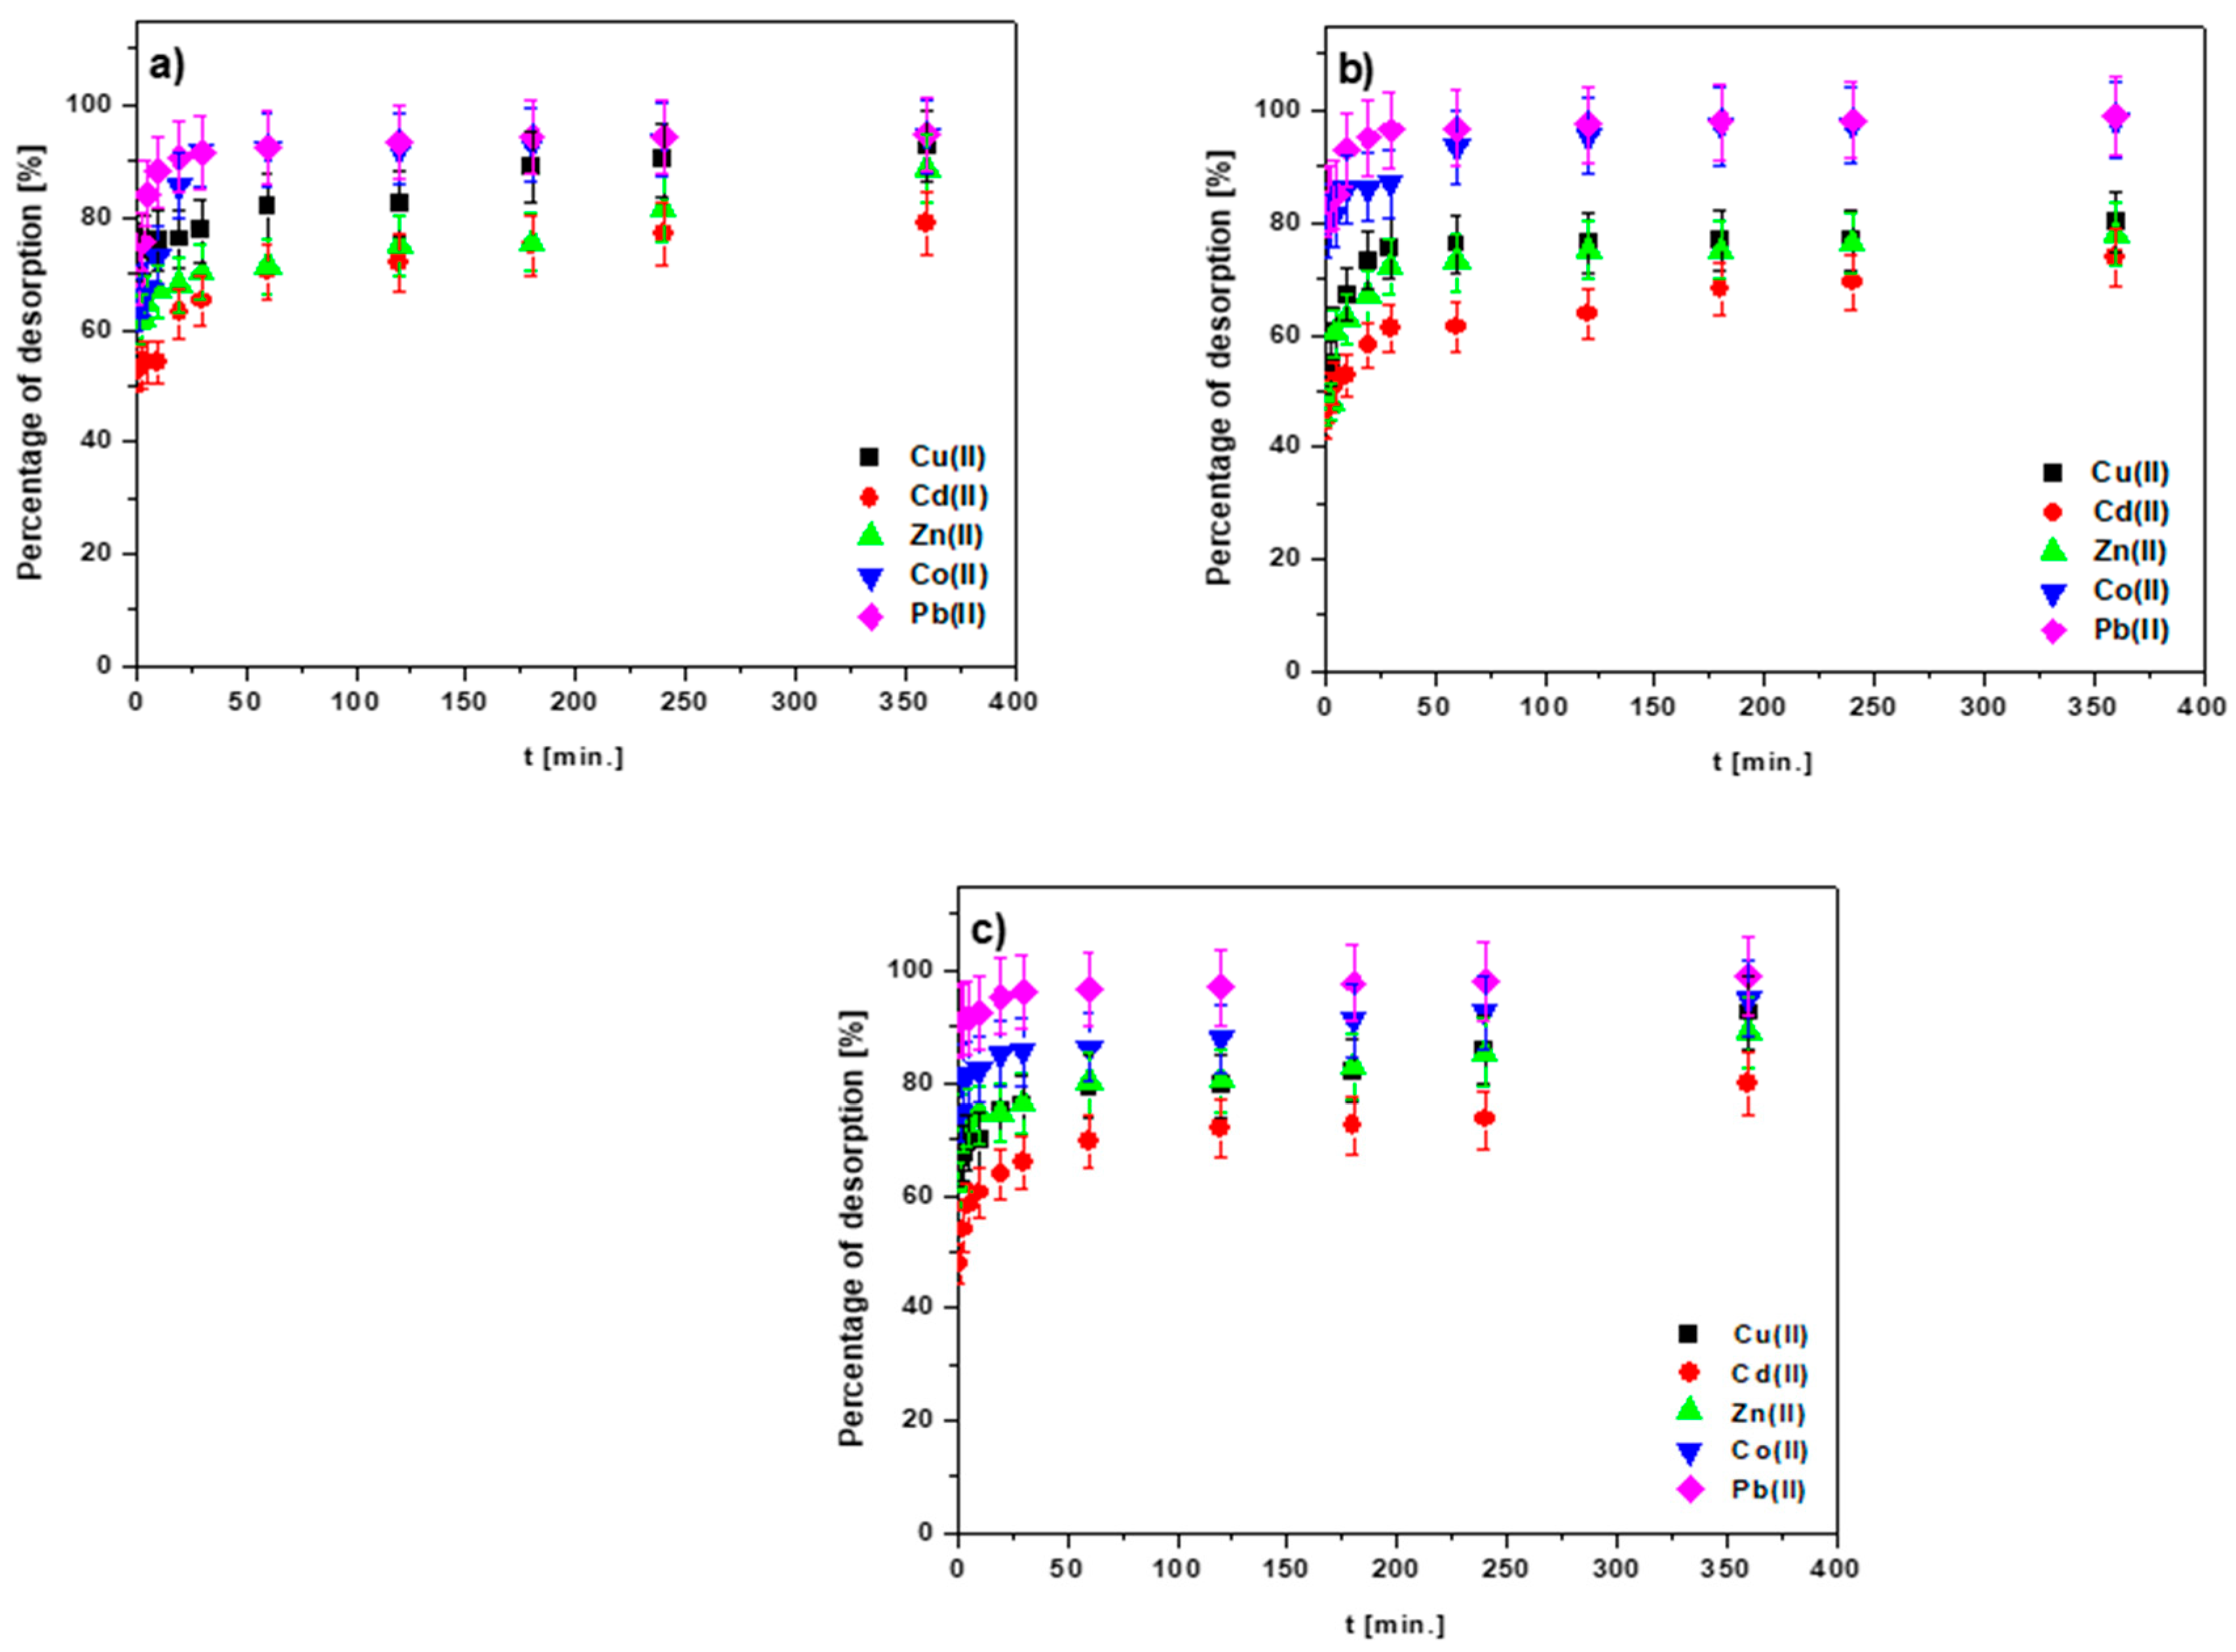
2.3. Desorption Research
3. Results and Discussion
3.1. Physicochemical Characterization of the Biochar-Based Materials
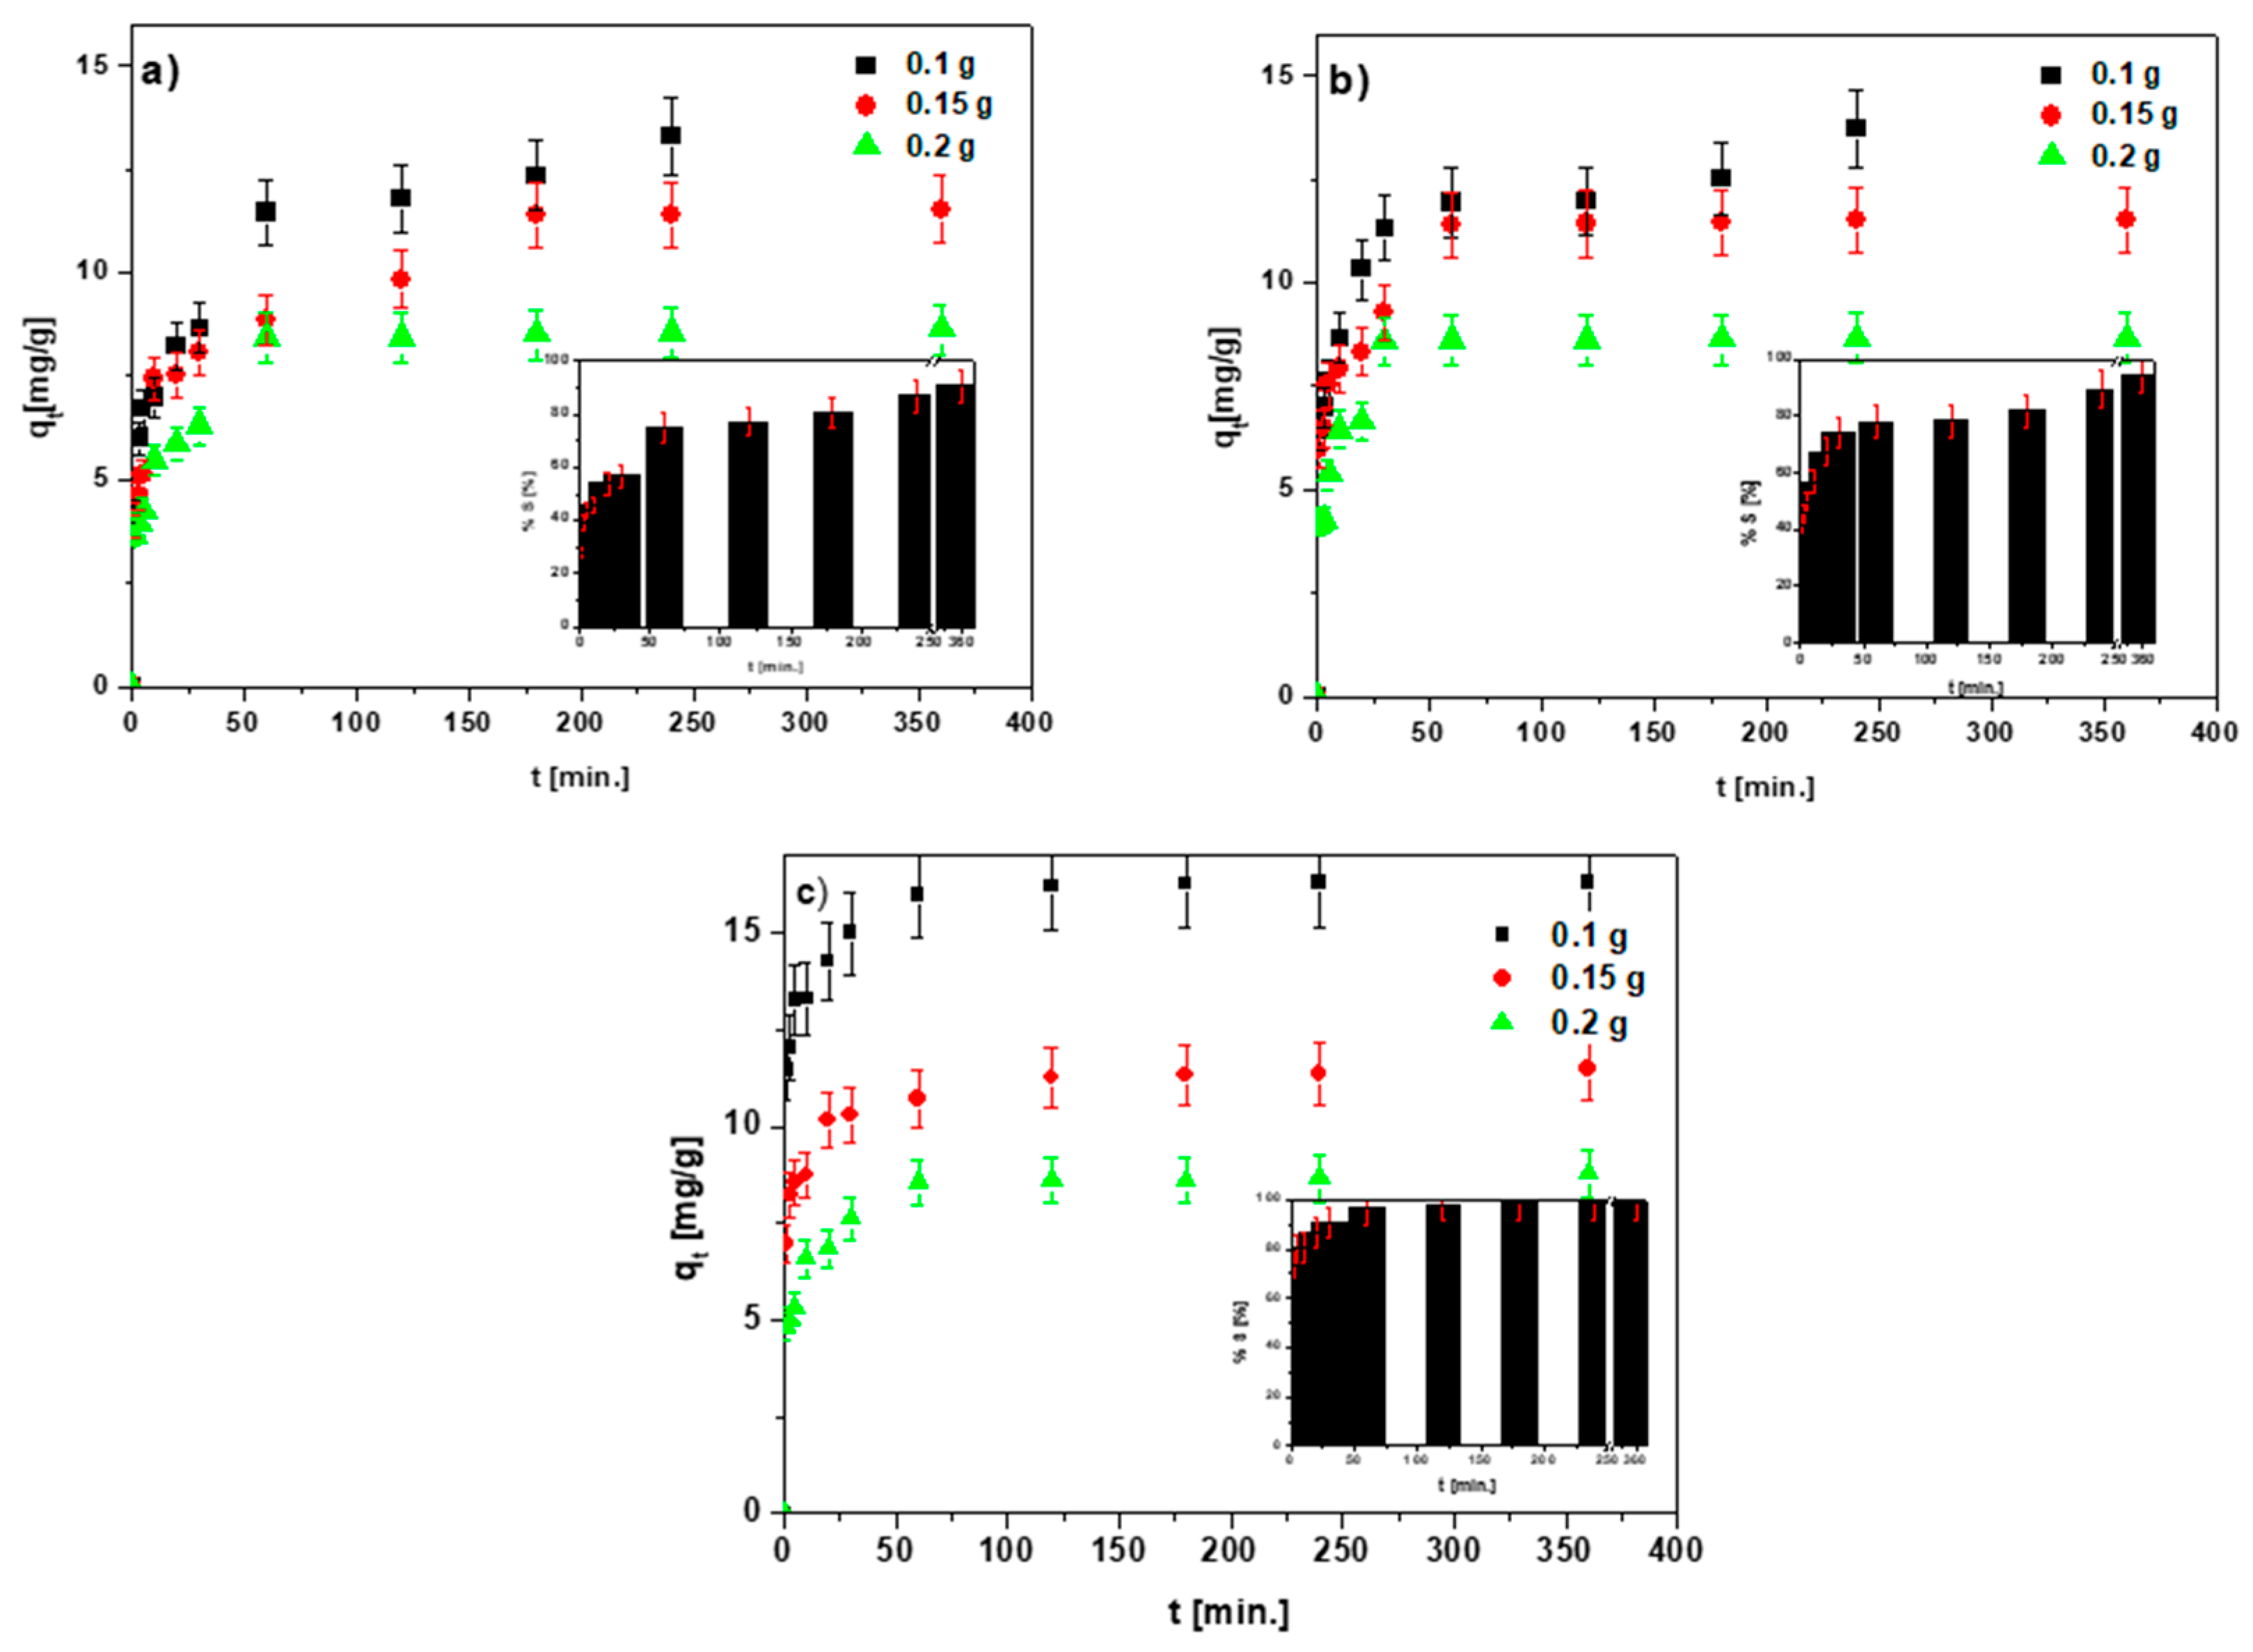
3.2. Dose Effect
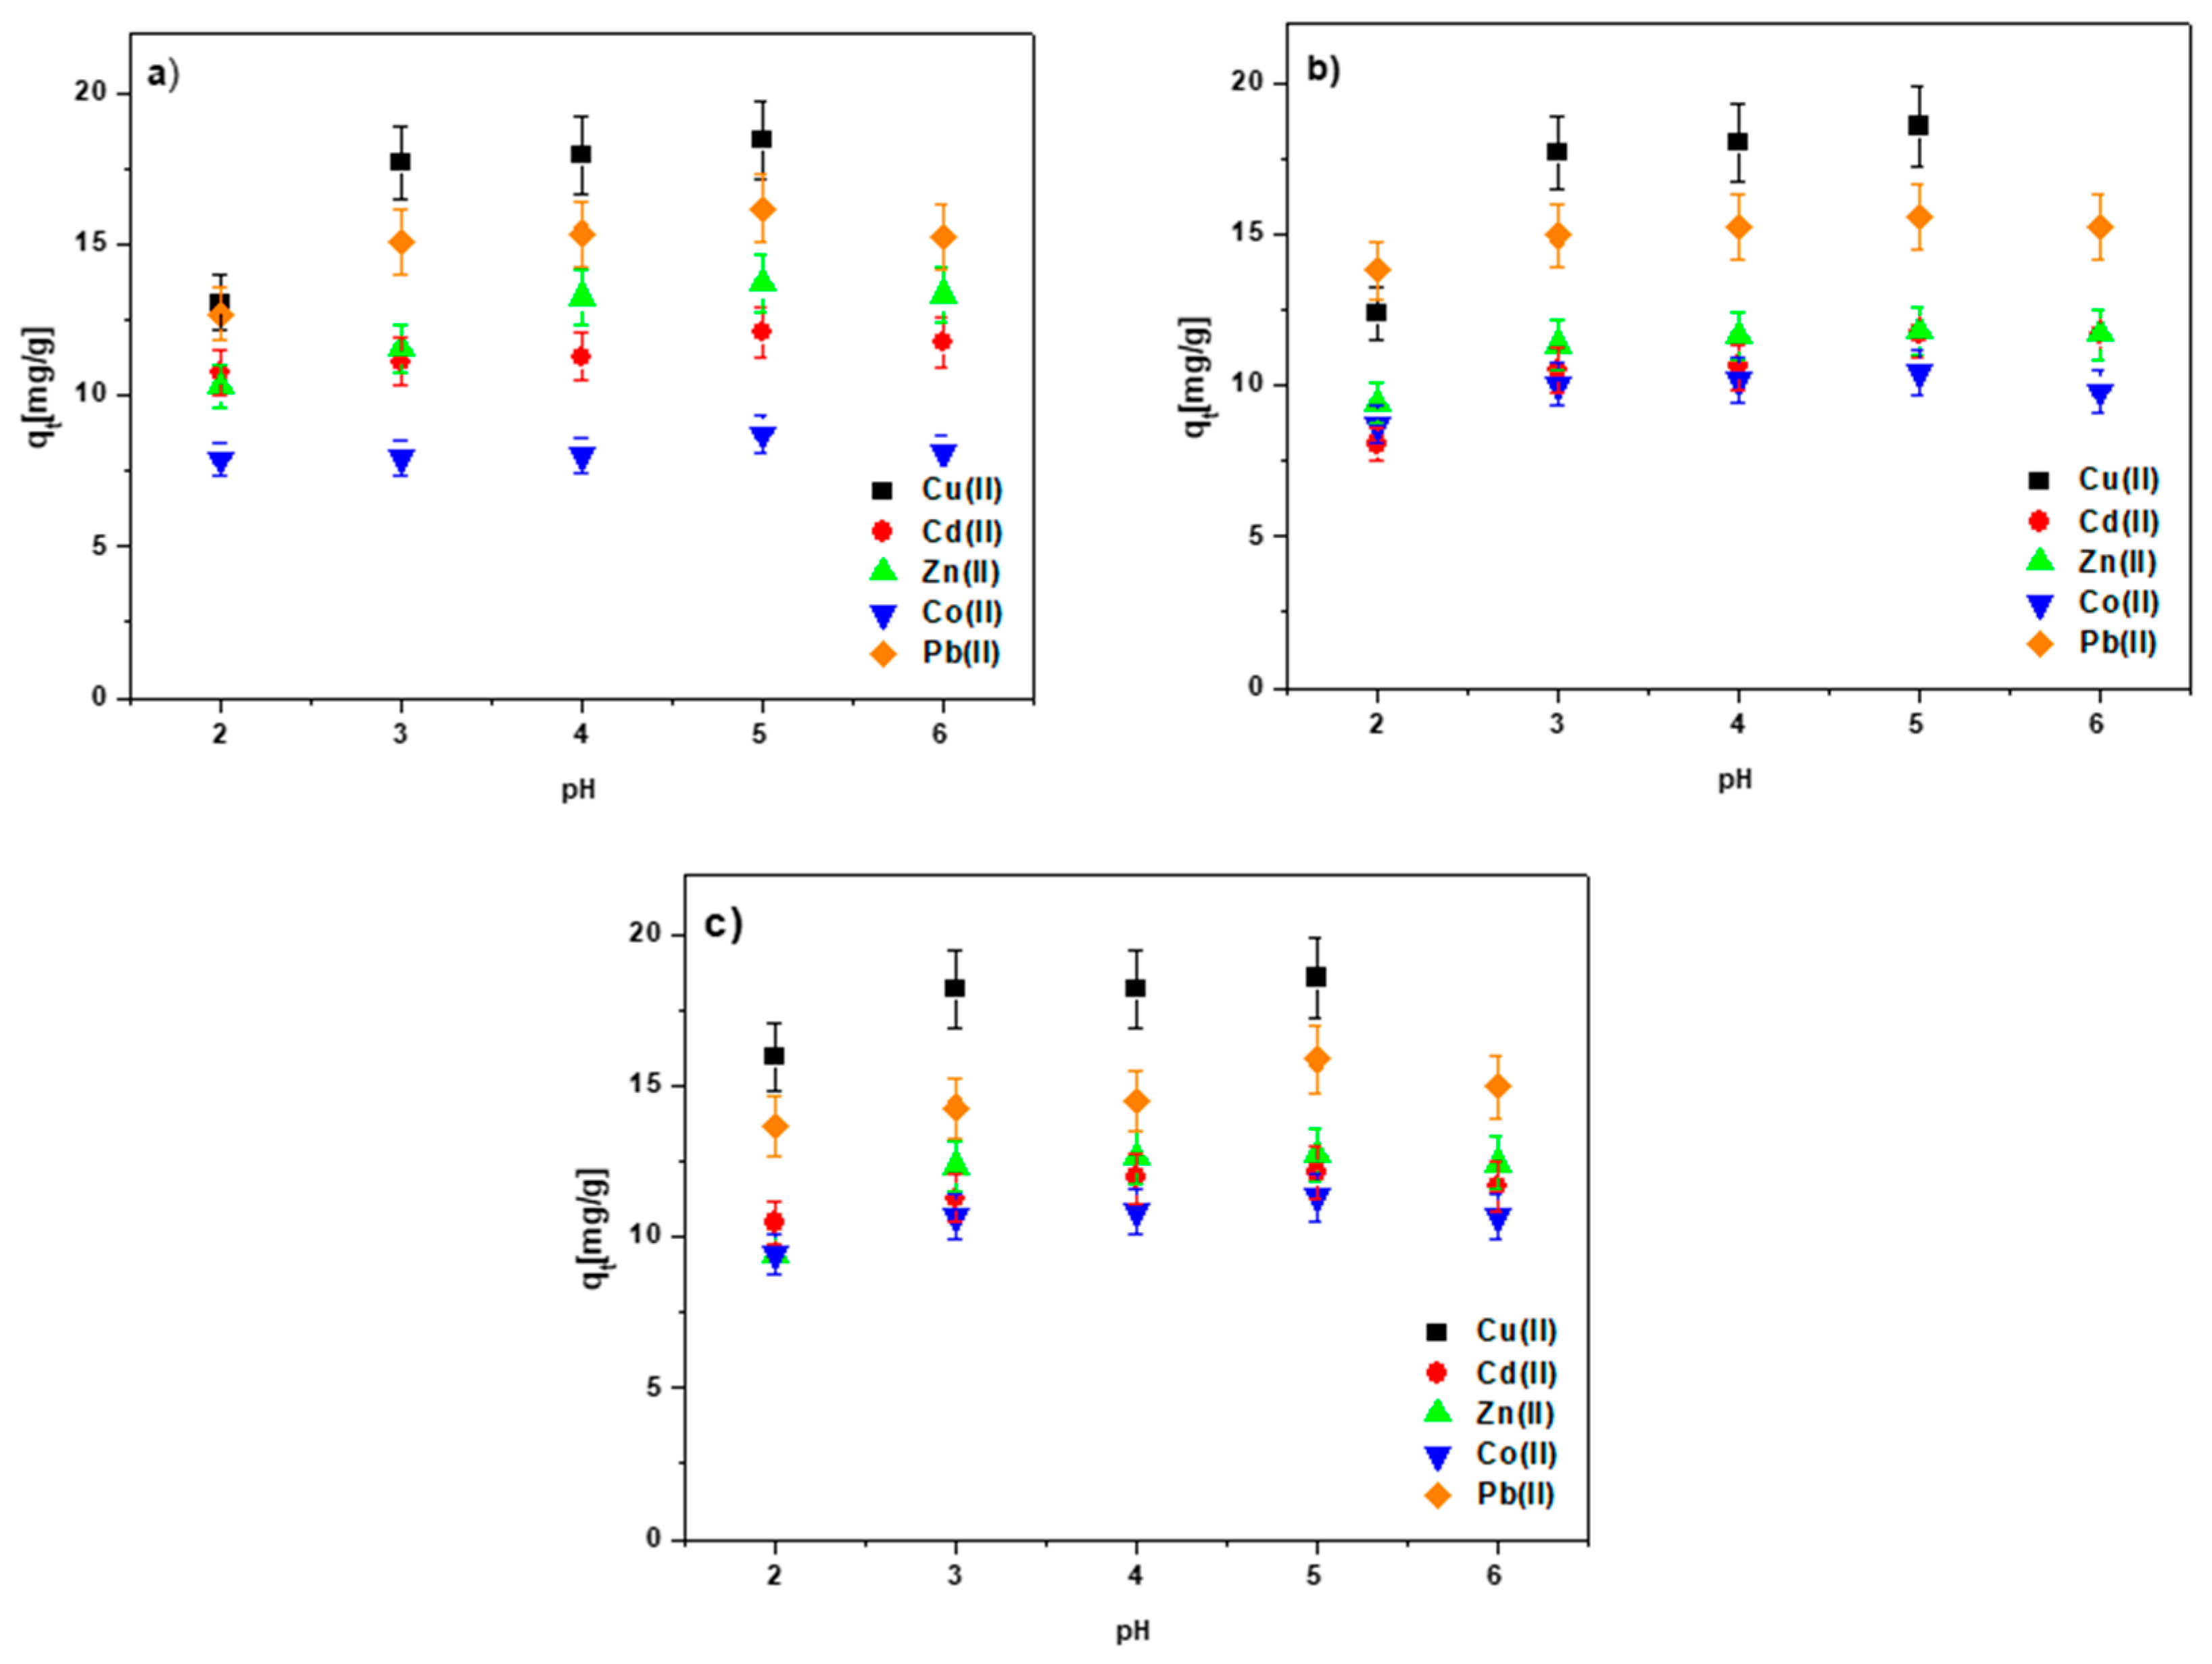
3.3. The pH Effect
3.4. Effects of the Phase Contact Time and Initial Concentration of the Solution
3.5. Adsorption Kinetics
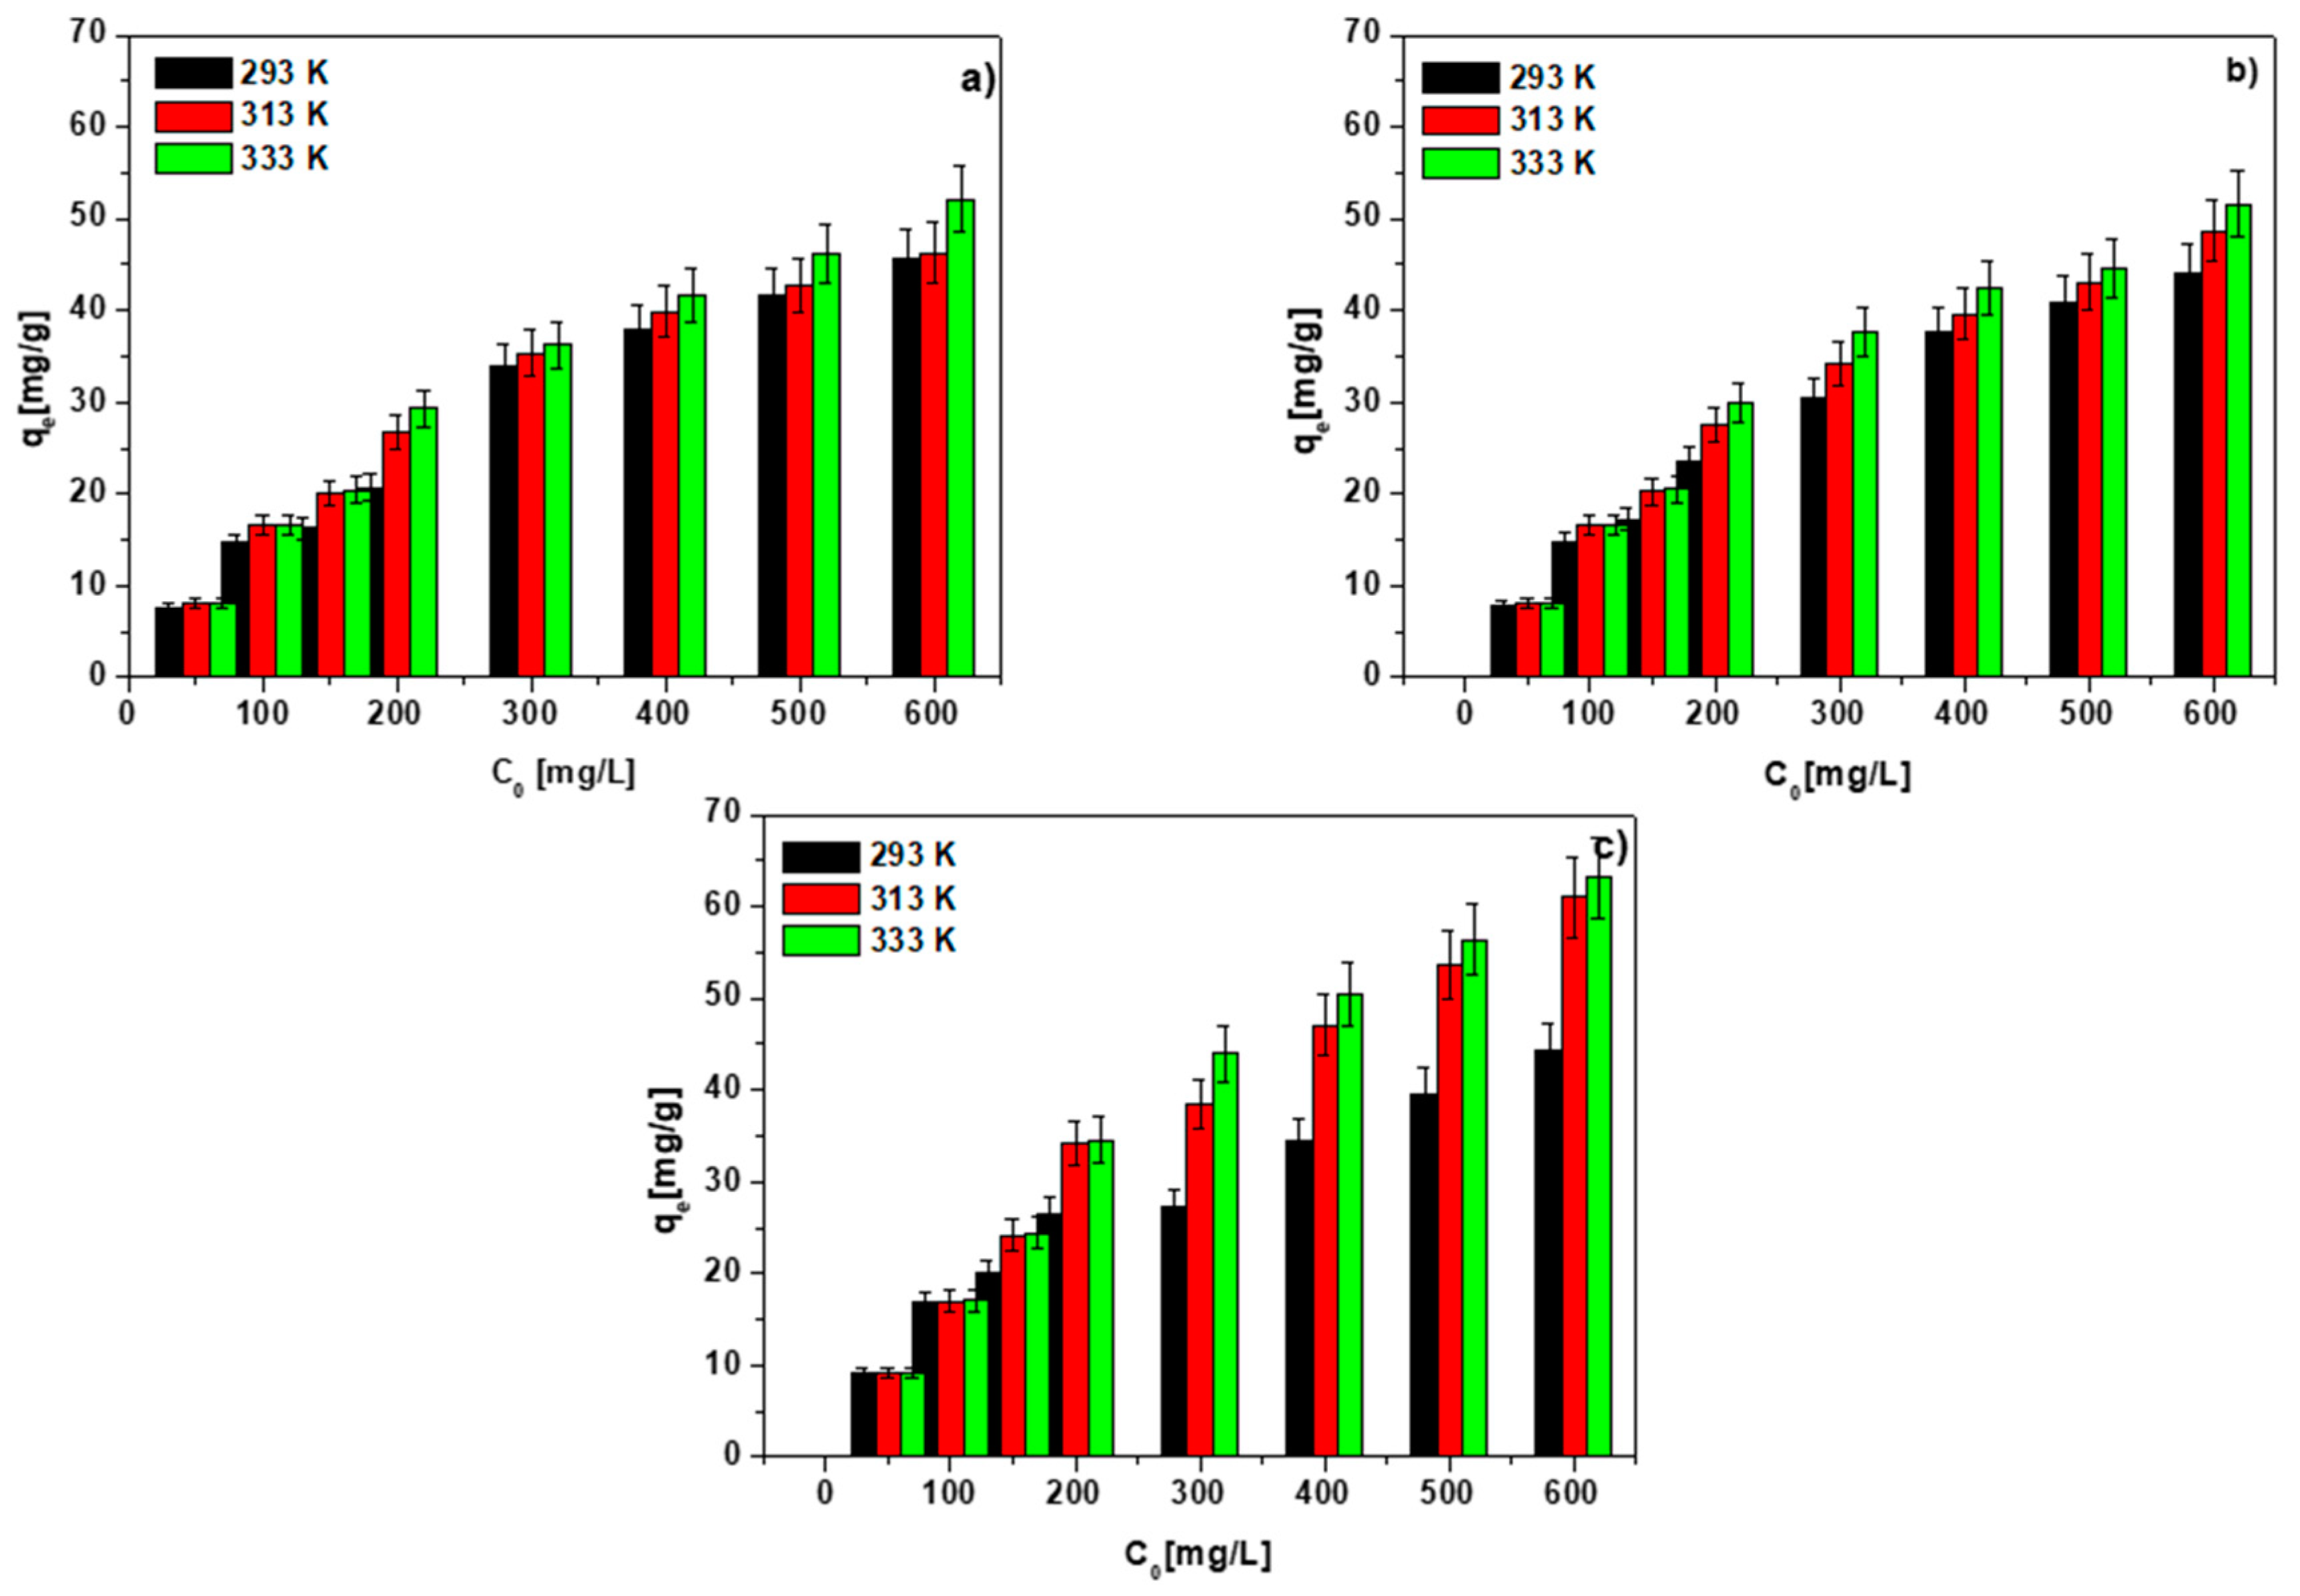
3.6. Temperature Effect, Adsorption and Thermodynamic Calculations
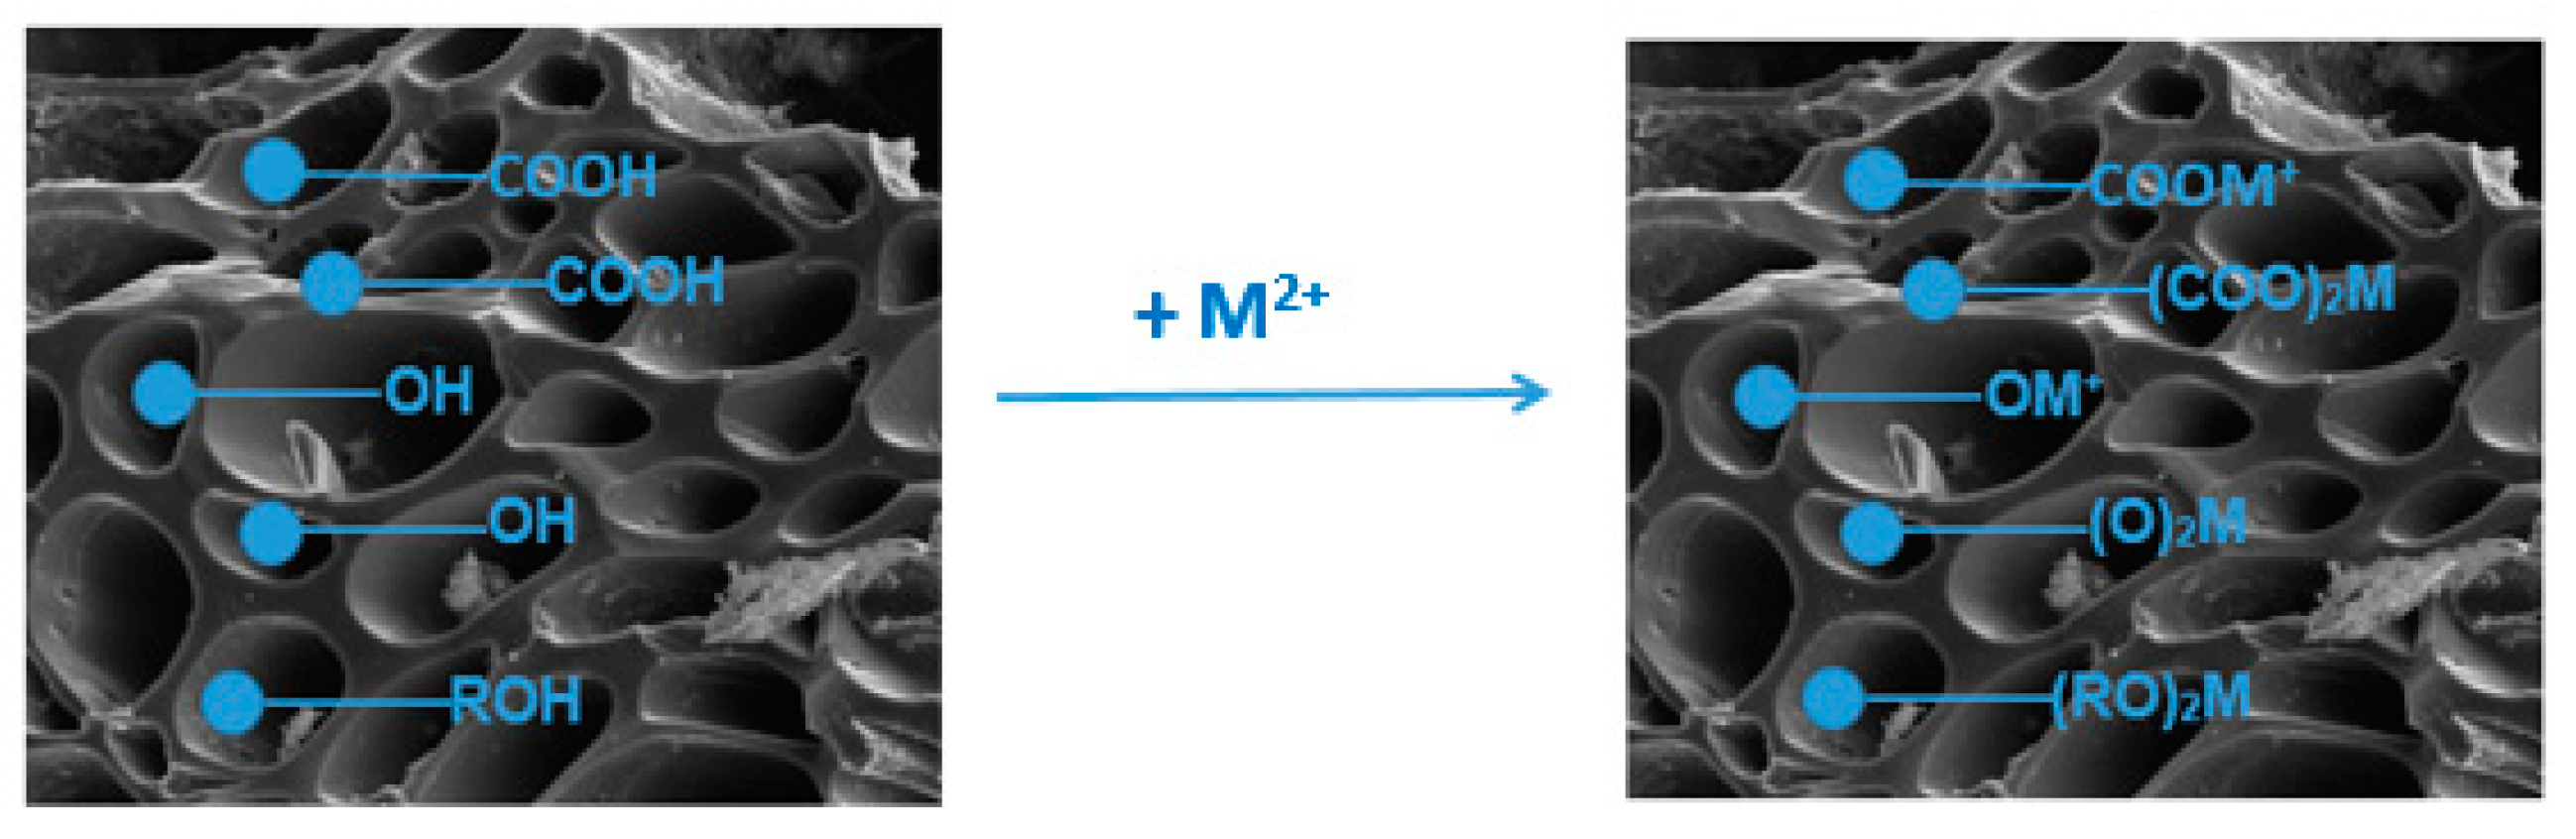
3.7. Sorption Mechanism
3.8. Desorption Investigations
4. Conclusions
Supplementary Materials
Author Contributions
Funding
Institutional Review Board Statement
Informed Consent Statement
Data Availability Statement
Conflicts of Interest
References
- Deng, J.; Liu, Y.; Liu, S.; Zeng, G.; Tan, X.; Huang, B.; Tang, X.; Wang, S.; Hua, Q.; Yan, Z. Competitive Adsorption of Pb(II), Cd(II) and Cu(II) onto Chitosan-Pyromellitic Dianhydride Modified Biochar. J. Colloid Interface Sci. 2017, 506, 355–364. [Google Scholar] [CrossRef]
- Janani, R.; Gurunathan, B.; Sivakumar, K.; Varjani, S.; Ngo, H.H.; Gnansounou, E. Advancements in Heavy Metals Removal from Effluents Employing Nano-Adsorbents: Way towards Cleaner Production. Environ. Res. 2022, 203, 111815. [Google Scholar] [CrossRef]
- Gupta, K.; Joshi, P.; Gusain, R.; Khatri, O.P. Recent Advances in Adsorptive Removal of Heavy Metal and Metalloid Ions by Metal Oxide-Based Nanomaterials. Coord. Chem. Rev. 2021, 445, 214100. [Google Scholar] [CrossRef]
- Dubey, S.; Banerjee, S.; Upadhyay, S.N.; Sharma, Y.C. Application of Common Nano-Materials for Removal of Selected Metallic Species from Water and Wastewaters: A Critical Review. J. Mol. Liq. 2017, 240, 656–677. [Google Scholar] [CrossRef]
- Hezarjaribi, M.; Bakeri, G.; Sillanpää, M.; Chaichi, M.J.; Akbari, S.; Rahimpour, A. Novel Adsorptive PVC Nanofibrous/Thiol-Functionalized TNT Composite UF Membranes for Effective Dynamic Removal of Heavy Metal Ions. J. Environ. Manag. 2021, 284, 110650. [Google Scholar] [CrossRef]
- Charazińska, S.; Lochyński, P.; Burszta-Adamiak, E. Removal of Heavy Metal Ions Form Acidic Electrolyte for Stainless Steel Electropolishing via Adsorption Using Polish Peats. J. Water Process Eng. 2021, 42, 102169. [Google Scholar] [CrossRef]
- Liu, X.; Tian, J.; Li, Y.; Sun, N.; Mi, S.; Xie, Y.; Chen, Z. Enhanced Dyes Adsorption from Wastewater via Fe3O4 Nanoparticles Functionalized Activated Carbon. J. Hazard. Mater. 2019, 373, 397–407. [Google Scholar] [CrossRef]
- Zhao, Y.; Guo, L.; Shen, W.; An, Q.; Xiao, Z.; Wang, H.; Cai, W.; Zhai, S.; Li, Z. Function Integrated Chitosan-Based Beads with throughout Sorption Sites and Inherent Diffusion Network for Efficient Phosphate Removal. Carbohydr. Polym. 2020, 230, 115639. [Google Scholar] [CrossRef]
- Chausali, N.; Saxena, J.; Prasad, R. Nanobiochar and Biochar Based Nanocomposites: Advances and Applications. J. Agric. Food Res. 2021, 5, 100191. [Google Scholar] [CrossRef]
- Bartoli, M.; Giorcelli, M.; Jagdale, P.; Rovere, M.; Tagliaferro, A. A Review of Non-Soil Biochar Applications. Materials 2020, 13, 261. [Google Scholar] [CrossRef] [Green Version]
- Pellera, F.M.; Giannis, A.; Kalderis, D.; Anastasiadou, K.; Stegmann, R.; Wang, J.Y.; Gidarakos, E. Adsorption of Cu(II) Ions from Aqueous Solutions on Biochars Prepared from Agricultural by-Products. J. Environ. Manag. 2012, 96, 35–42. [Google Scholar] [CrossRef]
- Li, J.; Yang, Z.L.; Ding, T.; Song, Y.J.; Li, H.C.; Li, D.Q.; Chen, S.; Xu, F. The Role of Surface Functional Groups of Pectin and Pectin-Based Materials on the Adsorption of Heavy Metal Ions and Dyes. Carbohydr. Polym. 2022, 276, 118789. [Google Scholar] [CrossRef]
- Kant Bhatia, S.; Palai, A.K.; Kumar, A.; Kant Bhatia, R.; Kumar Patel, A.; Kumar Thakur, V.; Yang, Y.H. Trends in Renewable Energy Production Employing Biomass-Based Biochar. Bioresour. Technol. 2021, 340, 125644. [Google Scholar] [CrossRef]
- Chen, X.; Chen, G.; Chen, L.; Chen, Y.; Lehmann, J.; McBride, M.B.; Hay, A.G. Adsorption of Copper and Zinc by Biochars Produced from Pyrolysis of Hardwood and Corn Straw in Aqueous Solution. Bioresour. Technol. 2011, 102, 8877–8884. [Google Scholar] [CrossRef]
- Hossain, M.K.; Strezov Vladimir, V.; Chan, K.Y.; Ziolkowski, A.; Nelson, P.F. Influence of Pyrolysis Temperature on Production and Nutrient Properties of Wastewater Sludge Biochar. J. Environ. Manag. 2011, 92, 223–228. [Google Scholar] [CrossRef]
- Wang, J.; Wang, S. Preparation, Modification and Environmental Application of Biochar: A Review. J. Clean. Prod. 2019, 227, 1002–1022. [Google Scholar] [CrossRef]
- Zhang, S.; Yang, X.; Liu, L.; Ju, M.; Zheng, K. Adsorption Behavior of Selective Recognition Functionalized Biochar to Cd(II) in Wastewater. Materials 2018, 11, 299. [Google Scholar] [CrossRef]
- Abdin, Y.; Usman, A.; Ok, Y.S.; Tsang, Y.F.; Al-Wabel, M. Competitive Sorption and Availability of Coexisting Heavy Metals in Mining-Contaminated Soil: Contrasting Effects of Mesquite and Fishbone Biochars. Environ. Res. 2020, 181, 108846. [Google Scholar] [CrossRef]
- Chen, G.; Wang, H.; Han, L.; Yang, N.; Hu, B.; Qiu, M.; Zhong, X. Highly Efficient Removal of U(VI) by a Novel Biochar Supported with FeS Nanoparticles and Chitosan Composites. J. Mol. Liq. 2021, 327, 114807. [Google Scholar] [CrossRef]
- Ahmed, M.J.; Hameed, B.H.; Hummadi, E.H. Review on Recent Progress in Chitosan/Chitin-Carbonaceous Material Composites for the Adsorption of Water Pollutants. Carbohydr. Polym. 2020, 247, 116690. [Google Scholar] [CrossRef]
- Pascu, B.; Ardean, C.; Davidescu, C.M.; Negrea, A.; Ciopec, M.; Duţeanu, N.; Negrea, P.; Rusu, G. Modified Chitosan for Silver Recovery-Kinetics, Thermodynamic, and Equilibrium Studies. Materials 2020, 13, 657. [Google Scholar] [CrossRef]
- Shi, Y.; Hu, H.; Ren, H. Dissolved Organic Matter (DOM) Removal from Biotreated Coking Wastewater by Chitosan-Modified Biochar: Adsorption Fractions and Mechanisms. Bioresour. Technol. 2020, 297, 122281. [Google Scholar] [CrossRef]
- Danalıoğlu, S.T.; Bayazit, Ş.S.; Kerkez Kuyumcu, Ö.; Salam, M.A. Efficient Removal of Antibiotics by a Novel Magnetic Adsorbent: Magnetic Activated Carbon/Chitosan (MACC) Nanocomposite. J. Mol. Liq. 2017, 240, 589–596. [Google Scholar] [CrossRef]
- Mandal, S.; Sarkar, B.; Bolan, N.; Ok, Y.S.; Naidu, R. Enhancement of Chromate Reduction in Soils by Surface Modified Biochar. J. Environ. Manag. 2016, 186, 277–284. [Google Scholar] [CrossRef]
- Xiao, F.; Cheng, J.; Cao, W.; Yang, C.; Chen, J.; Luo, Z. Removal of Heavy Metals from Aqueous Solution Using Chitosan-Combined Magnetic Biochars. J. Colloid Interface Sci. 2019, 540, 579–584. [Google Scholar] [CrossRef]
- Kołodyńska, D.; Krukowska, J.; Thomas, P. Comparison of Sorption and Desorption Studies of Heavy Metal Ions from Biochar and Commercial Active Carbon. Chem. Eng. J. 2017, 307, 353–363. [Google Scholar] [CrossRef]
- Cui, X.; Dai, X.; Khan, K.Y.; Li, T.; Yang, X.; He, Z. Removal of Phosphate from Aqueous Solution Using Magnesium-Alginate/Chitosan Modified Biochar Microspheres Derived from Thalia dealbata. Bioresour. Technol. 2016, 218, 1123–1132. [Google Scholar] [CrossRef]
- Zhao, H.; Lang, Y. Adsorption Behaviors and Mechanisms of Florfenicol by Magnetic Functionalized Biochar and Reed Biochar. J. Taiwan Inst. Chem. Eng. 2018, 88, 152–160. [Google Scholar] [CrossRef]
- Zanella, H.G.; Spessato, L.; Lopes, G.K.P.; Yokoyama, J.T.C.; Silva, M.C.; Souza, P.S.C.; Ronix, A.; Cazetta, A.L.; Almeida, V.C. Caffeine Adsorption on Activated Biochar Derived from Macrophytes (Eichornia crassipes). J. Mol. Liq. 2021, 340, 117206. [Google Scholar] [CrossRef]
- Thommes, M.; Kaneko, K.; Neimark, A.V.; Olivier, J.P.; Rodriguez-Reinoso, F.; Rouquerol, J.; Sing, K.S.W. Physisorption of Gases, with Special Reference to the Evaluation of Surface Area and Pore Size Distribution (IUPAC Technical Report). Pure App. Chem. 2015, 87, 1051–1069. [Google Scholar] [CrossRef] [Green Version]
- Wang, Z.; Li, Y.; Xie, X.; Wang, Z. Bifunctional MnFe2O4/Chitosan Modified Biochar Composite for Enhanced Methyl Orange Removal Based on Adsorption and Photo-Fenton Process. Colloids Surfaces A Physicochem. Eng. Asp. 2021, 613, 126104. [Google Scholar] [CrossRef]
- Xiang, J.; Lin, Q.; Yao, X.; Yin, G. Removal of Cd from Aqueous Solution by Chitosan Coated MgO-Biochar and Its in-Situ Remediation of Cd-Contaminated Soil. Environ. Res. 2021, 195, 110650. [Google Scholar] [CrossRef] [PubMed]
- Kołodyńska, D.; Bąk, J.; Kozioł, M.; Pylypchuk, L.V. Investigations of Heavy Metal Ion Sorption Using Nanocomposites of Iron-Modified Biochar. Nanoscale Res. Lett. 2017, 12, 433–446. [Google Scholar] [CrossRef]
- Özçimen, D.; Ersoy-Meriçboyu, A. Characterization of Biochar and Bio-Oil Samples Obtained from Carbonization of Various Biomass Materials. Renew. Energy 2010, 35, 1319–1324. [Google Scholar] [CrossRef]
- Manakhov, A.; Michlíček, M.; Nečas, D.; Polčák, J.; Makhneva, E.; Eliáš, M.; Zajíčková, L. Carboxyl-Rich Coatings Deposited by Atmospheric Plasma Co-Polymerization of Maleic Anhydride and Acetylene. Surf. Coat. Technol. 2016, 295, 37–45. [Google Scholar] [CrossRef]
- Du, Z.; Zheng, T.; Wang, P.; Hao, L.; Wang, Y. Fast Microwave-Assisted Preparation of a Low-Cost and Recyclable Carboxyl Modified Lignocellulose-Biomass Jute Fiber for Enhanced Heavy Metal Removal from Water. Bioresour. Technol. 2016, 201, 41–49. [Google Scholar] [CrossRef]
- Yang, J.; Ma, C.; Tao, J.; Li, J.; Du, K.; Wei, Z.; Chen, C.; Wang, Z.; Zhao, C.; Ma, M.G. Optimization of Polyvinylamine-Modified Nanocellulose for Chlorpyrifos Adsorption by Central Composite Design. Carbohydr. Polym. 2020, 245, 116542. [Google Scholar] [CrossRef]
- Arán, D.; Antelo, J.; Fiol, S.; Macías, F. Influence of Feedstock on the Copper Removal Capacity of Waste-Derived Biochars. Bioresour. Technol. 2016, 212, 199–206. [Google Scholar] [CrossRef]
- Medynśka-Juraszek, A.; Ćwielag-Piasecka, I.; Jerzykiewicz, M.; Trynda, J. Wheat Straw Biochar as a Specific Sorbent of Cobalt in Soil. Materials 2020, 13, 2462. [Google Scholar] [CrossRef]
- Gao, X.; Tan, M.; Jiang, S.; Huang, Z.; Li, C.; Lei, T.; Wang, Z.; Zhu, Y.; Li, H. Pyrolysis of Torrefied Rice Straw from Gas-Pressurized and Oxidative Torrefaction: Pyrolysis Kinetic Analysis and the Properties of Biochars. J. Anal. Appl. Pyrolysis 2021, 157, 105238. [Google Scholar] [CrossRef]
- Doondani, P.; Gomase, V.; Saravanan, D.; Jugade, R.M. Chitosan coated cotton-straw-biochar as an admirable adsorbent for reactive ed dye. Results Eng. 2022, 15, 100515. [Google Scholar] [CrossRef]
- Gamal, A.; Ibrahim, A.G.; Eliwa, E.M.; El-Zomrawy, A.H.; El-Bahy, S.M. Synthesis and Characterization of a Novel Benzothiazole Functionalized Chitosan and Its Use for Effective Adsorption of Cu(II). Int. J. Biol. Macromol. 2021, 183, 1283–1292. [Google Scholar] [CrossRef]
- Herath, I.; Kumarathilaka, P.; Al-Wabel, M.I.; Abduljabbar, A.; Ahmad, M.; Usman, A.R.A.; Vithanage, M. Mechanistic Modeling of Glyphosate Interaction with Rice Husk Derived Engineered Biochar. Microporous Mesoporous Mater. 2016, 225, 280–288. [Google Scholar] [CrossRef]
- Mohan, D.; Kumar, H.; Sarswat, A.; Alexandre-Franco, M.; Pittman, C.U. Cadmium and Lead Remediation Using Magnetic Oak Wood and Oak Bark Fast Pyrolysis Bio-Chars. Chem. Eng. J. 2014, 236, 513–528. [Google Scholar] [CrossRef]
- Karthik, V.; Selvakumar, P.; Sivarajasekar, N.; Megavarshini, P.; Brinda, N.; Kiruthika, J.; Balasubramani, K.; Ahamad, T.; Naushad, M. Comparative and Equilibrium Studies on Anionic and Cationic Dyes Removal by Nano-Alumina-Doped Catechol Formaldehyde Composite. J. Chem. 2020, 2020, 7617989. [Google Scholar] [CrossRef]
- Vilvanathan, S.; Shanthakumar, S. Ni2+ and Co2+ Adsorption Using Tectona Grandis Biochar: Kinetics, Equilibrium and Desorption Studies. Environ. Technol. 2018, 39, 464–478. [Google Scholar] [CrossRef]
- Zazycki, M.A.; Godinho, M.; Perondi, D.; Foletto, E.L.; Collazzo, G.C.; Dotto, G.L. New Biochar from Pecan Nutshells as an Alternative Adsorbent for Removing Reactive Red 141 from Aqueous Solutions. J. Clean. Prod. 2018, 171, 57–65. [Google Scholar] [CrossRef]
- Saeed, A.; Iqbal, M.; Akhtar, M.W. Removal and Recovery of Lead(II) from Single and Multimetal (Cd, Cu, Ni, Zn) Solutions by Crop Milling Waste (Black Gram Husk). J. Hazard. Mater. 2005, 117, 65–73. [Google Scholar] [CrossRef]
- Barman, S.R.; Das, P.; Mukhopadhayay, A. Biochar from Waste Sterculia Foetida and Its Application as Adsorbent for the Treatment of PAH Compounds: Batch and Optimization. Fuel 2021, 306, 121623. [Google Scholar] [CrossRef]
- Tan, K.L.; Hameed, B.H. Insight into the Adsorption Kinetics Models for the Removal of Contaminants from Aqueous Solutions. J. Taiwan Inst. Chem. Eng. 2017, 74, 25–48. [Google Scholar] [CrossRef]
- Demirbas, E.; Nas, M.Z. Batch Kinetic and Equilibrium Studies of Adsorption of Reactive Blue 21 by Fly Ash and Sepiolite. Desalination 2009, 243, 8–21. [Google Scholar] [CrossRef]
- Lima, J.Z.; Ferreira da Silva, E.; Patinha, C.; Durães, N.; Vieira, E.M.; Rodrigues, V.G.S. Sorption of Arsenic by Composts and Biochars Derived from the Organic Fraction of Municipal Solid Wastes: Kinetic, Isotherm and Oral Bioaccessibility Study. Environ. Res. 2022, 204, 111988. [Google Scholar] [CrossRef]
- Sahu, S.; Pahi, S.; Tripathy, S.; Singh, S.K.; Behera, A.; Sahu, U.K.; Patel, R.K. Adsorption of Methylene Blue on Chemically Modified Lychee Seed Biochar: Dynamic, Equilibrium, and Thermodynamic Study. J. Mol. Liq. 2020, 315, 113743. [Google Scholar] [CrossRef]
- Fan, S.; Tang, J.; Wang, Y.; Li, H.; Zhang, H.; Tang, J.; Wang, Z.; Li, X. Biochar Prepared from Co-Pyrolysis of Municipal Sewage Sludge and Tea Waste for the Adsorption of Methylene Blue from Aqueous Solutions: Kinetics, Isotherm, Thermodynamic and Mechanism. J. Mol. Liq. 2016, 220, 432–441. [Google Scholar] [CrossRef]
- Patel, M.; Kumar, R.; Pittman, C.U.; Mohan, D. Ciprofloxacin and Acetaminophen Sorption onto Banana Peel Biochars: Environmental and Process Parameter Influences. Environ. Res. 2021, 201, 111218. [Google Scholar] [CrossRef] [PubMed]
- Batool, S.; Idrees, M.; Al-Wabel, M.I.; Ahmad, M.; Hina, K.; Ullah, H.; Cui, L.; Hussain, Q. Sorption of Cr(III) from Aqueous Media via Naturally Functionalized Microporous Biochar: Mechanistic Study. Microchem. J. 2019, 144, 242–253. [Google Scholar] [CrossRef]
- Zhou, Y.; Gao, B.; Zimmerman, A.R.; Fang, J.; Sun, Y.; Cao, X. Sorption of Heavy Metals on Chitosan-Modified Biochars and Its Biological Effects. Chem. Eng. J. 2013, 231, 512–518. [Google Scholar] [CrossRef]
- Zhou, Y.; Gao, B.; Zimmerman, A.R.; Chen, H.; Zhang, M.; Cao, X. Biochar-Supported Zerovalent Iron for Removal of Various Contaminants from Aqueous Solutions. Bioresour. Technol. 2014, 152, 538–542. [Google Scholar] [CrossRef]
- Zhang, L.; Tang, S.; He, F.; Liu, Y.; Mao, W.; Guan, Y. Highly Efficient and Selective Capture of Heavy Metals by Poly(Acrylic Acid) Grafted Chitosan and Biochar Composite for Wastewater Treatment. Chem. Eng. J. 2019, 378, 122215. [Google Scholar] [CrossRef]
- Tan, Y.; Wan, X.; Ni, X.; Wang, L.; Zhou, T.; Sun, H.; Wang, N.; Yin, X. Efficient Removal of Cd (II) from Aqueous Solution by Chitosan Modified Kiwi Branch Biochar. Chemosphere 2022, 289, 133251. [Google Scholar] [CrossRef]
- Bombuwala Dewage, N.; Fowler, R.E.; Pittman, C.U.; Mohan, D.; Mlsna, T. Lead (Pb2+) Sorptive Removal Using Chitosan-Modified Biochar: Batch and Fixed-Bed Studies. RSC Adv. 2018, 8, 25368–25377. [Google Scholar] [CrossRef] [PubMed]
- Zhou, D.; Xie, G.; Hu, X.; Cai, X.; Zhao, Y.; Hu, X.; Jin, Q.; Fu, X.; Tan, X.; Liang, C.; et al. Coupling of Kenaf Biochar and Magnetic BiFeO3 onto Cross-Linked Chitosan for Enhancing Separation Performance and Cr(Vi) Ions Removal Efficiency. Int. J. Environ. Res. Public Health 2020, 17, 788. [Google Scholar] [CrossRef] [PubMed]
- Cheng, N.; Wang, B.; Wu, P.; Lee, X.; Xing, Y.; Chen, M.; Gao, B. Adsorption of Emerging Contaminants from Water and Wastewater by Modified Biochar: A Review. Environ. Pollut. 2021, 273, 116448. [Google Scholar] [CrossRef] [PubMed]


| Properties | BC-CS 1-1 | BC-CS 2-1 | BC-CS 4-1 |
|---|---|---|---|
| Ash content | 61.47 | 59.48 | 66.26 |
| %C | 40.17 | 41.42 | 39.56 |
| %H | 1.16 | 1.12 | 1.06 |
| %N | 1.53 | 1.14 | 0.96 |
| Substances | BC-CS 1-1 | BC-CS 2-1 | BC-CS 4-1 | BC-CS 1-1-Cu(II) | BC-CS 2-1- Cu(II) | BC-CS 4-1- Cu(II) |
|---|---|---|---|---|---|---|
| SiO2 | 61.2 | 60.5 | 59.0 | 64.0 | 52.0 | 47.0 |
| CaMg(CO3)2 | 9.9 | 12.4 | 15.0 | 3.2 | 4.4 | 5.0 |
| CaCO3 | 4.3 | 5.5 | 6.2 | 17.0 | 15.4 | 16.1 |
| Na(AlSi3O8) | 11.7 | 10.8 | 10.1 | 8.2 | 6.1 | 12.0 |
| K(AlSi3O8) | 10.5 | 8.7 | 8.0 | 4.4 | 10.9 | 9.0 |
| CaCl2 | 2.4 | 2.1 | 1.6 | 1.4 | 9.2 | 8.3 |
| Cu2Cl(OH)3 | - | - | - | 1.8 | 2.0 | 2.6 |
| Parameters | |||||||||||
|---|---|---|---|---|---|---|---|---|---|---|---|
| C0 [mg/L] | qexp | PFO | PSO | IPD | |||||||
| q1 | k1 | R2 | q2 | k2 | h | R2 | ki | C | R2 | ||
| Cu(II) | |||||||||||
| 50 | 7.87 | 1.85 | 0.018 | 0.943 | 7.91 | 0.050 | 3.144 | 1.000 | 0.019 | 7.519 | 0.774 |
| 100 | 13.74 | 7.40 | 0.011 | 0.944 | 13.81 | 0.006 | 1.238 | 0.996 | 0.228 | 9.423 | 0.955 |
| 150 | 15.40 | 11.01 | 0.023 | 0.912 | 15.77 | 0.006 | 1.558 | 0.998 | 0.102 | 13.553 | 0.637 |
| 200 | 21.95 | 9.20 | 0.014 | 0.943 | 22.12 | 0.005 | 3.653 | 0.999 | 0.160 | 18.976 | 0.923 |
| Cd(II) | |||||||||||
| 50 | 8.26 | 4.00 | 0.014 | 0.962 | 8.38 | 0.013 | 0.941 | 0.997 | 0.037 | 7.563 | 0.994 |
| 100 | 14.05 | 6.72 | 0.011 | 0.947 | 14.11 | 0.008 | 1.553 | 0.997 | 0.281 | 9.013 | 0.801 |
| 150 | 15.92 | 6.14 | 0.012 | 0.936 | 15.95 | 0.010 | 2.537 | 0.999 | 0.173 | 12.697 | 0.906 |
| 200 | 22.55 | 7.86 | 0.017 | 0.966 | 22.75 | 0.008 | 4.321 | 0.999 | 0.069 | 21.274 | 0.832 |
| Zn(II) | |||||||||||
| 50 | 8.62 | 3.40 | 0.012 | 0.881 | 8.67 | 0.012 | 0.927 | 0.991 | 0.048 | 7.721 | 0.981 |
| 100 | 12.52 | 5.87 | 0.018 | 0.679 | 12.45 | 0.011 | 1.644 | 0.993 | 0.239 | 8.126 | 0.806 |
| 150 | 16.70 | 4.79 | 0.010 | 0.938 | 16.63 | 0.011 | 3.083 | 0.998 | 0.216 | 12.722 | 0.833 |
| 200 | 20.05 | 7.98 | 0.013 | 0.878 | 20.07 | 0.008 | 9.028 | 0.998 | 0.274 | 15.055 | 0.697 |
| Co(II) | |||||||||||
| 50 | 5.17 | 1.48 | 0.007 | 0.811 | 5.09 | 0.038 | 0.993 | 0.998 | 0.069 | 3.832 | 0.897 |
| 100 | 7.92 | 2.34 | 0.009 | 0.914 | 7.86 | 0.024 | 1.462 | 0.998 | 0.095 | 6.104 | 0.968 |
| 150 | 11.11 | 5.15 | 0.009 | 0.901 | 11.03 | 0.009 | 1.038 | 0.992 | 0.204 | 6.260 | 0.805 |
| 200 | 12.02 | 4.18 | 0.006 | 0.959 | 11.75 | 0.011 | 1.476 | 0.995 | 0.280 | 6.698 | 1.000 |
| Pb(II) | |||||||||||
| 50 | 8.58 | 0.03 | 0.017 | 0.660 | 8.58 | 4.004 | 294.494 | 1.000 | 0.001 | 8.569 | 0.964 |
| 100 | 16.64 | 0.08 | 0.025 | 0.598 | 16.65 | 1.336 | 370.191 | 1.000 | 0.001 | 16.641 | 0.857 |
| 150 | 21.49 | 2.05 | 0.037 | 0.953 | 21.53 | 0.080 | 37.316 | 1.000 | 0.001 | 21.484 | 0.957 |
| 200 | 30.12 | 5.75 | 0.022 | 0.943 | 30.27 | 0.019 | 17.399 | 1.000 | 0.018 | 29.782 | 0.995 |
| Isotherm Models | Parameters | Cu(II) | Cd(II) | Zn(II) | Co(II) | Pb(II) |
|---|---|---|---|---|---|---|
| Langmuir | qe,exp | 45.76 | 48.56 | 44.10 | 24.42 | 68.36 |
| q0 | 52.35 | 96.63 | 48.91 | 27.38 | 65.13 | |
| KL | 0.024 | 0.004 | 0.020 | 0.007 | 0.050 | |
| R2 | 0.944 | 0.978 | 0.966 | 0.963 | 0.948 | |
| Freundlich | KF | 5.37 | 0.97 | 5.34 | 1.45 | 9.37 |
| 1/n | 0.396 | 0.716 | 0.362 | 0.441 | 0.365 | |
| R2 | 0.942 | 0.976 | 0.943 | 0.959 | 0.942 | |
| Temkin | KT | 0.574 | 0.061 | 0.501 | 0.111 | 1.365 |
| bT | 285.65 | 146.95 | 311.61 | 478.46 | 241.16 | |
| R2 | 0.863 | 0.889 | 0.870 | 0.868 | 0.901 | |
| Dubinin–Raduszkiewicz | qm | 0.0015 | 0.0038 | 0.0012 | 0.0007 | 0.0020 |
| β | 0.0041 | 0.0086 | 0.0038 | 0.0054 | 0.0036 | |
| Ea | 16.086 | 8.642 | 11.423 | 9.603 | 11.739 | |
| R2 | 0.928 | 0.968 | 0.915 | 0.944 | 0.957 |
| Ions | Kd | ∆Ho [kJ/mol] | ∆So [J/molK] | ∆Go [kJ/mol] | ||||
|---|---|---|---|---|---|---|---|---|
| Temperature [K] | Temperature [K] | |||||||
| 293 | 313 | 333 | 293 | 313 | 333 | |||
| Cu(II) | 0.185 | 0.190 | 0.243 | 5.38 | 4.05 | −12.72 | −13.65 | −15.21 |
| Cd(II) | 0.138 | 0.144 | 0.148 | 1.55 | −11.19 | −11.99 | −12.94 | −13.84 |
| Zn(II) | 0.127 | 0.136 | 0.144 | 2.44 | 8.79 | −11.81 | −12.78 | −13.75 |
| Co(II) | 0.062 | 0.069 | 0.083 | 5.92 | −3.12 | −10.04 | −11.00 | −12.22 |
| Pb(II) | 0.353 | 0.503 | 0.575 | 9.96 | 25.58 | −14.29 | −16.19 | −17.59 |
| Ions | Sorbent | Adsorption Capacity [mg/g] | Sorption Percentage [%] | References |
|---|---|---|---|---|
| Pb(II) | chitosan-modified bamboo biochar | - | 52 | [57] |
| Cd(II) | - | 45 | ||
| Cu(II) | - | 55 | ||
| Pb(II) | biochar supported zerovalent iron and chitosan (mass ratio 1:1:1) | - | 100 | [58] |
| Cr(VI) | - | 35 | ||
| As(V) | - | 60 | ||
| Pb(II) | chitosan- pyromellitic dianhydride modified biochar | 8.62 | - | [1] |
| Cd(II) | 25.78 | - | ||
| Cu(II) | 71.40 | - | ||
| Zn(II) | poly(acrylic acid) grafted chitosan and biochar composite | 114.94 | - | [59] |
| Cu(II) | 111.11 | - | ||
| Co(II) | 135.14 | - | ||
| Cd(II) | chitosan-modified kiwi branch biochar | 126.58 | - | [60] |
| Cd(II) | chitosan coated MgO-biochar | - | 60 | [32] |
| Pb(II) | chitosan-modified pine wood biochar | - | >70 | [61] |
| Cr(VI) | magnetic BiFeO3 onto cross-linked chitosan | 63.12 | - | [62] |
Publisher’s Note: MDPI stays neutral with regard to jurisdictional claims in published maps and institutional affiliations. |
© 2022 by the authors. Licensee MDPI, Basel, Switzerland. This article is an open access article distributed under the terms and conditions of the Creative Commons Attribution (CC BY) license (https://creativecommons.org/licenses/by/4.0/).
Share and Cite
Bąk, J.; Thomas, P.; Kołodyńska, D. Chitosan-Modified Biochars to Advance Research on Heavy Metal Ion Removal: Roles, Mechanism and Perspectives. Materials 2022, 15, 6108. https://doi.org/10.3390/ma15176108
Bąk J, Thomas P, Kołodyńska D. Chitosan-Modified Biochars to Advance Research on Heavy Metal Ion Removal: Roles, Mechanism and Perspectives. Materials. 2022; 15(17):6108. https://doi.org/10.3390/ma15176108
Chicago/Turabian StyleBąk, Justyna, Peter Thomas, and Dorota Kołodyńska. 2022. "Chitosan-Modified Biochars to Advance Research on Heavy Metal Ion Removal: Roles, Mechanism and Perspectives" Materials 15, no. 17: 6108. https://doi.org/10.3390/ma15176108
APA StyleBąk, J., Thomas, P., & Kołodyńska, D. (2022). Chitosan-Modified Biochars to Advance Research on Heavy Metal Ion Removal: Roles, Mechanism and Perspectives. Materials, 15(17), 6108. https://doi.org/10.3390/ma15176108