
Ozone Formation during Photocatalytic Oxidation of Nitric Oxides under UV Irradiation with the Use of Commercial TiO2 Photocatalytic Powders


 and
and
Abstract
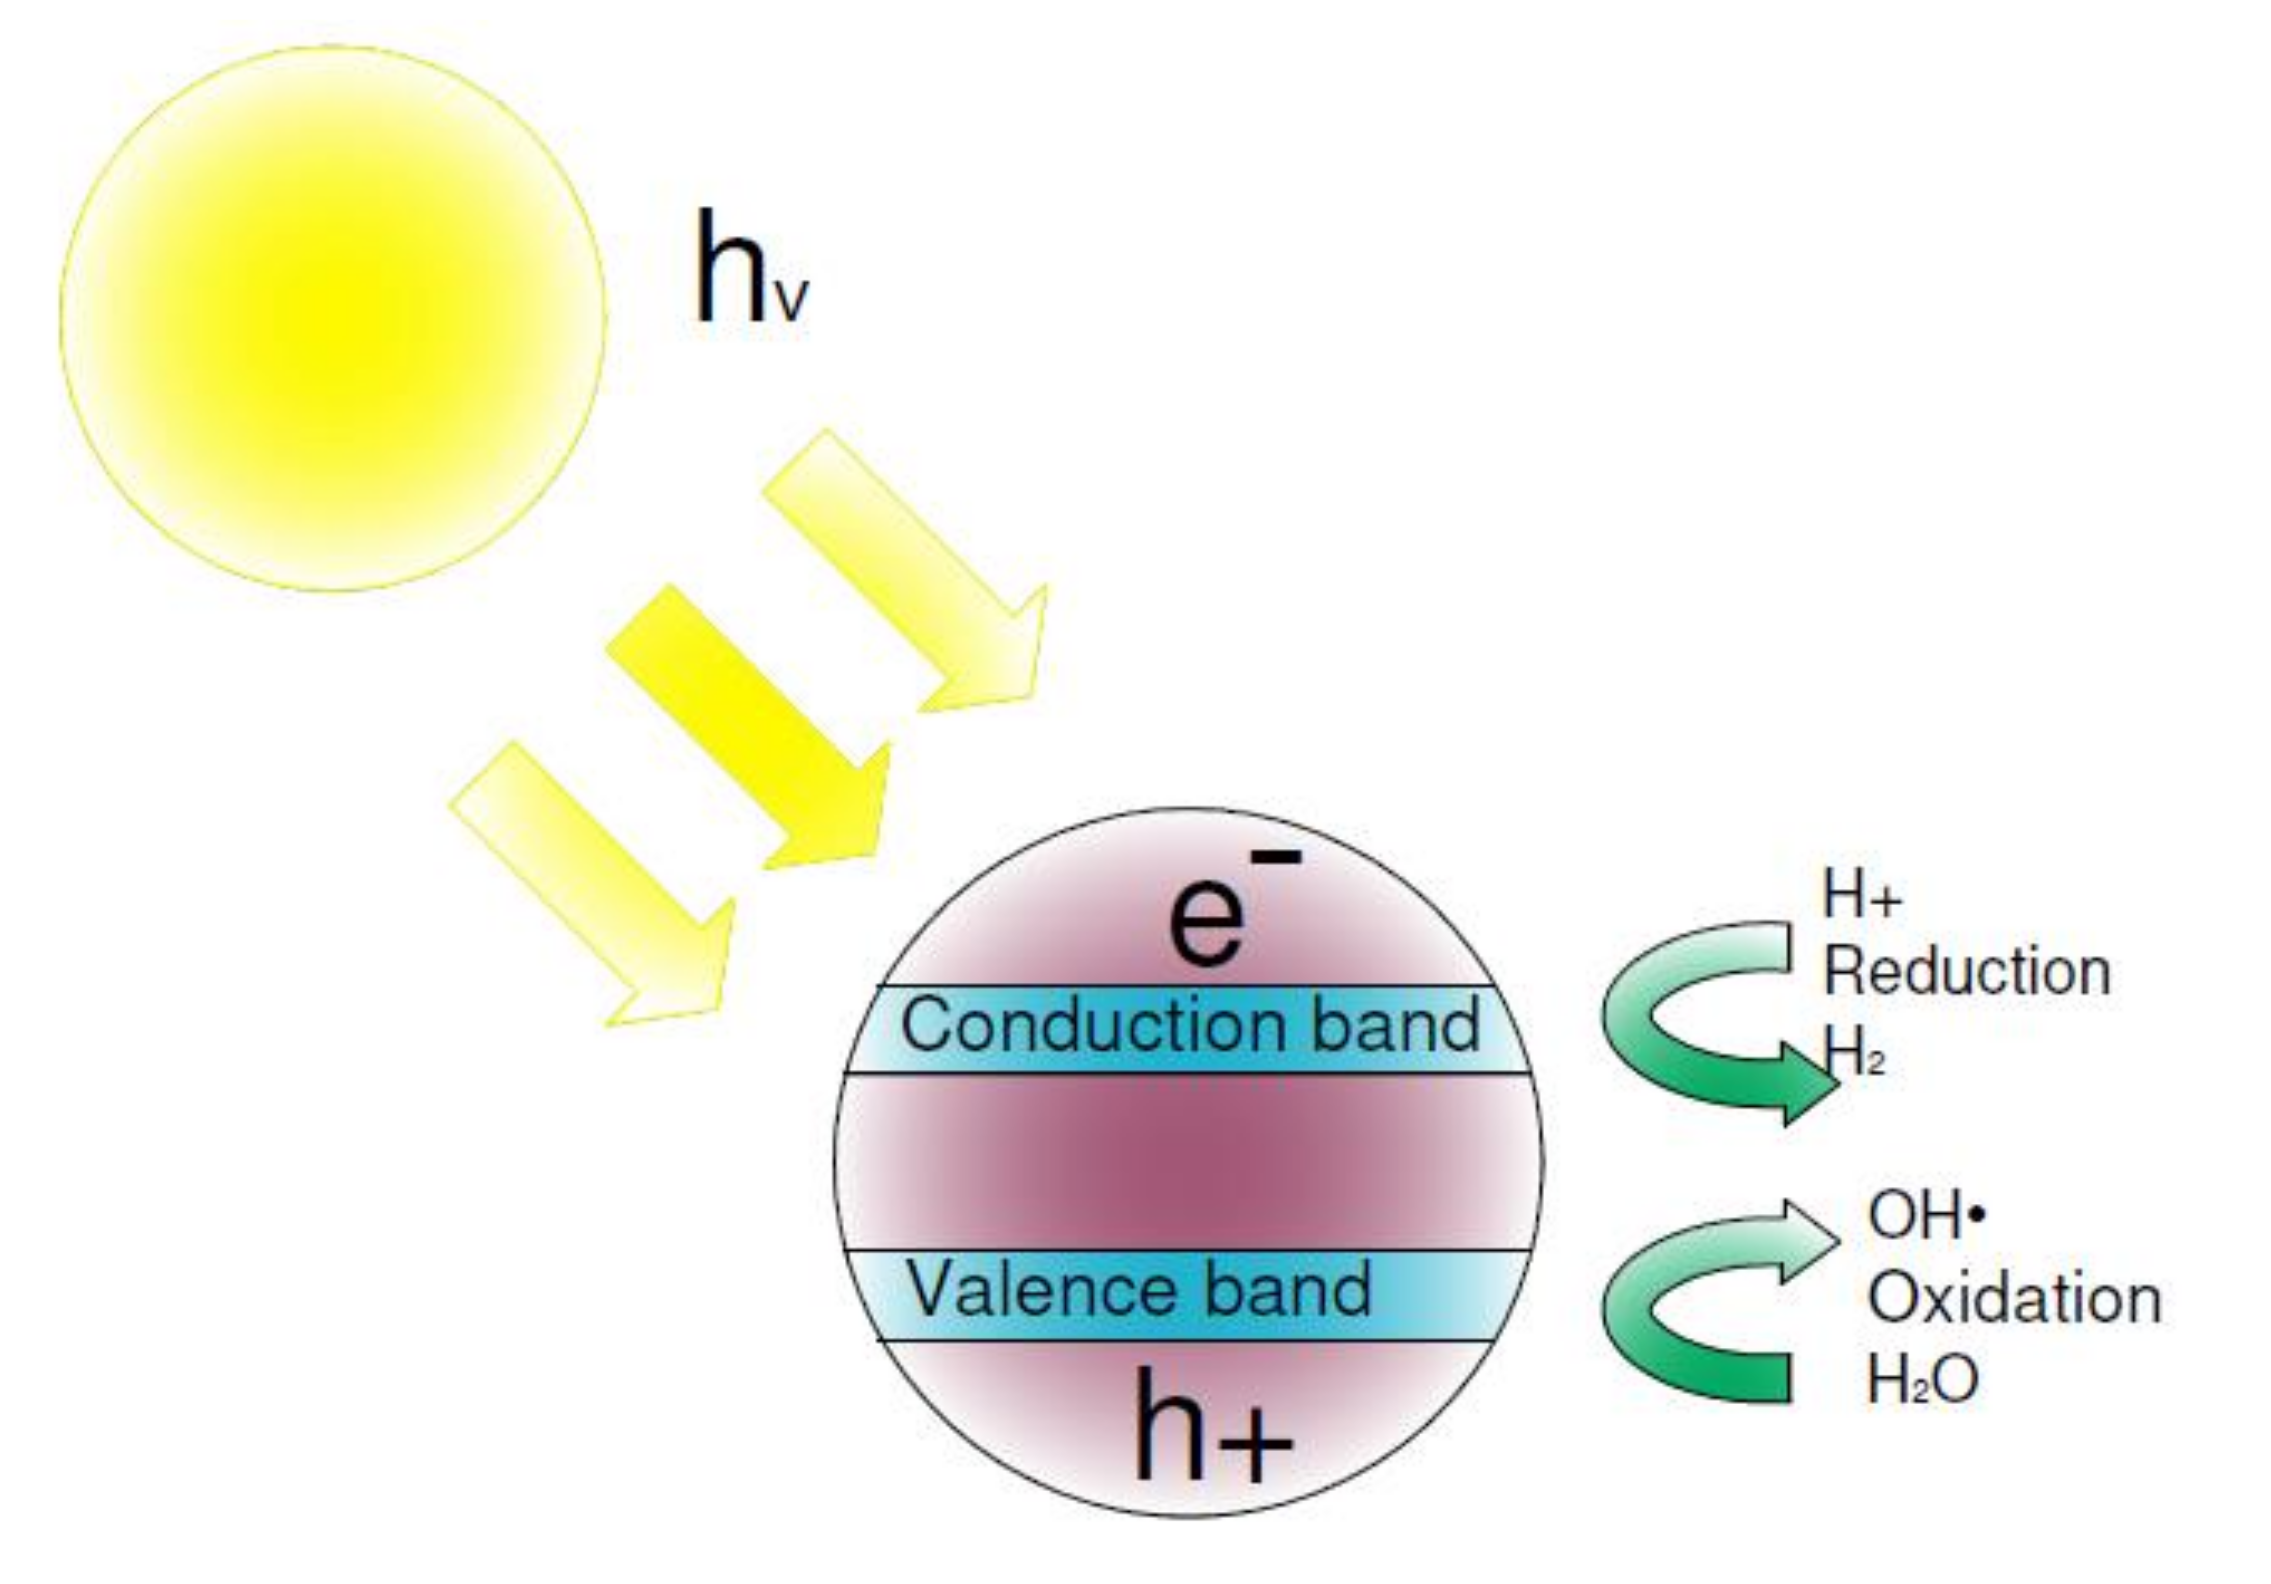
:1. Introduction
2. Materials and Methods
2.1. Photocatalytic Powders
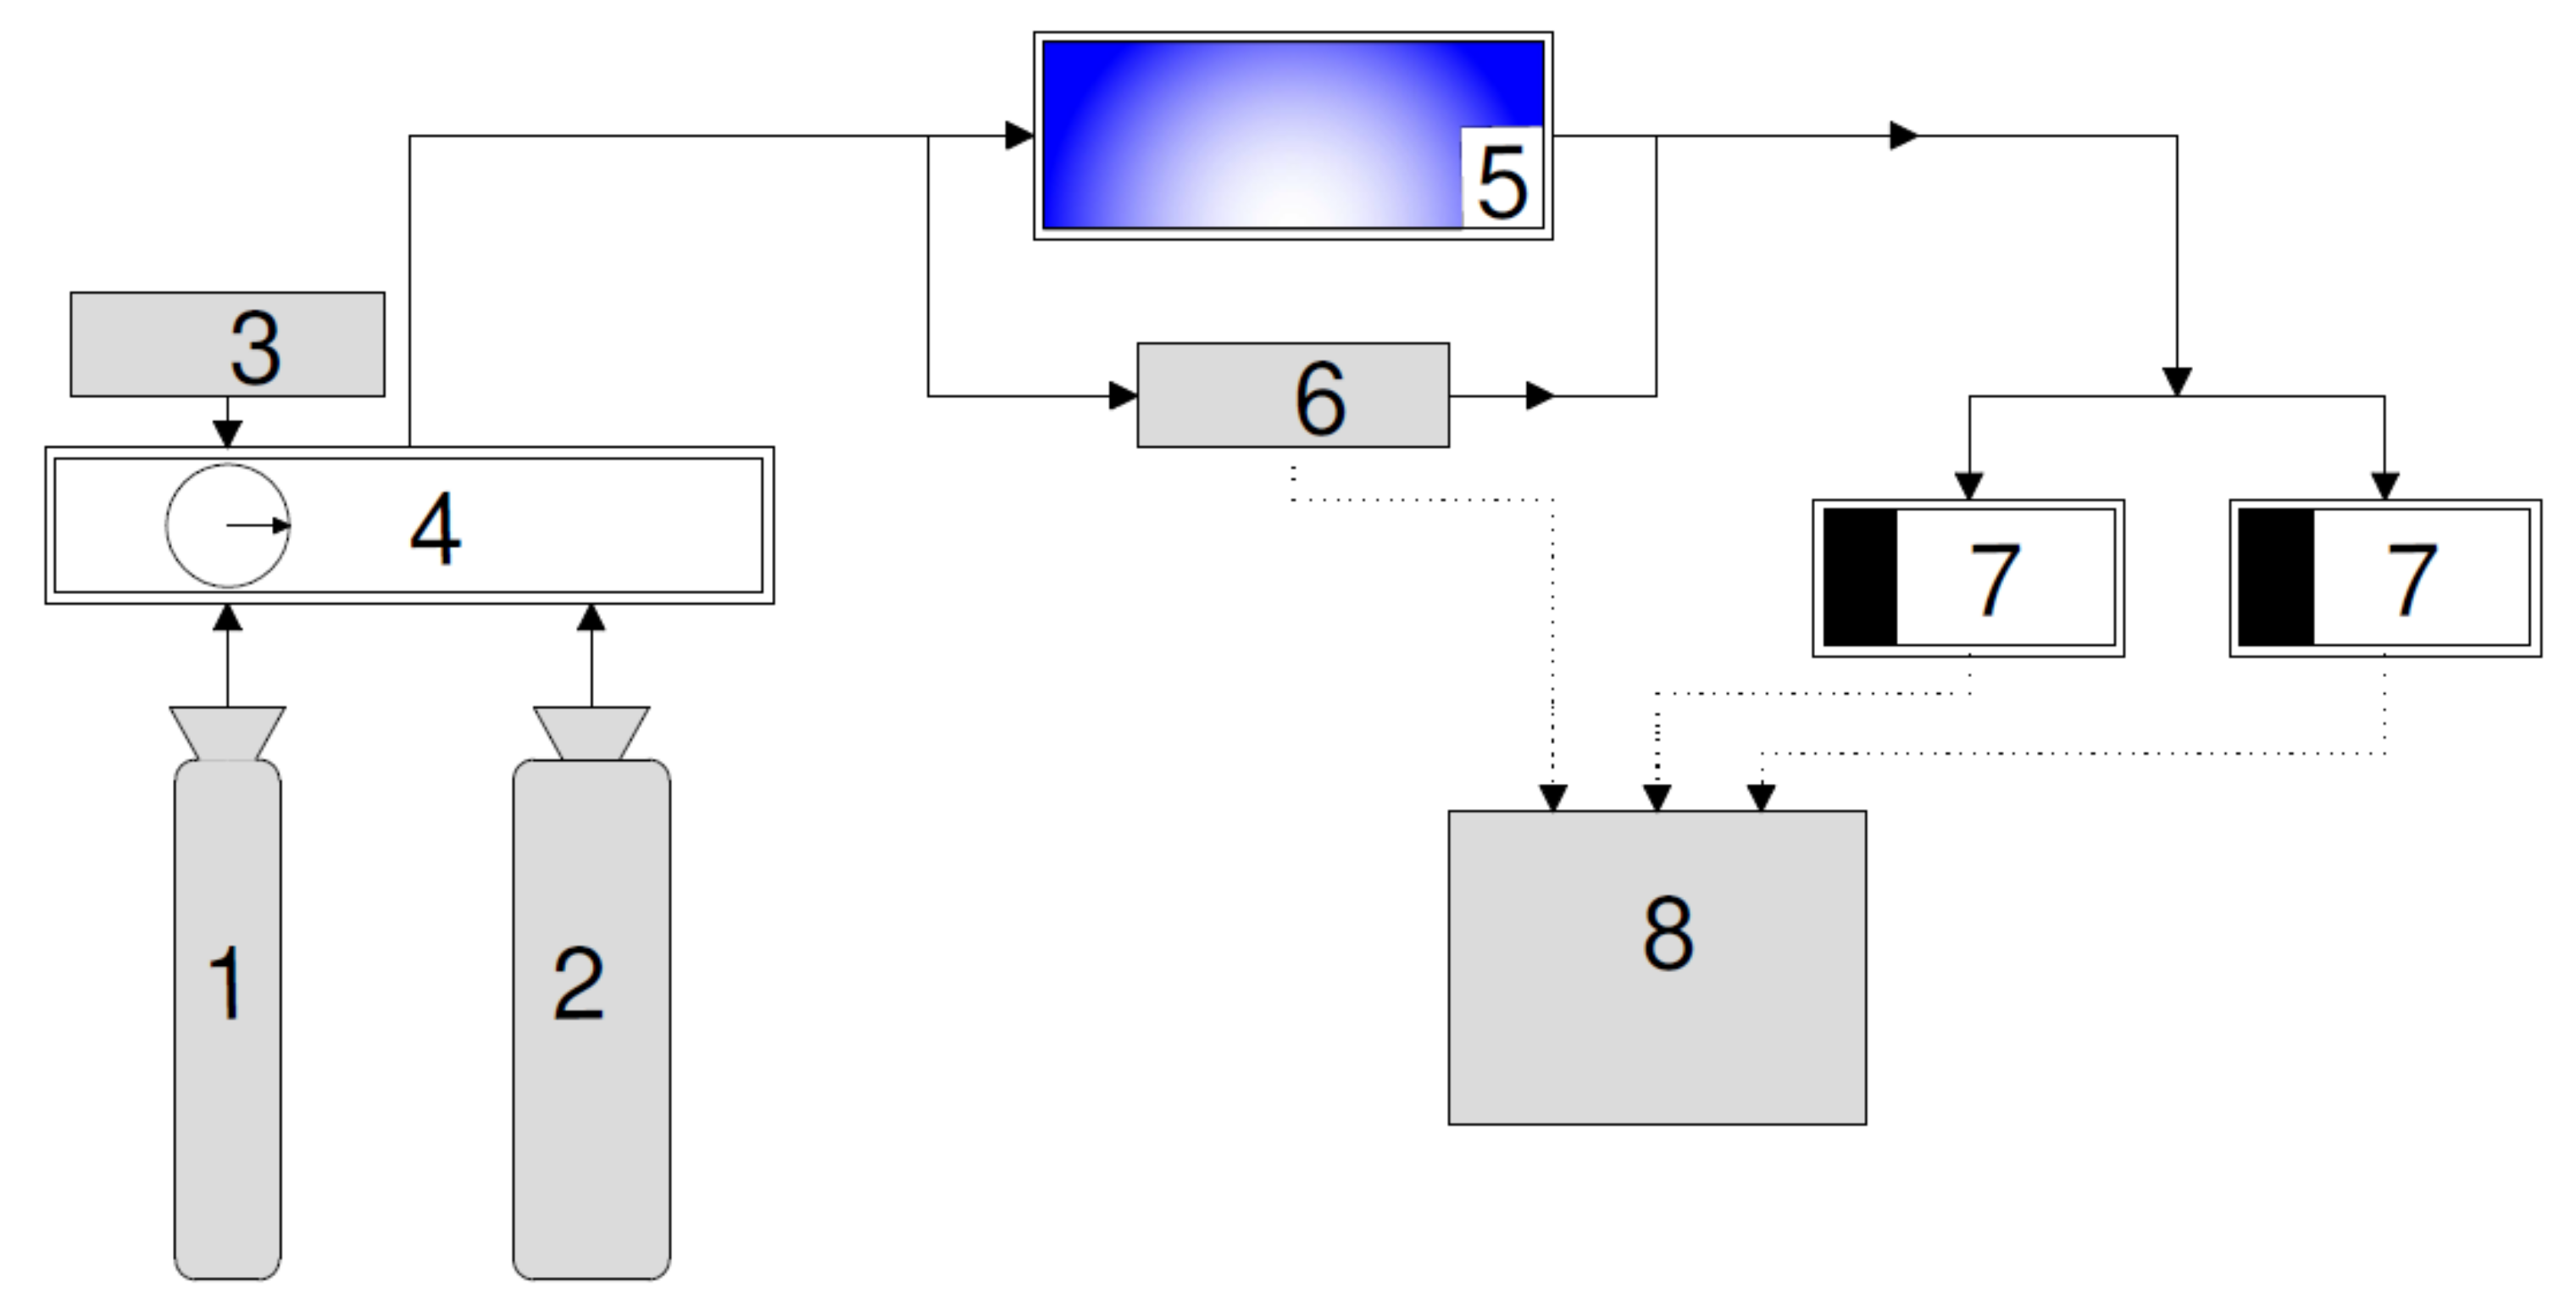
2.2. Test Setup
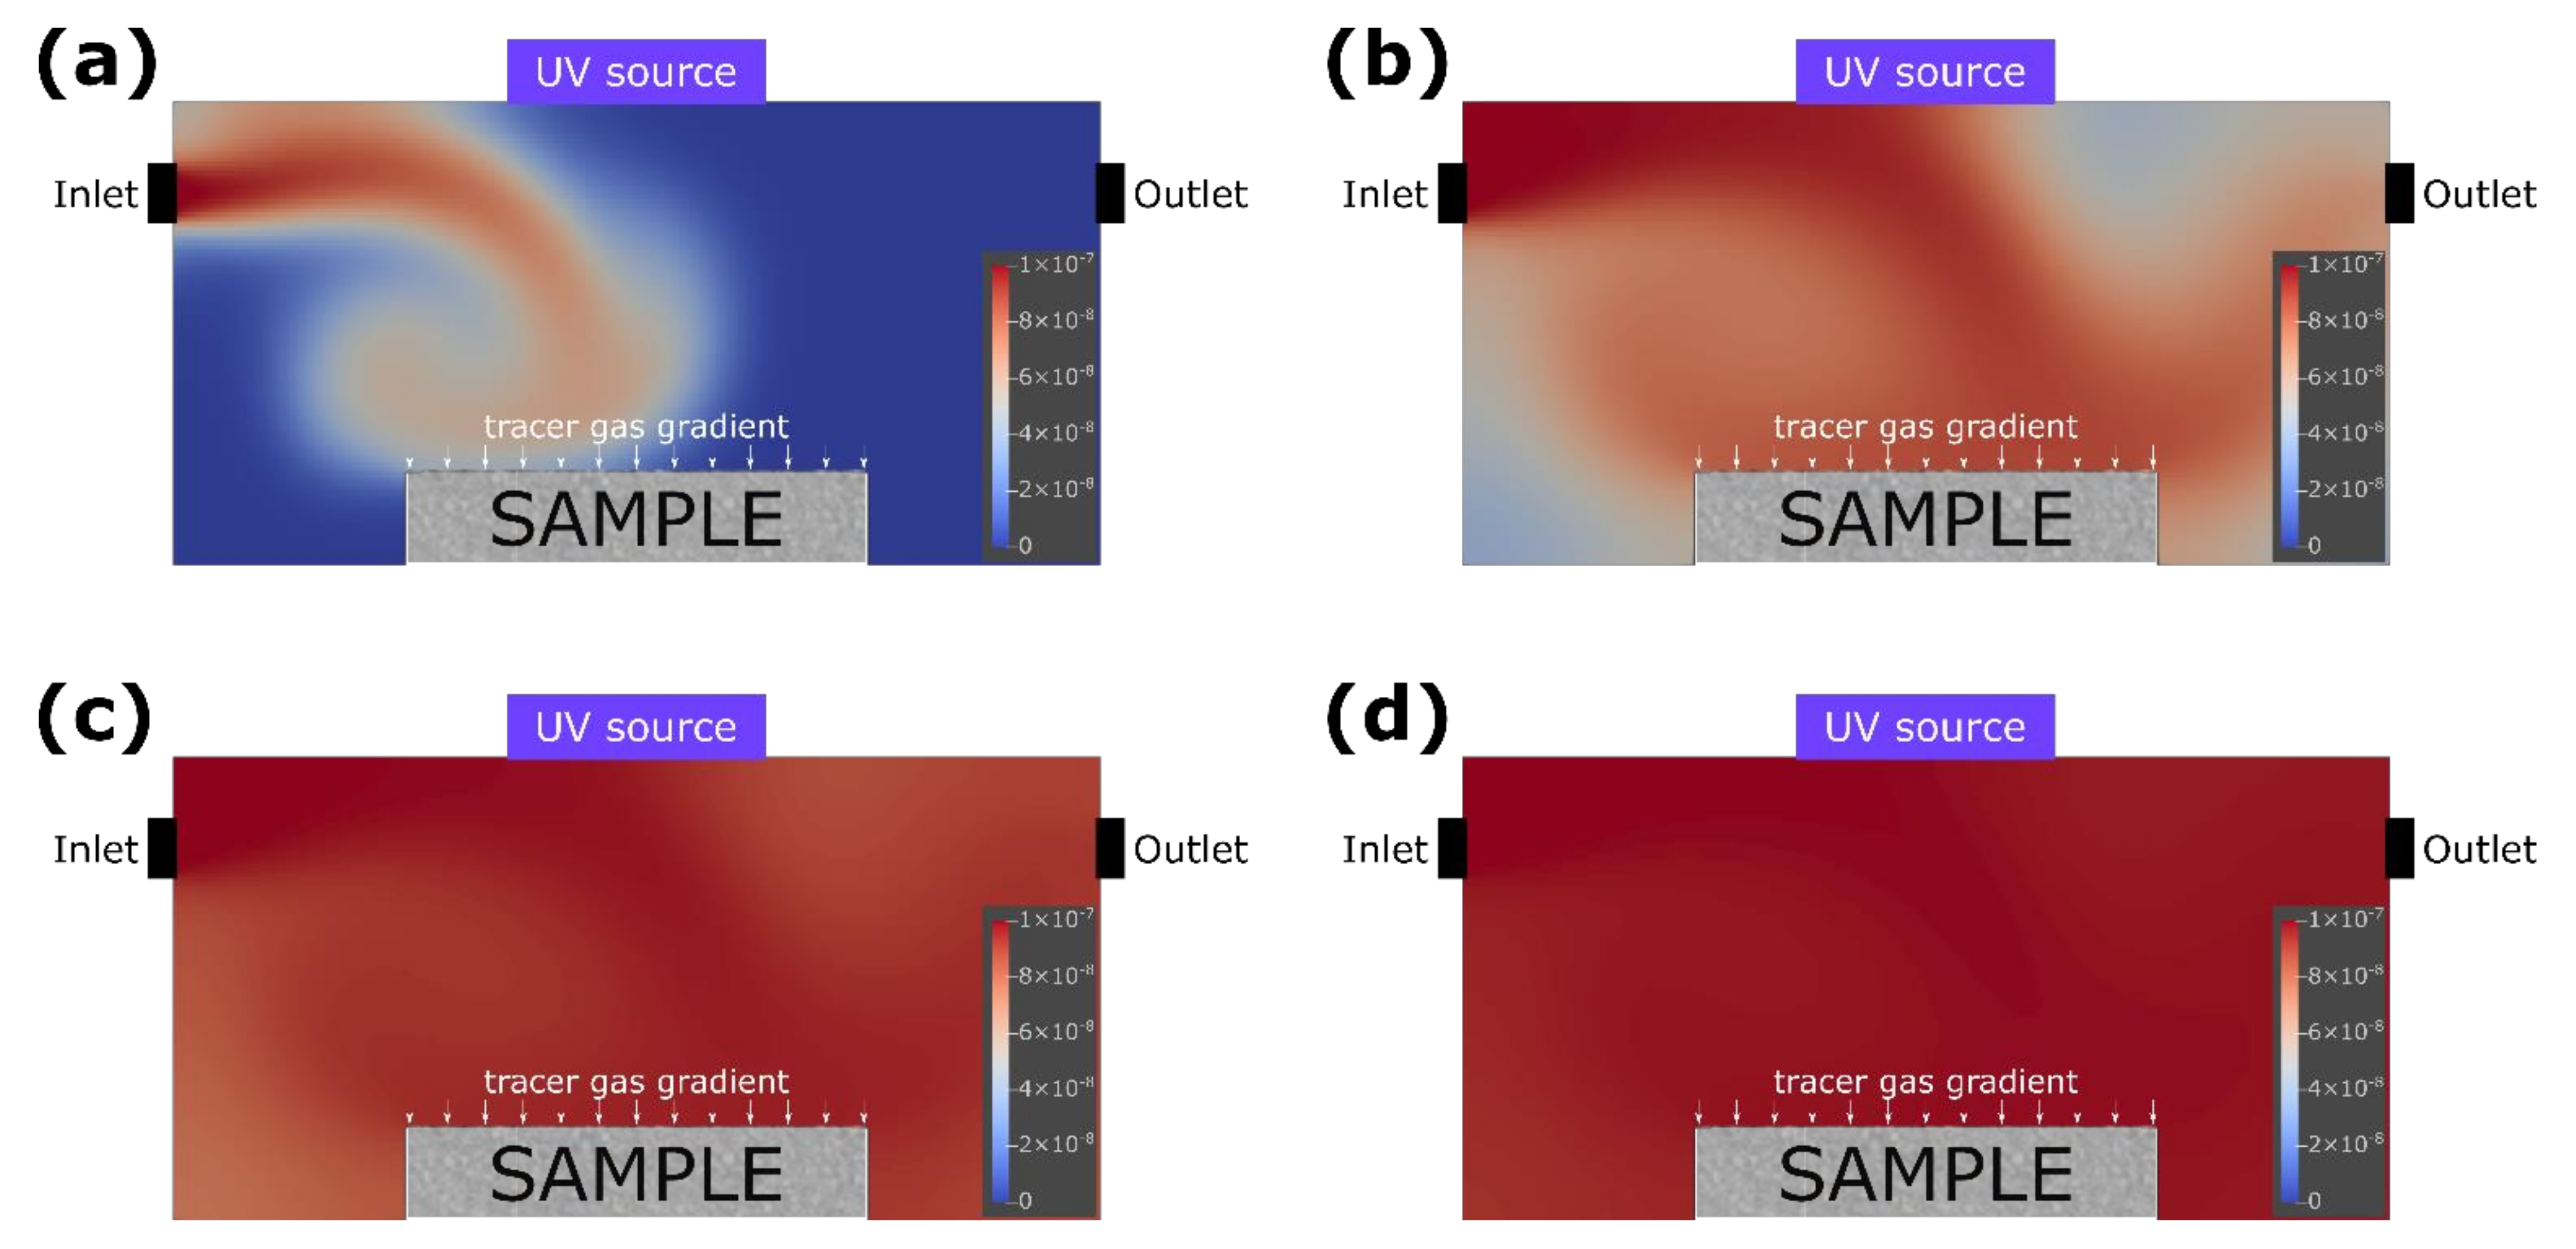
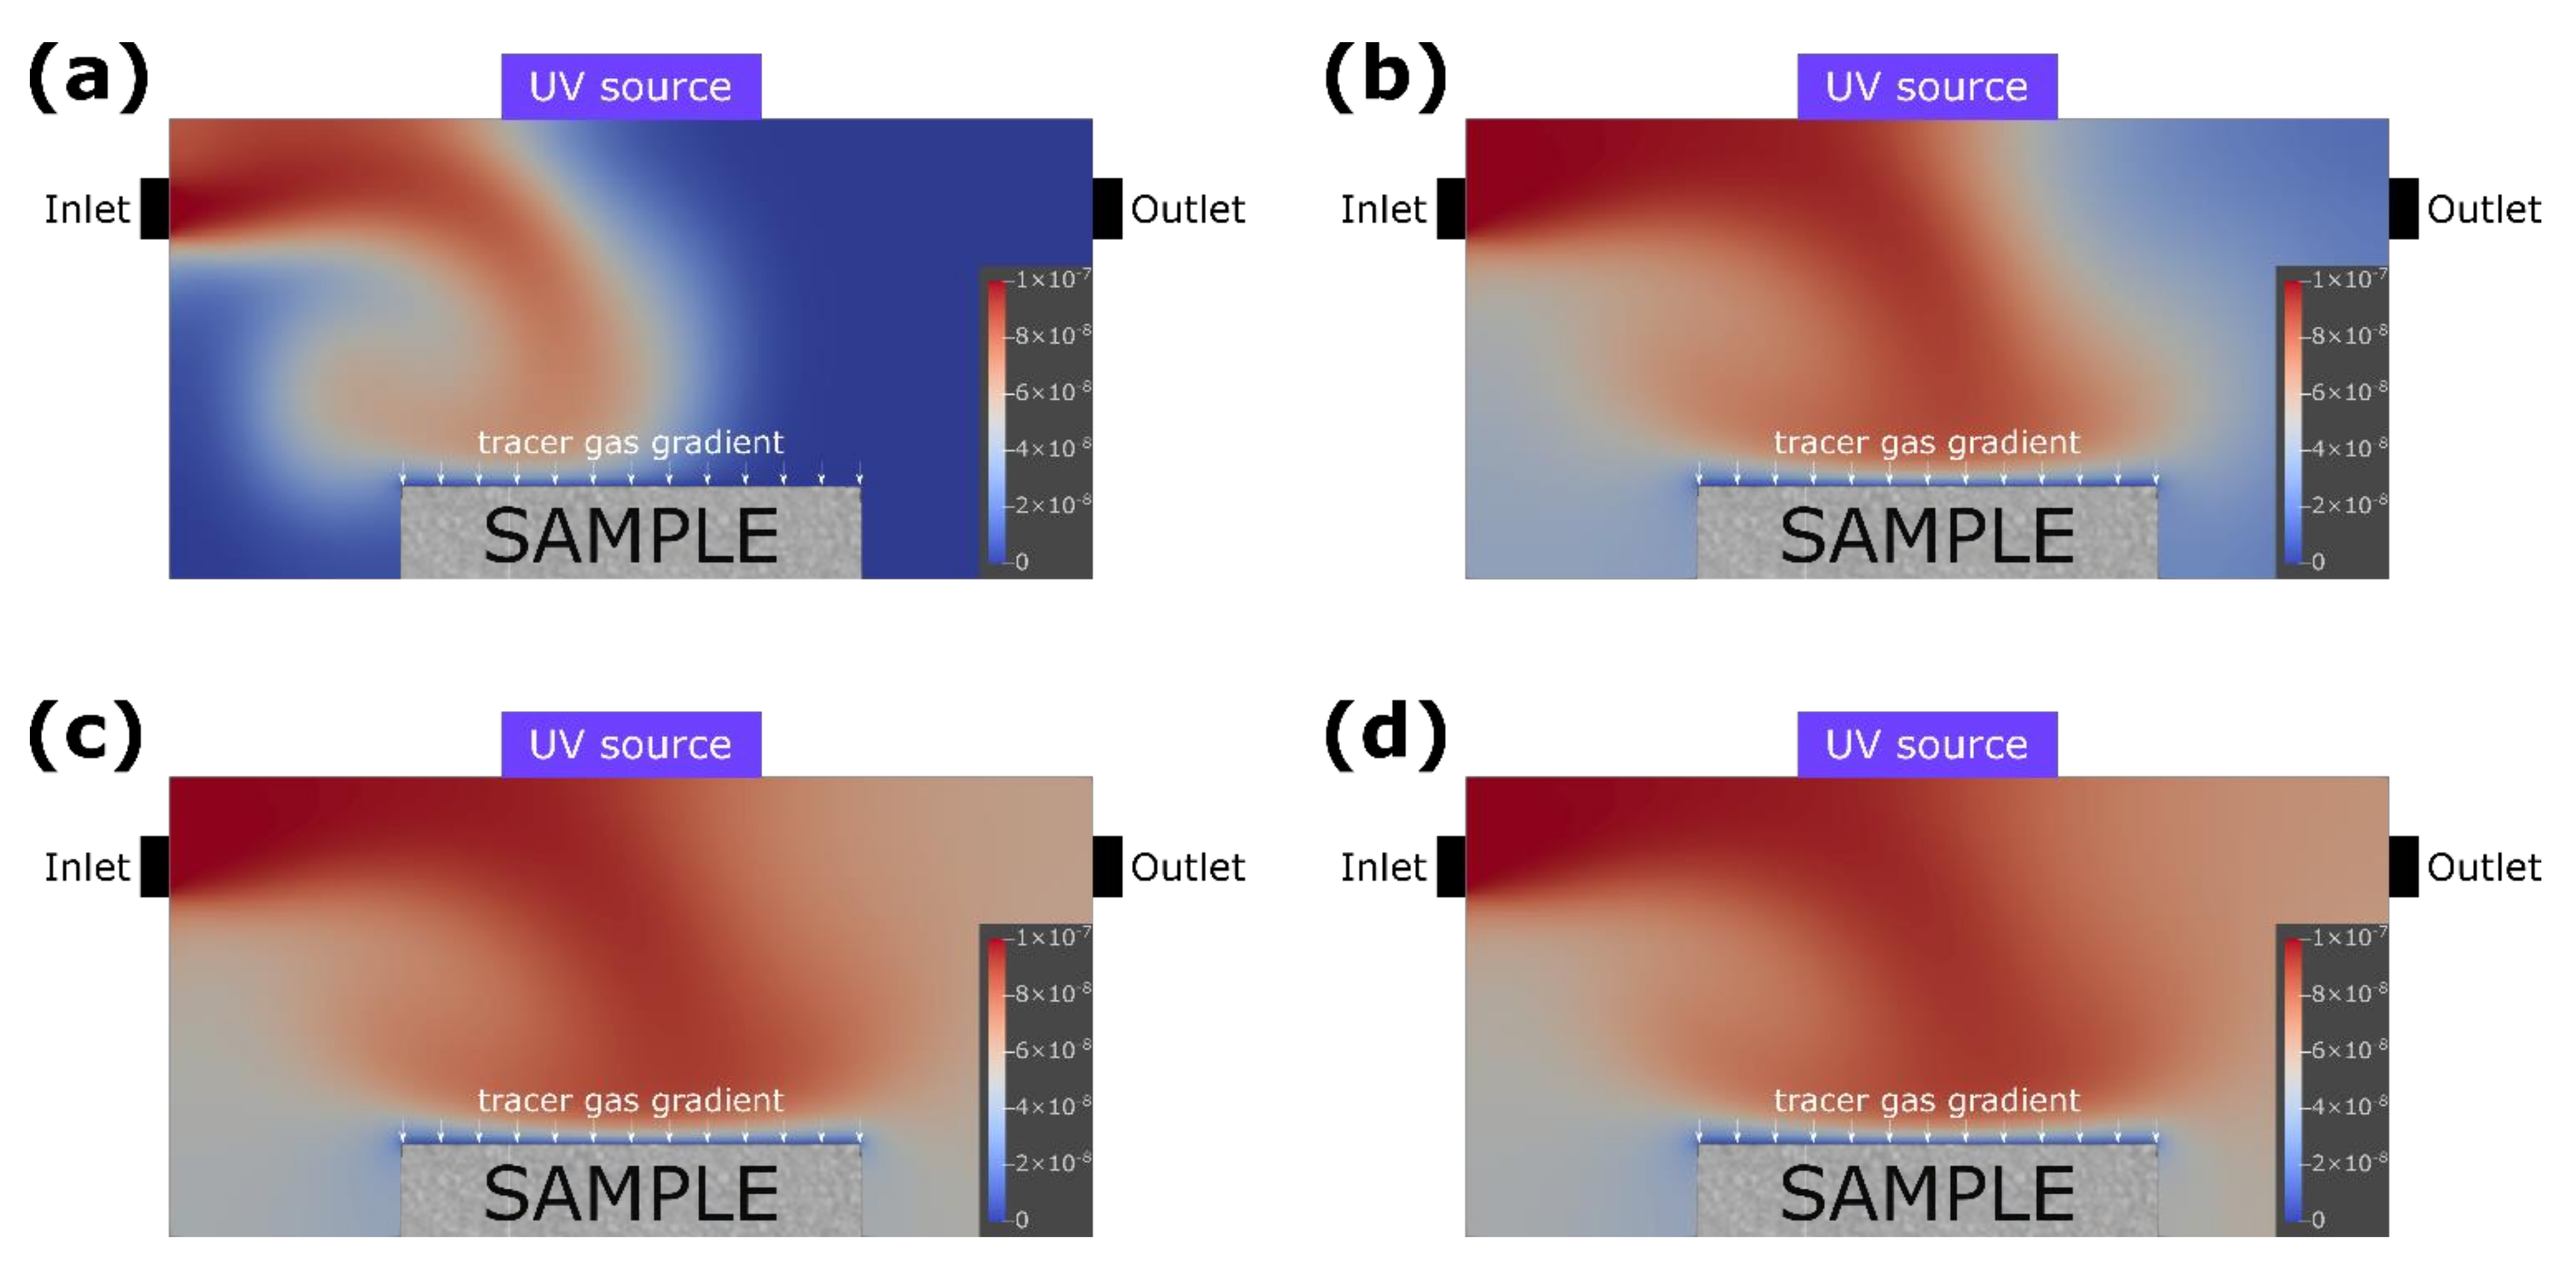
2.2.1. Simulation of Gas Flow in the Reactor
2.2.2. Physical Parameters of the Test
3. Results
3.1. Simulation of the Photocatalysis Process in the Reactor
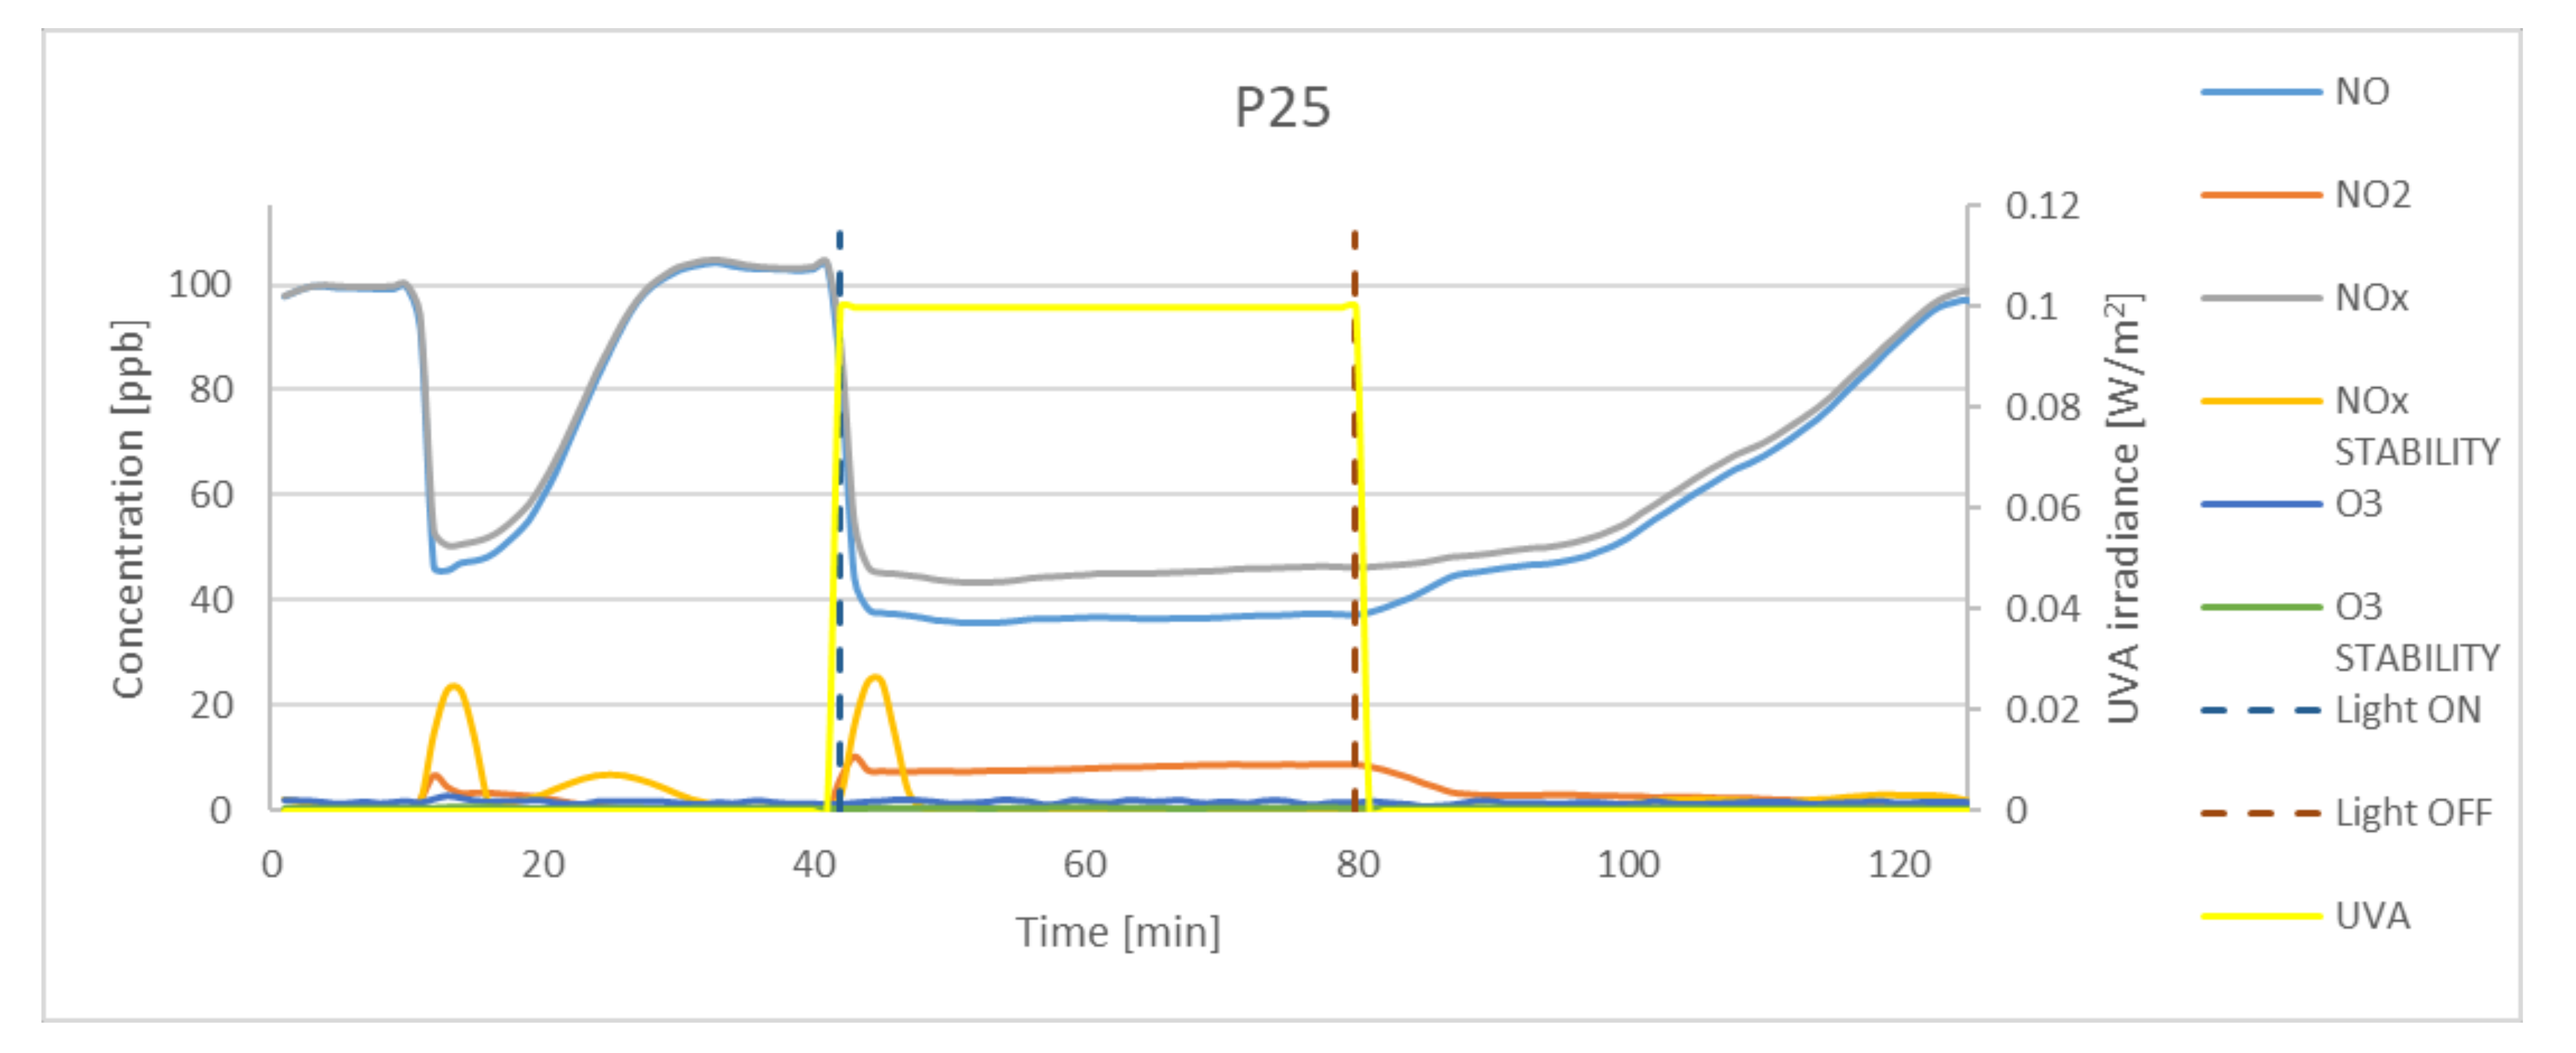
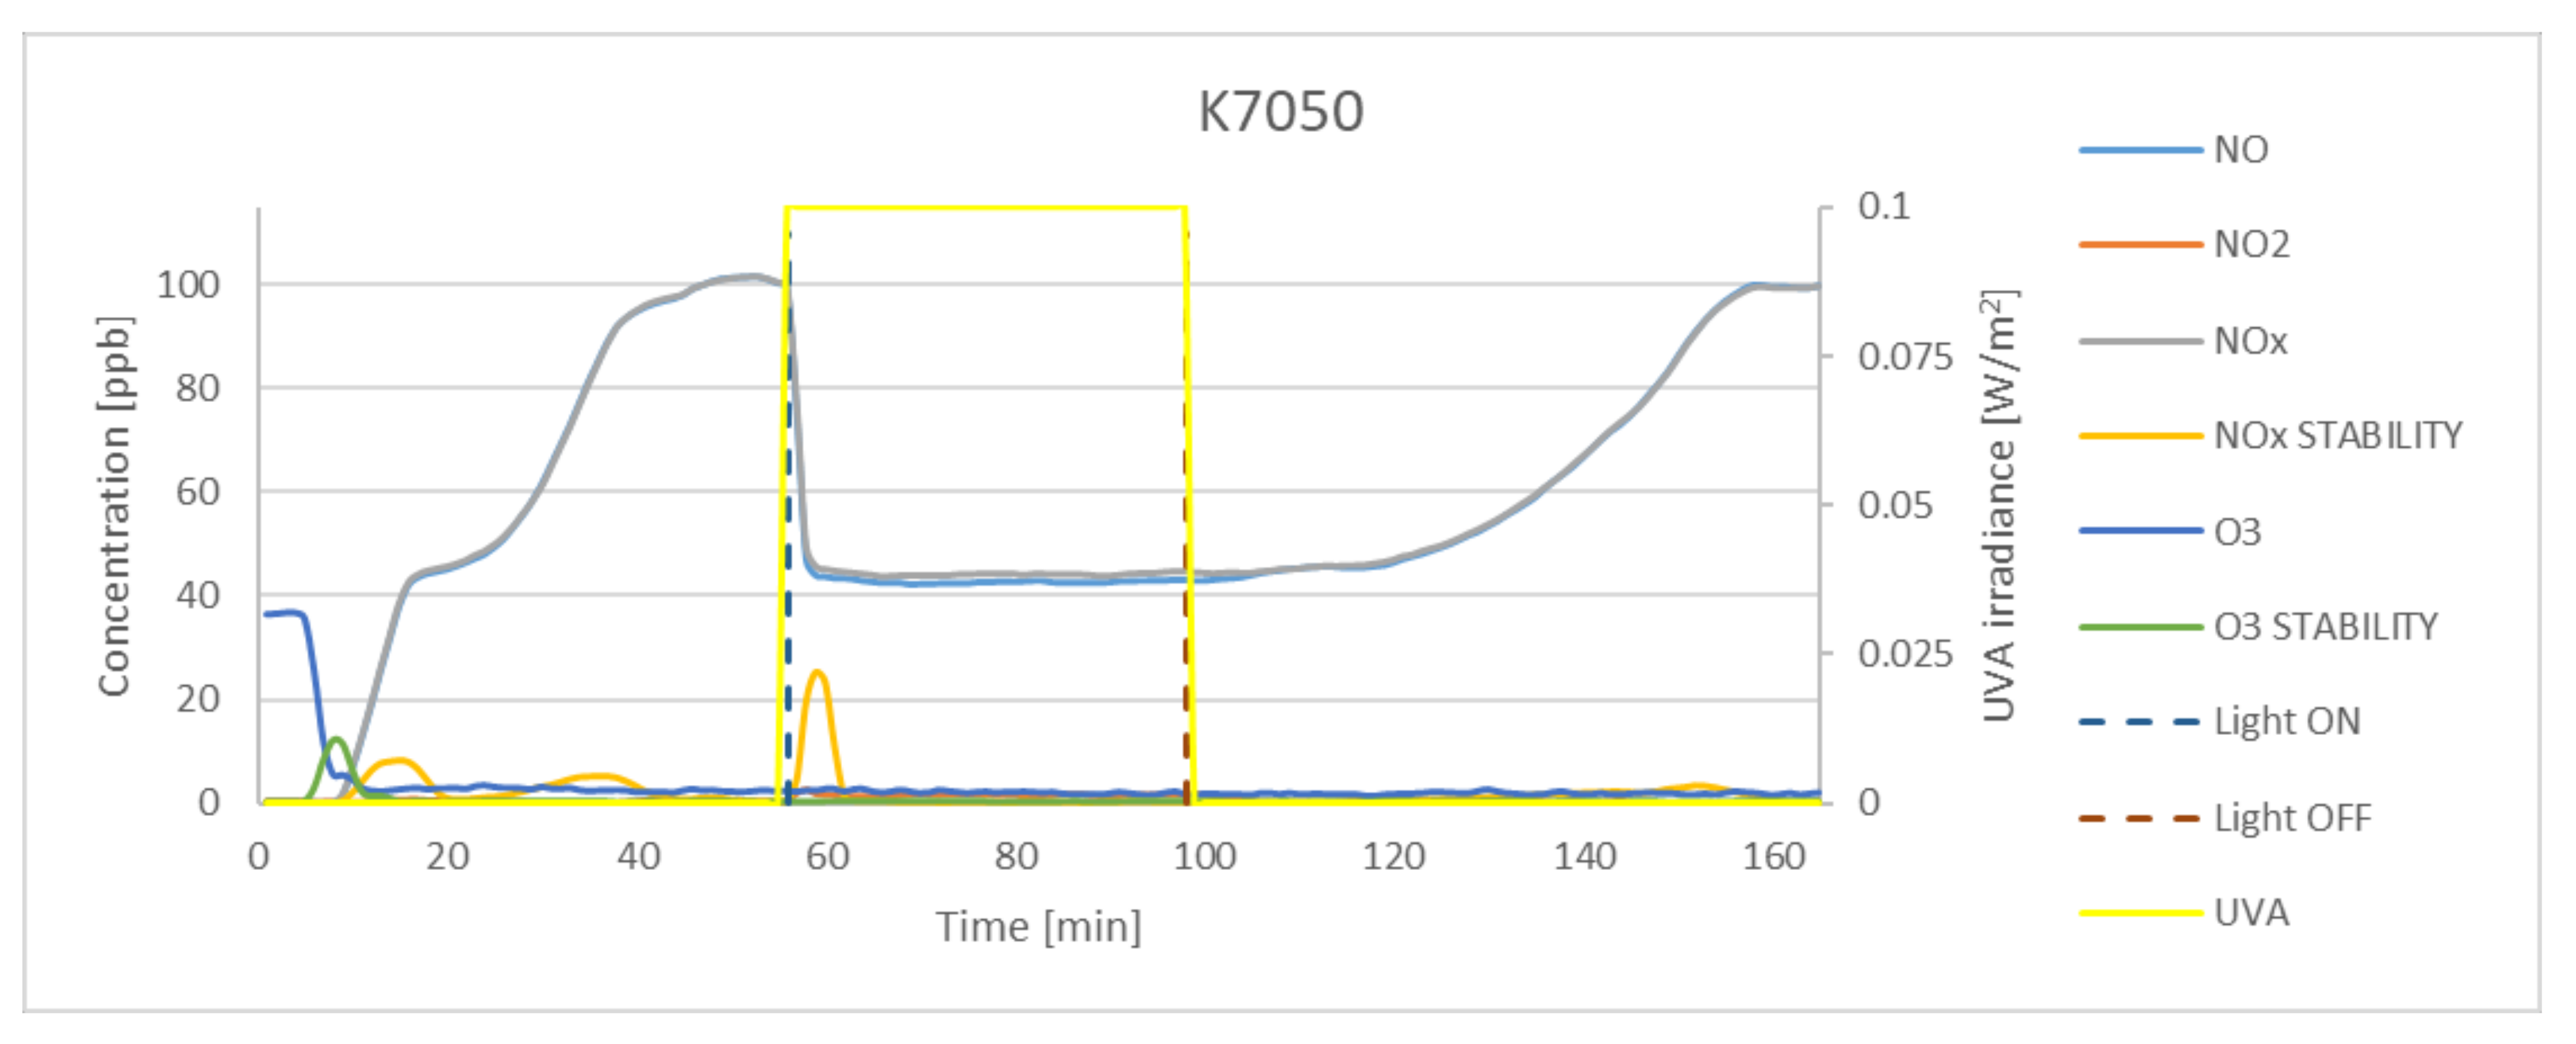
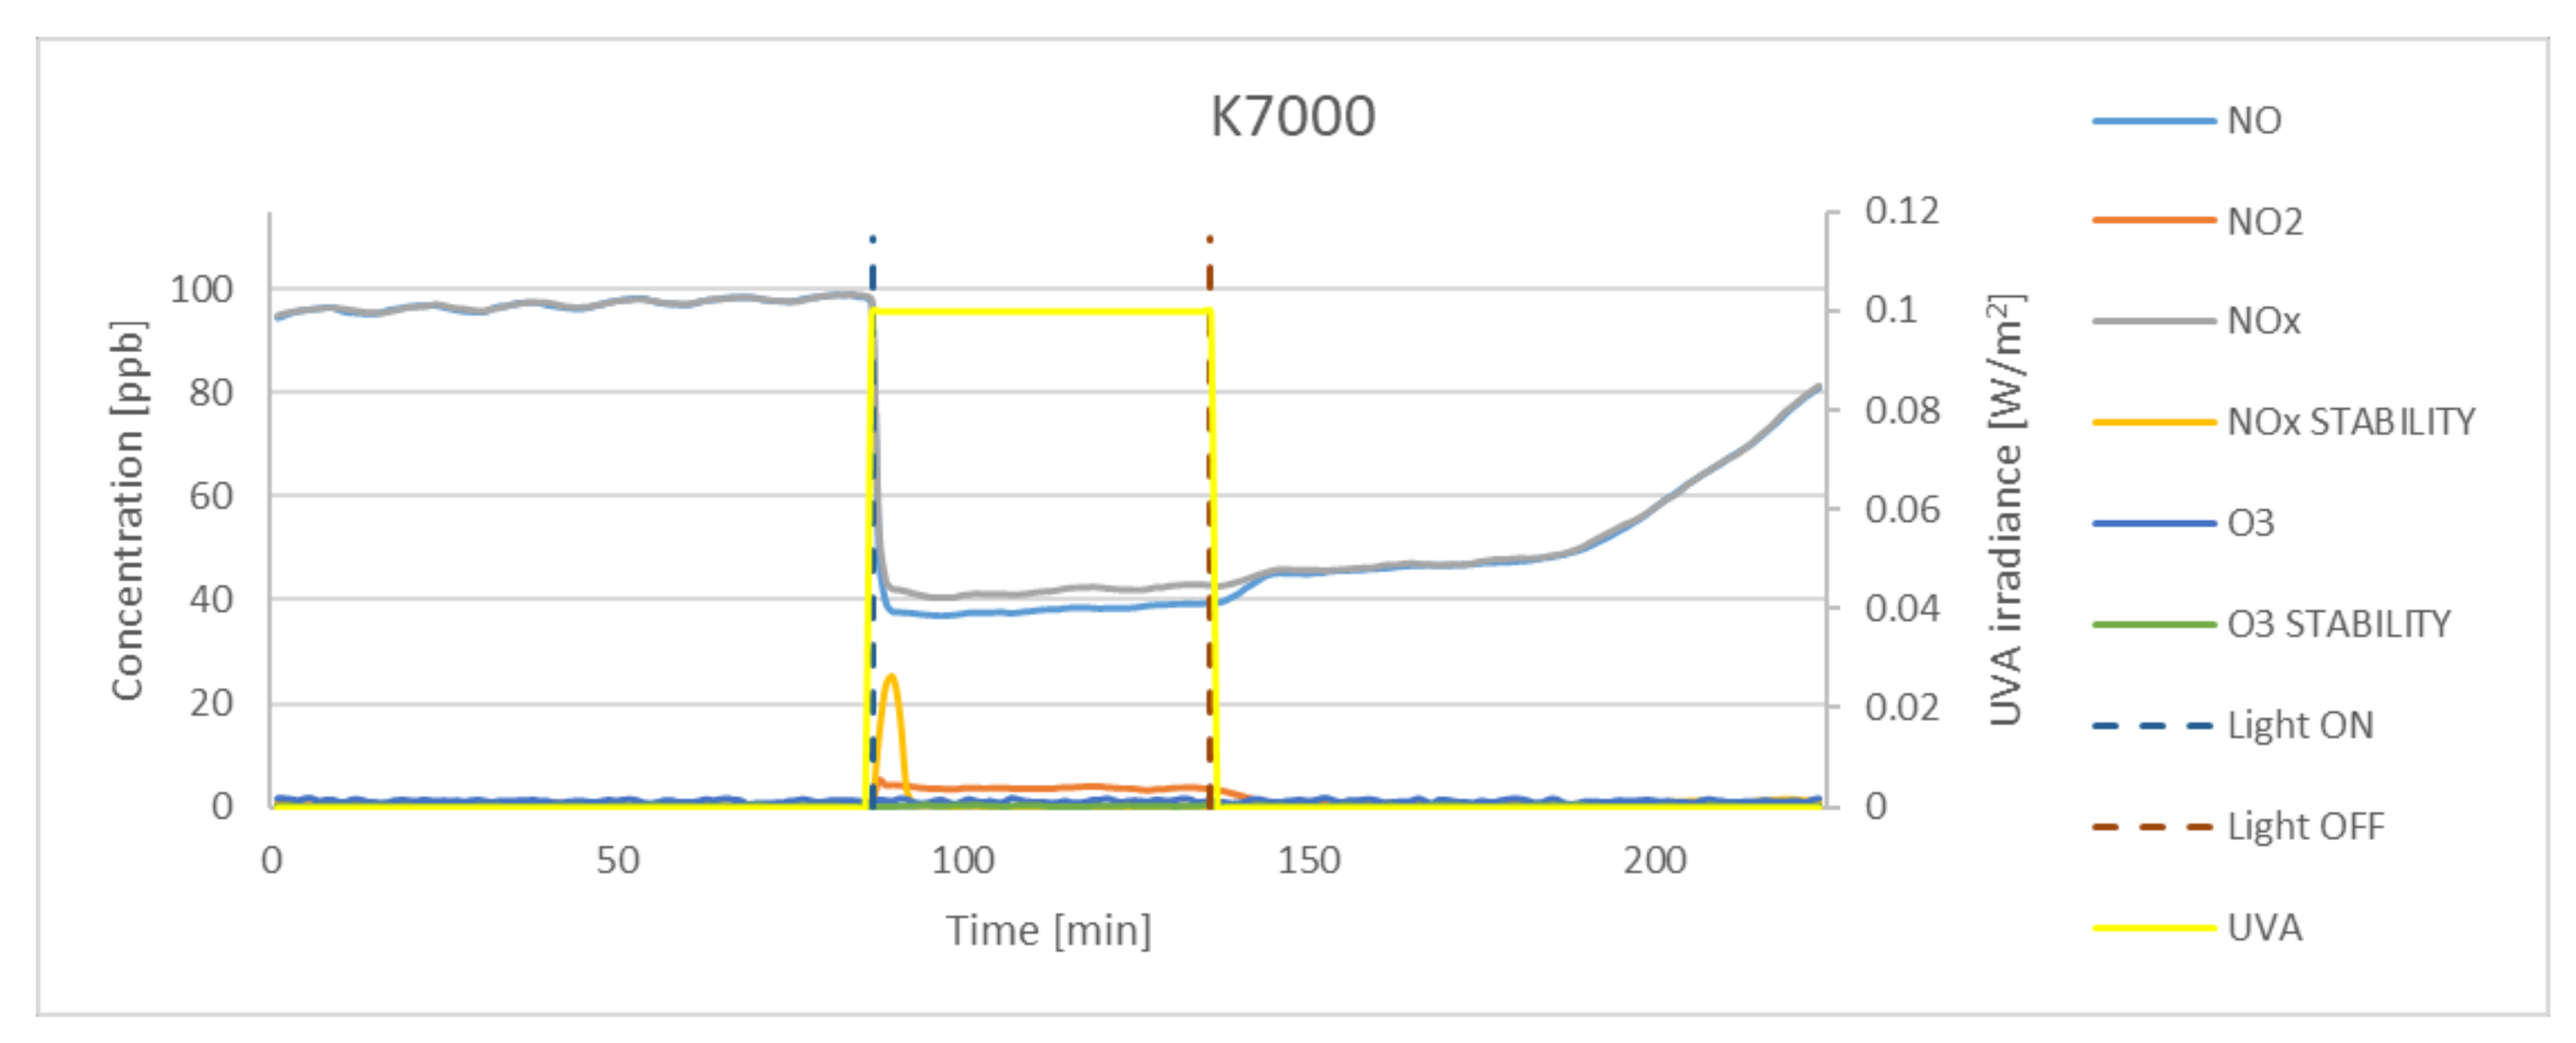
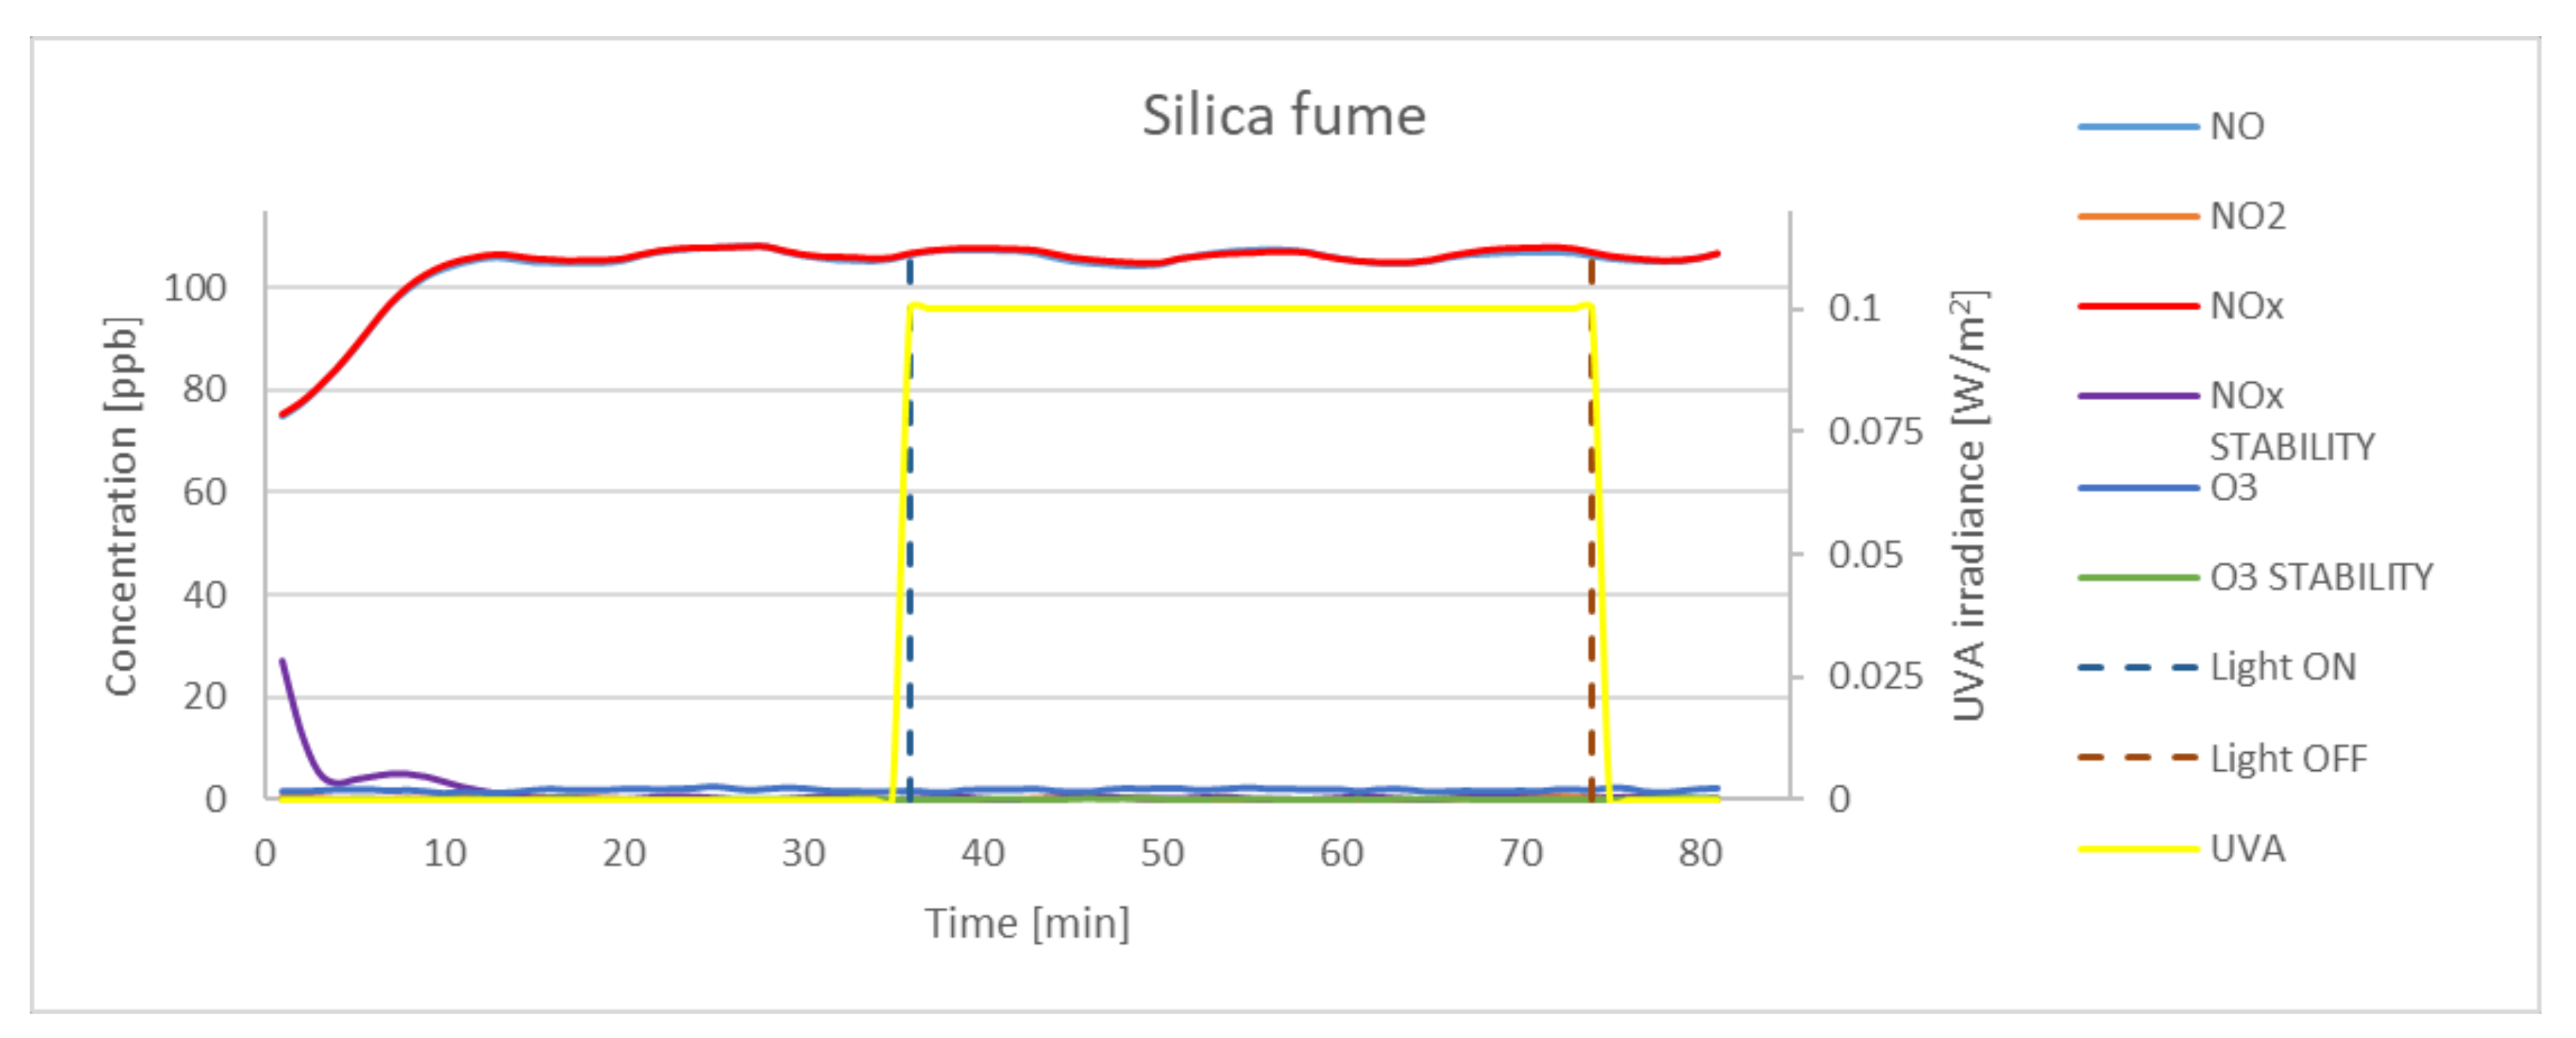
3.2. Effectiveness of NOx Oxidation
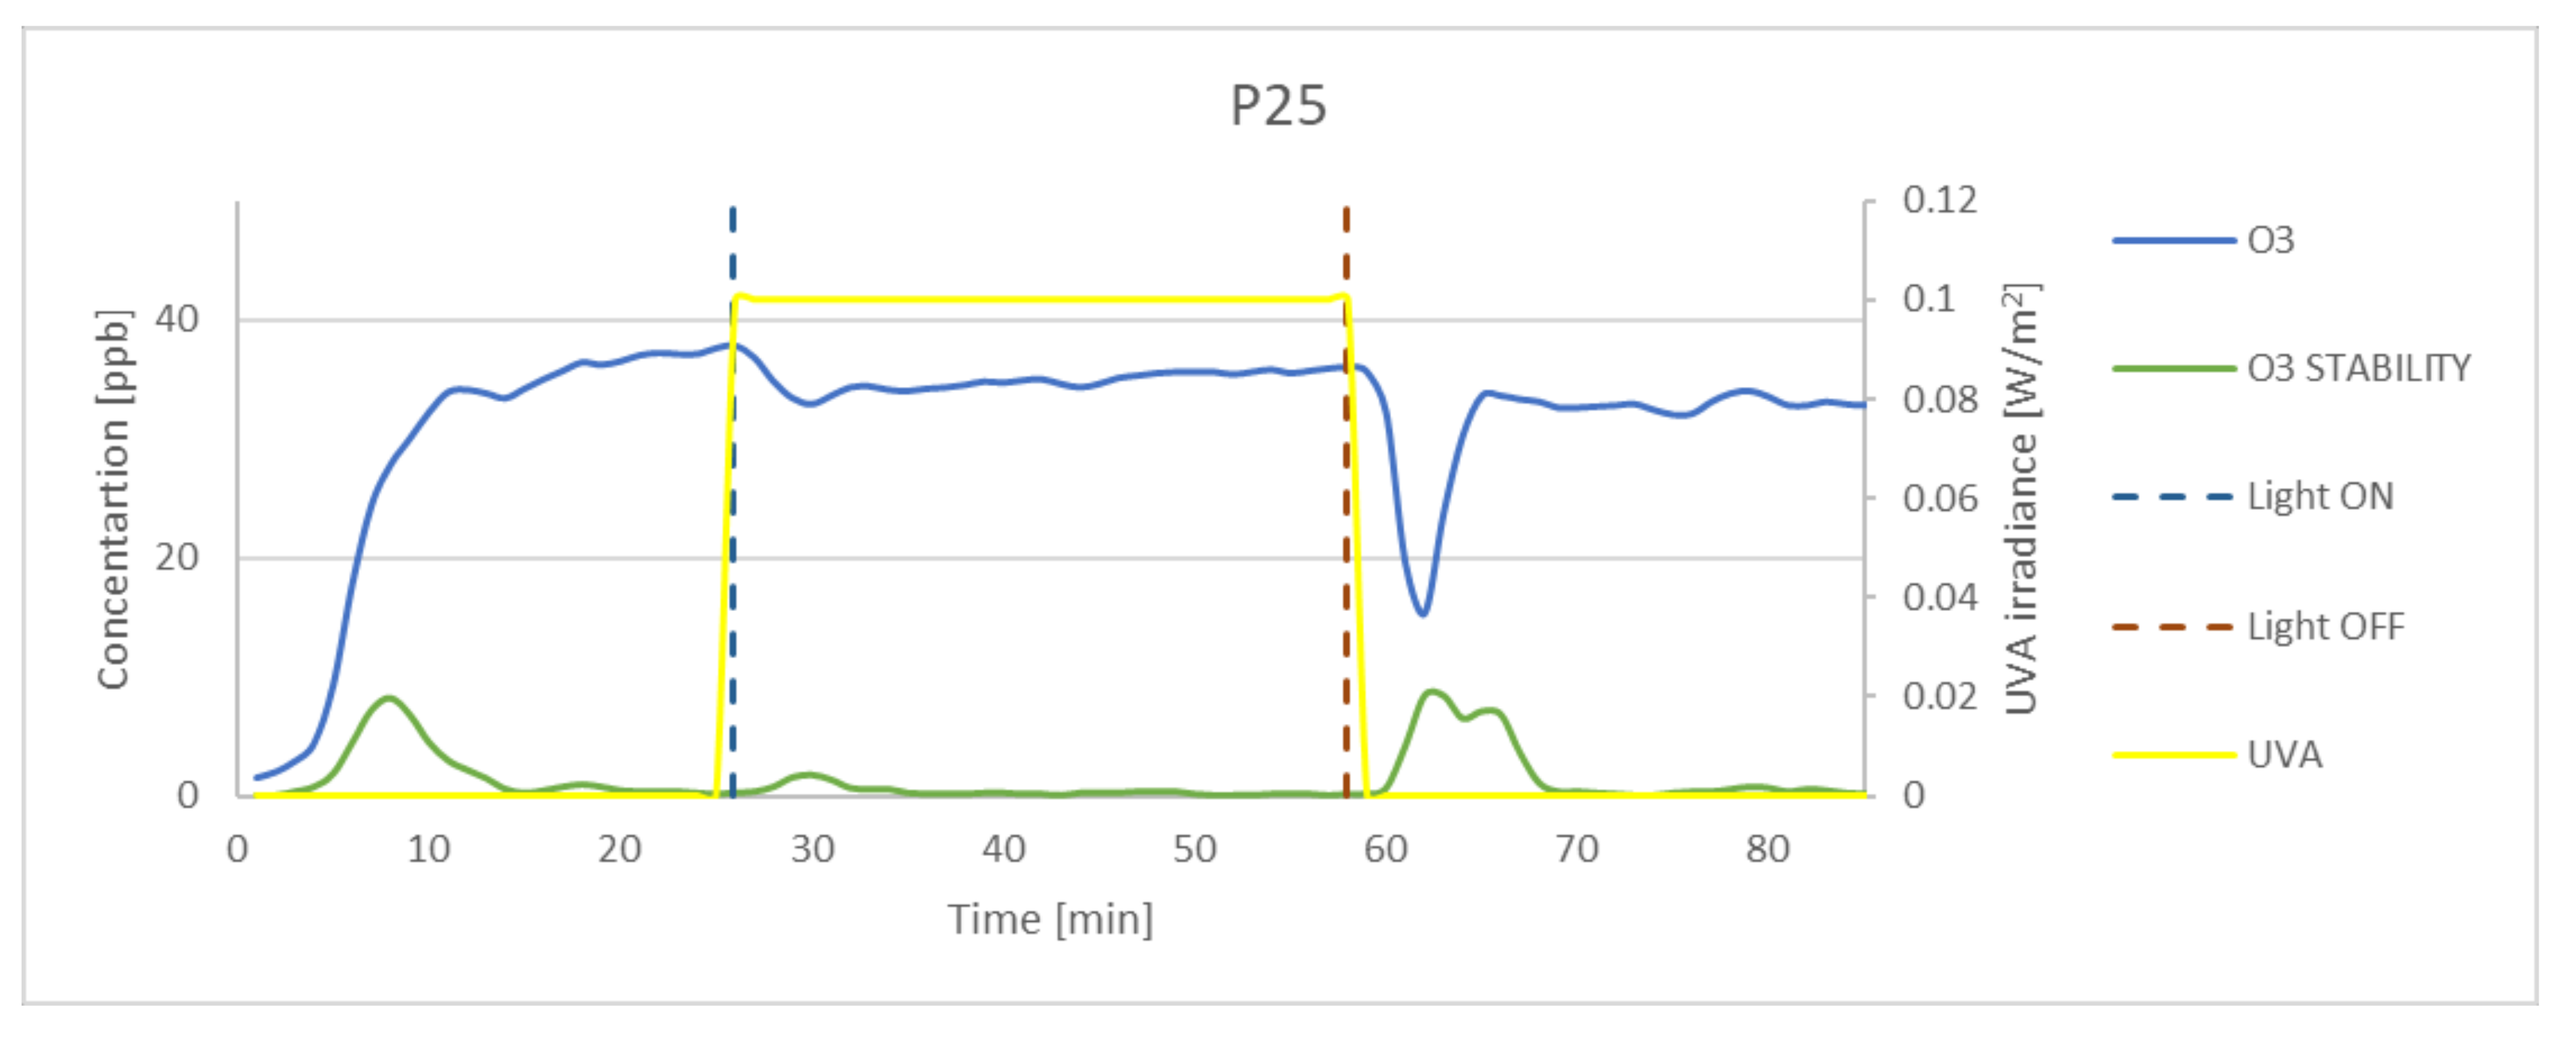
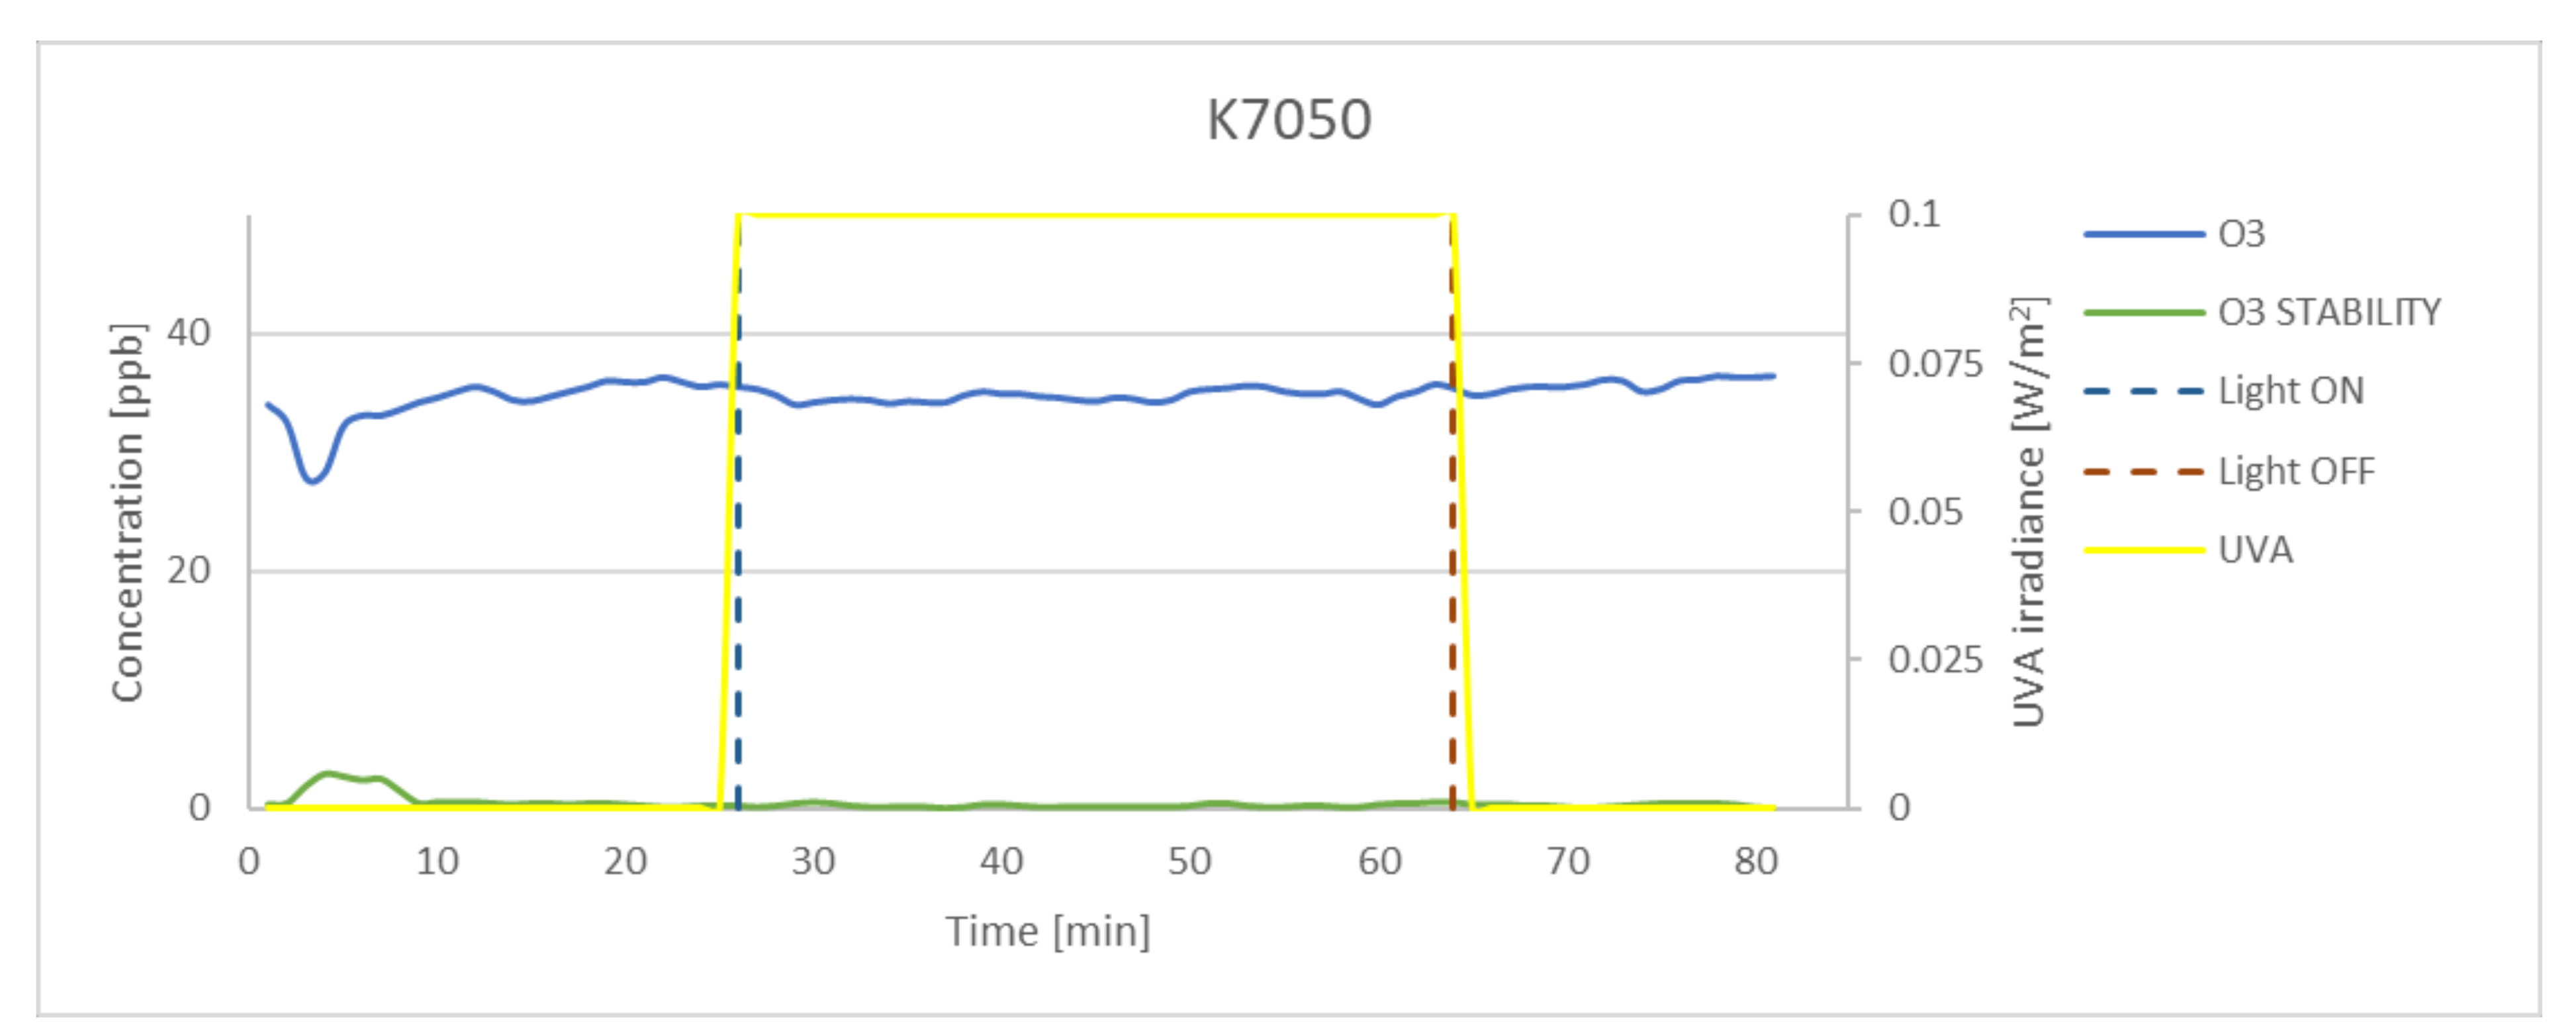
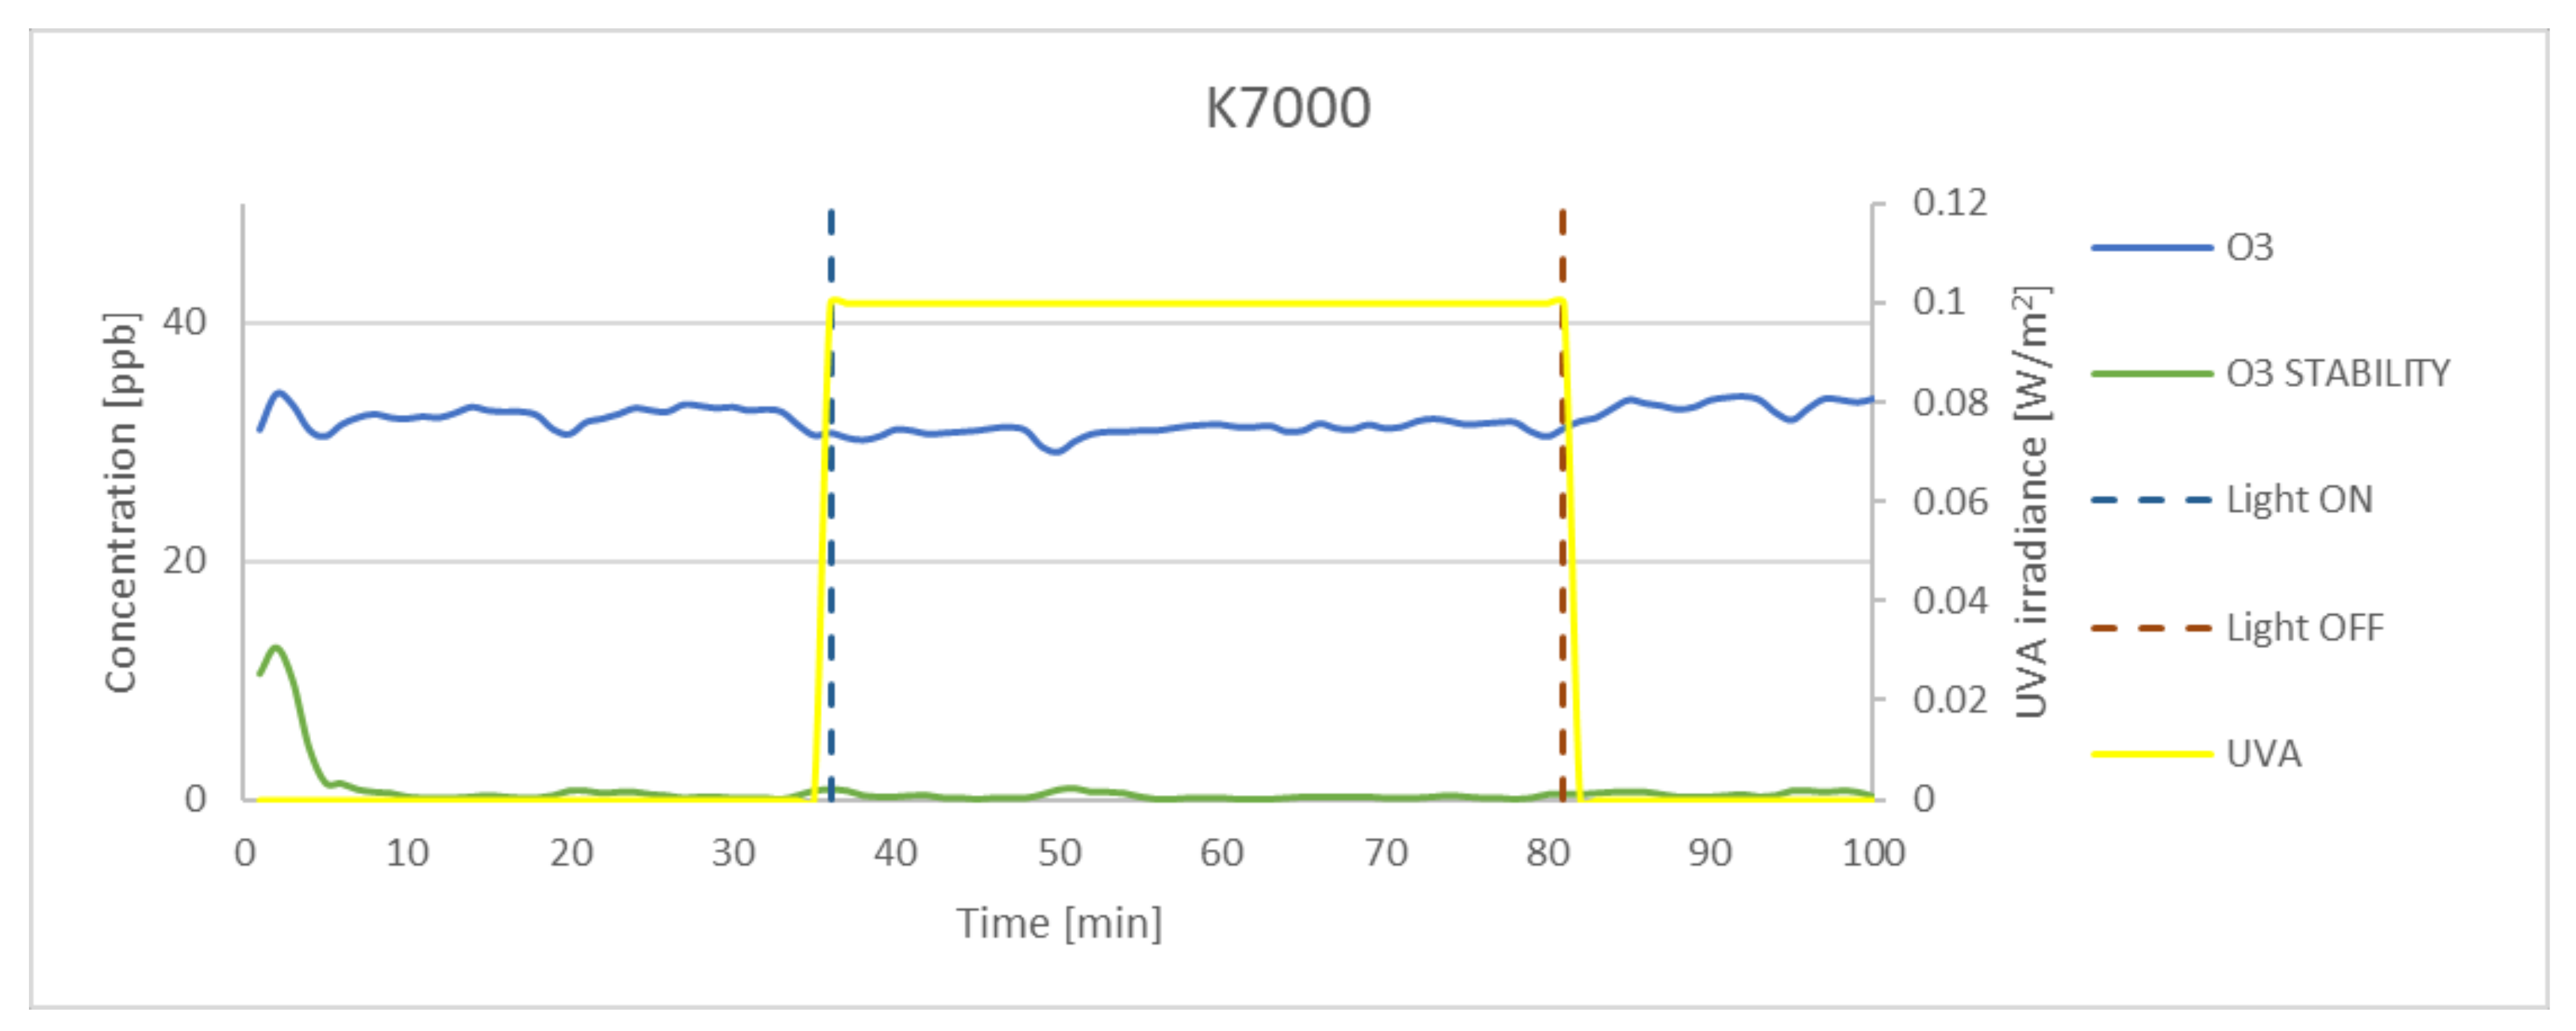
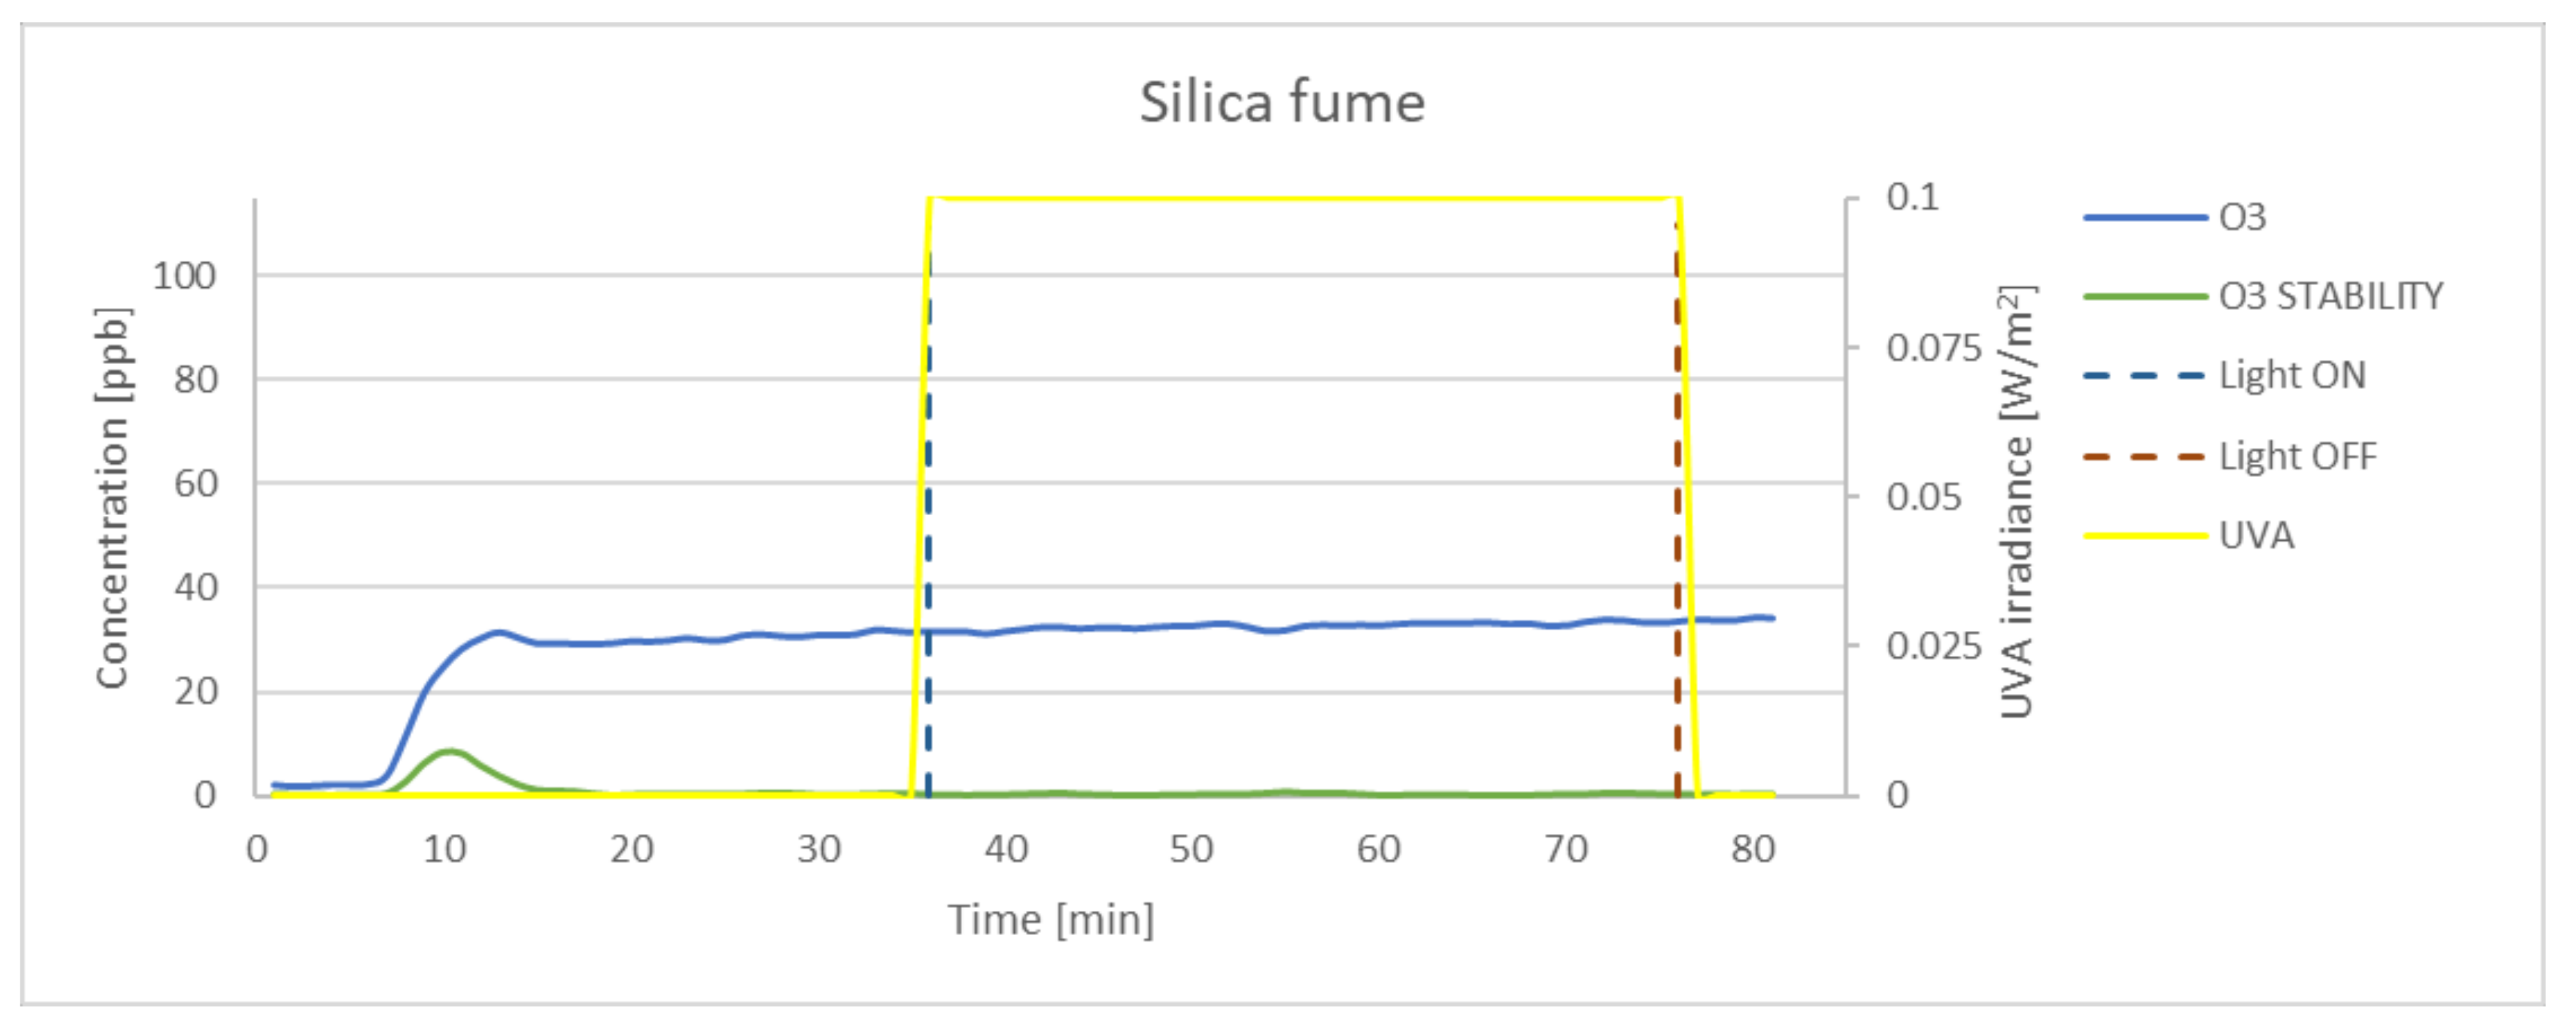
3.3. Effectiveness of O3 Oxidation
4. Discussion
5. Conclusions
Author Contributions
Funding
Institutional Review Board Statement
Informed Consent Statement
Data Availability Statement
Conflicts of Interest
References
- Chen, M.; Liu, Y. NOx removal from vehicle emissions by functionality surface of asphalt road. J. Hazard. Mater. 2010, 174, 375–379. [Google Scholar] [CrossRef] [PubMed]
- Fan, W.; Chan, K.Y.; Zhang, C.; Leung, M.K. Advanced Solar Photocatalytic Asphalt for Removal of Vehicular NOx. Energy Procedia 2017, 143, 811–816. [Google Scholar] [CrossRef]
- Boonen, E.; Beeldens, A. Recent Photocatalytic Applications for Air Purification in Belgium. Coatings 2014, 4, 553–573. [Google Scholar] [CrossRef]
- Guerrini, G.L. Some observations regarding in service performance, Photocatalytic paving block surface. Betonw. Fert.-Tech. 2009, 5, 16–25. [Google Scholar]
- Guerrini, G.L.; Beeldens, A.; Crispino, M.; D’Ambarosio, G.; Vismaro, S. Environmental benefits of innovative photocatalytic cementitious road material. In Proceedings of the 10th International Conference on Concrete Pavement, Quebec, QC, Canada, 8–12 July 2012. [Google Scholar] [CrossRef]
- Maggos, T.; Plassais, A.; Bartzis, J.G.; Vasilakos, C.; Moussiopoulos, N.; Bonafous, L. Photocatalytic degradation of NOx in pilot street canyon configuration using TiO2-mortar panels. Environ. Monit. Assess. 2008, 136, 35–44. [Google Scholar] [CrossRef]
- Kim, Y.K.; Hong, S.J.; Kim, H.B.; Lee, S.W. Evaluation of In-Situ NOx Removal Efficiency of Photocatalytic Concrete in Expressways. KSCE J. Civ. Eng. 2018, 22, 2274–2280. [Google Scholar] [CrossRef]
- Bertron, T.M.A.; Ringot, E.; Escadillas, G. Degradation of NO using photocatalytic coatings applied to different substrates. Build. Environ. 2011, 46, 1808–1816. [Google Scholar] [CrossRef]
- Martinez, T.; Dompoint, D.; Bertron, A.; Escadeillas, G.; Ringot, E. Photocatalytic coatings for building materials: Degradation of NOx and inhibition of algal growth. Int. J. 3Rs 2013, 4, 520–533. [Google Scholar]
- Georeg, C.; Beeldens, A.; Barmapss, F.; Doussin, J.-F.; Manganelli, G.; Herrmann, H.; Kleffmann, J.; Mellouki, A. Impact of photocatalytic remediation of pollutants on urban air quality. Front. Environ. Sci. Eng. 2016, 10, 2. [Google Scholar] [CrossRef]
- Guerrini, G.L. Photocatalytic performance in a city tunnel in Rome: NOx monitoring results. Constr. Build. Mater. 2021, 27, 165–175. [Google Scholar] [CrossRef]
- Boonen, E.; Akylas, V.; Barmpas, F.; Boréave, A.; Bottalico, L.; Cazaunau, M.; Chen, H.; Daële, V.; de Marco, T.; Doussin, J.F.; et al. Construction of a photocatalytic de-polluting field site in the Leopold II tunnel in Brussels. J. Environ. Manag. 2015, 155, 136–144. [Google Scholar] [CrossRef]
- Kazachenko, A.S.; Vasilieva, N.Y.; Fetisova, O.Y.; Sychev, V.V.; Elsuf’ev, E.V.; Malyar, Y.N.; Issaoui, N.; Miroshnikova, A.V.; Borovkova, V.S.; Kazachenko, A.S.; et al. New reactions of betulin with sulfamic acid and ammonium sulfamate in the presence of solid catalysts. Biomass Conv. Bioref. 2022. [CrossRef]
- Ibhadon, A.O.; Fitzpatrick, P. Heterogenous Photocatalysis: Recent Advances and Applications. Catalysts 2013, 3, 189–218. [Google Scholar] [CrossRef]
- Chen, J.; Poon, C.S. Photocatalytic construction and building materials: From fundamentals to application. Build. Environ. 2009, 44, 1899–1906. [Google Scholar] [CrossRef]
- Ren, X.; Ou, Z.; Wu, B. Low–Temperature Selective Catalytic Reduction DeNOx and Regeneration of Mn–Cu Catalyst Supported by Activated Coke. Materials 2021, 14, 5958. [Google Scholar] [CrossRef]
- Urbanas, D.; Baltrenaite–Gediene, E. Selective Catalytic Reduction of NO by NH3 over Mn–Cu Oxide Catalysts Supported by Highly Porous Silica Gel Powder: Comparative Investigation of Six Different Preparation Methods. Catalysts 2021, 11, 702. [Google Scholar] [CrossRef]
- Yu, B.; Liu, Q.; Yang, H.; Li, Q.; Lu, H.; Yang, L.; Liu, F. Selective Catalytic Removal of High Concentrations of Nox at Low Temperature. Energies 2022, 15, 5433. [Google Scholar] [CrossRef]
- Jang, J.; Ahn, S.; Na, S.; Koo, J.; Roh, H.; Choi, G. Effect of Plasma Burner on NOx Reduction and Catalyst Regeneration in a Marine SCR System. Energies 2022, 15, 4306. [Google Scholar] [CrossRef]
- Fujishima, A.; Honda, K. Electrochemical Photolysis of Water at a Semiconductor Electrode. Nature 1972, 238, 37–38. [Google Scholar] [CrossRef]
- Fujishima, A.; Zhang, X. Titanum dioxide photocatalysis: Present situation and future approaches. C. R. Chim. 2005, 9, 750–760. [Google Scholar] [CrossRef]
- ISO 22197-1:2016; Fine Ceramics (Advanced Ceramics, Advanced Technical Ceramics)–Test Method for Air-Purification Performance of Semiconducting Photocatalytic Materials–Part 1: Removal of Nitric Oxide. ISO: Geneva, Switzerland, 2016.
- UNI-11247:2010; Determination of the Degradation of Nitrogen Oxides in the Air by Inorganic Photocatalytic Materials: Continuous Flow Test Method. Ente Nazionale Italiano di Unificazione: Milano, Italy, 2010; (Italian Standard).
- JIS TRZ0018; Photocatalytic Materials–Air Purification Test Procedure. Japanese Standards Association: Tokio, Japan, 2002; (Japan Standard).
- Hassan, M.; Asce, M.; Mohammad, L.; Asadi, S.; Dylla, H.; Cooper, S. Sustainable Photocatalytic Asphalt Pavements for Mitigation of Nitrogen Oxide and Sulfur Dioxide Vehicle Emissions. J. Mater. Civ. Eng. 2012, 25, 365–371. [Google Scholar] [CrossRef]
- Asadi, S.; Hassan, M.; Kvern, J.; Rupnow, T. Development of Photocatalytic Previous Concrete Pavement for Air and Storm Water Iprovements. Transp. Res. Rec. 2012, 2290, 161–167. [Google Scholar] [CrossRef]
- Martinez, T.; Berton, A.; Escadeilleas, G.; Ringot, E.; Simon, V. BTEX abatement by photocatalytic TiO2-bearing coatings applied to cement mortars. Build. Environ. 2014, 71, 186–192. [Google Scholar] [CrossRef]
- Husken, G.; Hubger, M.; Brouwers, H.J.H. Experimental study of photocatalytic concrete products for air purification. Build. Environ. 2009, 44, 2463–2474. [Google Scholar] [CrossRef]
- Russell, H.S.; Frederickson, L.B.; Hertel, O.; Ellermann, T.; Jensen, S. A Review of Photocatalytic Materials for Urban NOx Remediation. Catalysts 2021, 11, 675. [Google Scholar] [CrossRef]
- Zouzelka, R.; Rathousky, J. Photocatalytic abatement of NOx pollutants in the air using commercial functional coating with porous morphology. Appl. Catal. B Environ. 2017, 217, 466–476. [Google Scholar] [CrossRef]
- Angelo, J.; Andrade, L.; Madeira, L.M.; Mendes, A. An Overview of photocatalysis phenomena applied to NOx abatement. J. Environ. Manag. 2013, 129, 522–539. [Google Scholar] [CrossRef]
- Ahmad, R.; Ahmad, Z.; Khan, A.U.; Mastoi, N.R.; Aslam, M.; Kim, J. Photocatalytic systems as an advanced environmental remediation: Recent developments, limitations and new avenues for applications. J. Environ. Chem. Eng. 2016, 4, 4143–4164. [Google Scholar] [CrossRef]
- Bloh, J.Z.; Folli, A.; Macphee, D.E. Photocatalytic NOx abatement: Why the selectivity matters. RSC Adv. 2014, 4, 5726–45734. [Google Scholar] [CrossRef]
- Folli, A.; Macphee, D.E. Future challenges for photocatalytic concrete technology. In Proceedings of the 34th Cement and Concrete Science Conference, University of Sheffield, Sheffield, UK, 14–17 September 2014. [Google Scholar]
- Namdari, M.; Lee, C.S.; Haghighat, F. Active ozone removal technologies for a safe indoor environment: A comprehensive review. Build. Environ. 2021, 187, 107370. [Google Scholar] [CrossRef]
- Soares, A.K.; Silva, C. Review of Ground–Level Ozone Impact in Respiratory Health Deterioration for the Past Two Decades. Atmosphere 2022, 13, 434. [Google Scholar] [CrossRef]
- Cho, K.; Hwang, K.C.; Sano, T.; Takeuchi, K.; Matsuzawa, S. Photocatalytic performance of PT–loaded TiO2 in the decomposition of gaseous ozone. J. Photochem. Photobiol. A Chem. 2004, 161, 155–166. [Google Scholar] [CrossRef]
- Guo, Z.; Huang, C.; Chen, Y. Experimental study on photocatalytic degradation efficiency of mixed crystal nano-TiO2 concrete. Nanotechnol. Rev. 2020, 9, 219–229. [Google Scholar] [CrossRef]
- Pierpaoli, M.; Favoni, O.; Fava, G.; Ruello, M.L. A Novel Method for the Combined Photocatalytic Activity Determination and Bandgaps Estimation. Methods Protoc. 2018, 1, 22. [Google Scholar] [CrossRef]
- Witkowski, H.; Rek, W.J.; Chilmon, K.; Jarosławski, J.; Tryfon–Bojarska, A.; Gąsiński, A. Air Purification Performance of Photocatalytic Concrete Paving Blocks after Seven Years of Service. Appl. Sci. 2019, 9, 1735. [Google Scholar] [CrossRef]
- Kim, M.; Park, H.K.J. Empirical NOx Removal Analysis of Photocatalytic Construction Materials at Real–Scale. Materials 2021, 14, 5717. [Google Scholar] [CrossRef]
- Boonen, E.; Beeldens, A. Photocatalytic roads: Form lab tests to real scale applications. Eur. Transp. Res. Rev. 2013, 5, 79–89. [Google Scholar] [CrossRef]
- Yang, L.; Hakki, A.; Wang, F.; Macphee, D.E. Photocatalyst efficiencies in concrete technology: The effect of photocatalyst placement. Appl. Catal. B Environ. 2018, 222, 200–208. [Google Scholar] [CrossRef]
- UNECE. Annual Air Quality Assessment in the Mazovia District; Report for 2017; District Inspectorate for Environmental Protection in Warsaw: Warsaw, Poland, 2018. (In Polish) [Google Scholar]
- Ding, Z.; Lu, G.Q.; Greenfield, P.F. Role of the Crystallite Phase of TiO2 in Heterogeneous Photocatalysis for Phenol Oxidation in Water. J. Phys. Chem. B 2000, 104, 4815–4820. [Google Scholar] [CrossRef]
- Van der Meulen, T.; Matson, A.; Österlund, L. A comparative study of the photocatalytic oxidation of propane on anatase, rutile, and mixed phase anatase rutile TiO2 nanoparticles: Role of surface intermediates. J. Catal. 2007, 251, 131–144. [Google Scholar] [CrossRef]
- Ohno, T.; Tokieda, K.; Higashida, S.; Matsumura, M. Synergism between rutile and anatase TiO2 particles in photocatalytic oxidation of naphthalene. Appl. Catal. A Gen. 2003, 244, 383–391. [Google Scholar] [CrossRef]


| Tested Material | Crystal Modification | Density [g/cm3] | Bulk Density [g/L] | Specific Surface Area (BET) [m2/g] | Crystallite Size (Anatase) [nm] |
|---|---|---|---|---|---|
| P25 | Anatase (87%) and rutile (13%) * | 4.26 | 100–180 * | 53.8 ± 0.2 | 33 |
| K7050 | Anatase | 3.9 | 300 | 326 ± 2.6 | 8 |
| K7000 | Anatase | 2.9 | 350 | 246.8 ± 2.9 | 10 |
| Silica | Silica | 2.2 | 225 | 23.86 ± 0.69 | - |
| Tested Material | NO | O3 | S | ||
|---|---|---|---|---|---|
| NO [%] | NO2max [ppb] | NOx [%] | O3 [%] | [%] | |
| P25 | 65.71 | 10.40 | 58.60 | 12.96 | 89.18 |
| K7050 | 58.42 | 2.4 | 57.03 | 6.34 | 97.62 |
| K7000 | 62.79 | 5.30 | 59.27 | 14.37 | 94.39 |
| Silica | 3.51 | 0.8 | 2.97 | 2.21 | 84.62 |
Publisher’s Note: MDPI stays neutral with regard to jurisdictional claims in published maps and institutional affiliations. |
© 2022 by the authors. Licensee MDPI, Basel, Switzerland. This article is an open access article distributed under the terms and conditions of the Creative Commons Attribution (CC BY) license (https://creativecommons.org/licenses/by/4.0/).
Share and Cite
Witkowski, H.; Jackiewicz-Rek, W.; Jarosławski, J.; Chilmon, K.; Szkop, A. Ozone Formation during Photocatalytic Oxidation of Nitric Oxides under UV Irradiation with the Use of Commercial TiO2 Photocatalytic Powders. Materials 2022, 15, 5905. https://doi.org/10.3390/ma15175905
Witkowski H, Jackiewicz-Rek W, Jarosławski J, Chilmon K, Szkop A. Ozone Formation during Photocatalytic Oxidation of Nitric Oxides under UV Irradiation with the Use of Commercial TiO2 Photocatalytic Powders. Materials. 2022; 15(17):5905. https://doi.org/10.3390/ma15175905
Chicago/Turabian StyleWitkowski, Hubert, Wioletta Jackiewicz-Rek, Janusz Jarosławski, Karol Chilmon, and Artur Szkop. 2022. "Ozone Formation during Photocatalytic Oxidation of Nitric Oxides under UV Irradiation with the Use of Commercial TiO2 Photocatalytic Powders" Materials 15, no. 17: 5905. https://doi.org/10.3390/ma15175905
APA StyleWitkowski, H., Jackiewicz-Rek, W., Jarosławski, J., Chilmon, K., & Szkop, A. (2022). Ozone Formation during Photocatalytic Oxidation of Nitric Oxides under UV Irradiation with the Use of Commercial TiO2 Photocatalytic Powders. Materials, 15(17), 5905. https://doi.org/10.3390/ma15175905