
Toughening and Hardening Limited Zone of High-Strength Steel through Geometrically Necessary Dislocation When Exposed to Electropulsing

Abstract
:1. Introduction
2. Materials and Experiment
2.1. Materials and Weld Procedure
2.2. EP Treatment
2.3. Microstructural Characterization and Mechanical Properties
3. Results
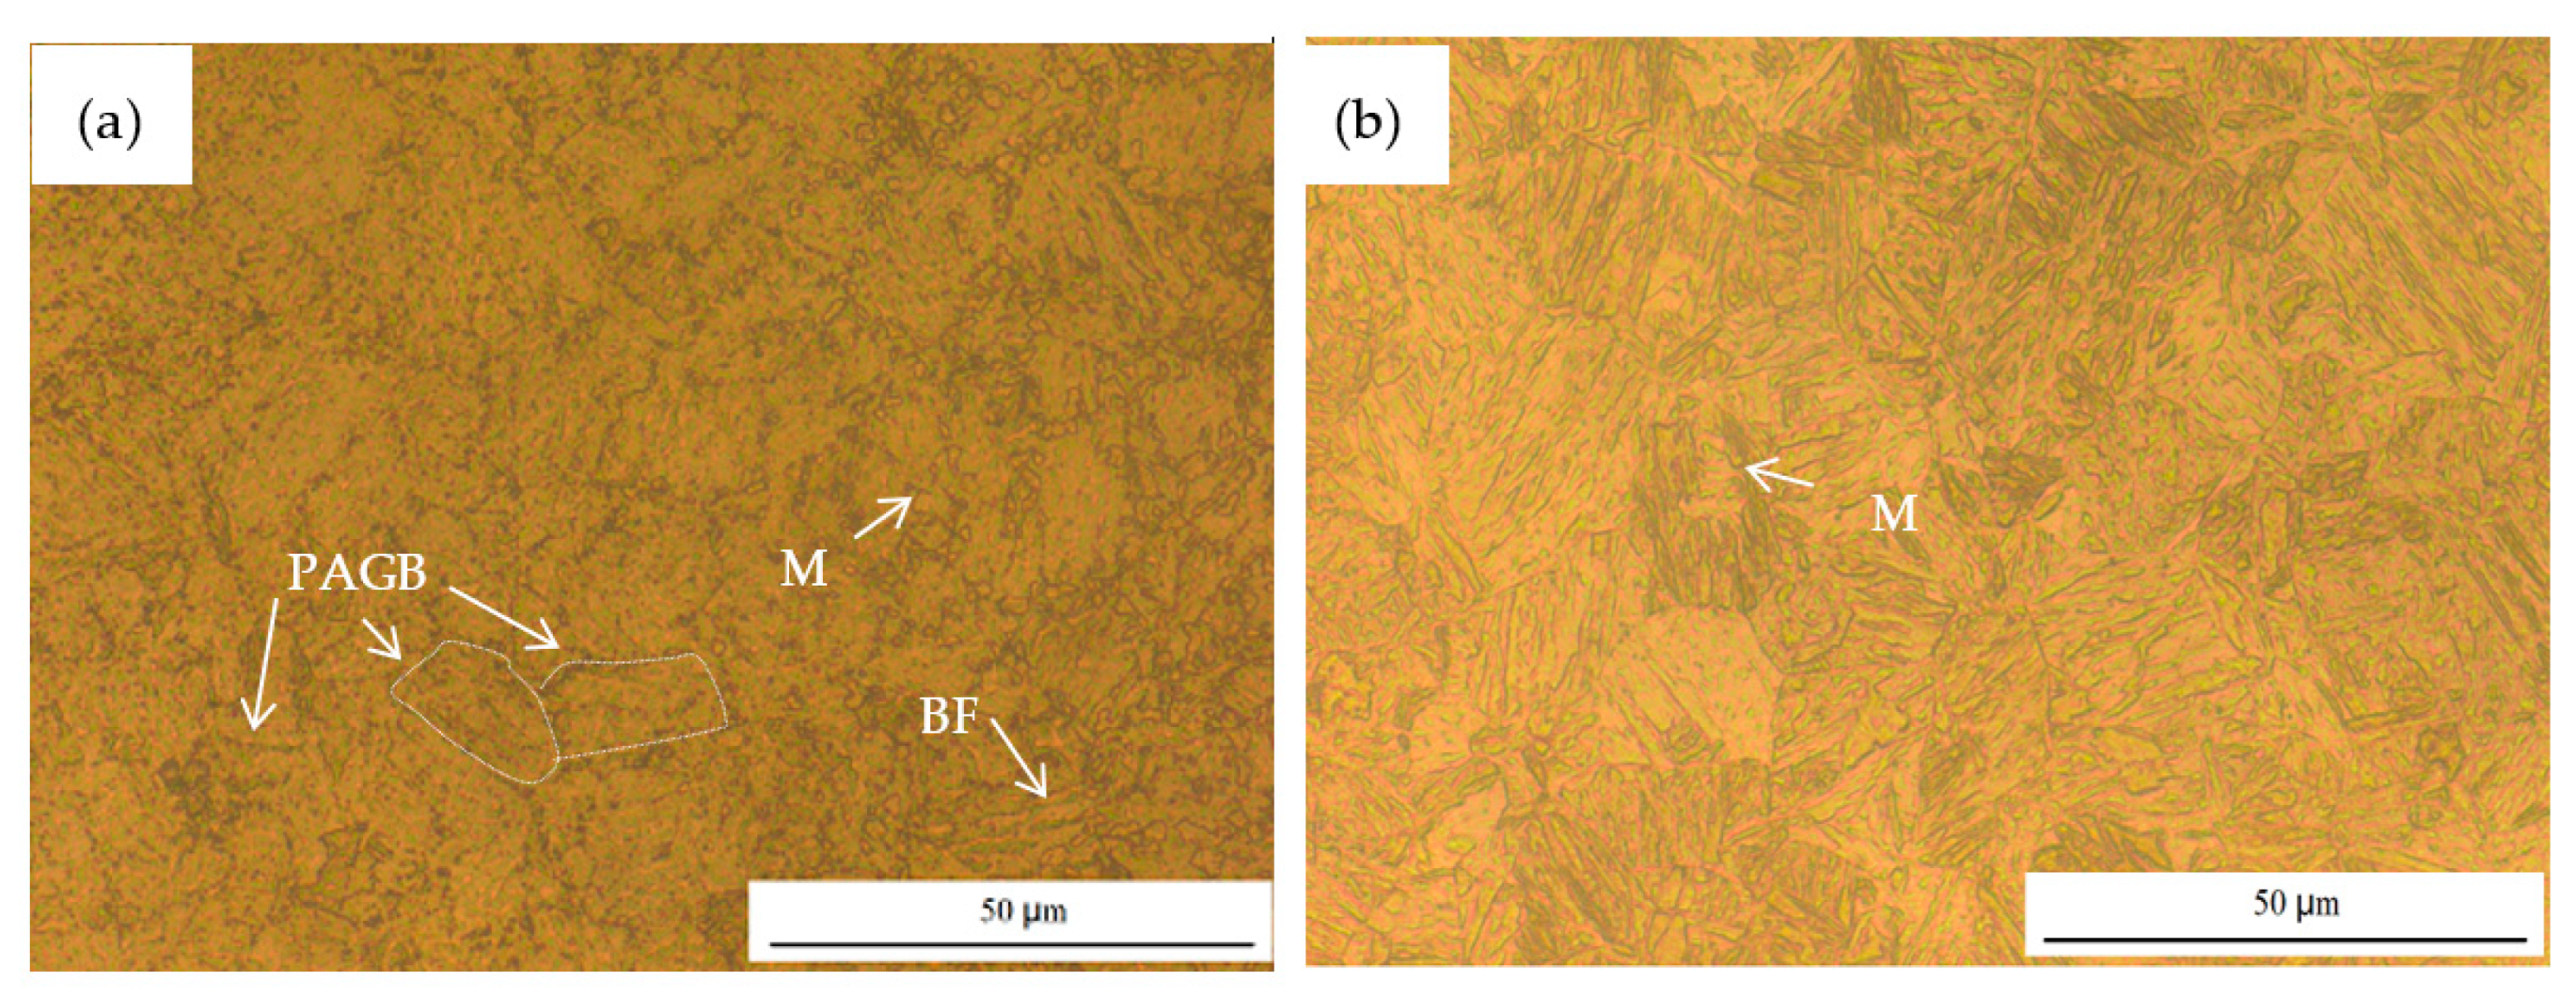
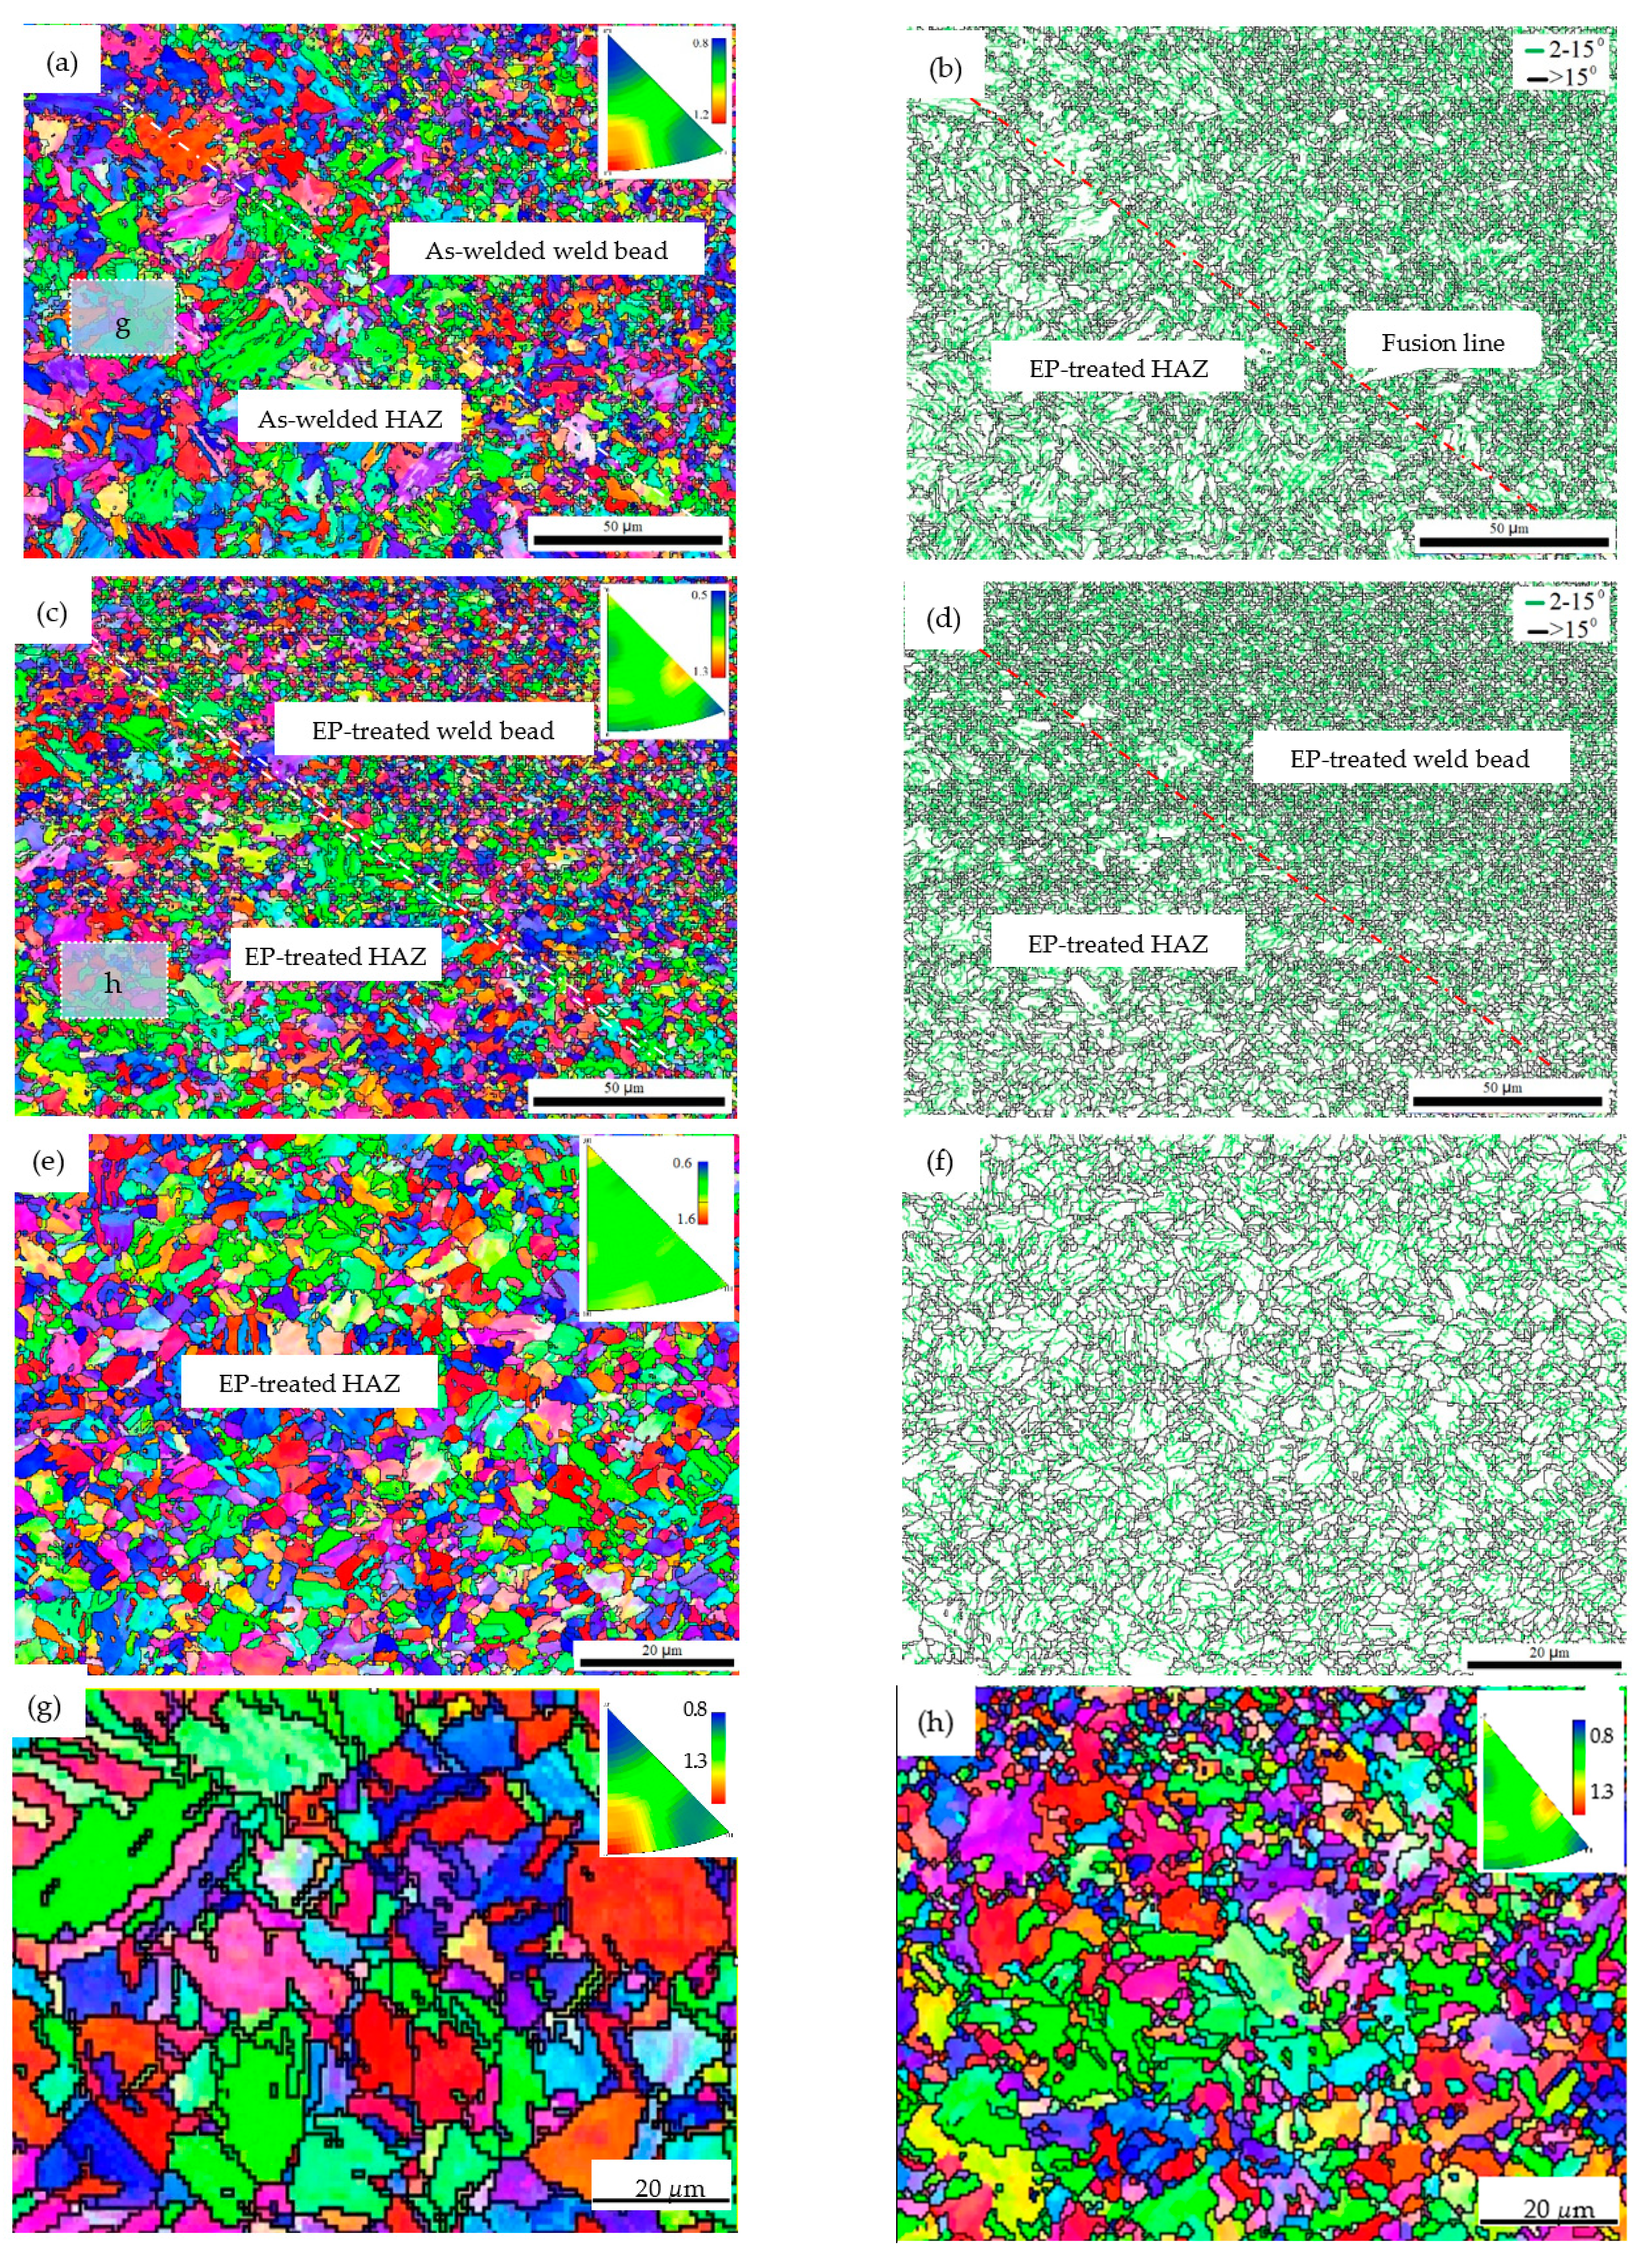
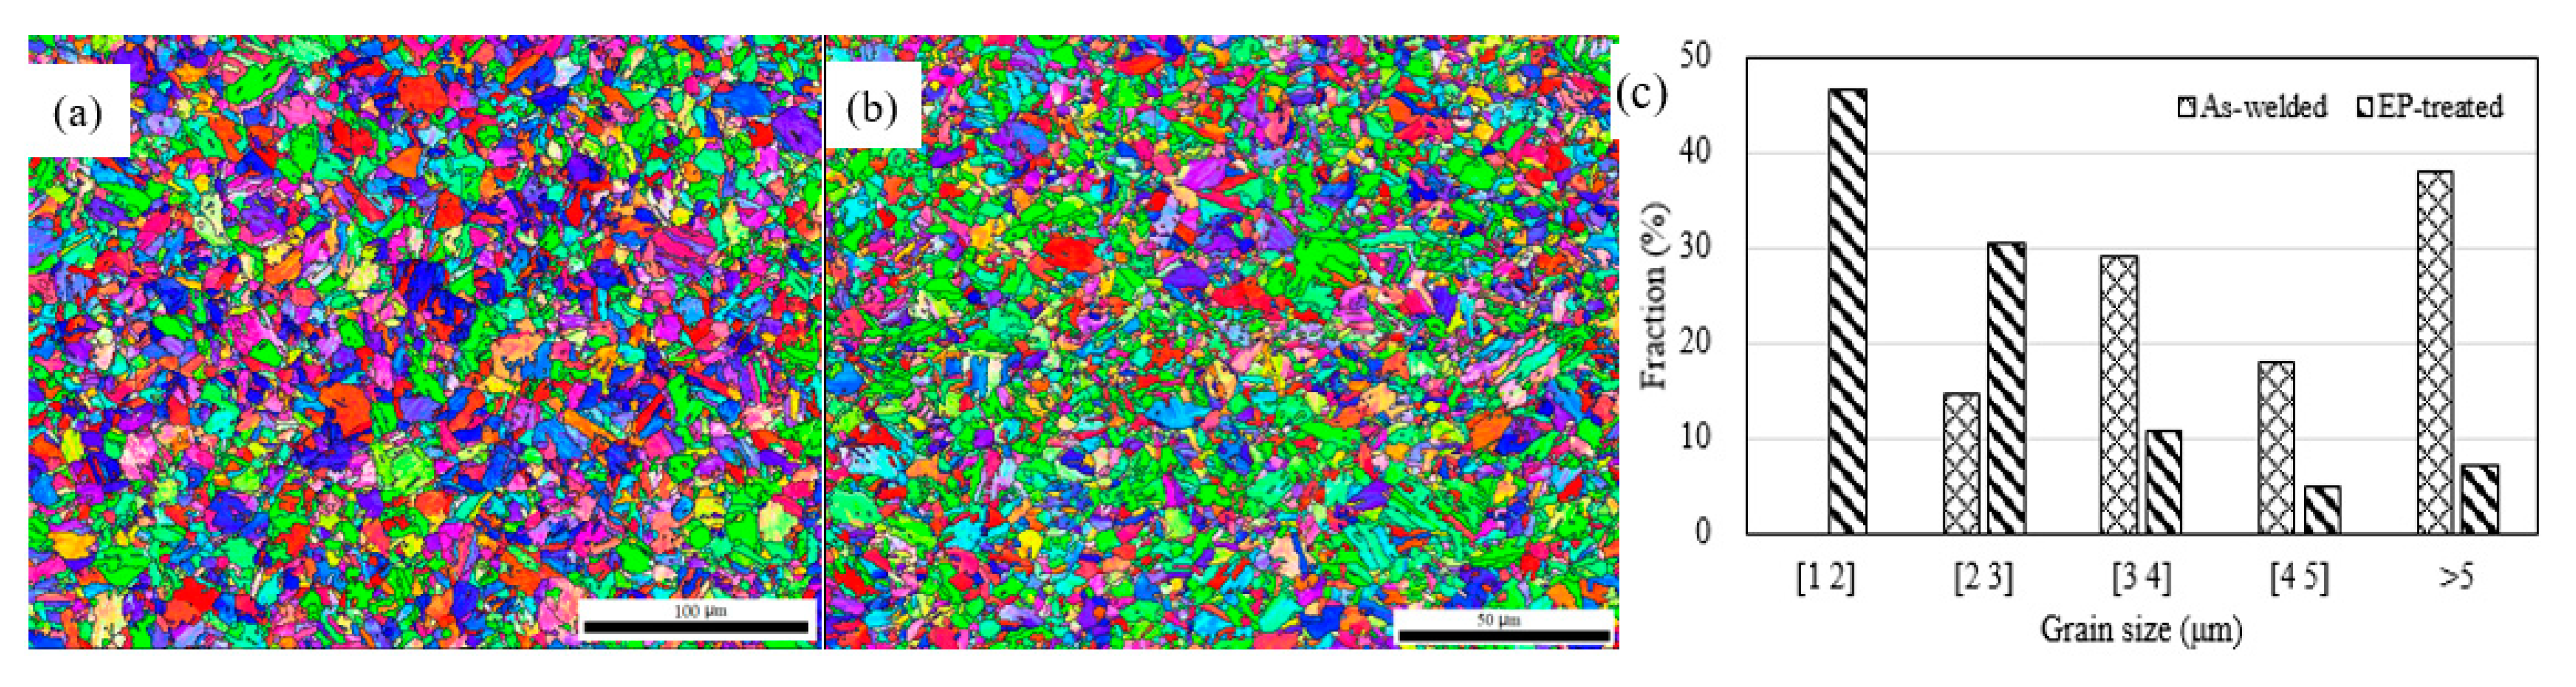
3.1. Microstructure Evolutions
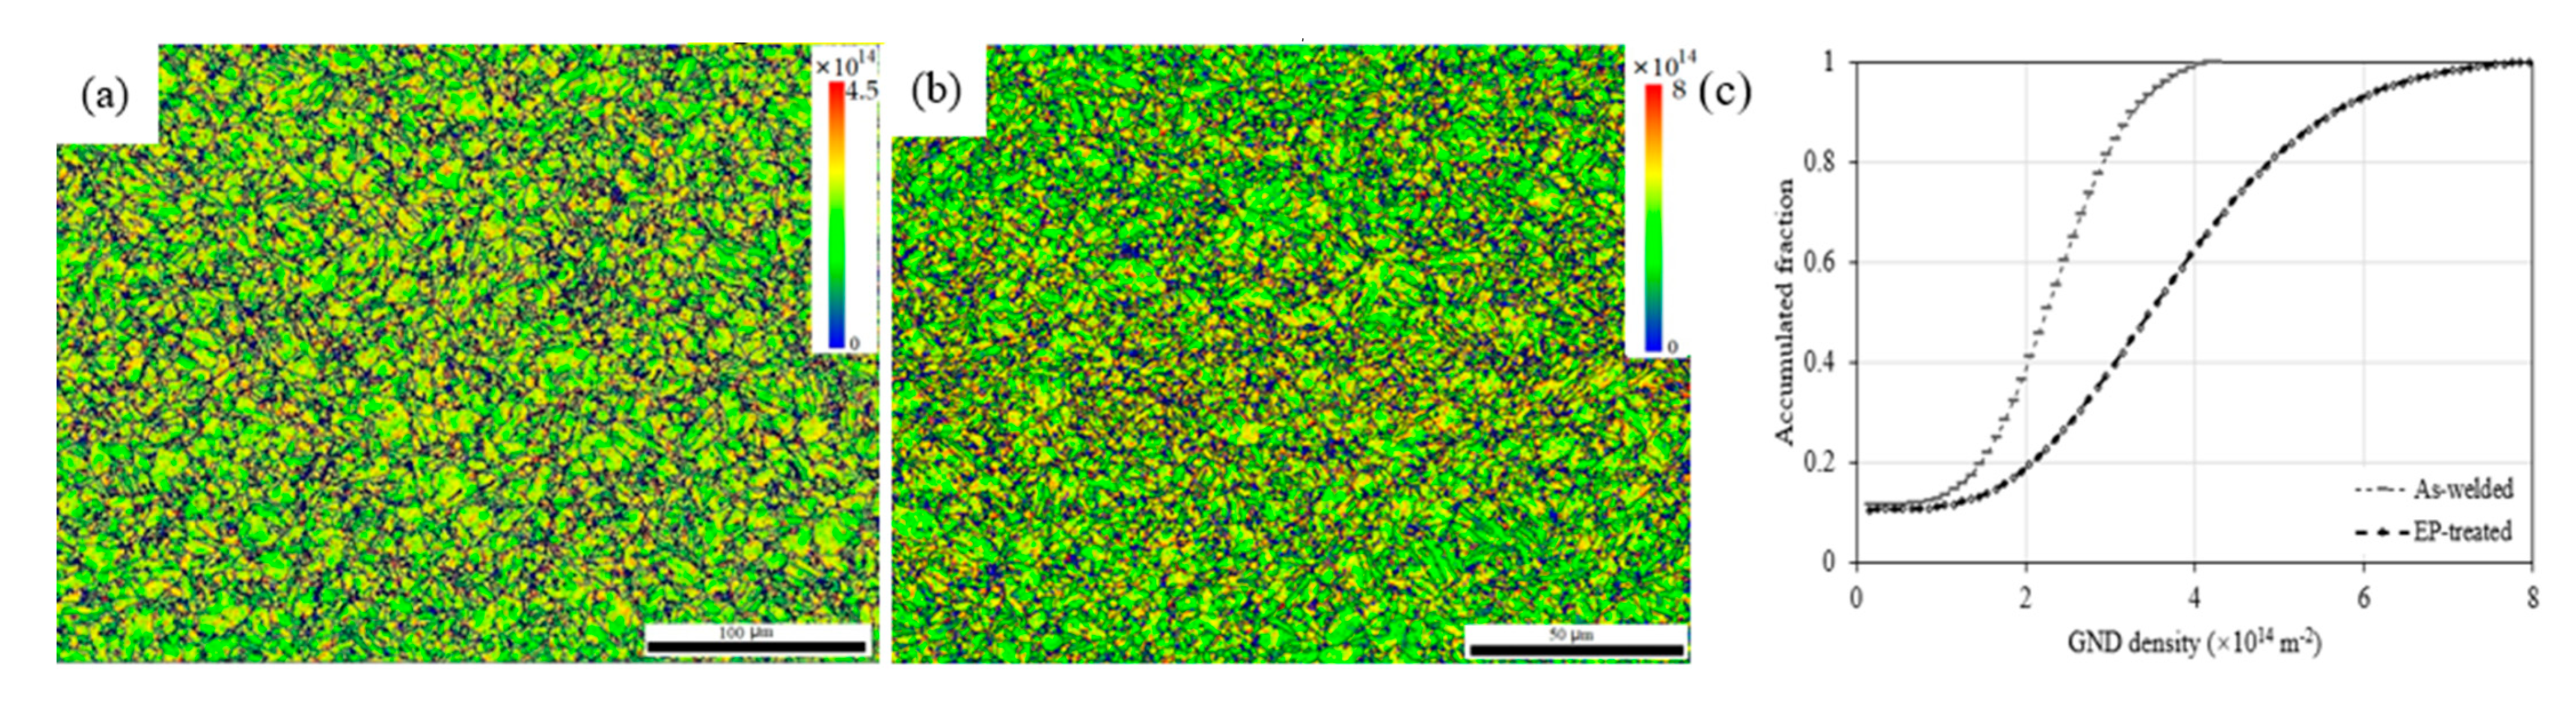
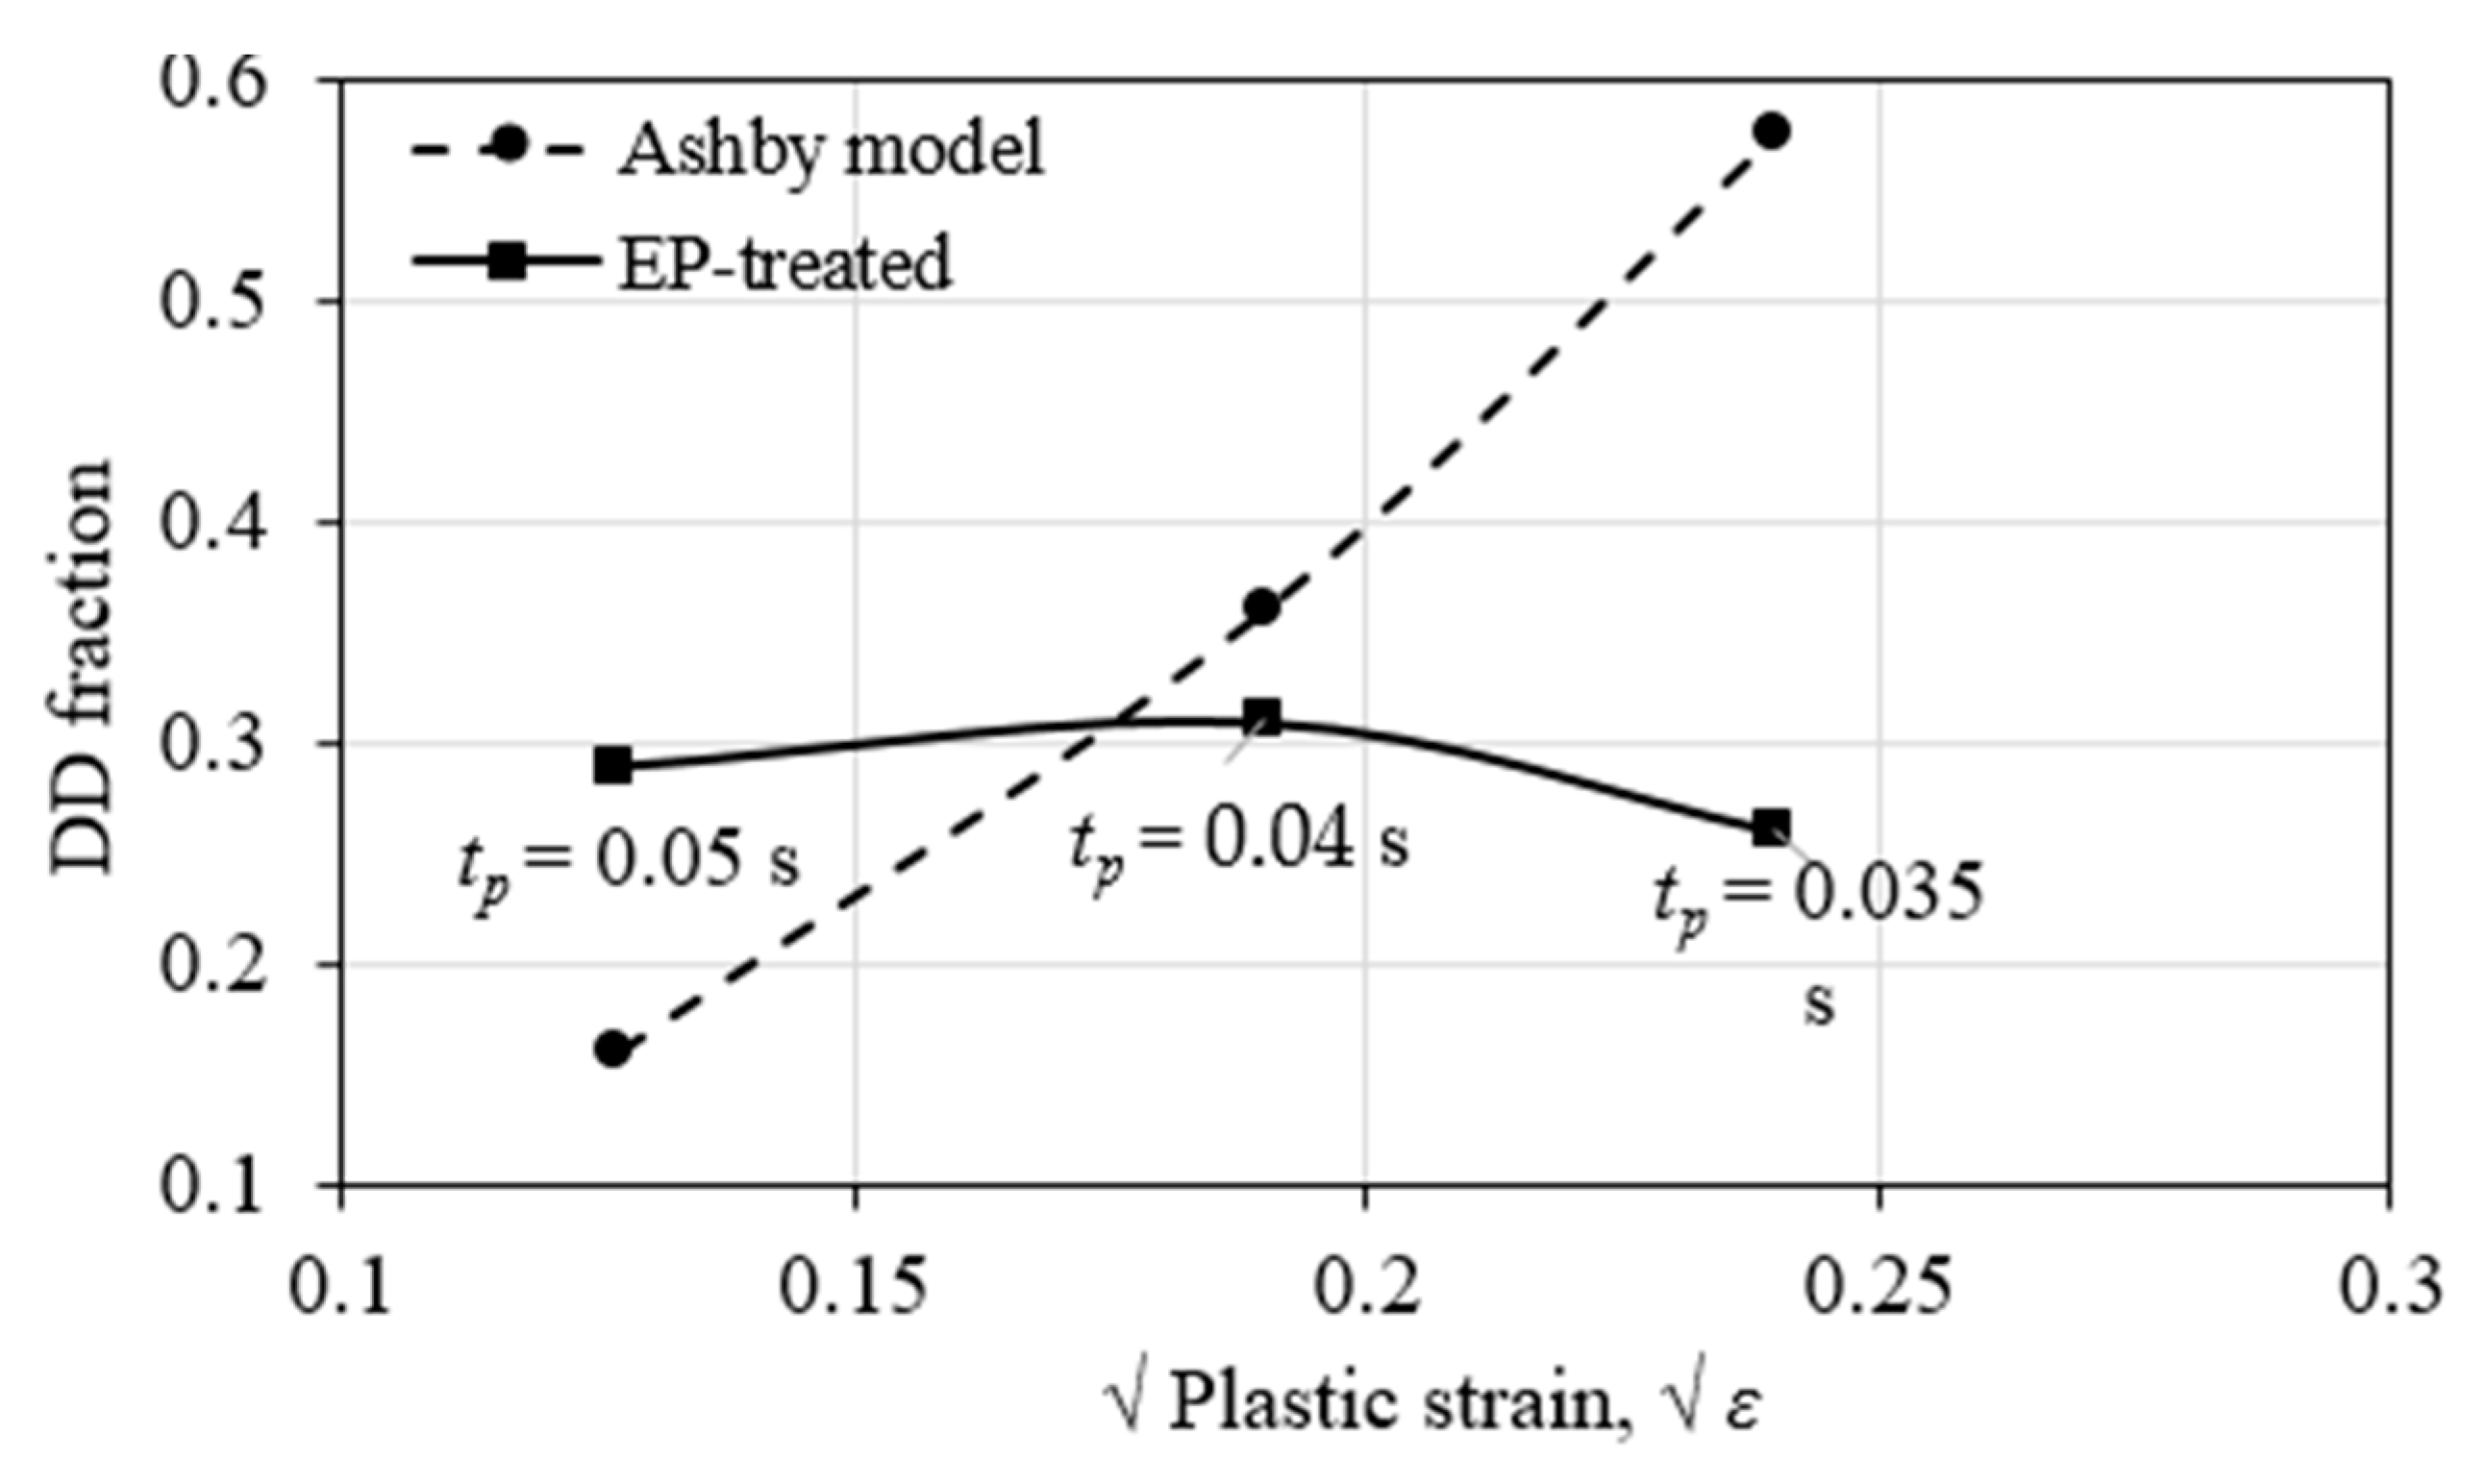
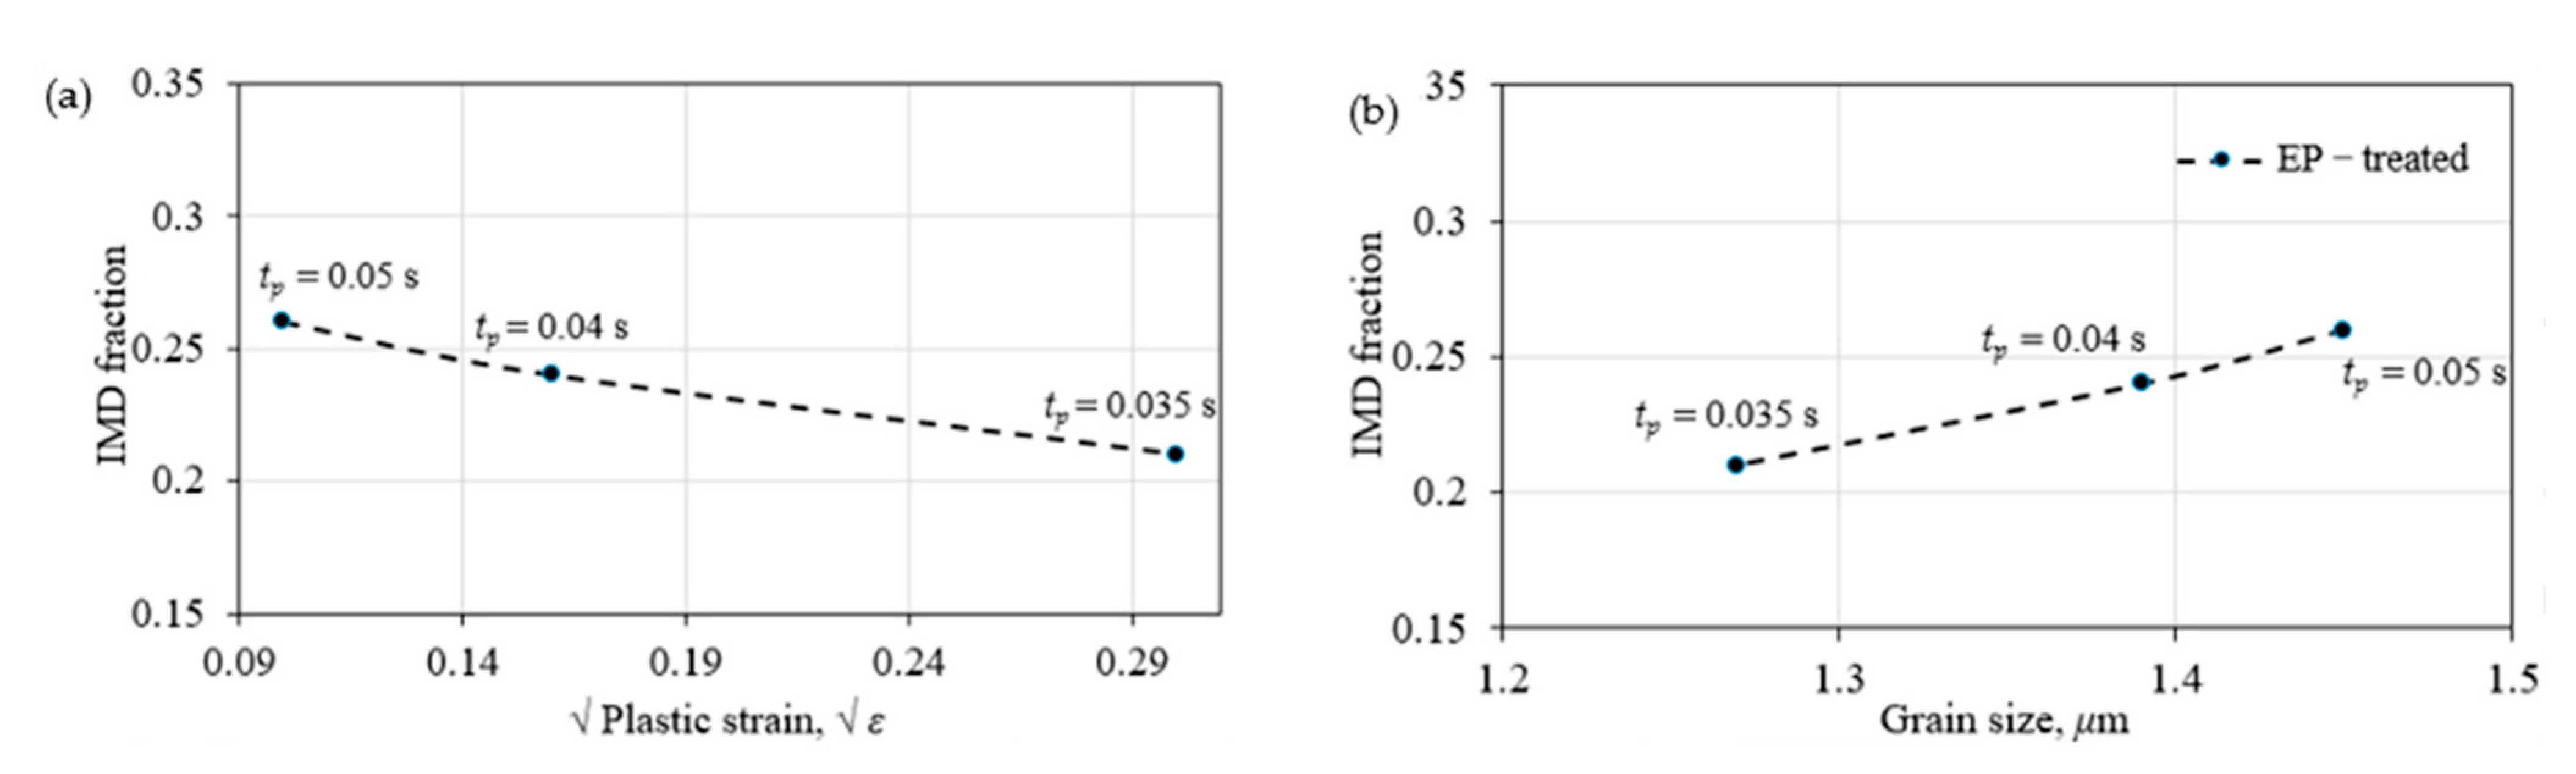
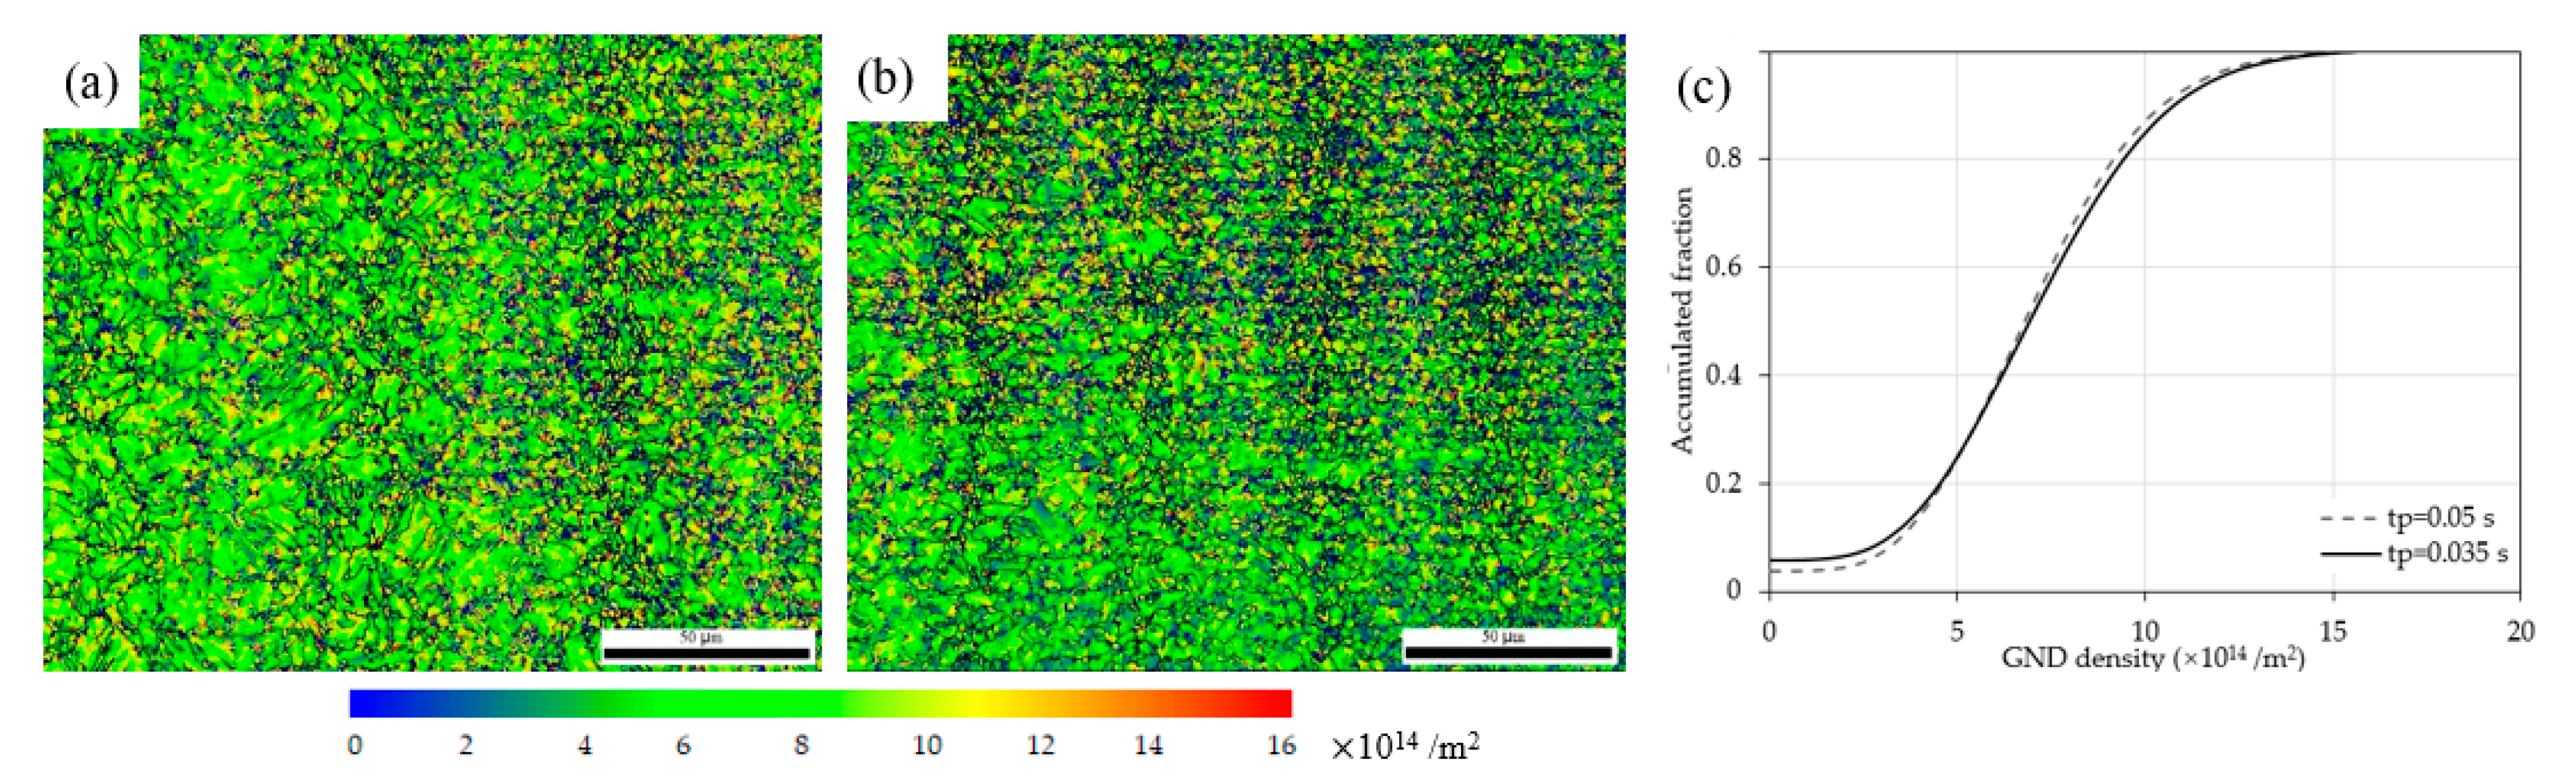
3.2. Dislocation Hardening Behaviors
3.3. Mechanical Properties
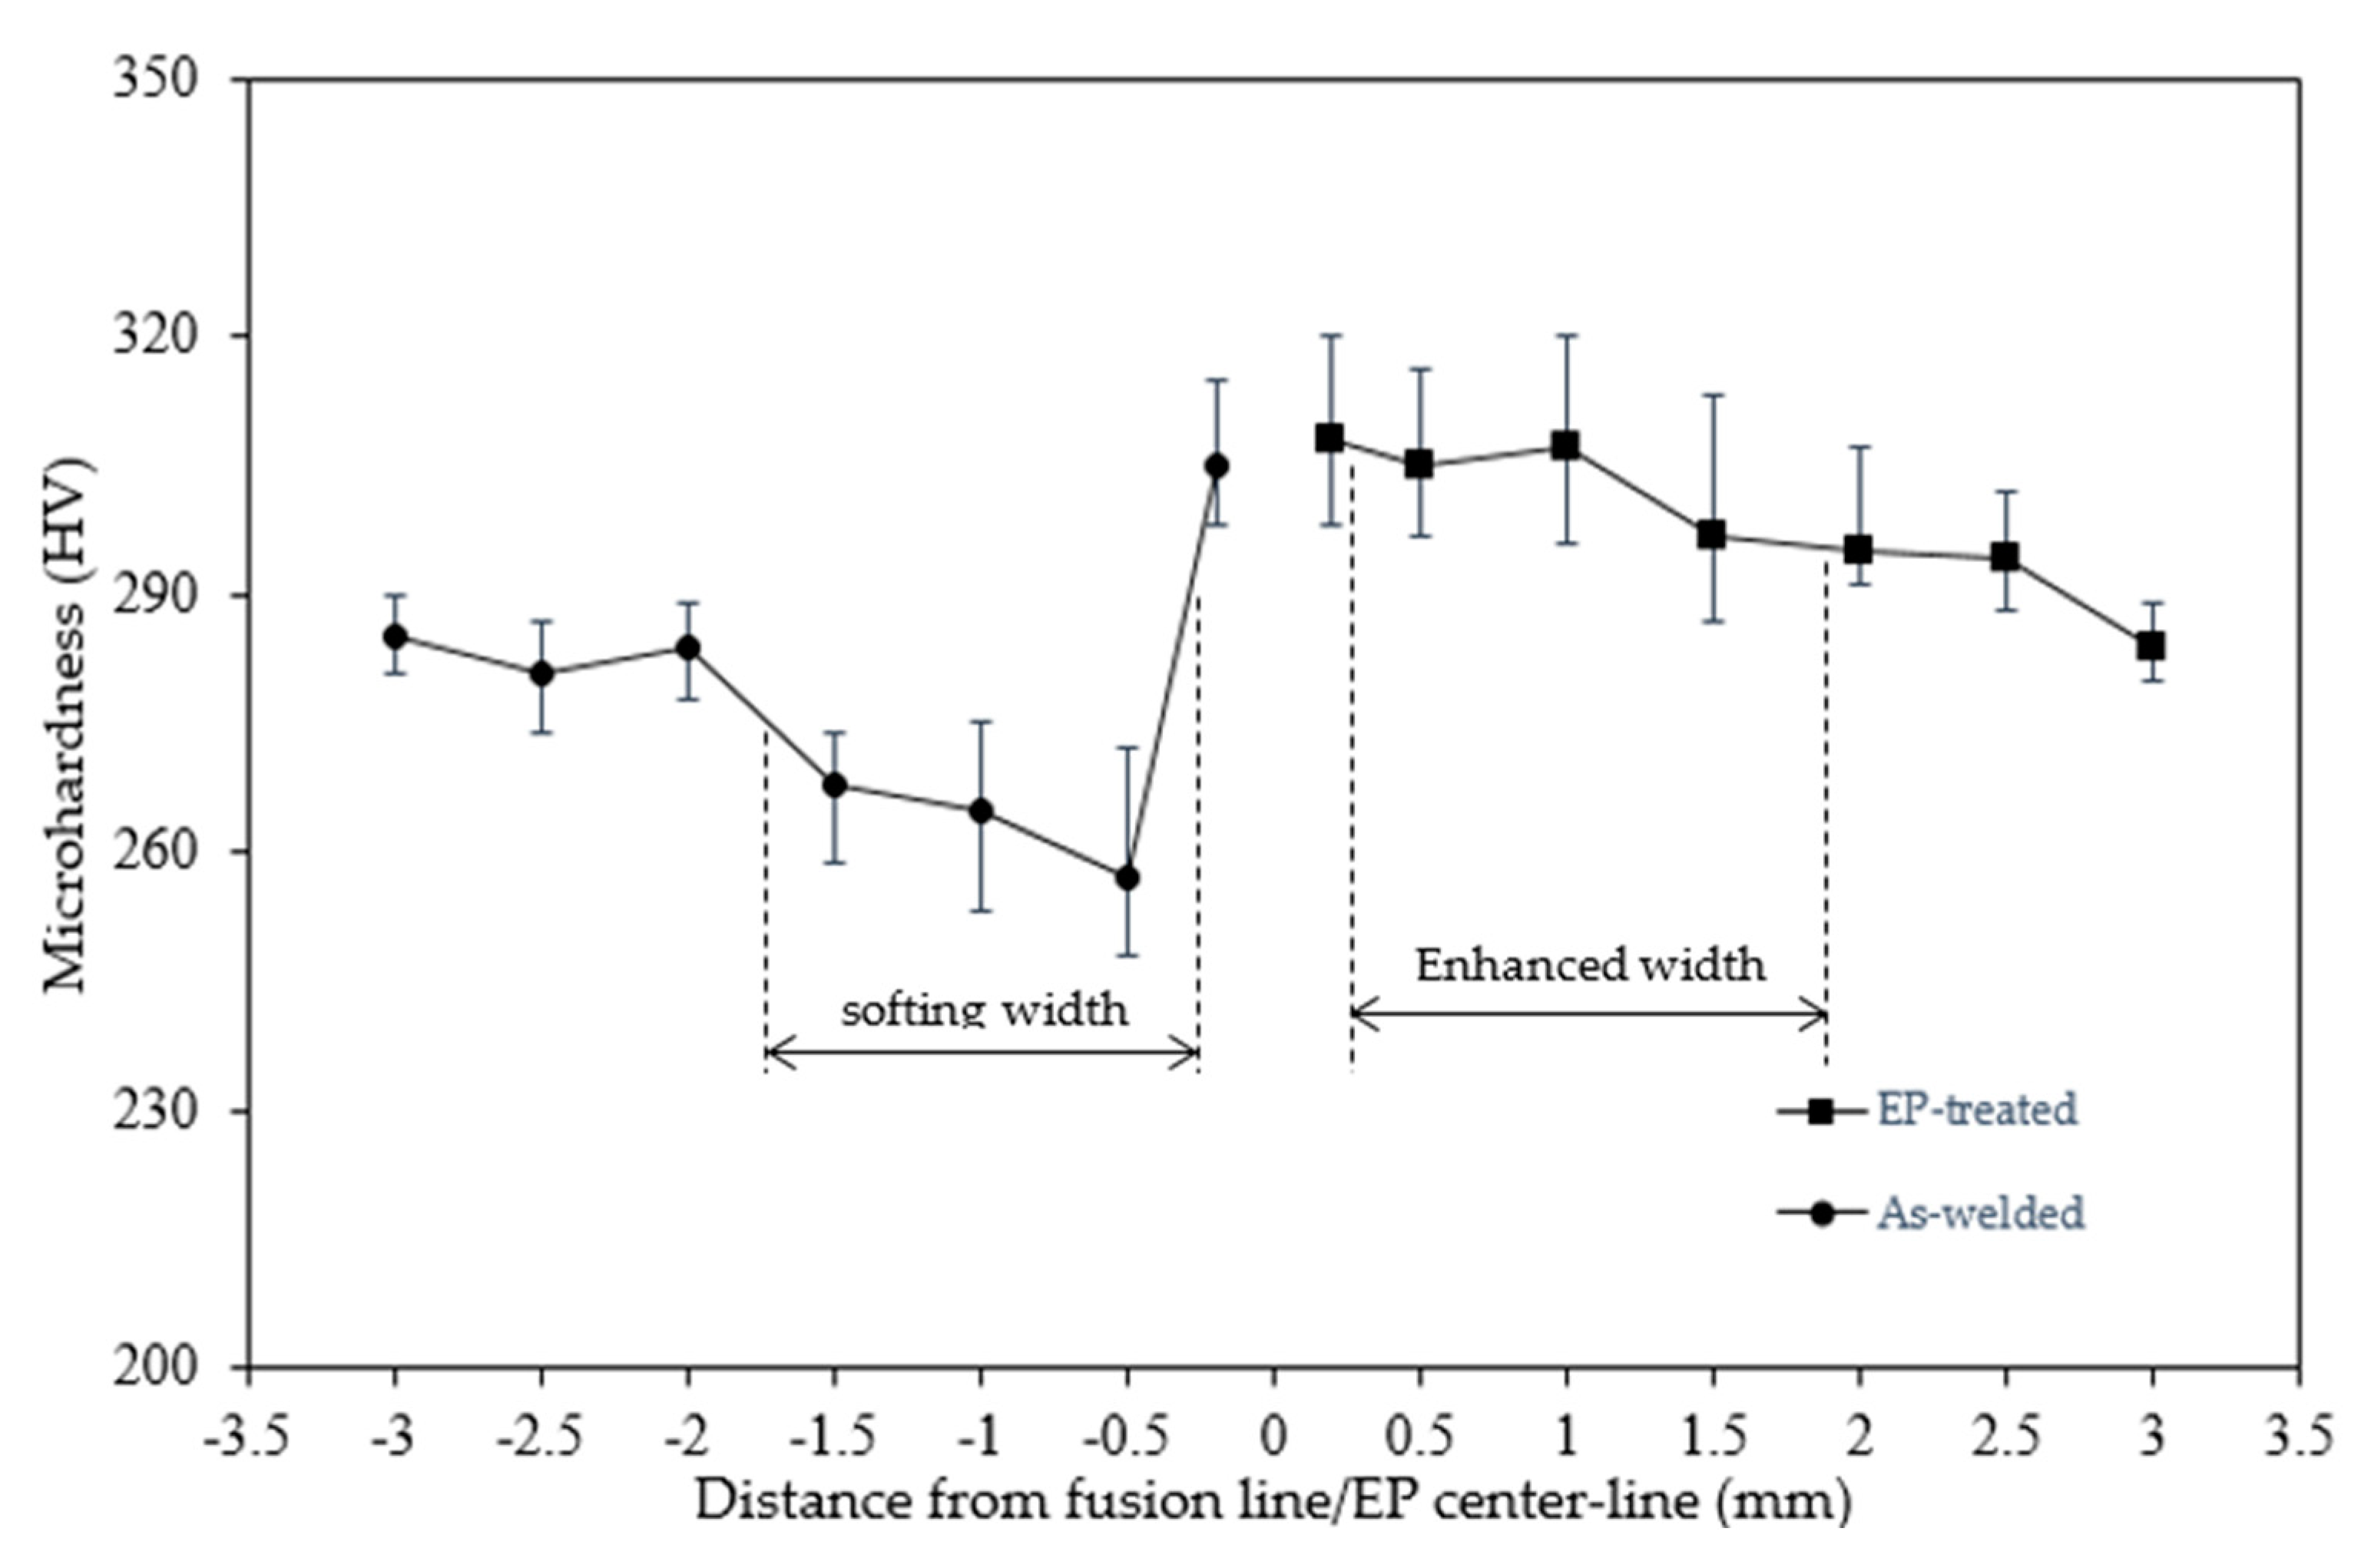
3.3.1. Hardness
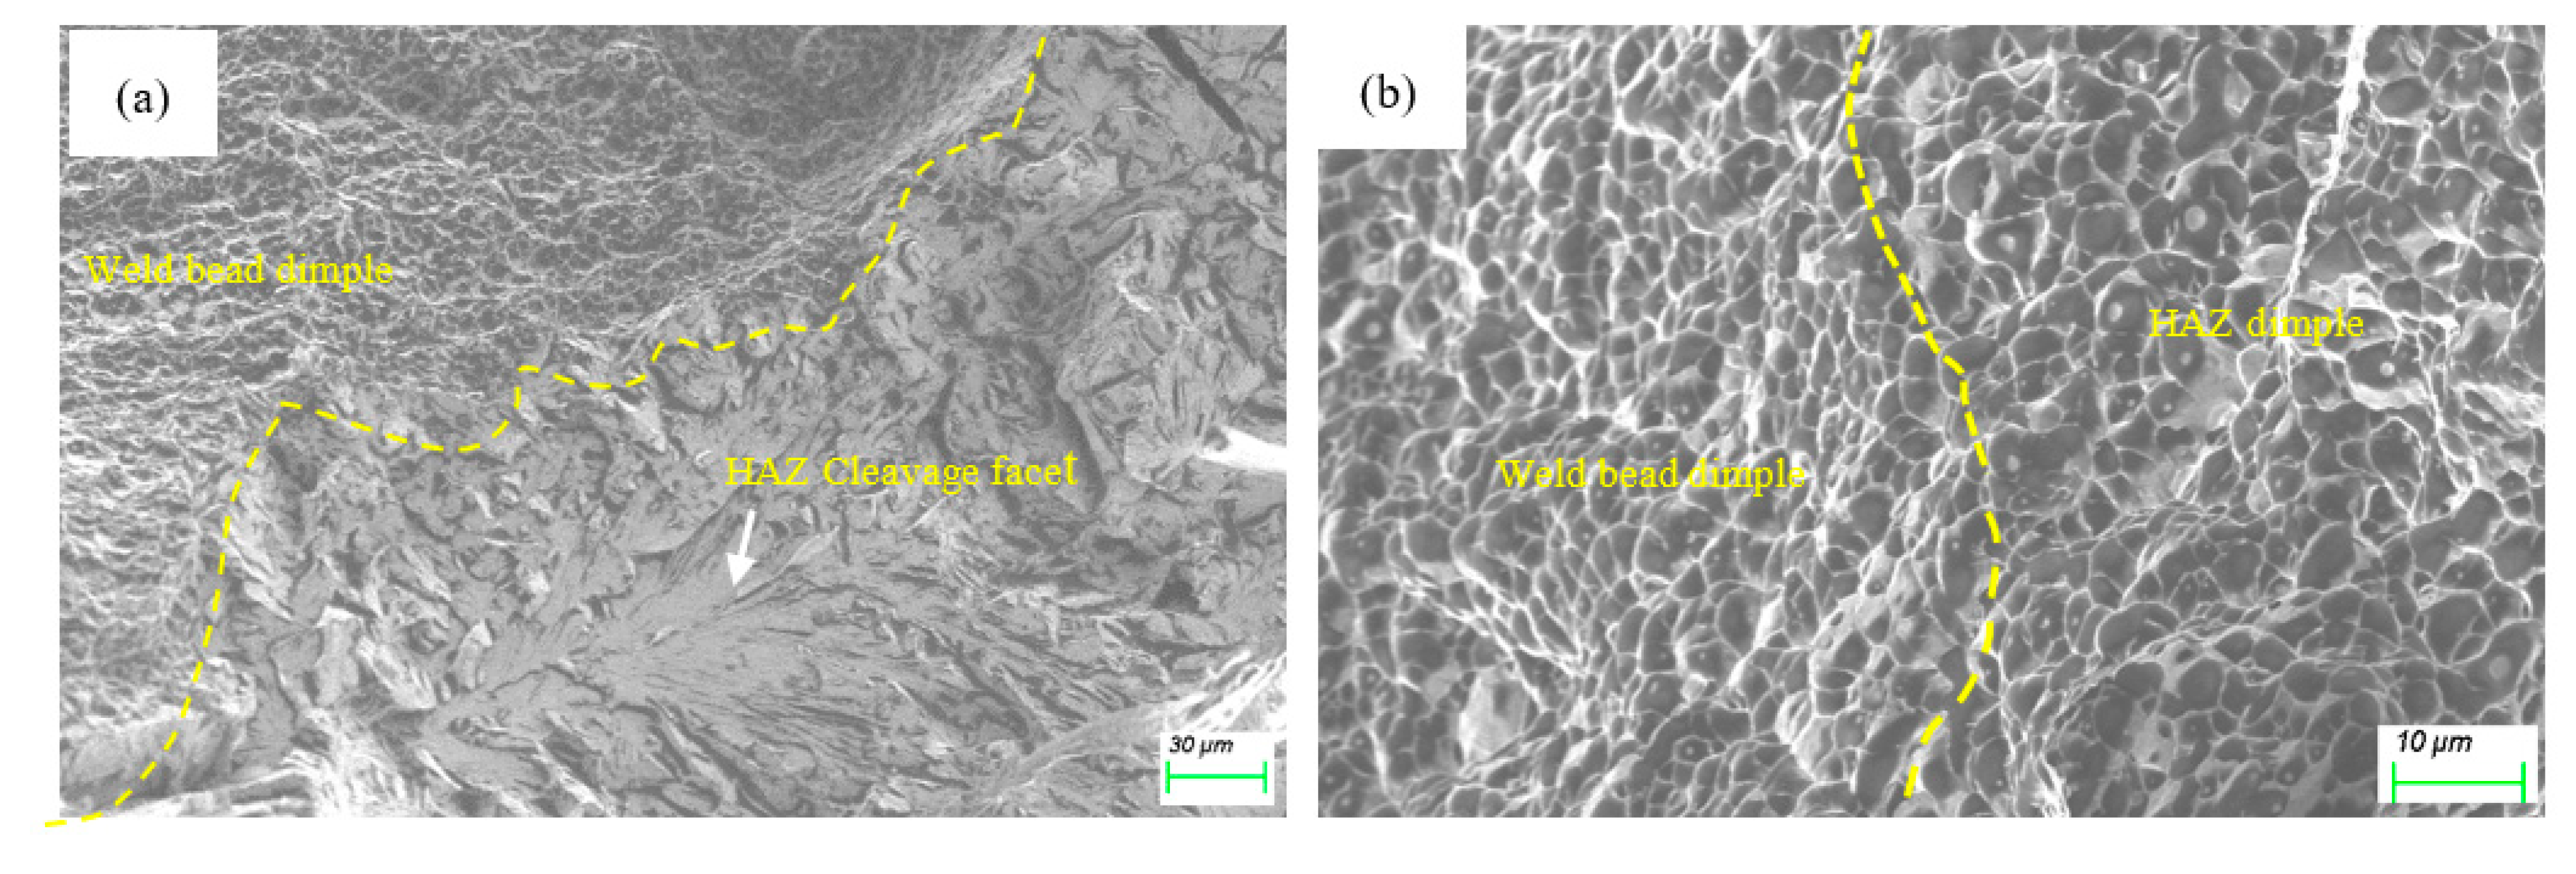
3.3.2. Toughness
4. Discussion
4.1. Microstructure Evolution Mechanism under EPT
4.2. Hardening Mechanism through GND
4.2.1. Dislocation
4.2.2. Dislocation Line
4.2.3. Gradient Dislocation
5. Conclusions
- (1)
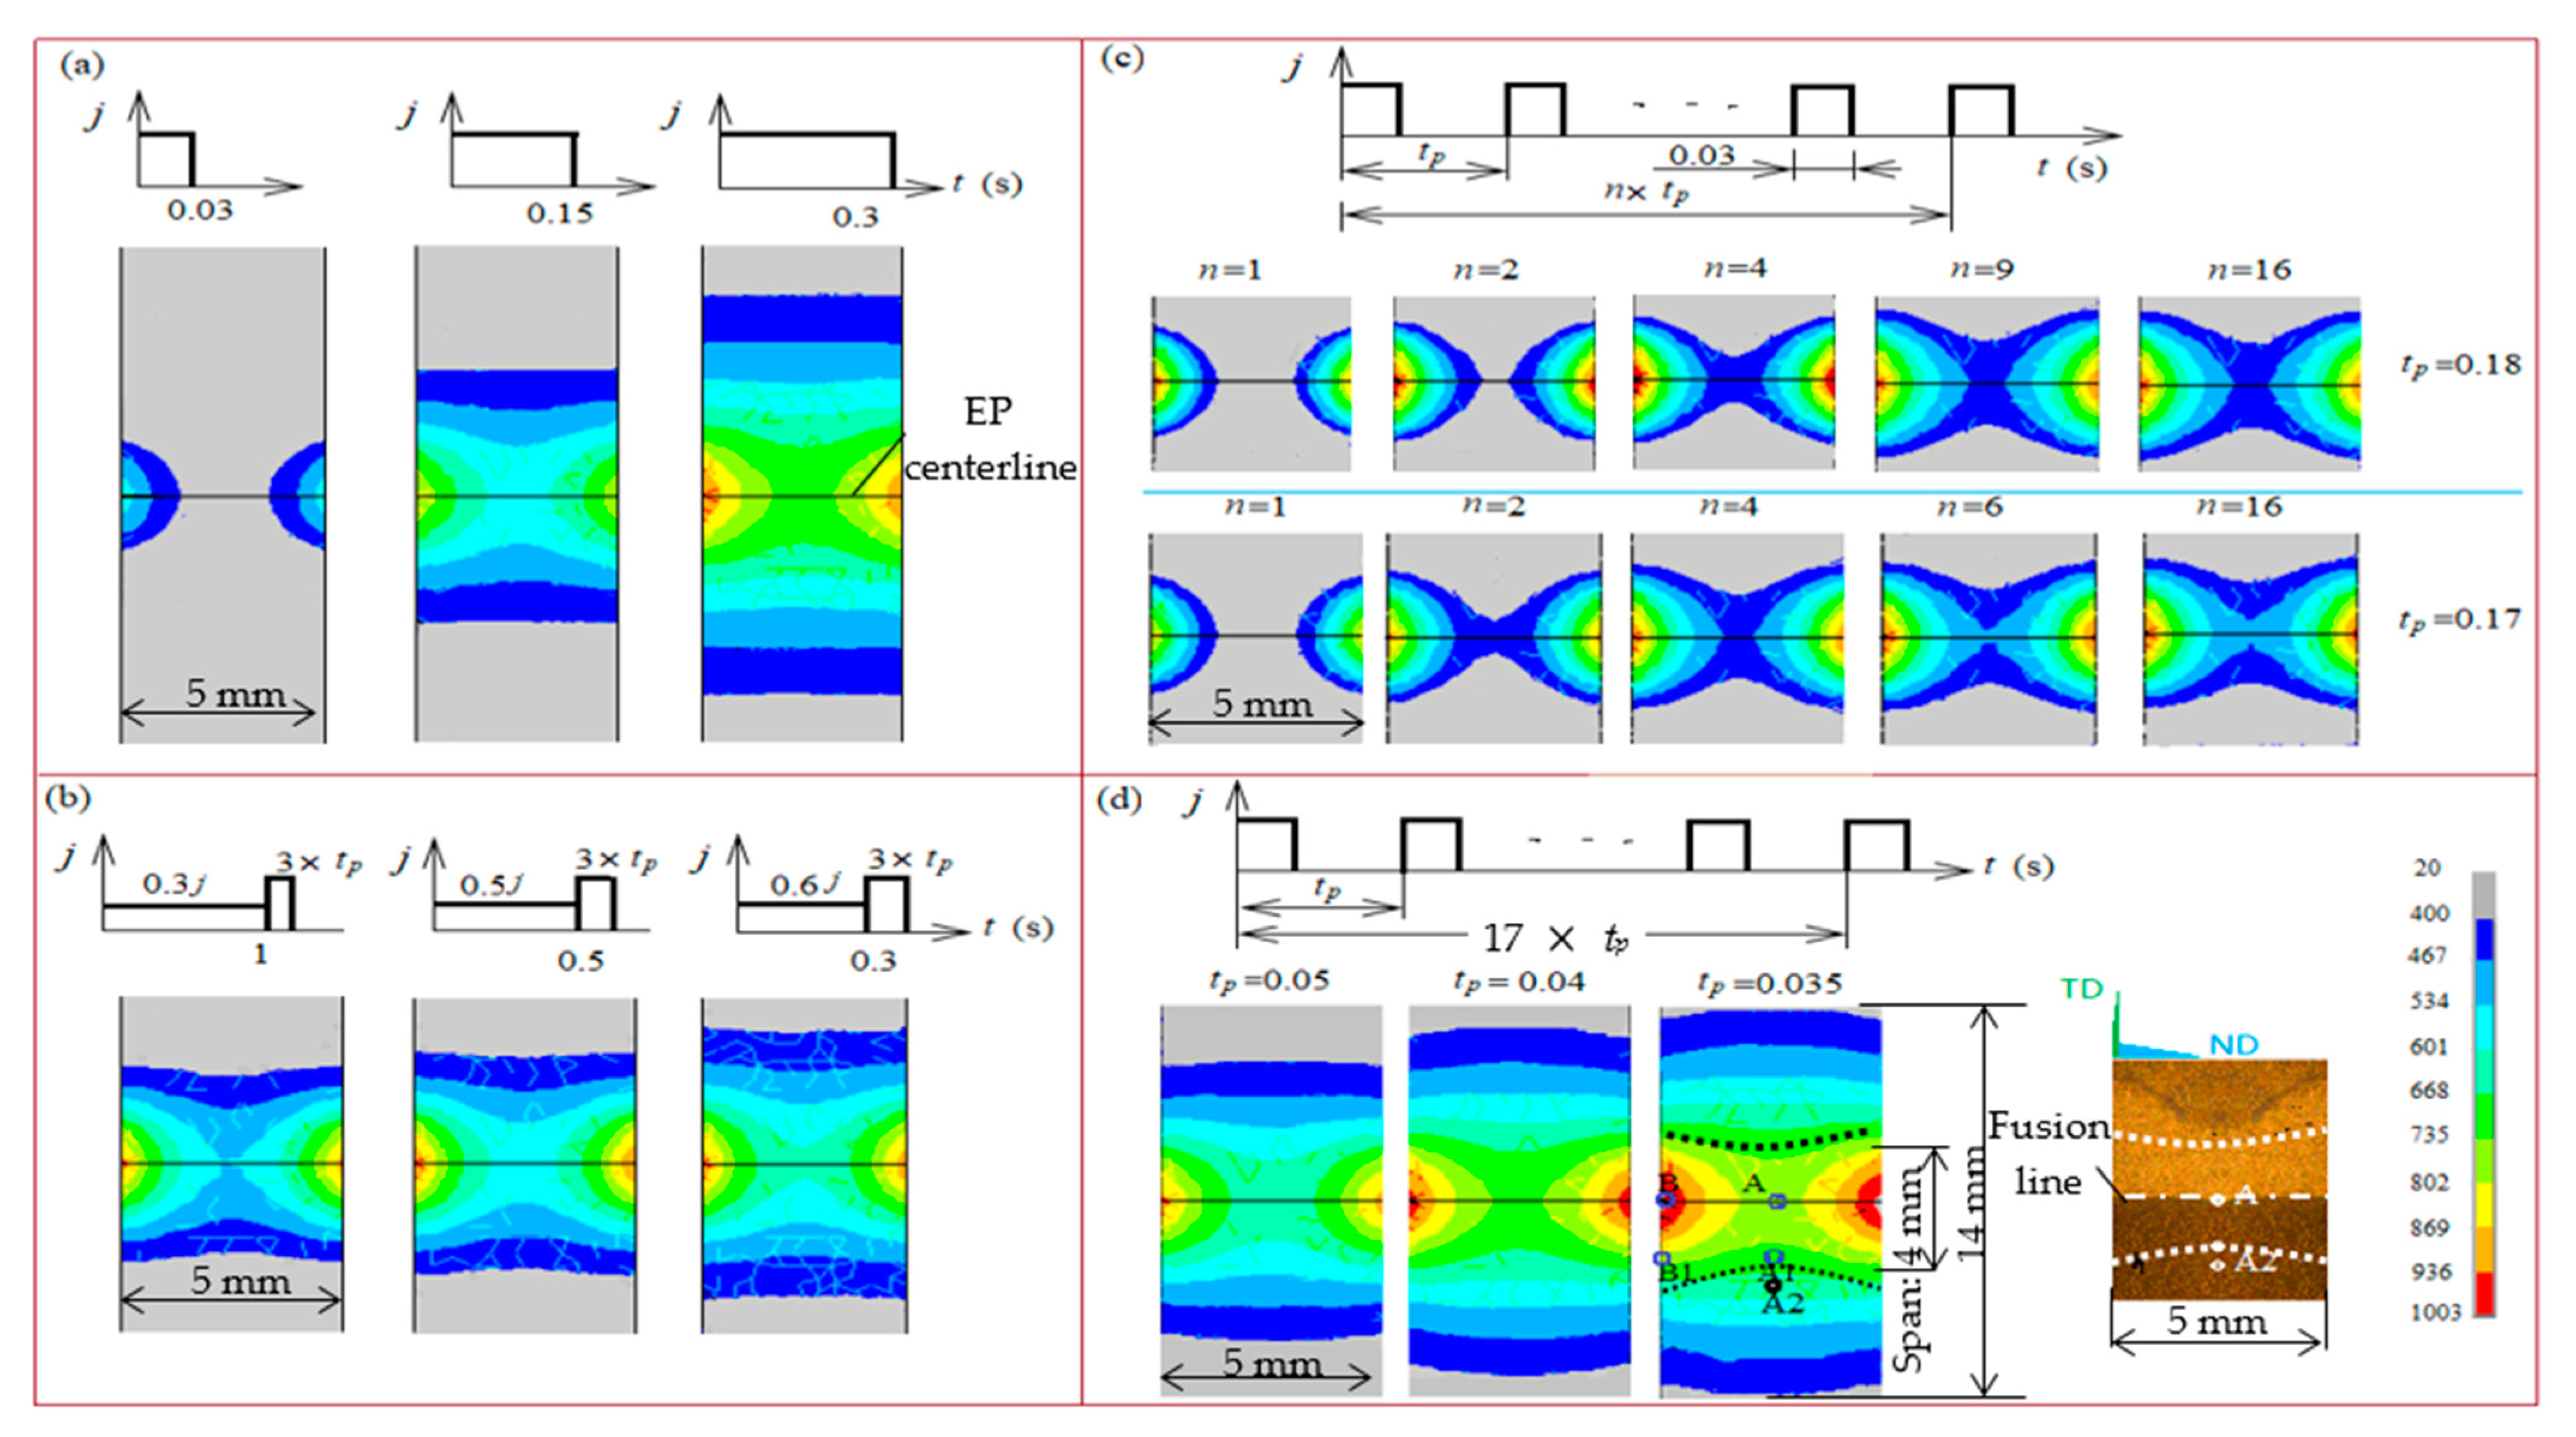
- Toughening and hardening a thick HAZ with a limited width was a challenge for a homogeneous temperature elevation through thickness due to electro–contraction; EP parameters characterized with surficial forced cooling and multiple pulses with shorter period were a proper solution;
- (2)
- The pearlite matrix HAZ evolved to refine martensitic matrix with less dislocation density, a highly geometrically necessary dislocation density and a high fraction of high angle grain boundary. This selective tailoring by this local thermal cycle EP gave rise to a 2.1 times and 1.2 times increase in toughness and hardness, respectively;
- (3)
- This local thermal cycle EP introduced an interaction among three plasticity behaviors, thermo- and electro-plasticity and work-hardening. The former two are dominant in the evolution of DD and IMD, while the third is dominant in GND evolution;
- (4)
- The microstructural tailor spanned less than 4 mm for 5 mm thick samples.
Author Contributions
Funding
Institutional Review Board Statement
Informed Consent Statement
Data Availability Statement
Conflicts of Interest
References
- Mohandas, T.; Reddy, G.M.; Kumar, B.S. Heat-affected zone softening in high strength low-alloy steels. J. Mater. Process. Technol. 1999, 88, 284–294. [Google Scholar] [CrossRef]
- Wang, X.L.; Wang, Z.Q.; Xie, Z.J.; Wang, J.L.; Li, X.C.; Shang, C.J. Toughening coarse grained heat affected zone of high strength offshore engineering steel by enhancing the completeness of austenite-bainite transformation. Mater. Lett. 2019, 257, 126727. [Google Scholar] [CrossRef]
- Cui, J.J.; Zhu, W.T.; Chen, Z.Y.; Chen, L.Q. Effect of simulated cooling time on microstructure and toughness of CGHAZ in novel high-strength low-carbon construction steel. Sci. Technol. Weld Join. 2019, 25, 169–177. [Google Scholar] [CrossRef]
- Sprecher, A.; Mannan, S.; Conrad, H. On the mechanisms for the electroplastic effect in metals. Acta Metall. 1986, 34, 1145–1162. [Google Scholar] [CrossRef]
- Rahnama, A.; Qin, R.S. The effect of electropulsing on the interlamellar spacing and mechanical properties of a hot-rolled 0.14% carbon steel. Mater. Sci. Eng. A 2015, 627, 145–152. [Google Scholar] [CrossRef]
- Haque, A.; Sherbondy, J.; Warywoba, D. Room-temperature stress reduction in welded joints through electropulsing. J. Mater. Process. Technol. 2022, 299, 117391. [Google Scholar] [CrossRef]
- Zhao, Y.G.; Ma, B.D.; Guo, H.C.; Ma, J.; Yang, Q.; Song, J.S. Electropulsing strengthened 2GPa boron steel with good ductility. Mater. Des. 2013, 43, 195–199. [Google Scholar] [CrossRef]
- Liu, X.; Lan, S.H.; Ni, J. Experimental study of Electro-plastic effect on advanced high strength steels. Mater. Sci. Eng. A 2013, 582, 211–218. [Google Scholar] [CrossRef]
- Zhang, H.X.; Zhang, X.F. Suppressing or promoting: The effect of coupled electron-heat field on serration behavior. J. Alloy Compd. 2020, 818, 152920. [Google Scholar] [CrossRef]
- You, W.; Xu, W.; Bai, B.; Fang, H. Materialometrical approach of predicting the austenite formation temperatures. Mater. Sci. Eng. A 2006, 419, 276–282. [Google Scholar] [CrossRef]
- Arora, K.S.; Pandu, S.R.; Shajan, N.; Pathak, P.; Shome, M. Microstructure and impact toughness of reheated coarse grain heat affected zones of API X65 and API X80 linepipe steels. Int. J. Pres. Ves. Pip. 2018, 163, 36–44. [Google Scholar]
- China Classification Society. Rules for the Classification of Steel Ships Part D: Materials and Welding; China Classification Society: Beijing, China, 2020; pp. 19–21. (In Chinese) [Google Scholar]
- Gao, H.; Huang, Y.; Nix, W.D.; Hutchinson, J.W. Mechanism-based strain gradient plasticity I: Theory. J. Mech. Phys. Solids 1999, 47, 1239–1263. [Google Scholar] [CrossRef]
- Hall, E.O. The deformation and ageing of mild steel: III Discussion of result. Proc. Phys. Soc. 1951, 64, 747. [Google Scholar]
- Petch, N.J. The cleavage strength of polycrystals. J. Iron Steel Inst. 1953, 174, 25–28. [Google Scholar]
- Long, S.L.; Liang, Y.L.; Jiang, Y.; Liang, Y.; Yang, M.; Yi, Y.L. Effect of quenching temperature on martensite multi-level microstructures and properties of strength and toughness in 20CrNi2Mo steel. Mater. Sci. Eng. A 2016, 676, 38–47. [Google Scholar]
- Mintz, B. Importance of ky (Hall-Petch slope) in determining strength of steels. Met. Soc. 1984, 11, 265–272. [Google Scholar]
- Ramachandran, D.C.; Kim, S.D.; Moon, J.; Lee, C.H.; Chung, J.H.; Biro, E.; Park, Y.D. Classification of martensite-austenite constituents according to its internal morphology in high-strength low alloy steel. Mater. Lett. 2020, 278, 128422. [Google Scholar] [CrossRef]
- Morris, J.J.; Kinnery, C.; Pytlewski, K. Microstructure and cleavage in lath martensitic steels. Sci. Technol. Adv. Mater. 2013, 14, 014208. [Google Scholar] [CrossRef]
- Chen, M.Y.; Gouné, M.; Verdier, M.; Bréchet, Y.; Yang, J.R. Interphase precipitation in vanadium-alloyed steels: Strengthening contribution and morphological variability with austenite to ferrite transformation. Acta Mater. 2014, 64, 78–92. [Google Scholar]
- Jing, X.B.; Zhang, D.W.; Lin, B. Analysis on constitutive relation in meso-scale cutting process. ActaArmamentarii 2010, 31, 620–623. [Google Scholar]
- Pavlina, E.J.; Van Tyne, C.J. Correlation of yield strength and tensile strength with hardness for steels. J. Mater. Eng. Perform. 2008, 17, 888–893. [Google Scholar] [CrossRef]
- Lan, L.; Qiu, C.; Zhao, D. Microstructural characteristics and toughness of the simulated coarse grained heat affected zone of high strength low carbon bainitic steel. Mater. Sci. Eng. A 2011, 529, 192–200. [Google Scholar] [CrossRef]
- Srinivasan, K.; Huang, Y.; Kolednik, O.; Siegmund, T. The size dependence of microtoughness in ductile fracture. J. Mech. Phy. Solids 2008, 56, 2707–2726. [Google Scholar] [CrossRef]
- Park, J.W.; Jeong, H.J.; Jin, S.W. Effect of electric current on recrystallization kinetics in interstitial free steel and Az31 magnesium alloy. Mater. Charact. 2017, 133, 70–76. [Google Scholar] [CrossRef]
- Zhou, Y.Z.; Guo, Y.; Zhang, W. Influence of electropulsing on nucleation during phase transformation. J. Mater. Res. 2002, 17, 3012–3014. [Google Scholar] [CrossRef]
- Chen, Z.L.; Xiong, Y.F.; Li, X.W. Eliminating the brittleness constituent to enhance toughness of the high-strength steel weld heat-affected zone using electropulsing. Materials 2022, 15, 2135. [Google Scholar] [CrossRef]
- Mittemeijer, E.J. Fundamentals of Materials Science: The Microstructure Property Relationship Using Metals as Model Systems; Springer: Berlin/Heidelberg, Germany, 2010. [Google Scholar]
- Isheim, D.; Gagliano, M.S.; Fine, M.E.; Seidman, D.N. Interfacial segregation at Cu-rich precipitates in a high-strength low-carbon steel studied on a sub-nanometer scale. Acta Mater. 2006, 54, 841–849. [Google Scholar]
- Chen, Z.L.; Liu, J.M.; Qiu, H.J. Solidification crack evolution in high-strength steel welding using the extended finite element method. Materials 2020, 13, 483. [Google Scholar] [CrossRef] [Green Version]
- Ashby, M.F. Deformation of plastically non-homogeneous materials. Philos. Mag. 1970, 21, 399–424. [Google Scholar] [CrossRef]
- Pan, L.; He, W.; Gu, B.P. Effects of electric current pulse on dislocation density and residual stresses of 45 carbon steel workpieces. Trans. Mater. Heat Treat. 2015, 36, 134–138. [Google Scholar]
- Conrad, H. Thermally activated plastic flow of metals and ceramics with an electric field or current. Mater. Sci. Eng. 2002, 322, 100–107. [Google Scholar] [CrossRef]
- Xiang, S.; Zhang, X. Dislocation structure evolution under electroplastic effect. Mater. Sci. Eng. A 2019, 761, 138026. [Google Scholar] [CrossRef]
- Brewer, L.N.; Othon, M.A.; Young, L.M.; Angeliu, T.-M. Misorientation mapping for visualization of plastic deformation via electron back-scattered diffraction. Microsc. Microanal. 2002, 8, 684–685. [Google Scholar] [CrossRef]
- Calcagnotto, M.; Ponge, D.; Demir, E. Orientation gradient and geometrically necessary dislocation in ultrafine grained dual-phase steels studied by 2D and 3D EBSD. Mater. Sci. Eng. A 2010, 527, 2738–2746. [Google Scholar] [CrossRef]
- Yang, M.H.; Zhang, Z.; Liu, Y.R.; Li, L.P.; Huang, J.K. Fine-grain heat affected zone softening of G115/Sanicro25 dissimilar steel welded joints after post-weld heat treatment. Int. J. Pres. Ves. Pip. 2020, 188, 104253. [Google Scholar] [CrossRef]


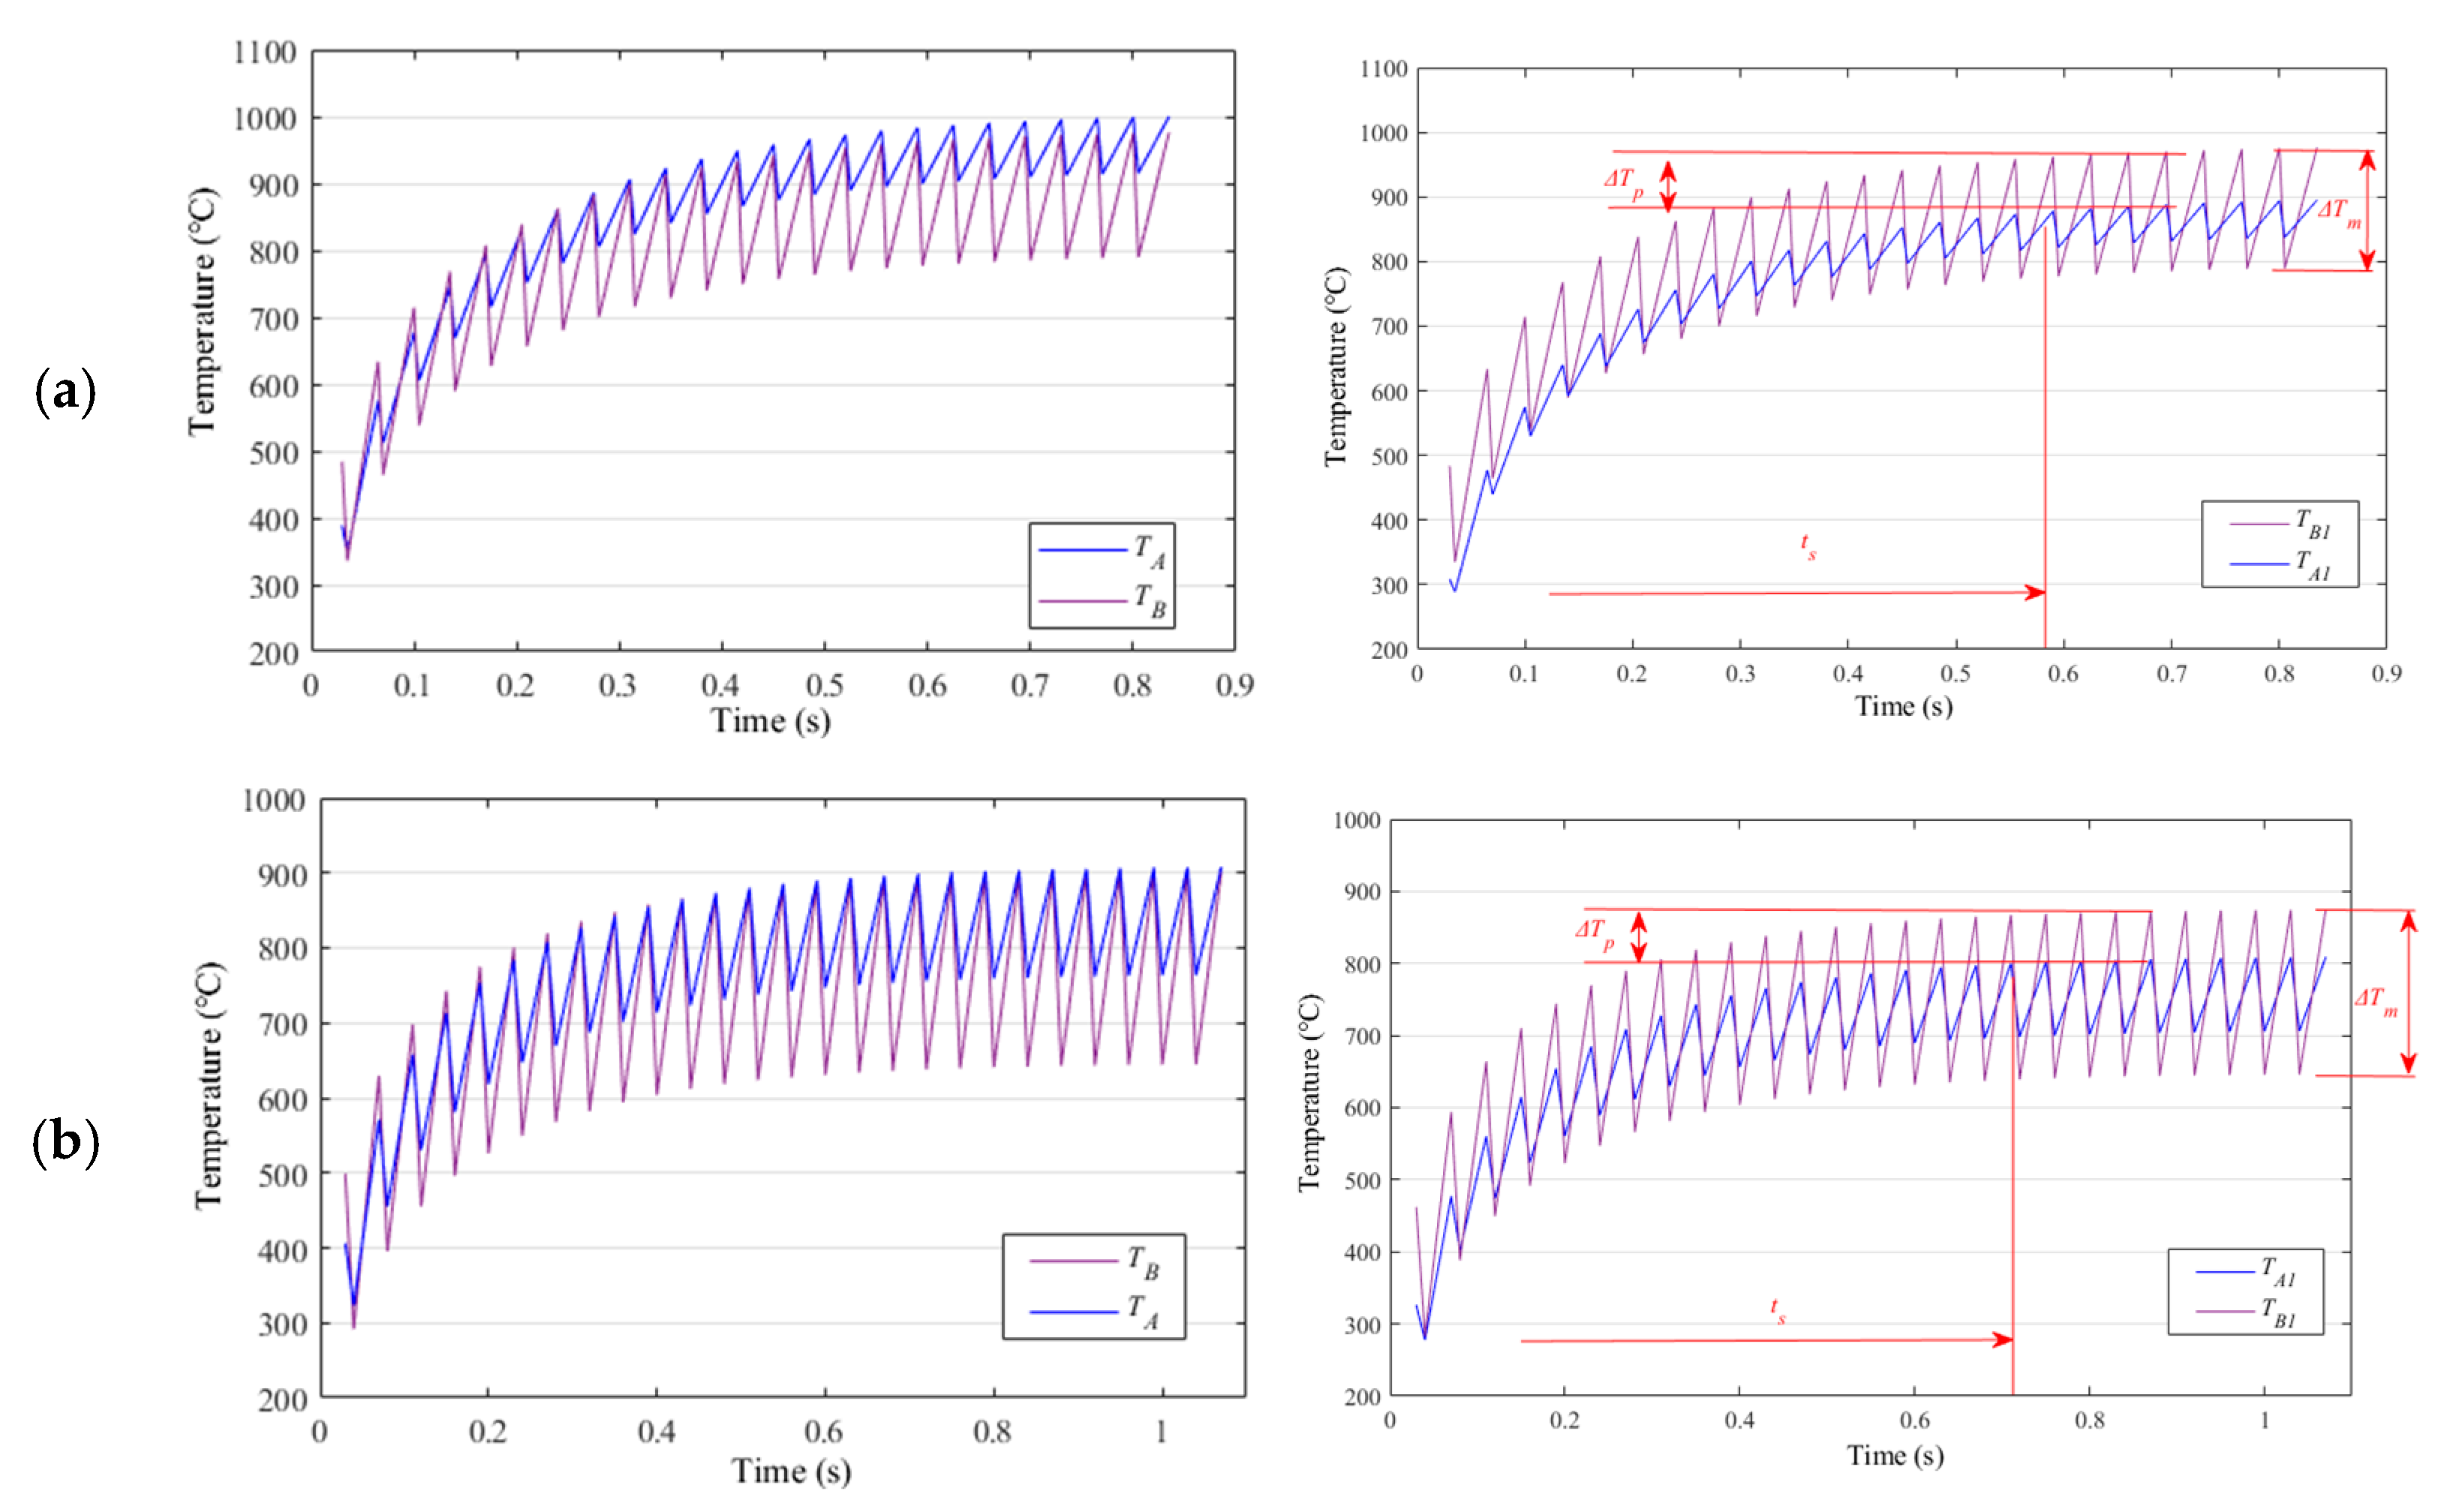
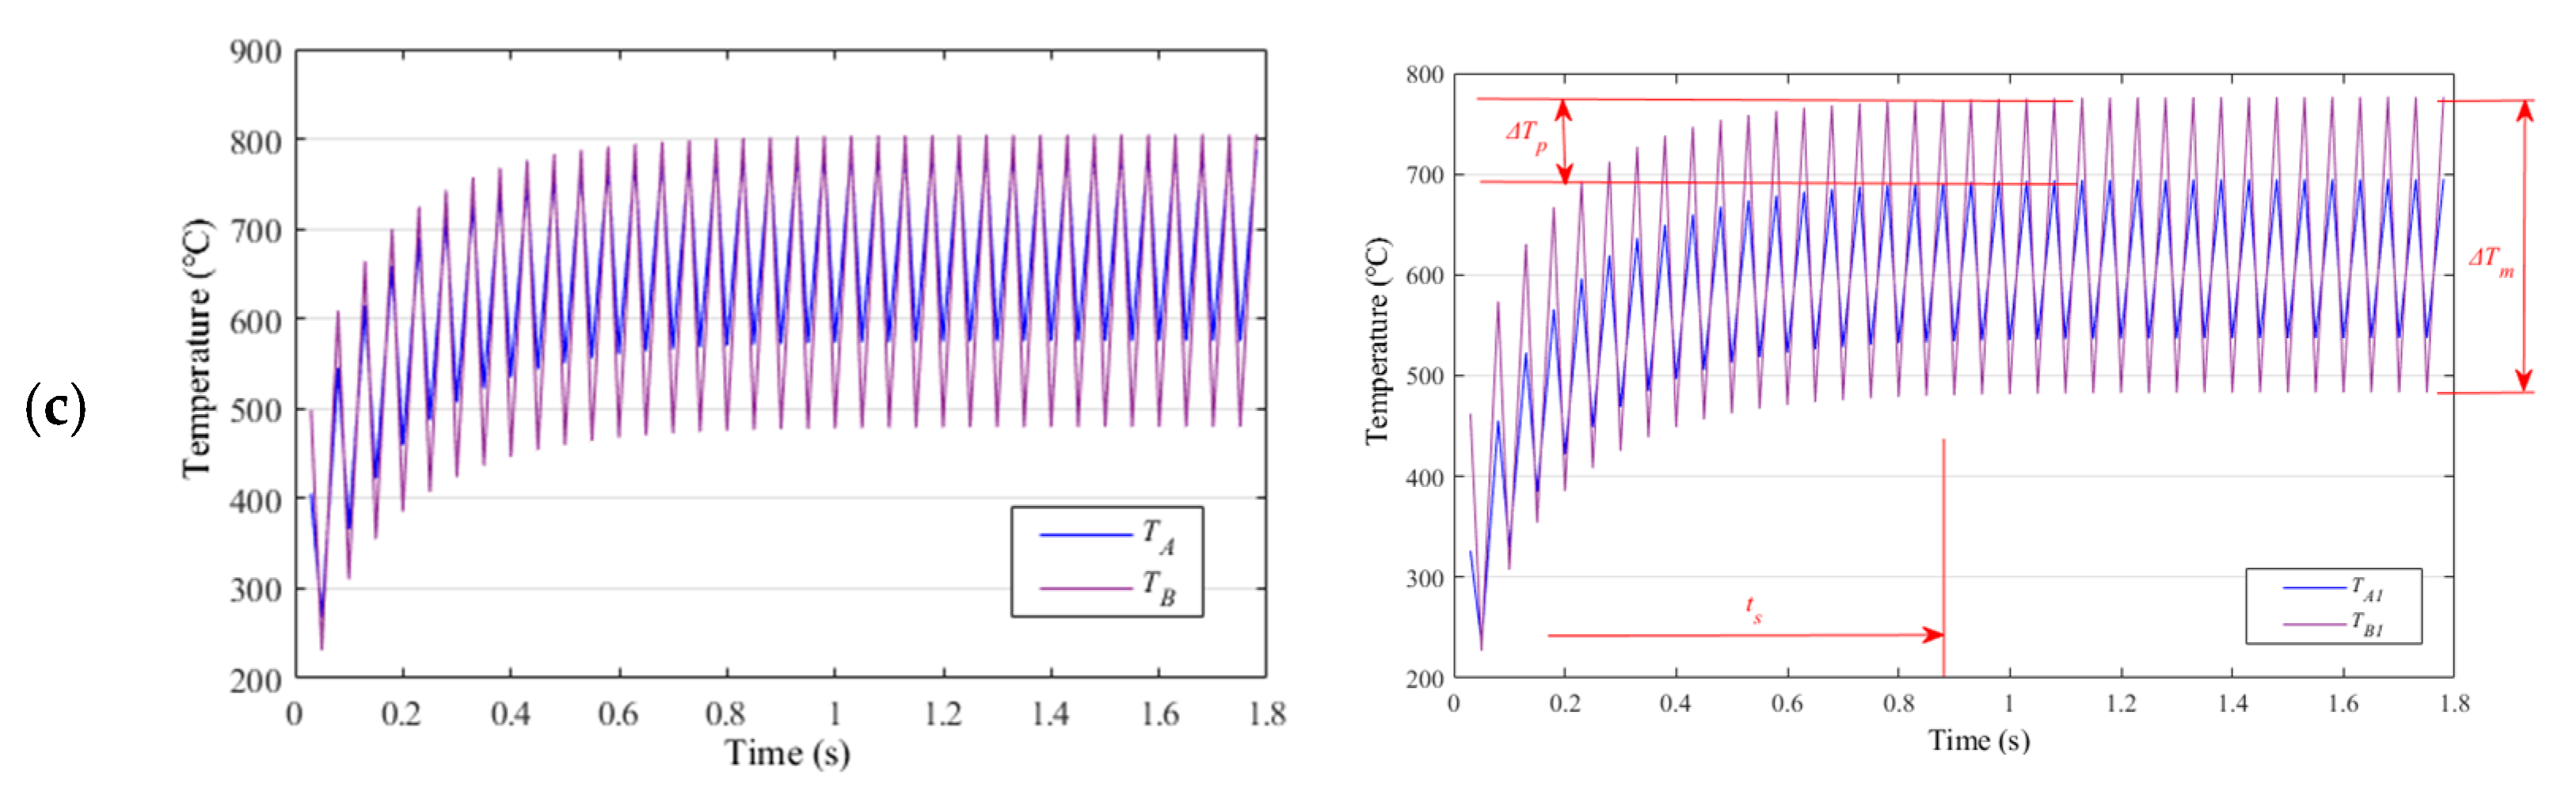
| Subcases (s) | Temperature Difference between A1 and B1 (℃) | Max. Temperature at A (℃) | Max. Temperature at B (℃) | Half-Width Experiencing Thermal Cycle above 400 ℃ (mm) | Total EPT (s) |
|---|---|---|---|---|---|
| 0.035 | 55 | 895 | 1000 | 7.0 | 0.59 |
| 0.040 | 66 | 808 | 907 | 5.7 | 0.66 |
| 0.050 | 92 | 695 | 804 | 4.6 | 0.84 |
| Density. j (A/mm2) | Pulse Period. | Pulse Duration. | Pulse Number. n | EPT Time |
|---|---|---|---|---|
| 1400 | 0.035 | 0.03 | 17 | 0.59 |
| Process | ΔHVex (Experimental) | ΔHVes (Estimated) | Matrix Evolution | Matrix Refinement | DD | GND |
|---|---|---|---|---|---|---|
| As-welded | −33 | −30.8 | - | −30.8 | - | - |
| EP-treated | 51 | 58 | 7 | 37 | −0.1 | 14 |
| tp (s) | Temperature °C | εA | σA (MPa) |
|---|---|---|---|
| 0.035 | 895 | 0.0593 | 62.1 |
| 0.04 | 808 | 0.0361 | 75.9 |
| 0.05 | 695 | 0.016 | 117.0 |
Publisher’s Note: MDPI stays neutral with regard to jurisdictional claims in published maps and institutional affiliations. |
© 2022 by the authors. Licensee MDPI, Basel, Switzerland. This article is an open access article distributed under the terms and conditions of the Creative Commons Attribution (CC BY) license (https://creativecommons.org/licenses/by/4.0/).
Share and Cite
Xiong, Y.; Li, Z.; Liu, T. Toughening and Hardening Limited Zone of High-Strength Steel through Geometrically Necessary Dislocation When Exposed to Electropulsing. Materials 2022, 15, 5847. https://doi.org/10.3390/ma15175847
Xiong Y, Li Z, Liu T. Toughening and Hardening Limited Zone of High-Strength Steel through Geometrically Necessary Dislocation When Exposed to Electropulsing. Materials. 2022; 15(17):5847. https://doi.org/10.3390/ma15175847
Chicago/Turabian StyleXiong, Yunfeng, Zongmin Li, and Tao Liu. 2022. "Toughening and Hardening Limited Zone of High-Strength Steel through Geometrically Necessary Dislocation When Exposed to Electropulsing" Materials 15, no. 17: 5847. https://doi.org/10.3390/ma15175847
APA StyleXiong, Y., Li, Z., & Liu, T. (2022). Toughening and Hardening Limited Zone of High-Strength Steel through Geometrically Necessary Dislocation When Exposed to Electropulsing. Materials, 15(17), 5847. https://doi.org/10.3390/ma15175847