
Analysis of The Working Performance of Large Curvature Prestressed Concrete Box Girder Bridges

 ,
,
Abstract
:1. Introduction
2. Analysis Method of the Stressing State of Box Girder Model
2.1. Retrospective for the Computational Theory of Curved Bridges
2.2. Modeling and Theory of Stressing States of Curved Box Girder Bridges
2.3. The Method of Non-Sample Point Interpolation
- For the shape function Ni, it has a value of 1 at node i and is bounded at all remaining nodes;
- The continuity of physical quantities between adjacent elements should be guaranteed. It must have at least C0-continuity to form a smooth displacement field;
- The shape function must contain linear terms to satisfy the constant strain condition. In other words, to make the shape function have a simple mathematical form, priority should be given to the lower polynomial;
- The shape functions can be linear systems but must satisfy that their sum is equal to the constant one, i.e., ∑Ni =1.
3. Experimental Bridge Model
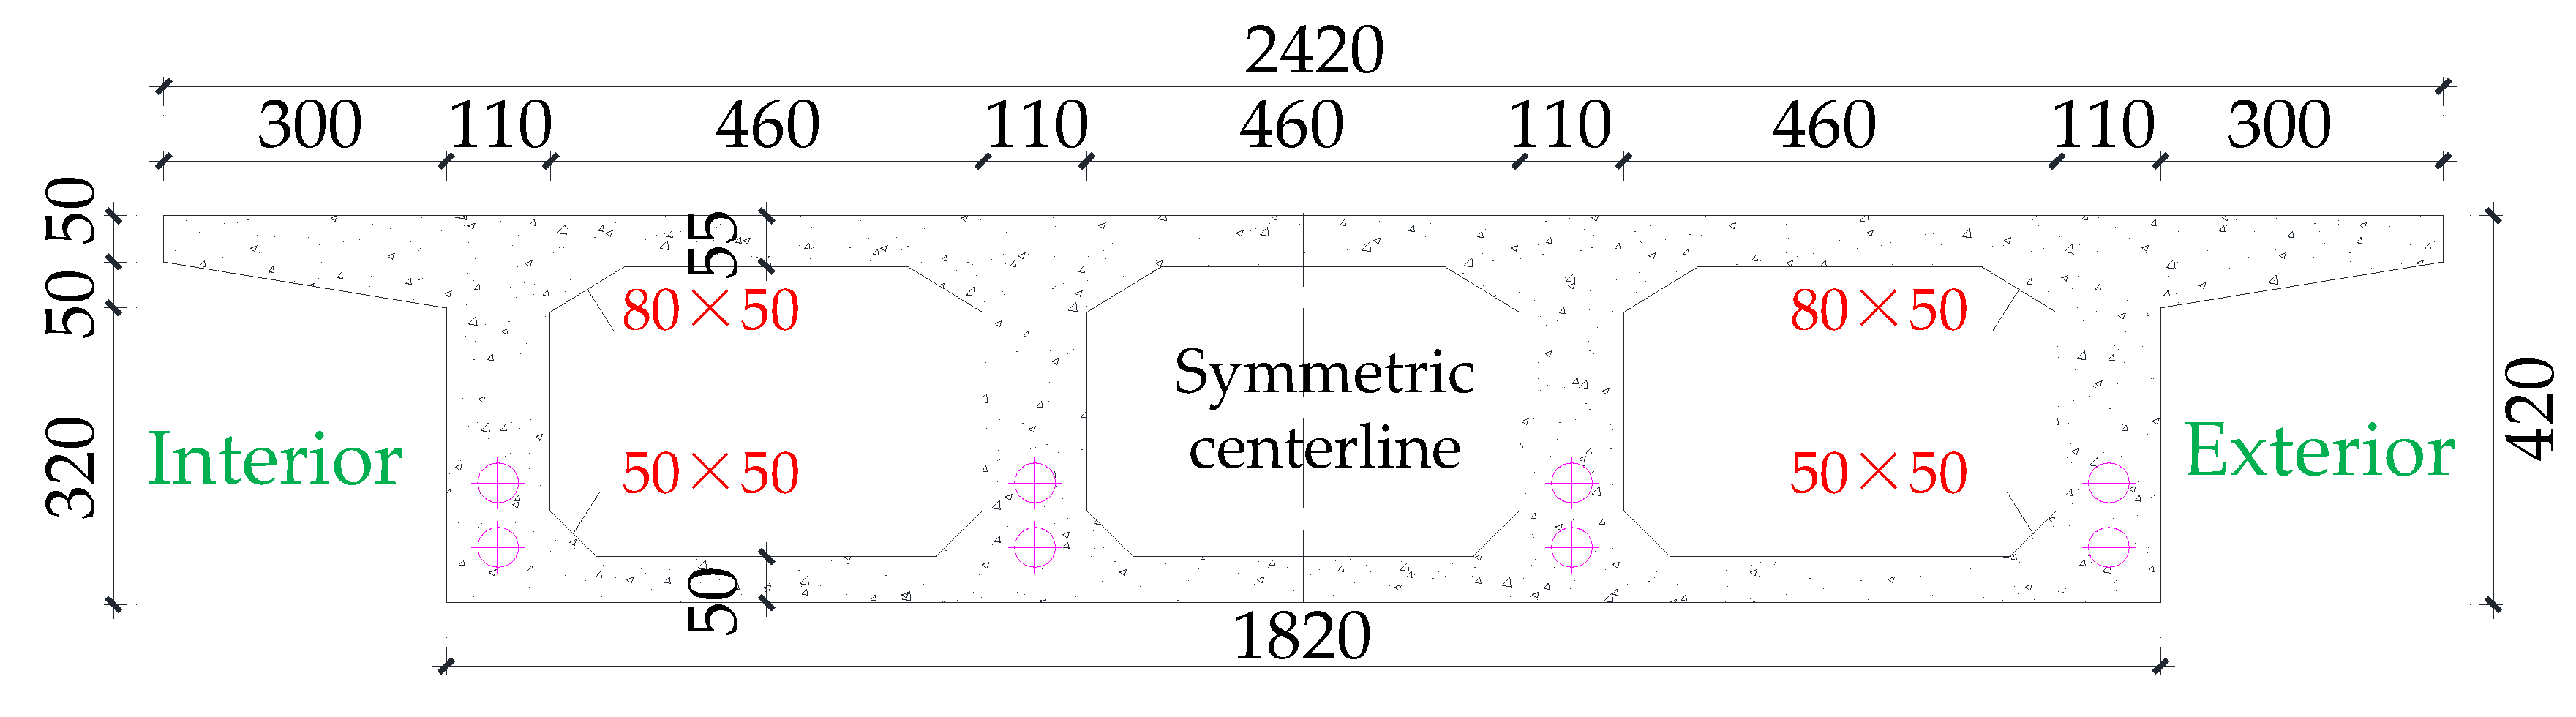
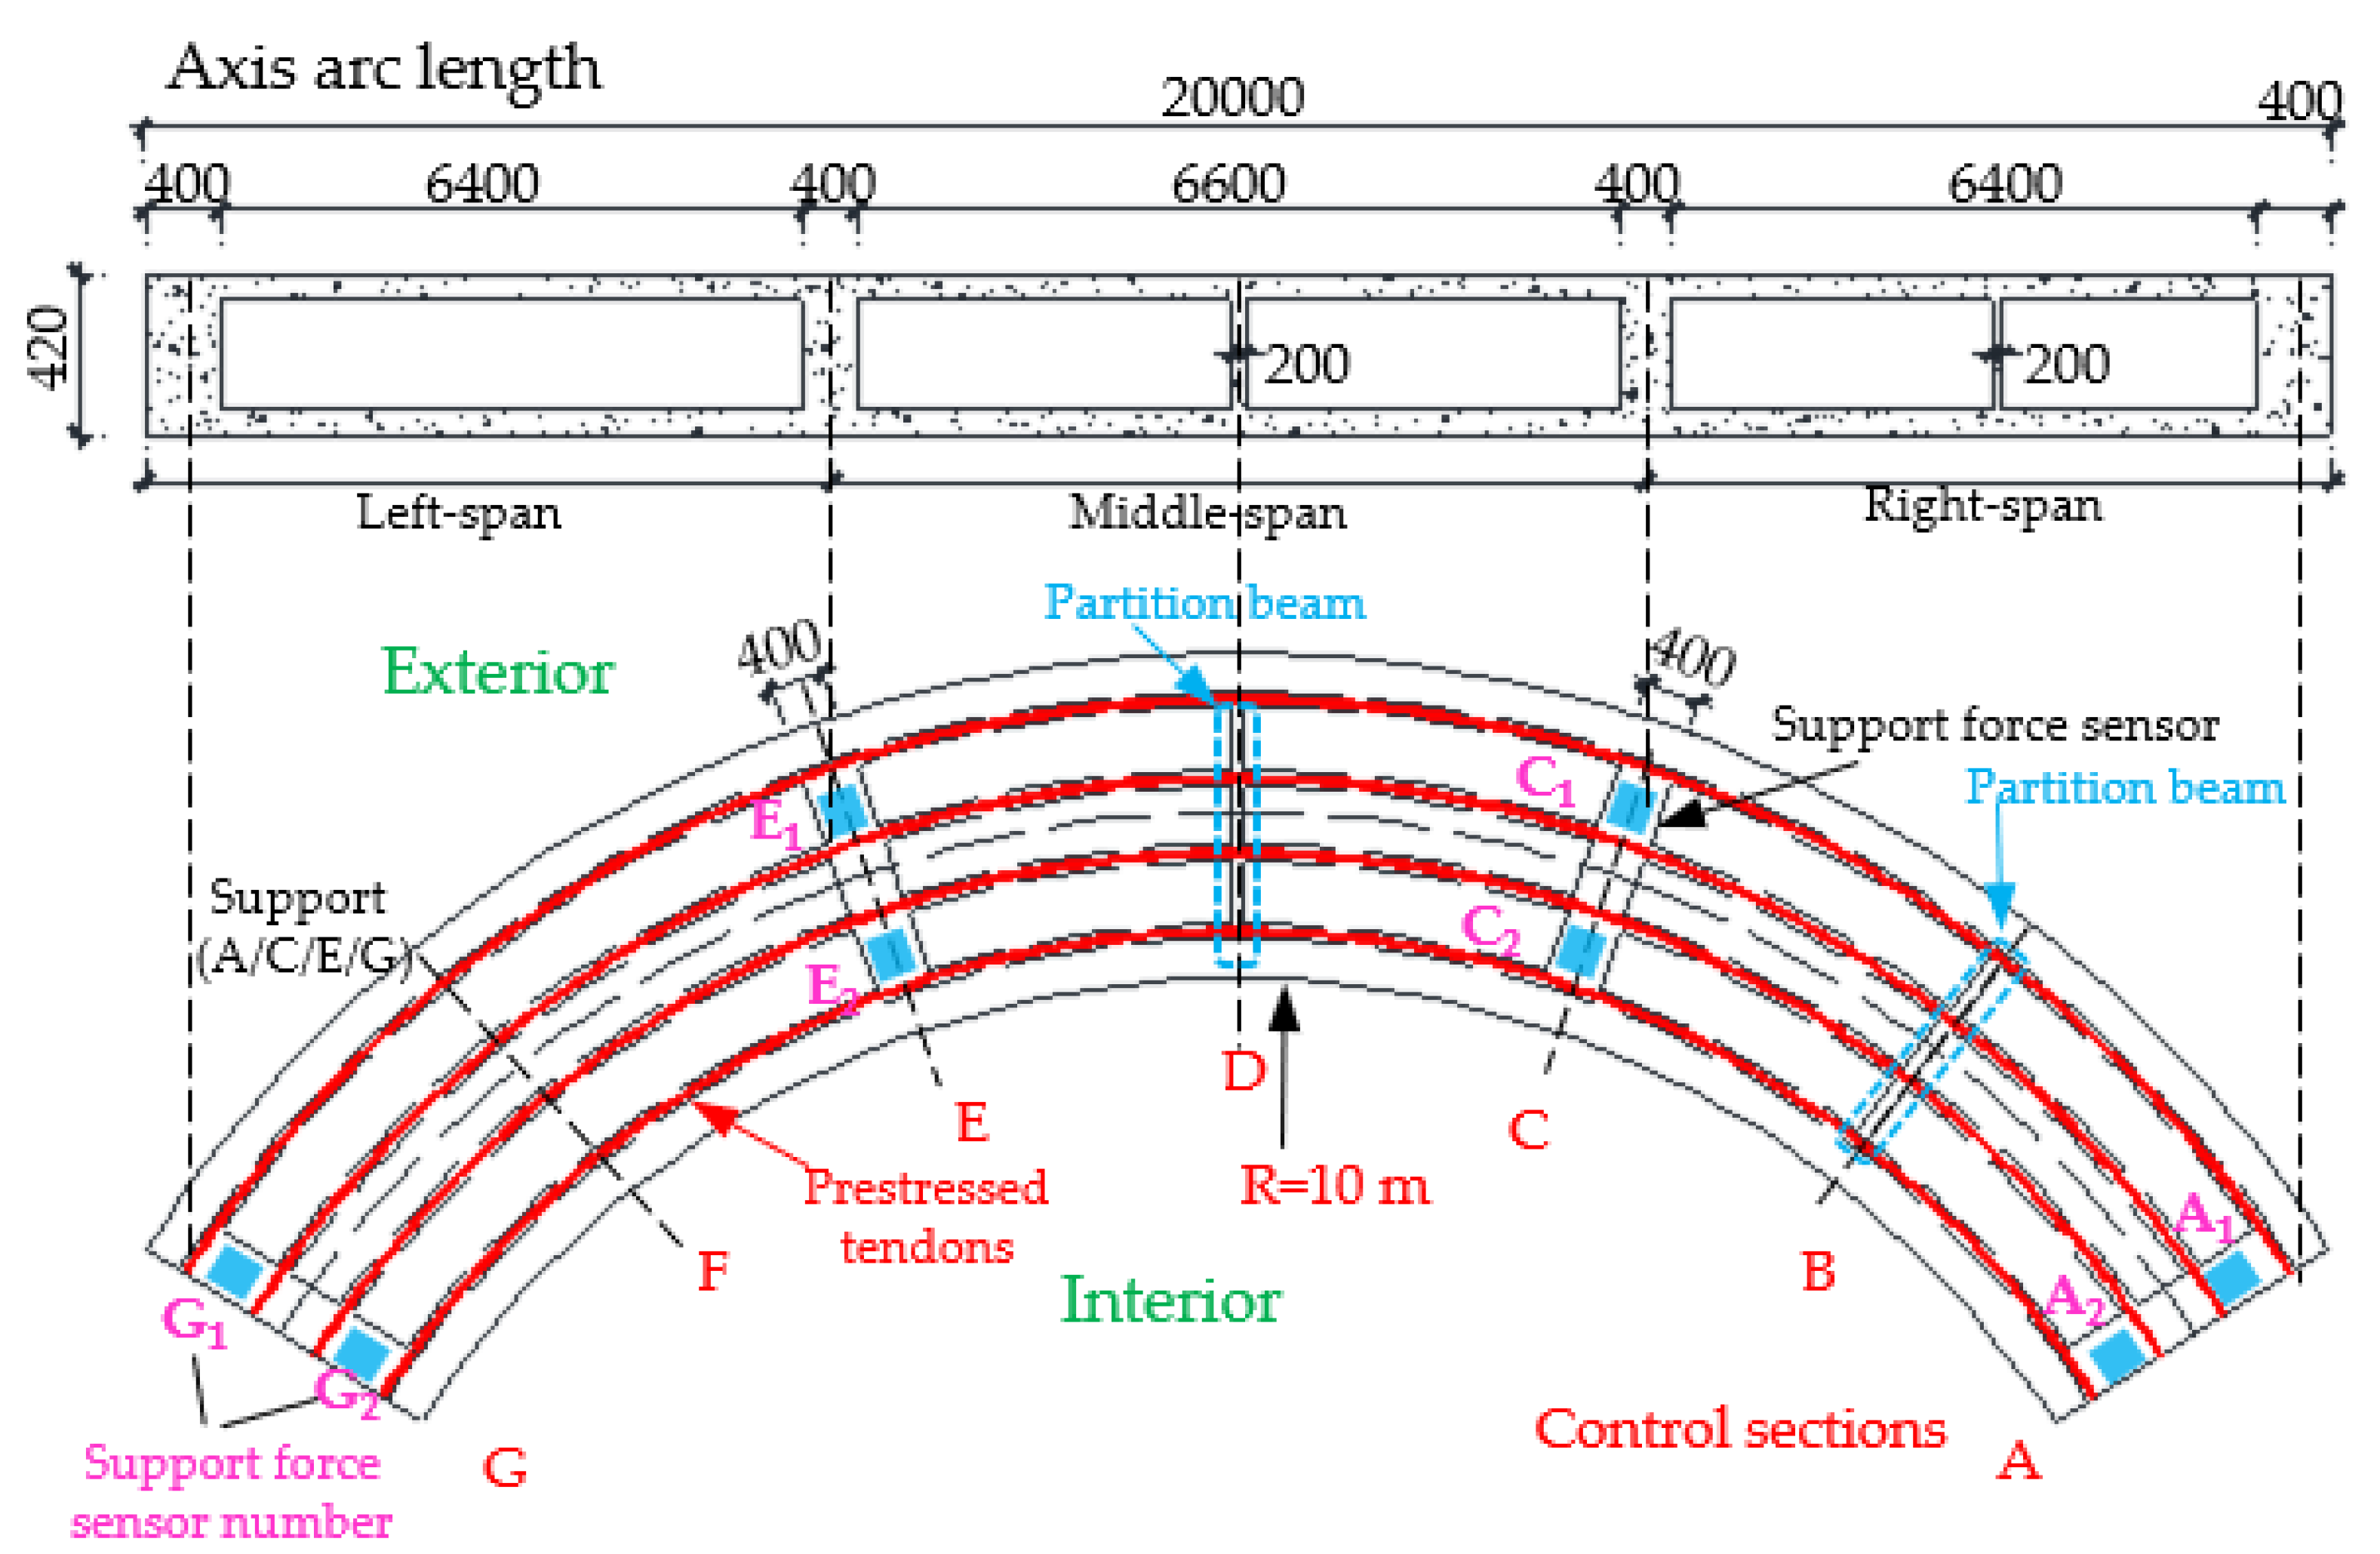
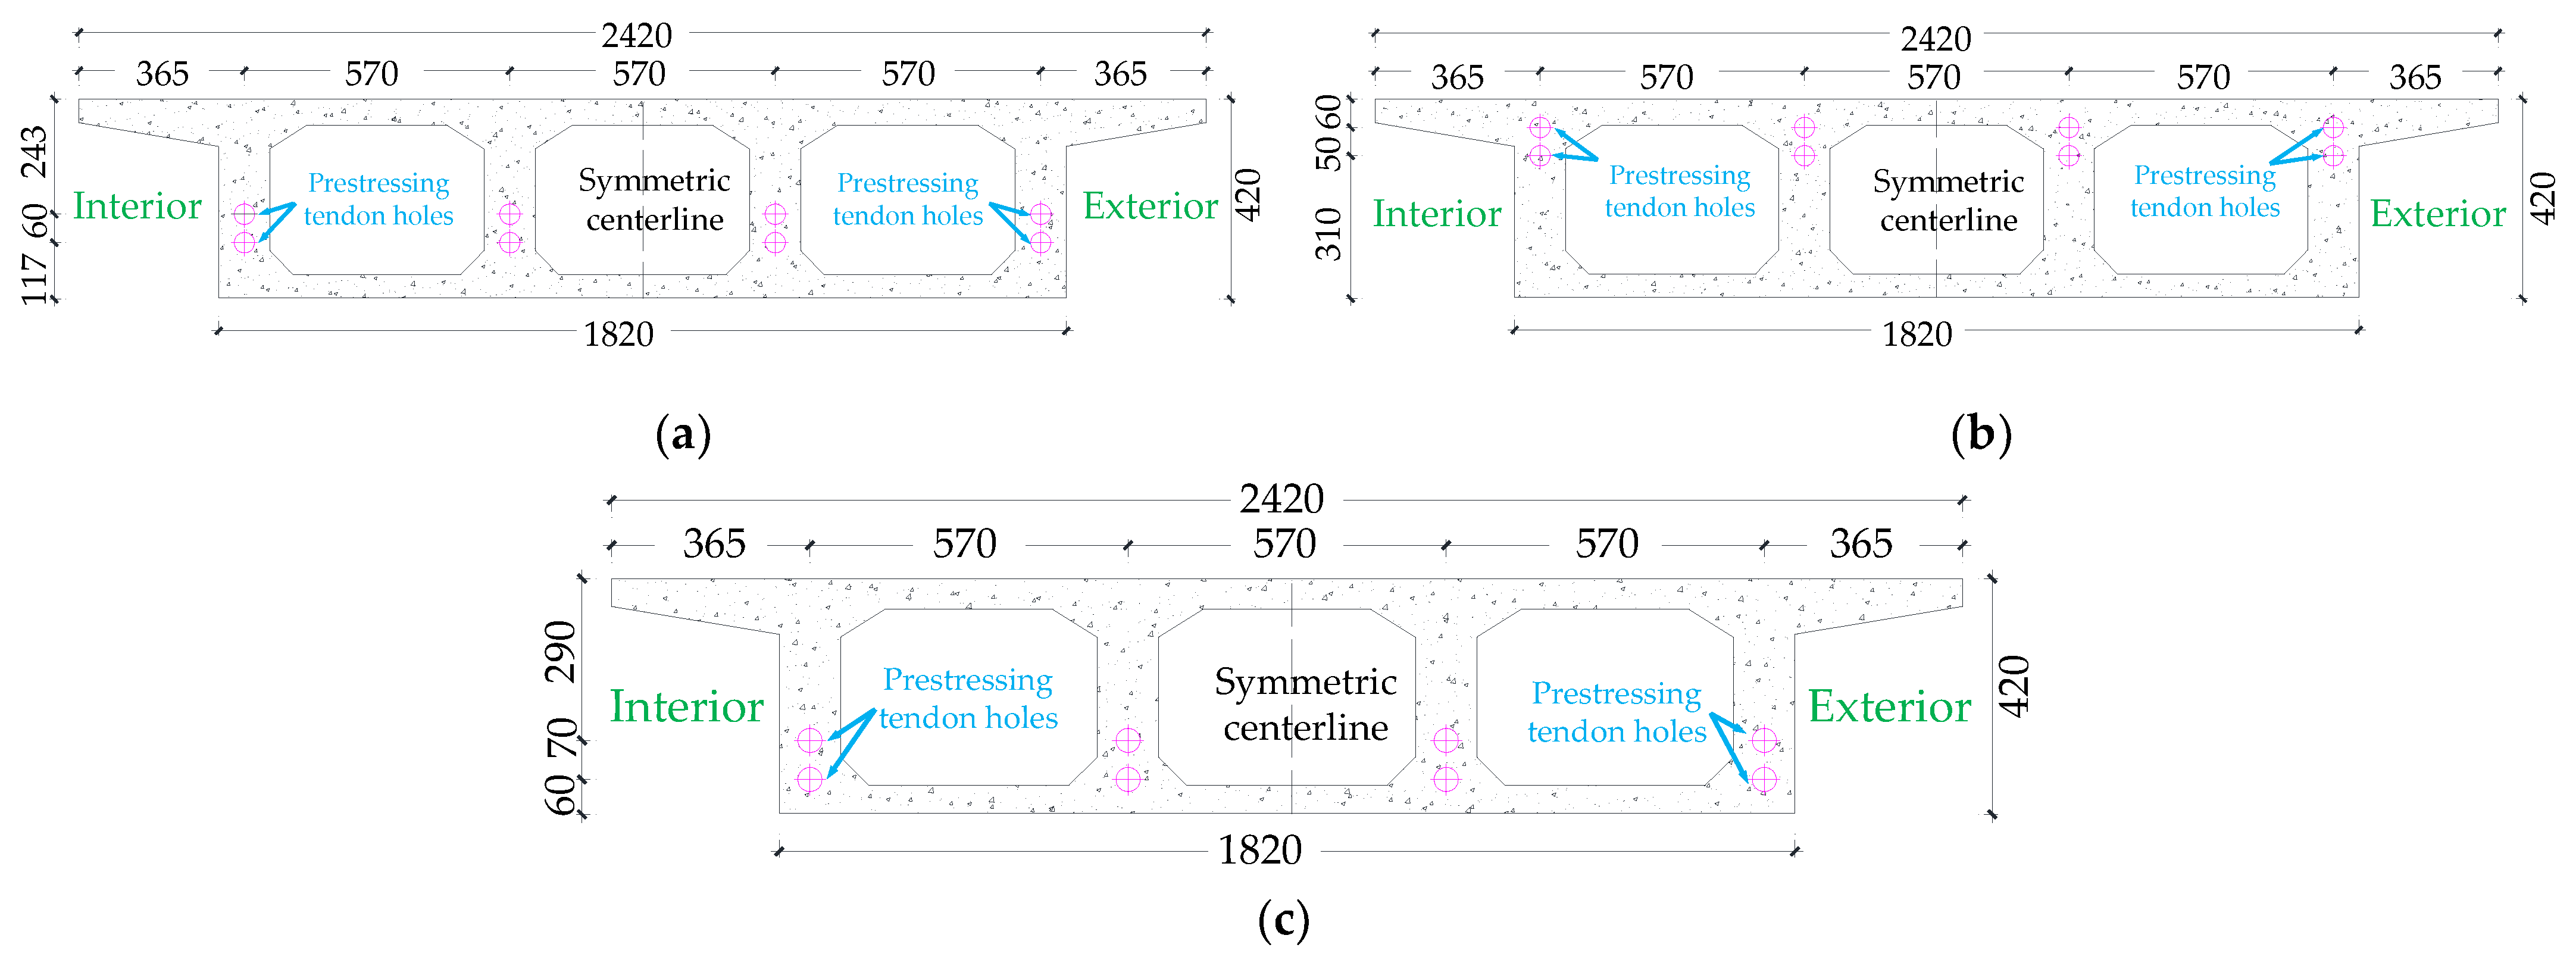
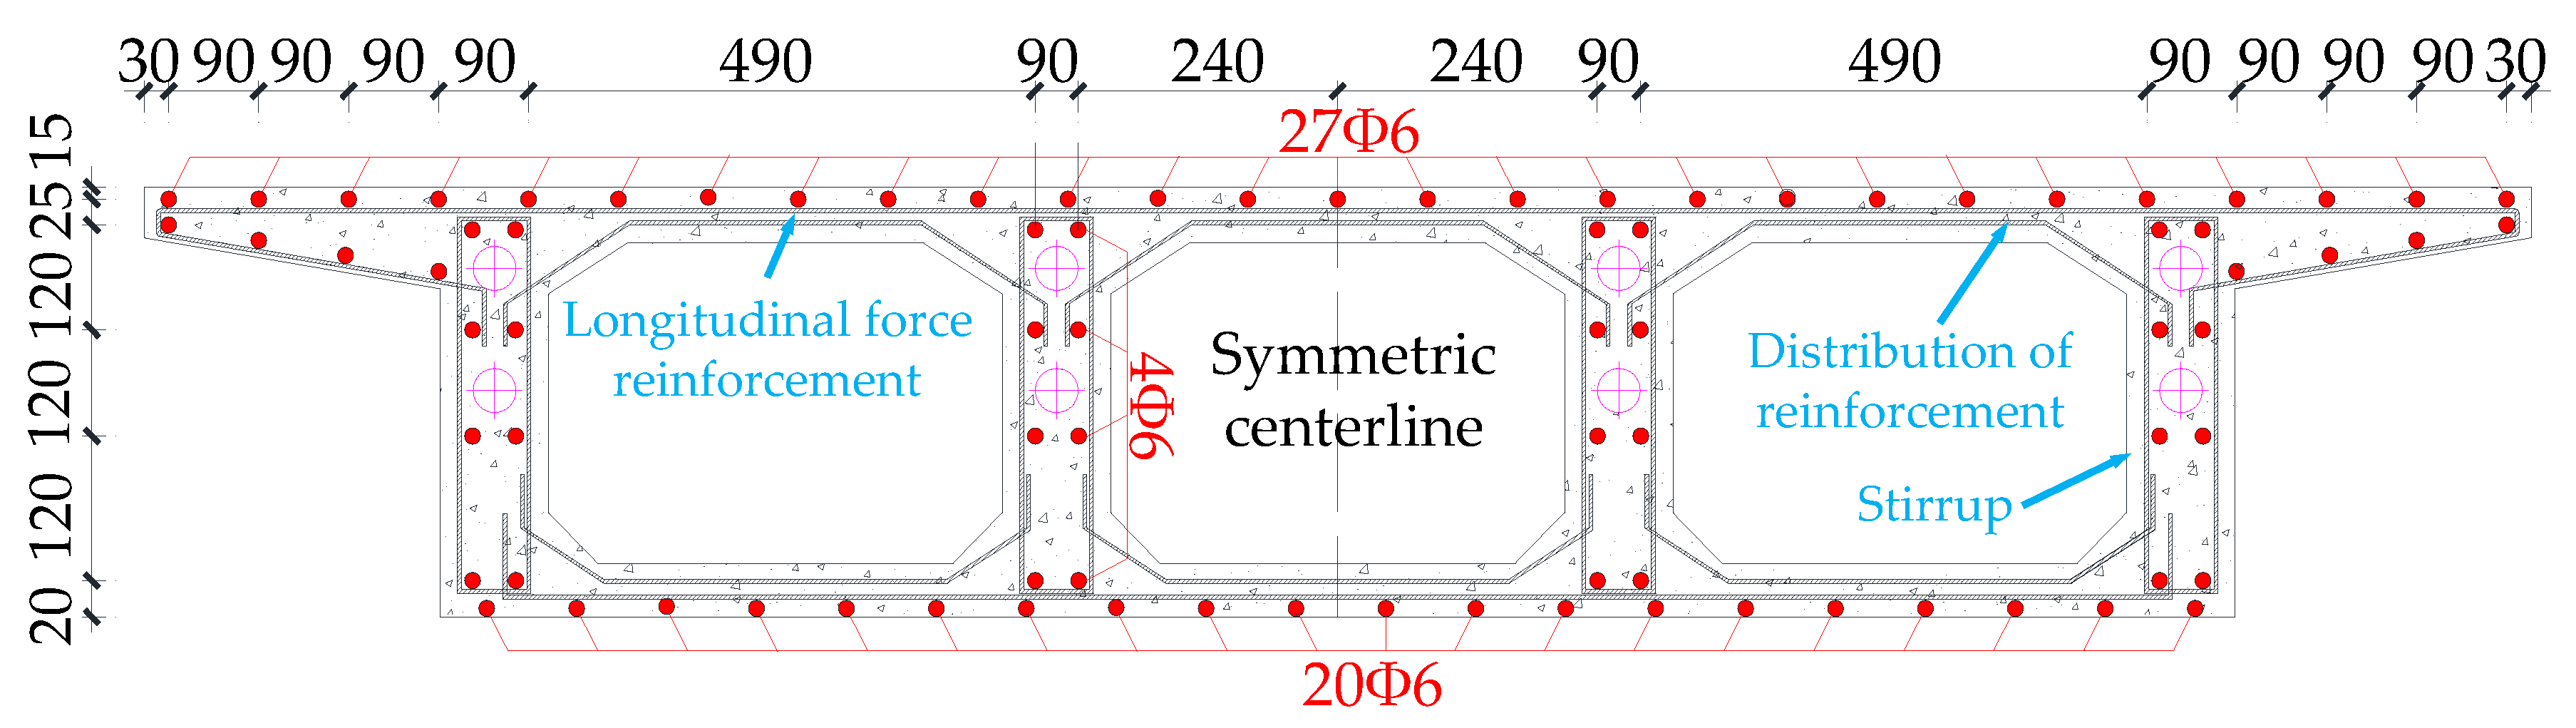
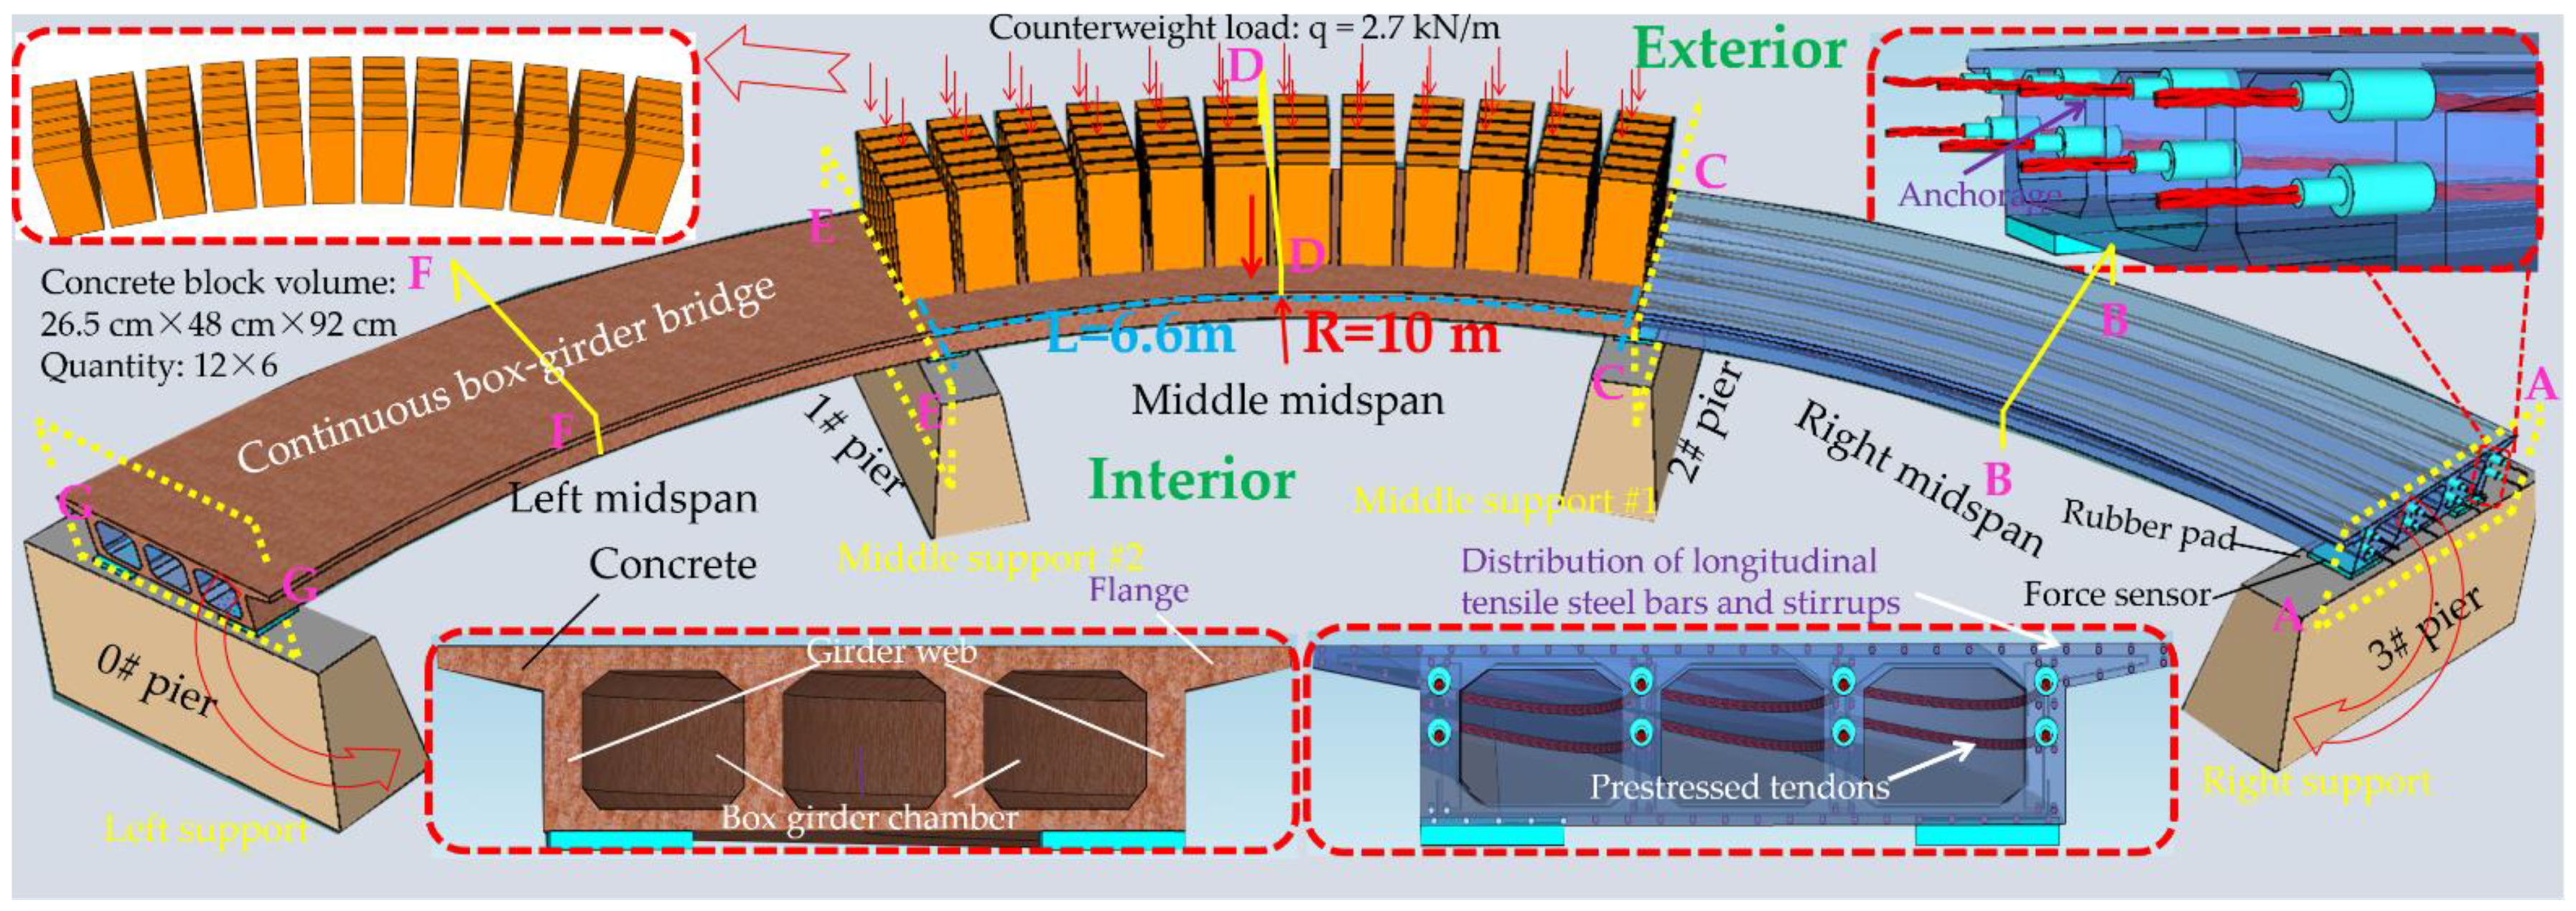
3.1. Configuration of CPCBG Bridge
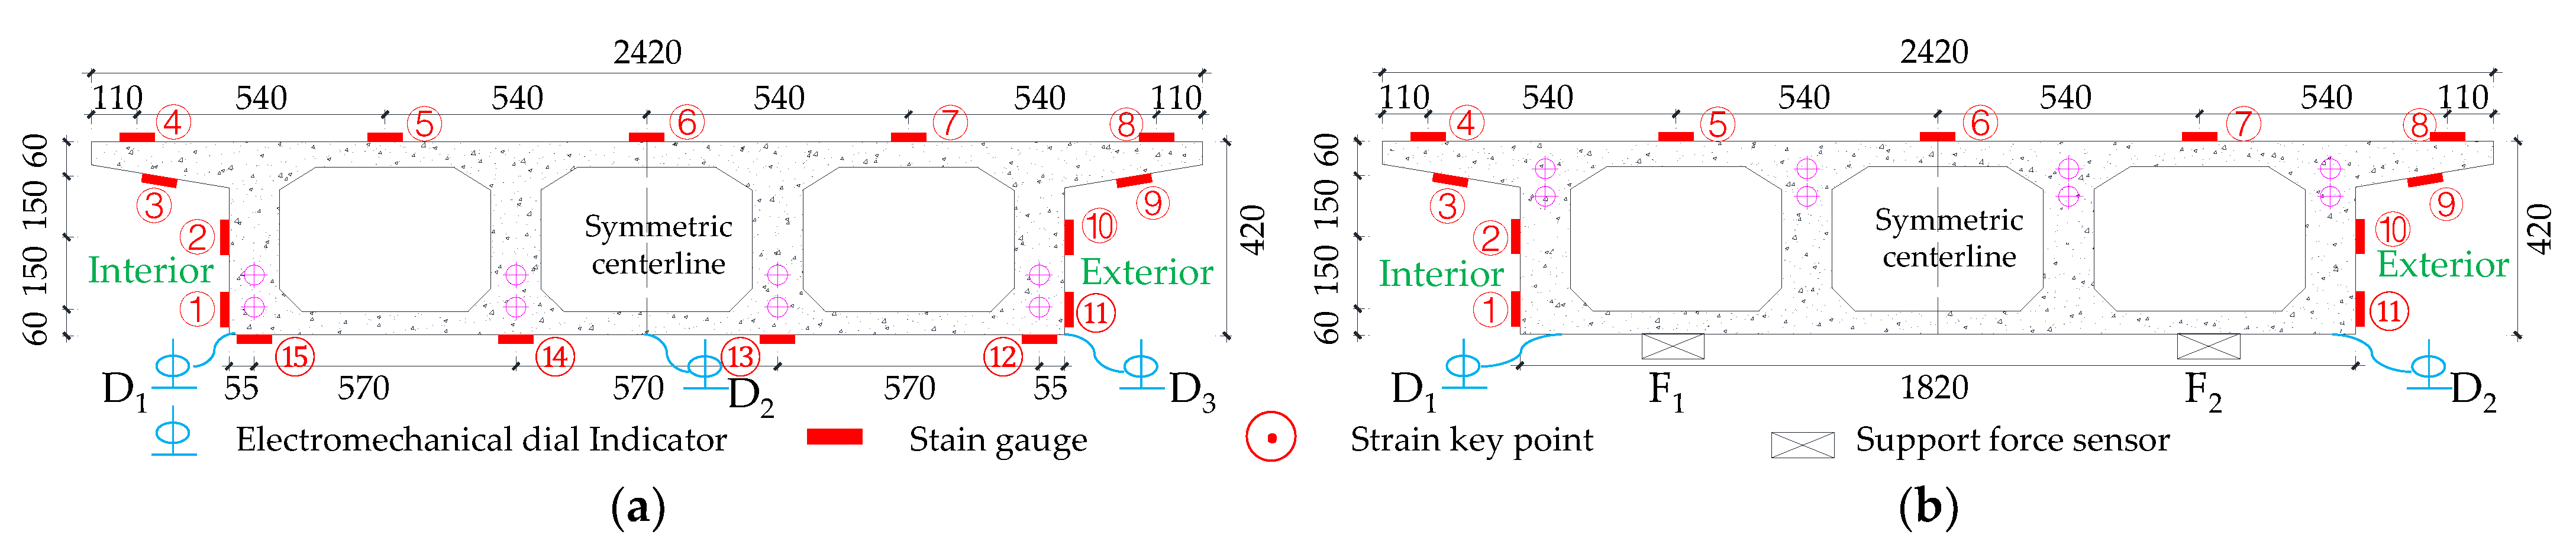
3.2. Control Sectional Measurement Content
3.3. Loading Scheme and Test Conditions
- Setting up eight loading cases, as shown in Table 5, to study the effects of the model bridge under constant load, live load and prestressing;
- To superimpose each constant load condition to obtain the effect of the control section of the whole bridge under constant load.
4. Stressing State Analysis of Large Curvature Prestressed Concrete Curved Box Girder Bridge with Different Loading Cases
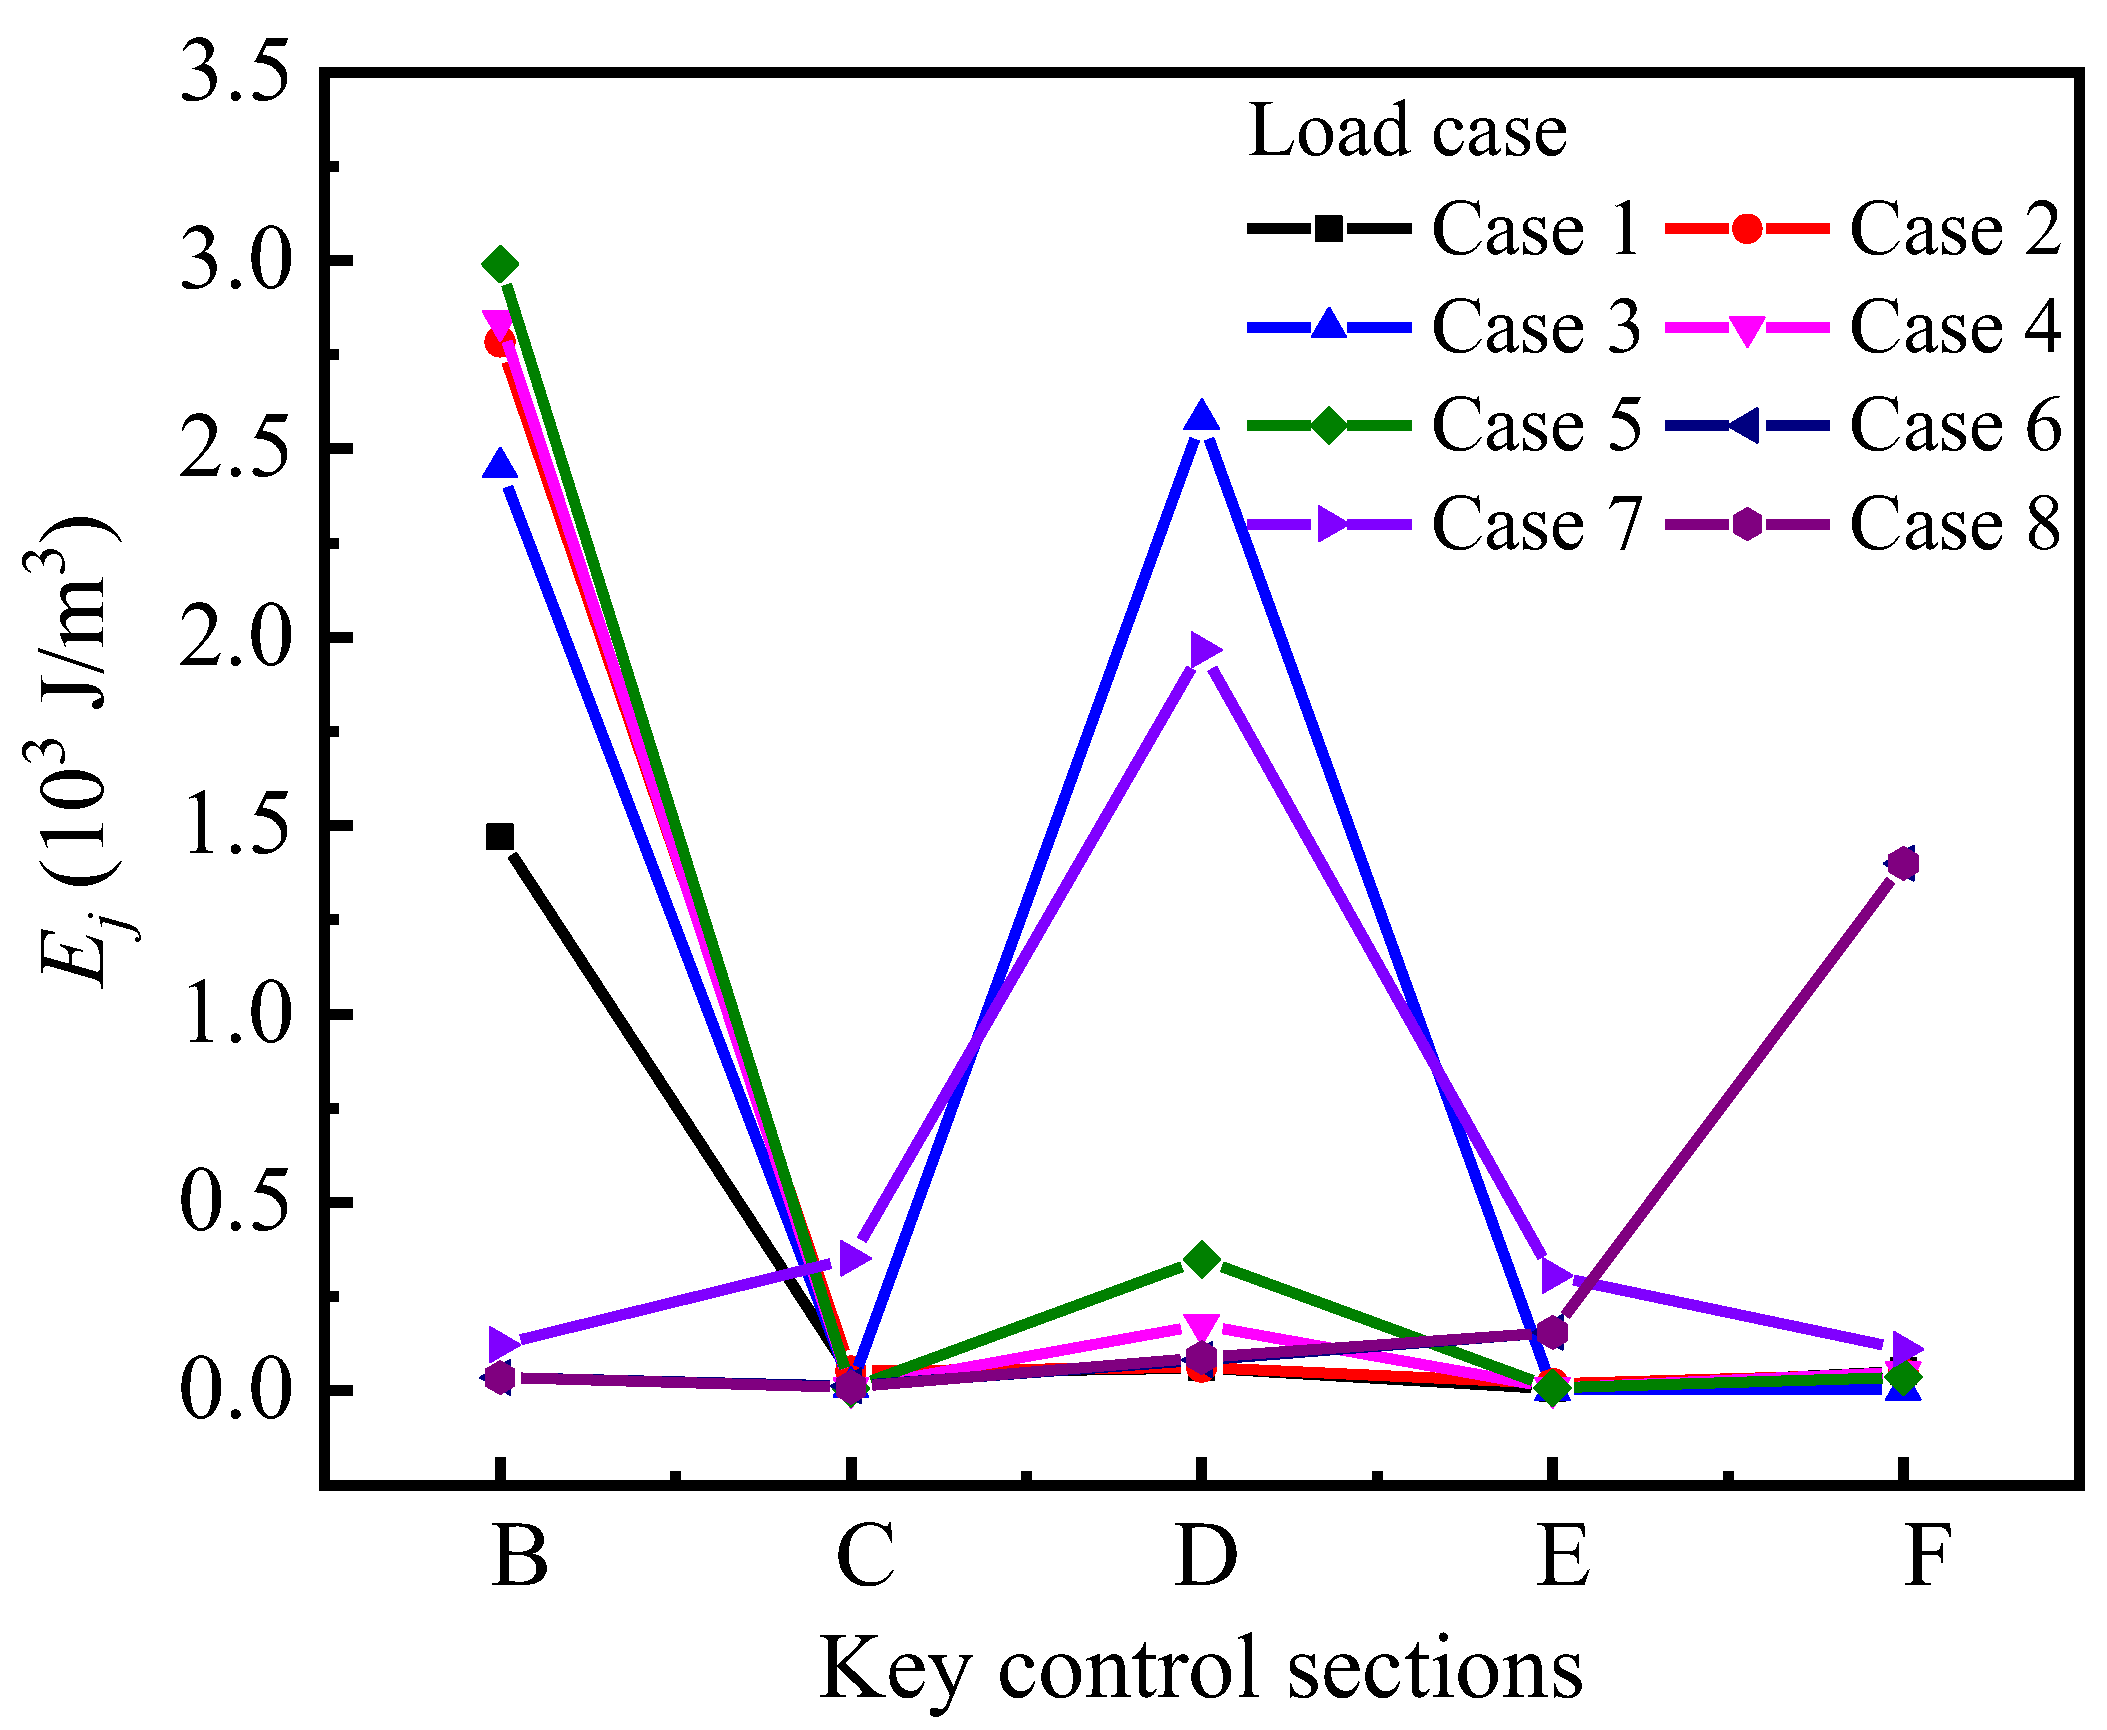
4.1. Investigation into the Sum of GSED (Esum) with Different Loading Cases
4.2. Stressing State Distribution Model
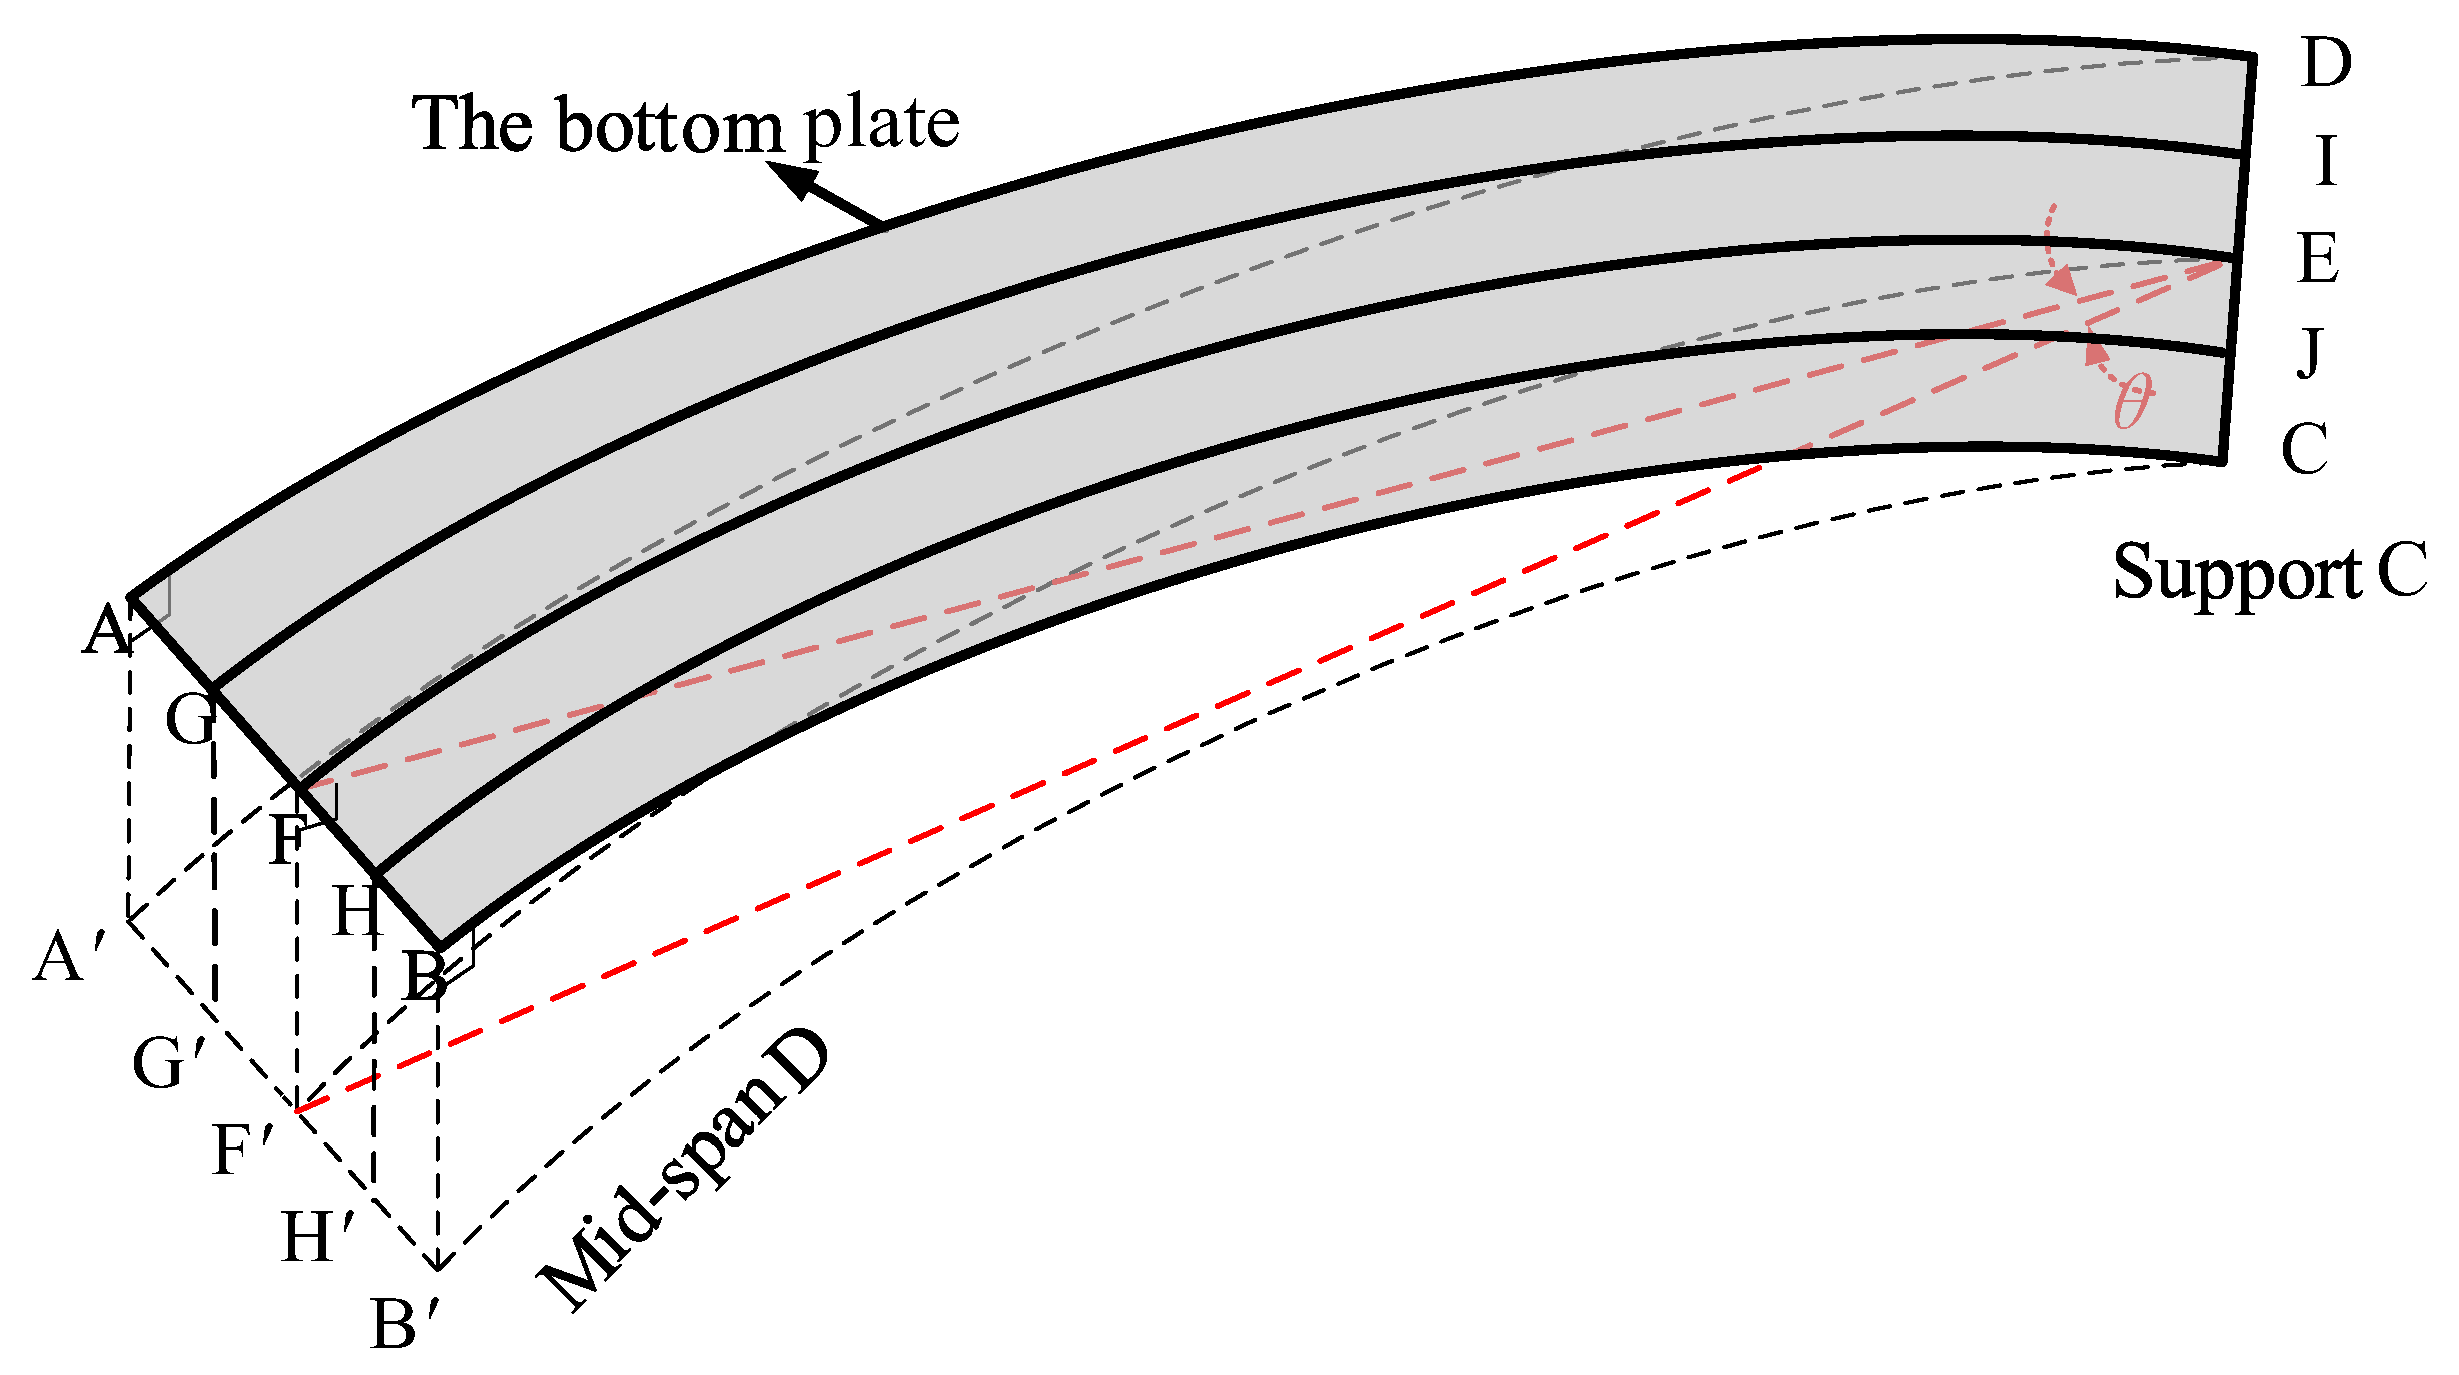
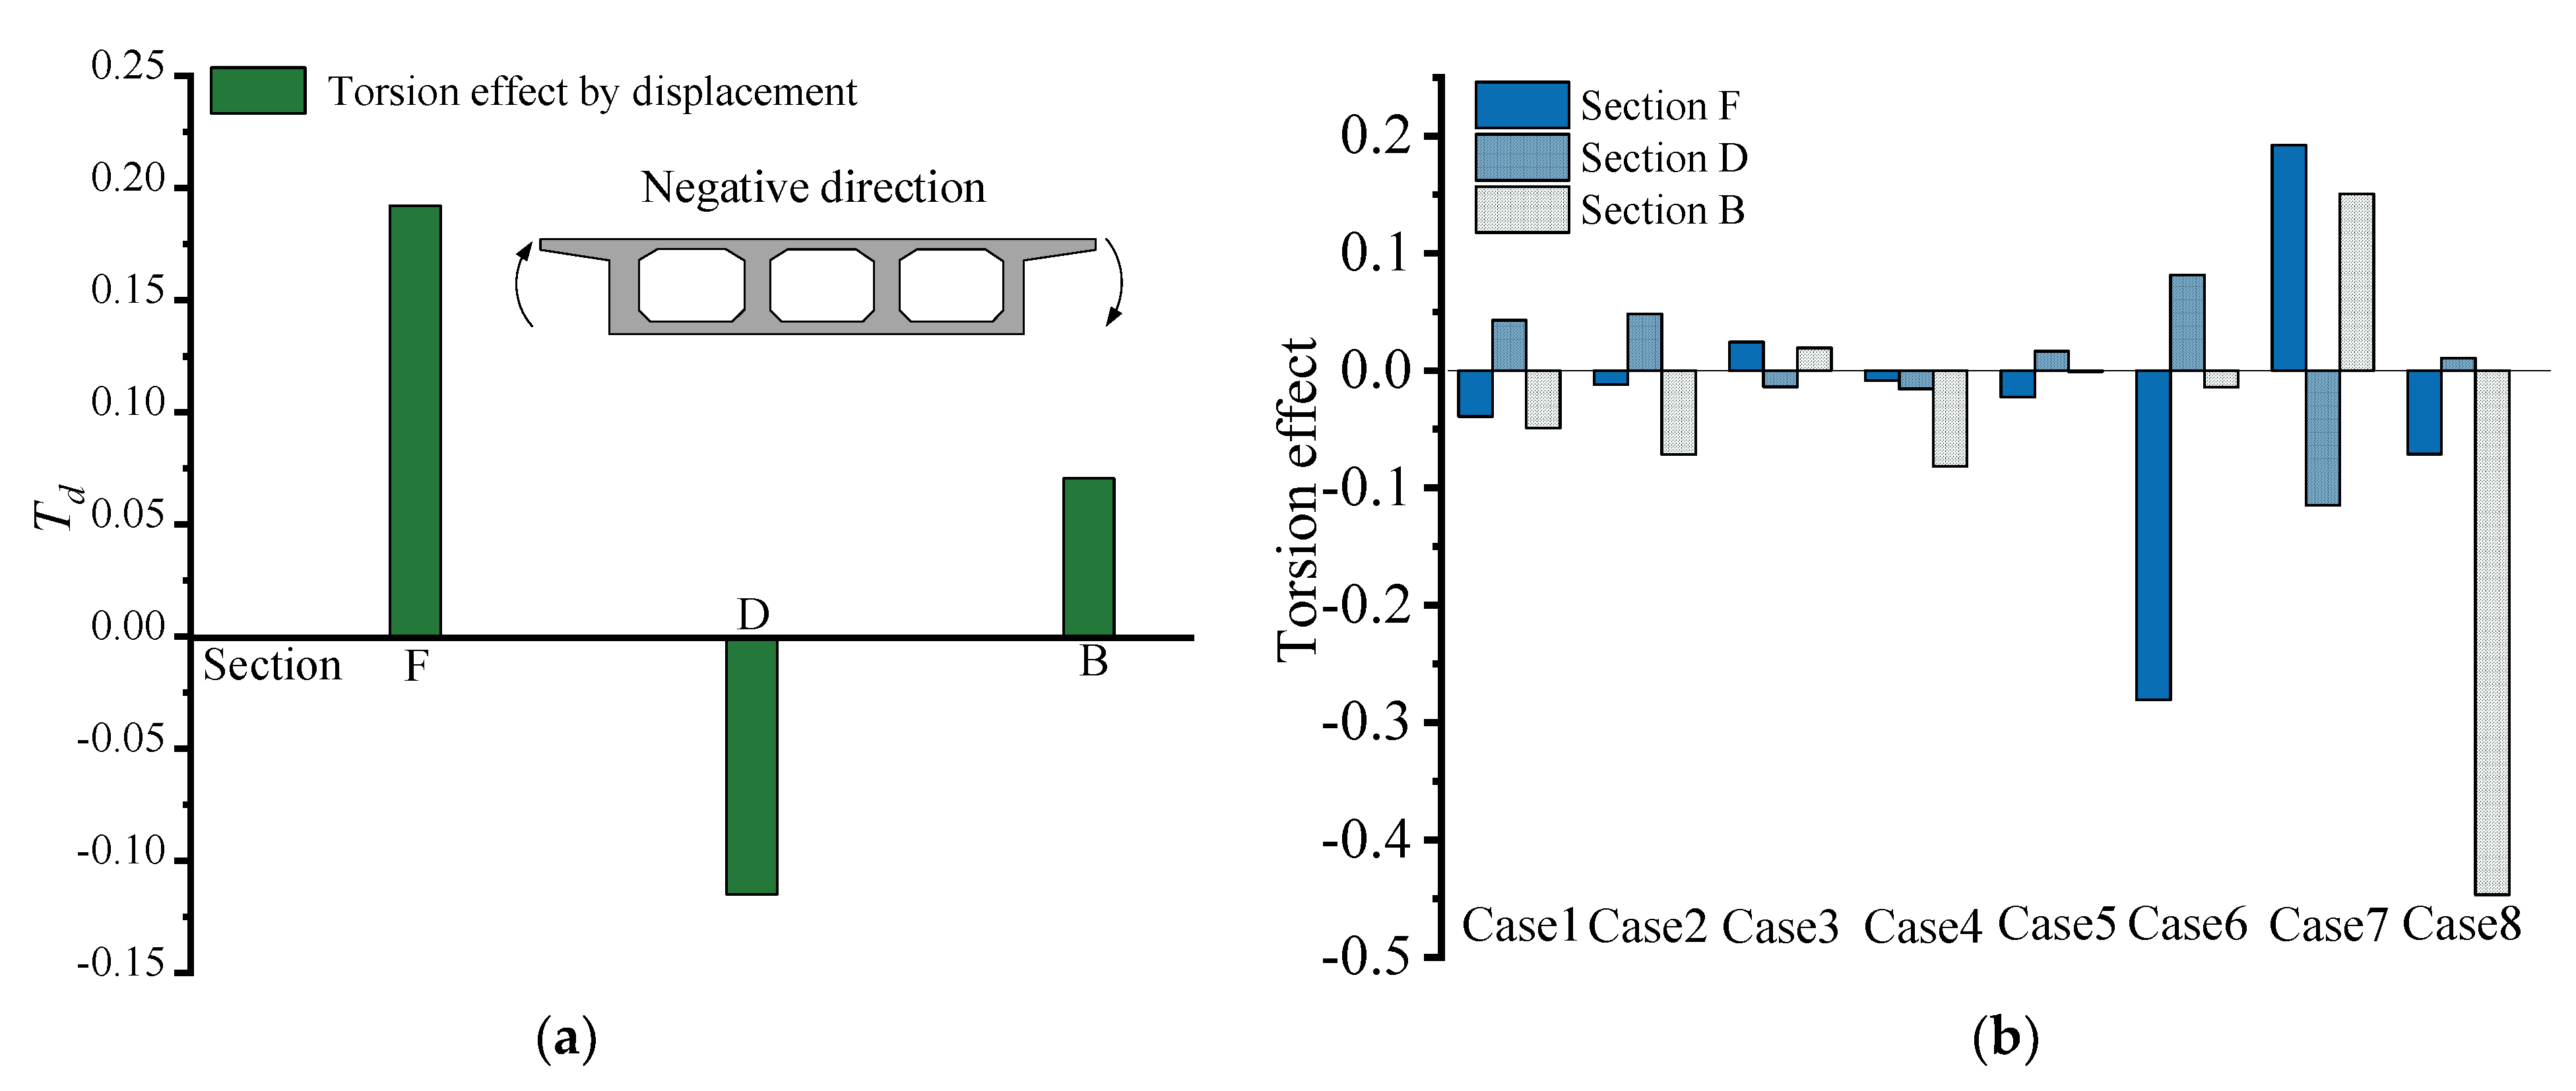
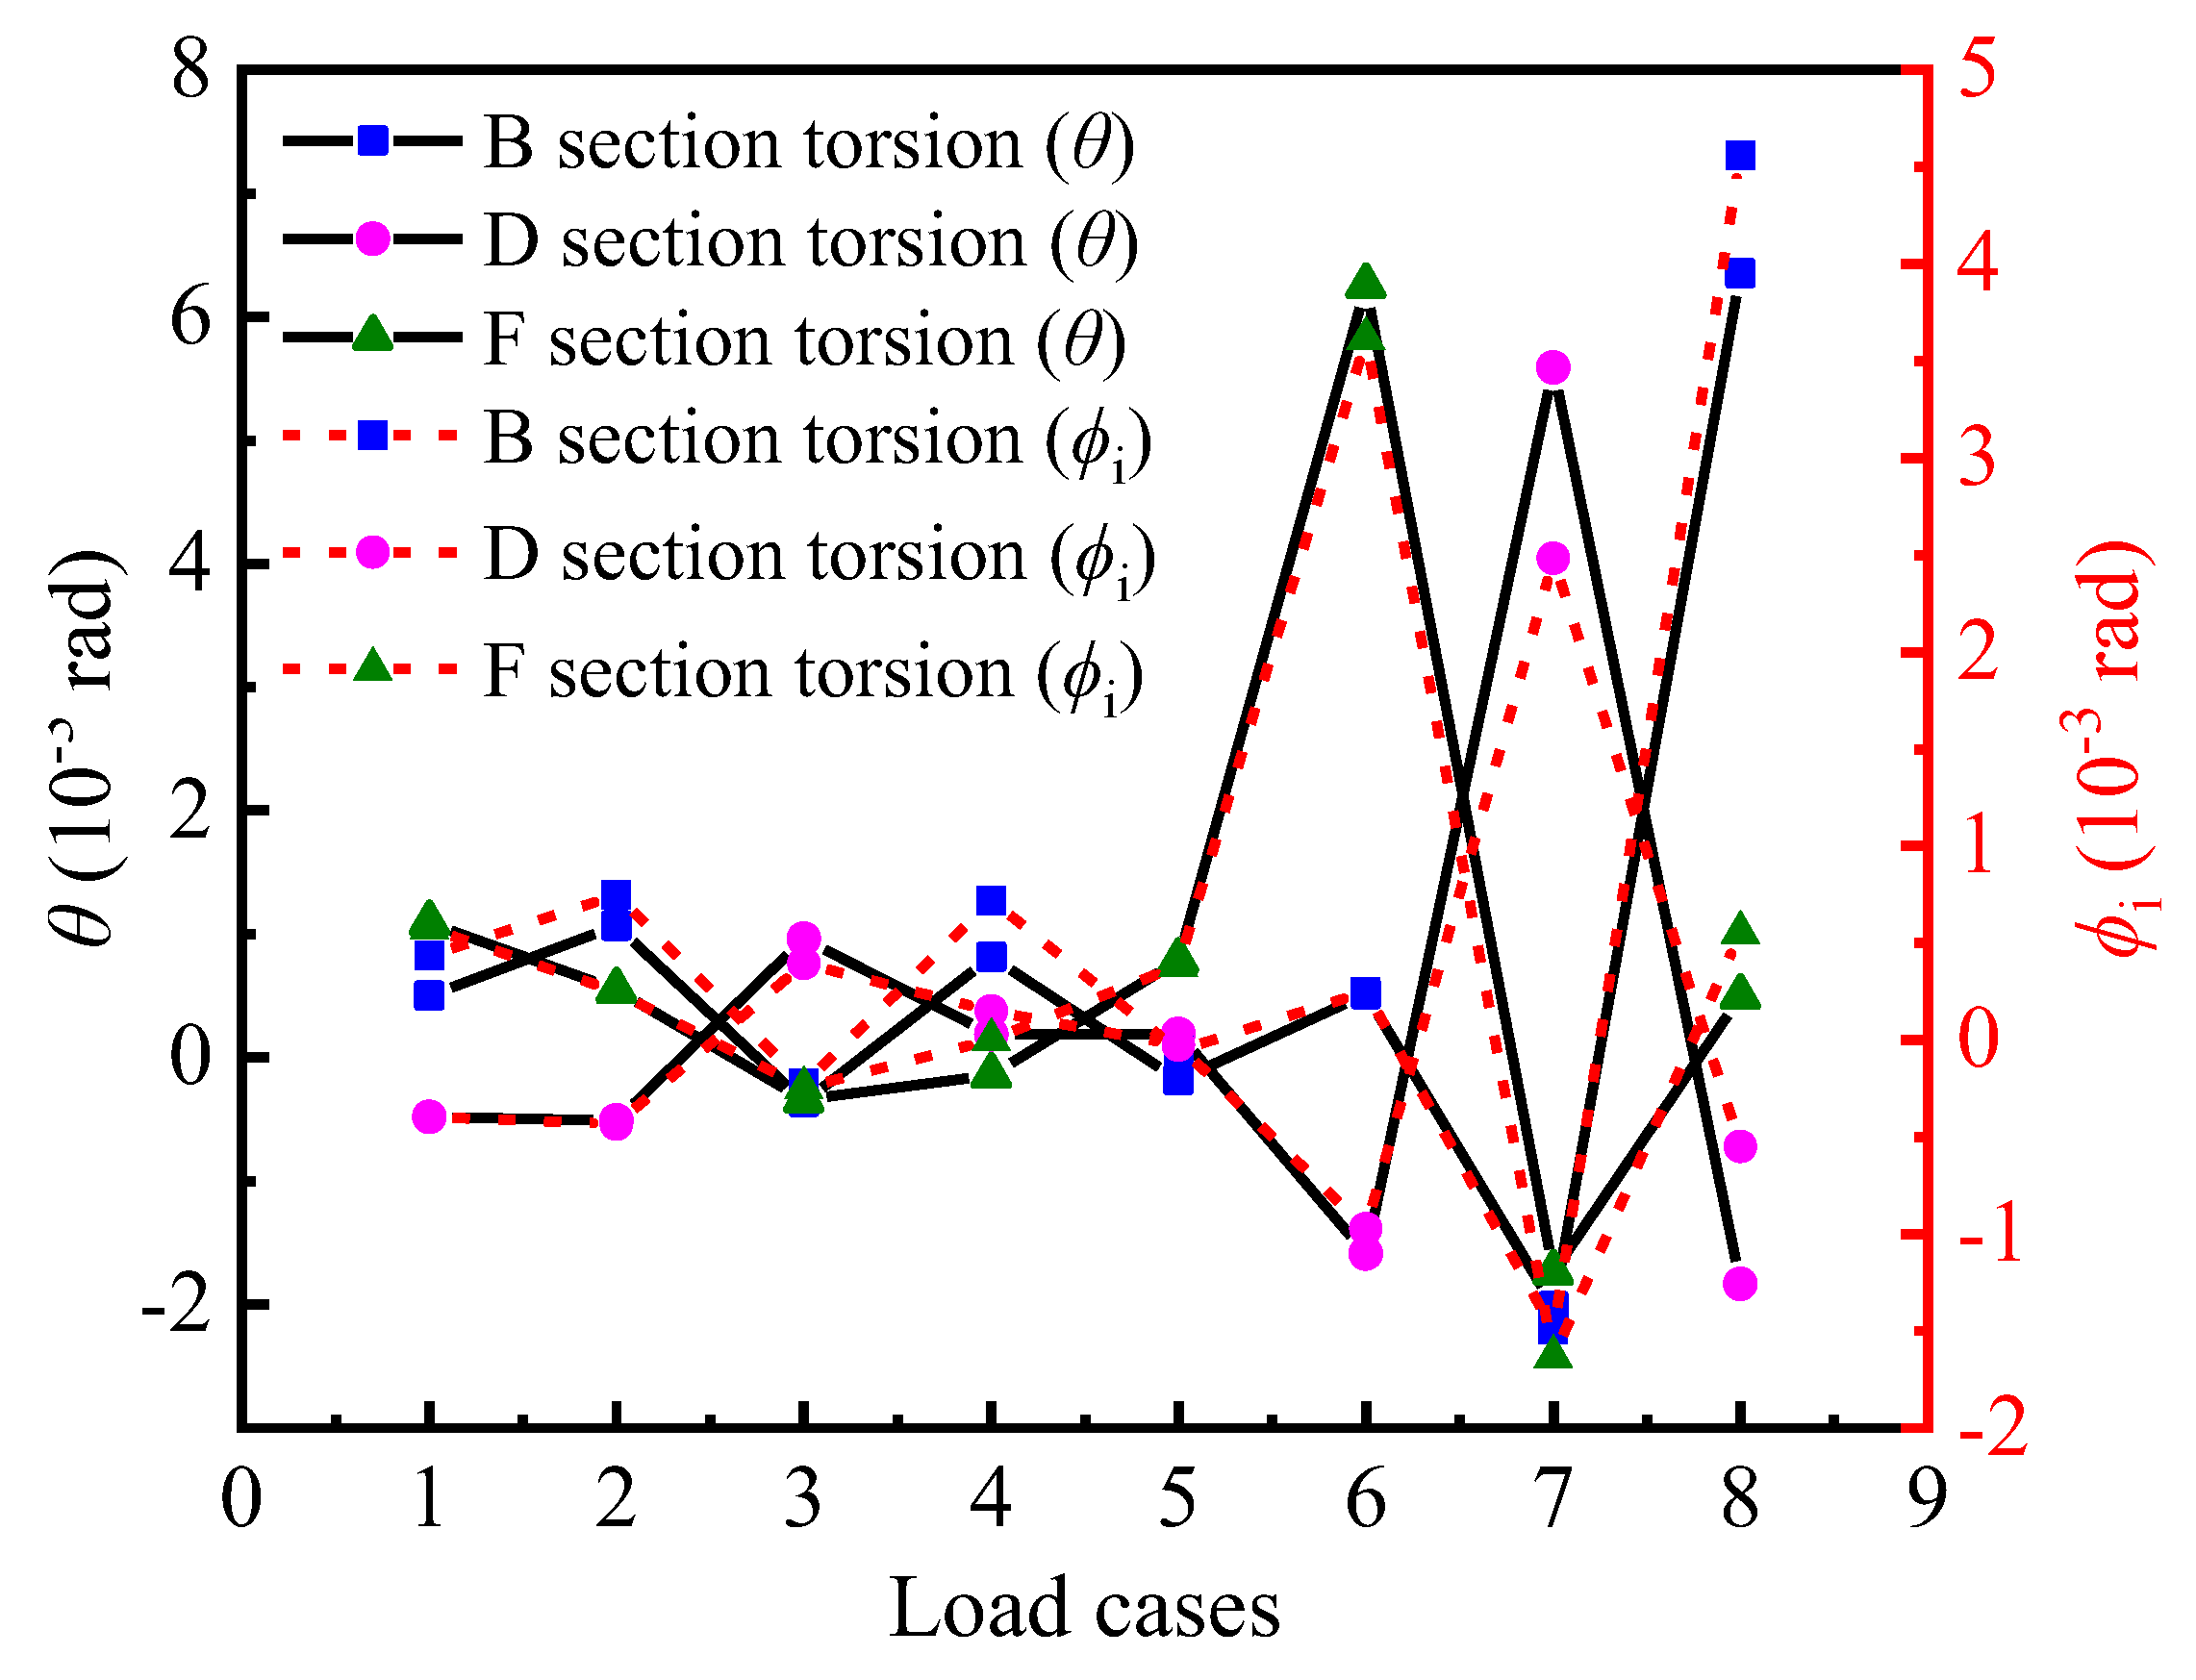
4.3. Torsional Effects Constructed from Displacements
4.4. Correlation Characteristics between Torsional and Out-of-Plane Bending Stressing States
5. Experimental Data Extended by the Non-Sample Point Interpolation Method
5.1. The NPI Method Applied to CPCBG Bridge Model
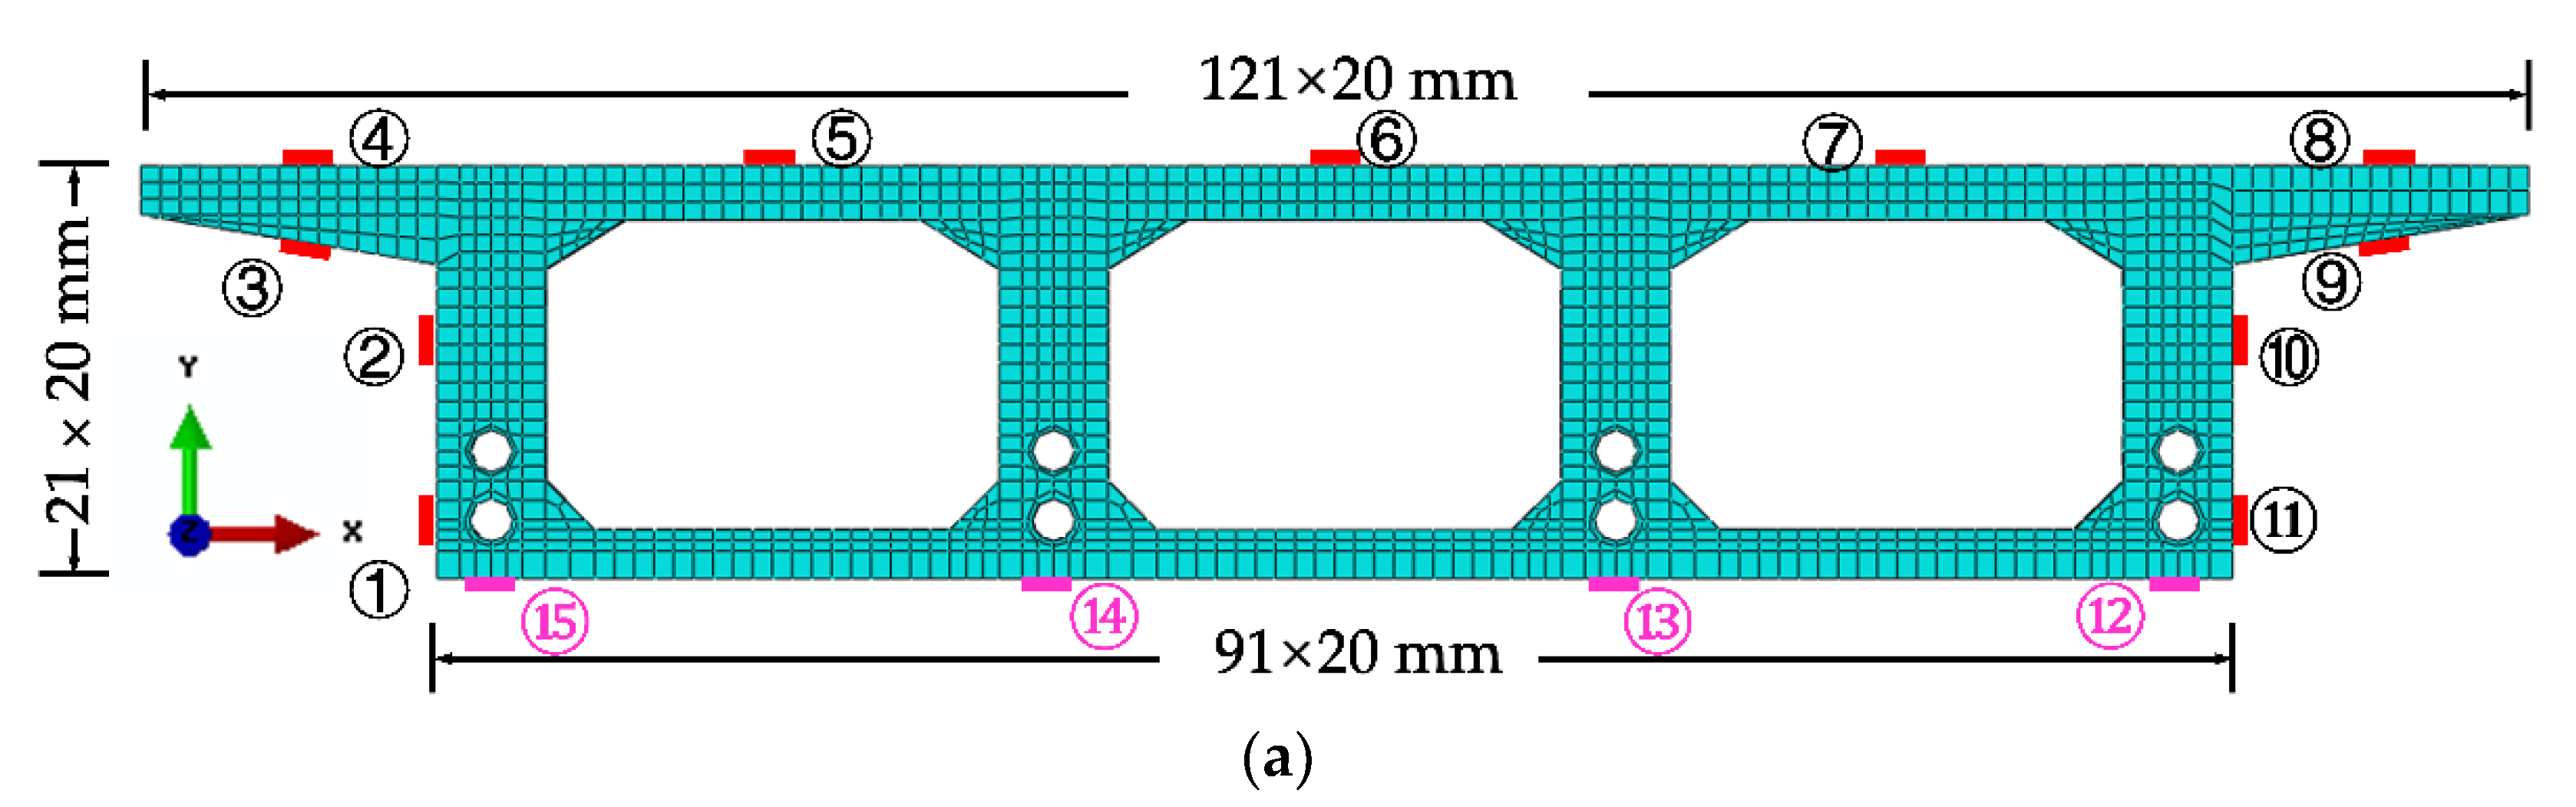
- The NPI is a new and effective interpolation method that directly interpolates the experimental data field, utilizing conventional shape functions and finite element (FE) simulations. The interpolation method based on thin-plate splines (TPS) obtains the numerical shape function of the sampled points by finite element simulation of a specific thin plate model. Then, the data of non-sampled points are obtained by interpolation of the numerical shape function and the sampled data, and the NPI is constructed as follows. First, to introduce this method vividly, the D cross-section of the experimental model is used as an example. As shown in Figure 12a, ANSYS software is used to build the finite element model of the box girder cross-section, and shell unit 181 is used for the concrete slab with a thickness of 5 mm and a unit area of 10 × 10 mm2. Beam element 188 is used to model the common and prestressed reinforcement in the cross-section. Its thickness is also 5 mm, and its area is the actual area. Additionally, it is assumed that the connection between the reinforcement and concrete is rigid, and the prestressing reinforcement is pre-tensioned in advance. The strain data of 15 critical measurement points on the cross-section are used as a sample interpolation to predict the strain field of the critical section in span D.
- As shown in Figure 12a, the non-sample point shape functions N1-N15 are obtained from the 15 control points in the established coordinate system, and the measured point strain data are used as the coefficients of control points ①–⑮. The calculation of the interpolation function can be found in the literature [2,28,32].
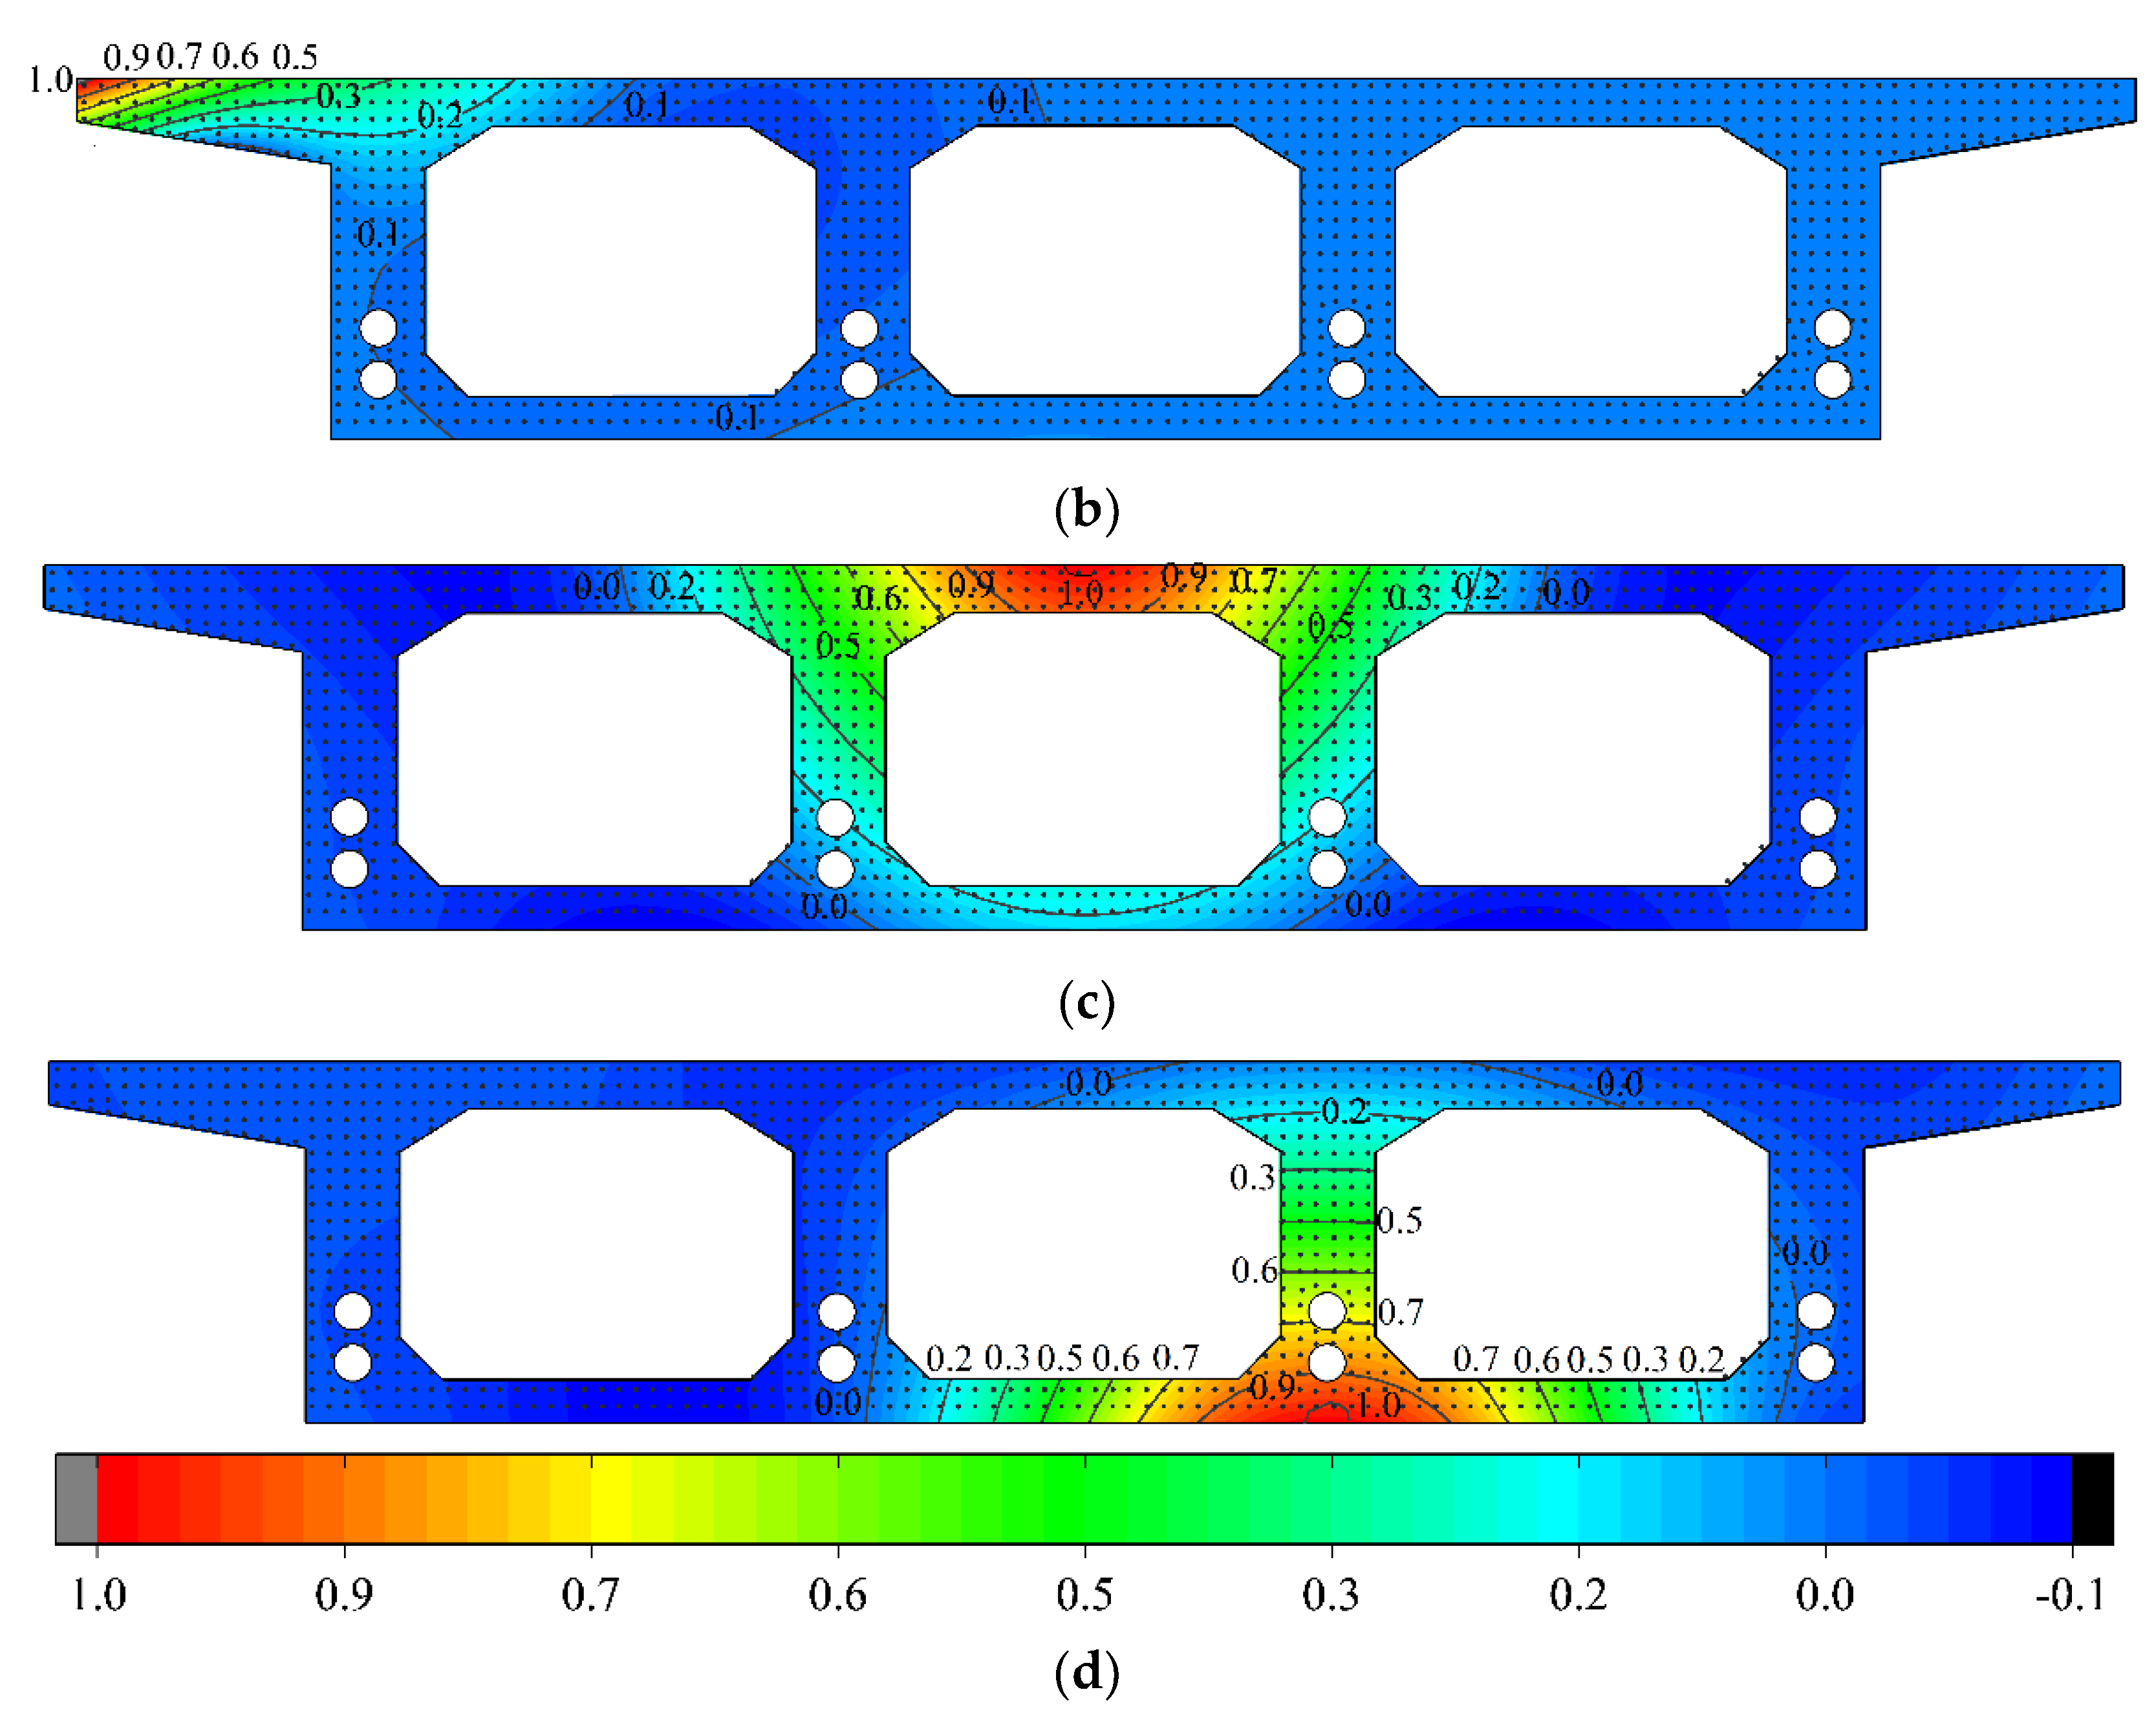
- The 15 interpolation points on the box girder section were used to obtain the z-axis deflection Uz. To interpolate the Uz response field, a shape function can be derived from a generalized finite element simulation of the same physical quantities. Uz = 1 is applied at one measurement point on the z-axis and minimum constrained rigid body displacements in the x and y directions are applied at the other measurement points. Then, the simulated Uz field is solved by a static finite element method to obtain the shape function for a given measurement point. It can be described by a discrete vector , where N1(xk) is the value of the element node xk as a function of the total number of element nodes (n = 1612) of the box girder model studied in this paper, and the numerical shape function Ni (i = 4, 6, 13) is shown in Figure 12b–d.
- Static analysis is performed to obtain the overall strain field. Without considering large deformation or elastoplasticity, the displacement field constructed by Castigliano’s theorem is independent of the loading path and can be linearly superimposed according to the simulation results, which have a clear physical meaning.
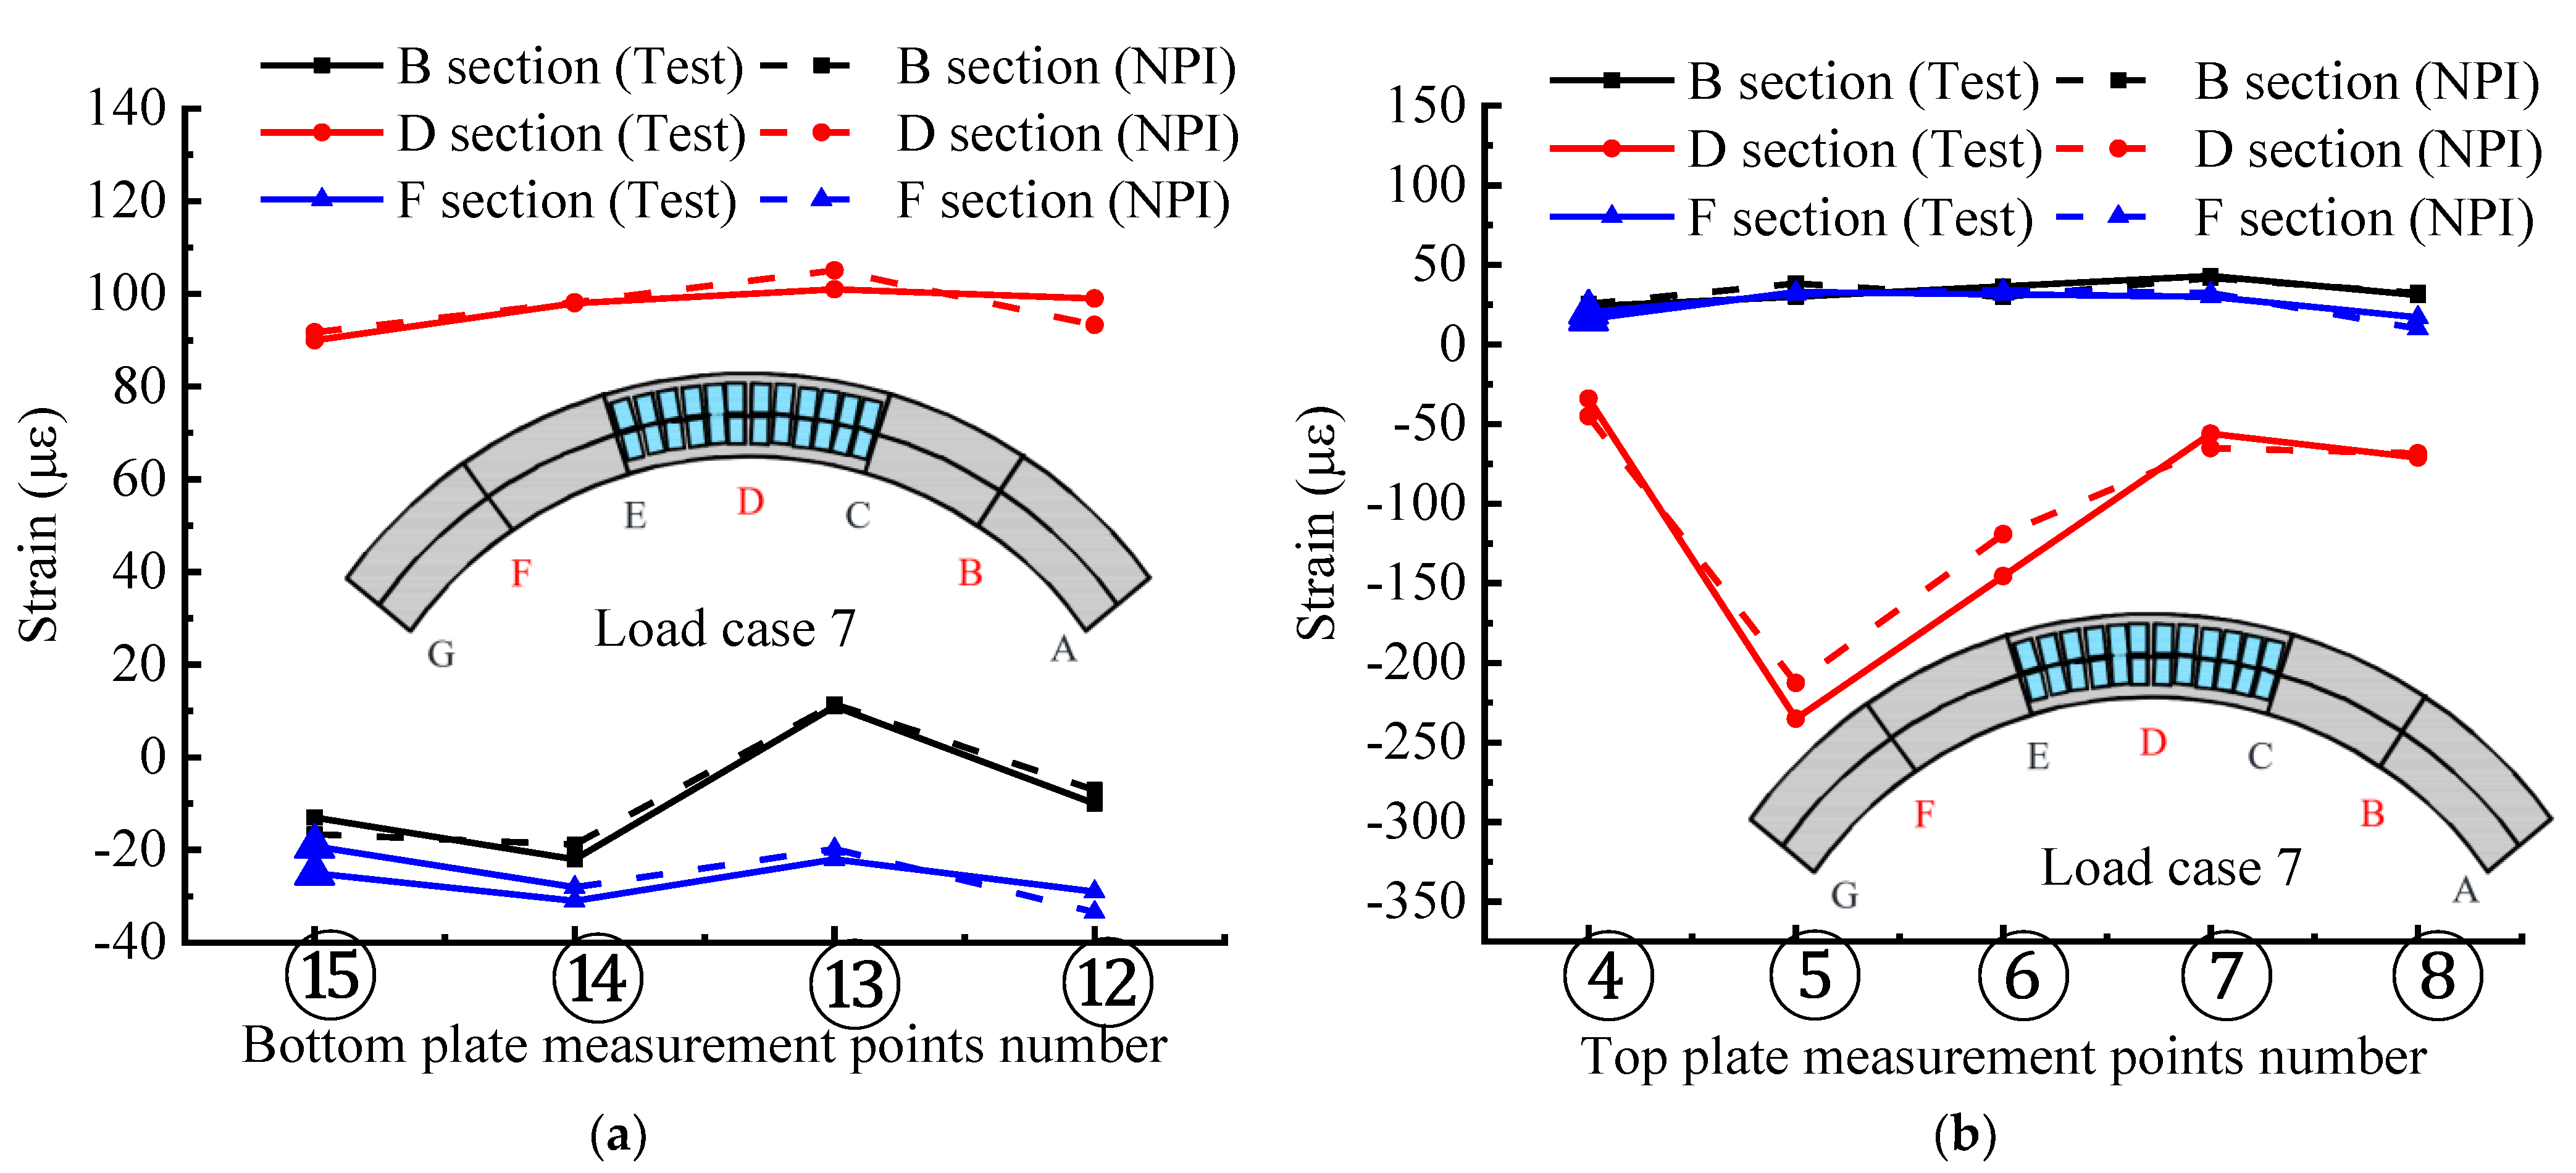
5.2. Comparison of the Stress Distribution Curves Obtained by the Two Methods
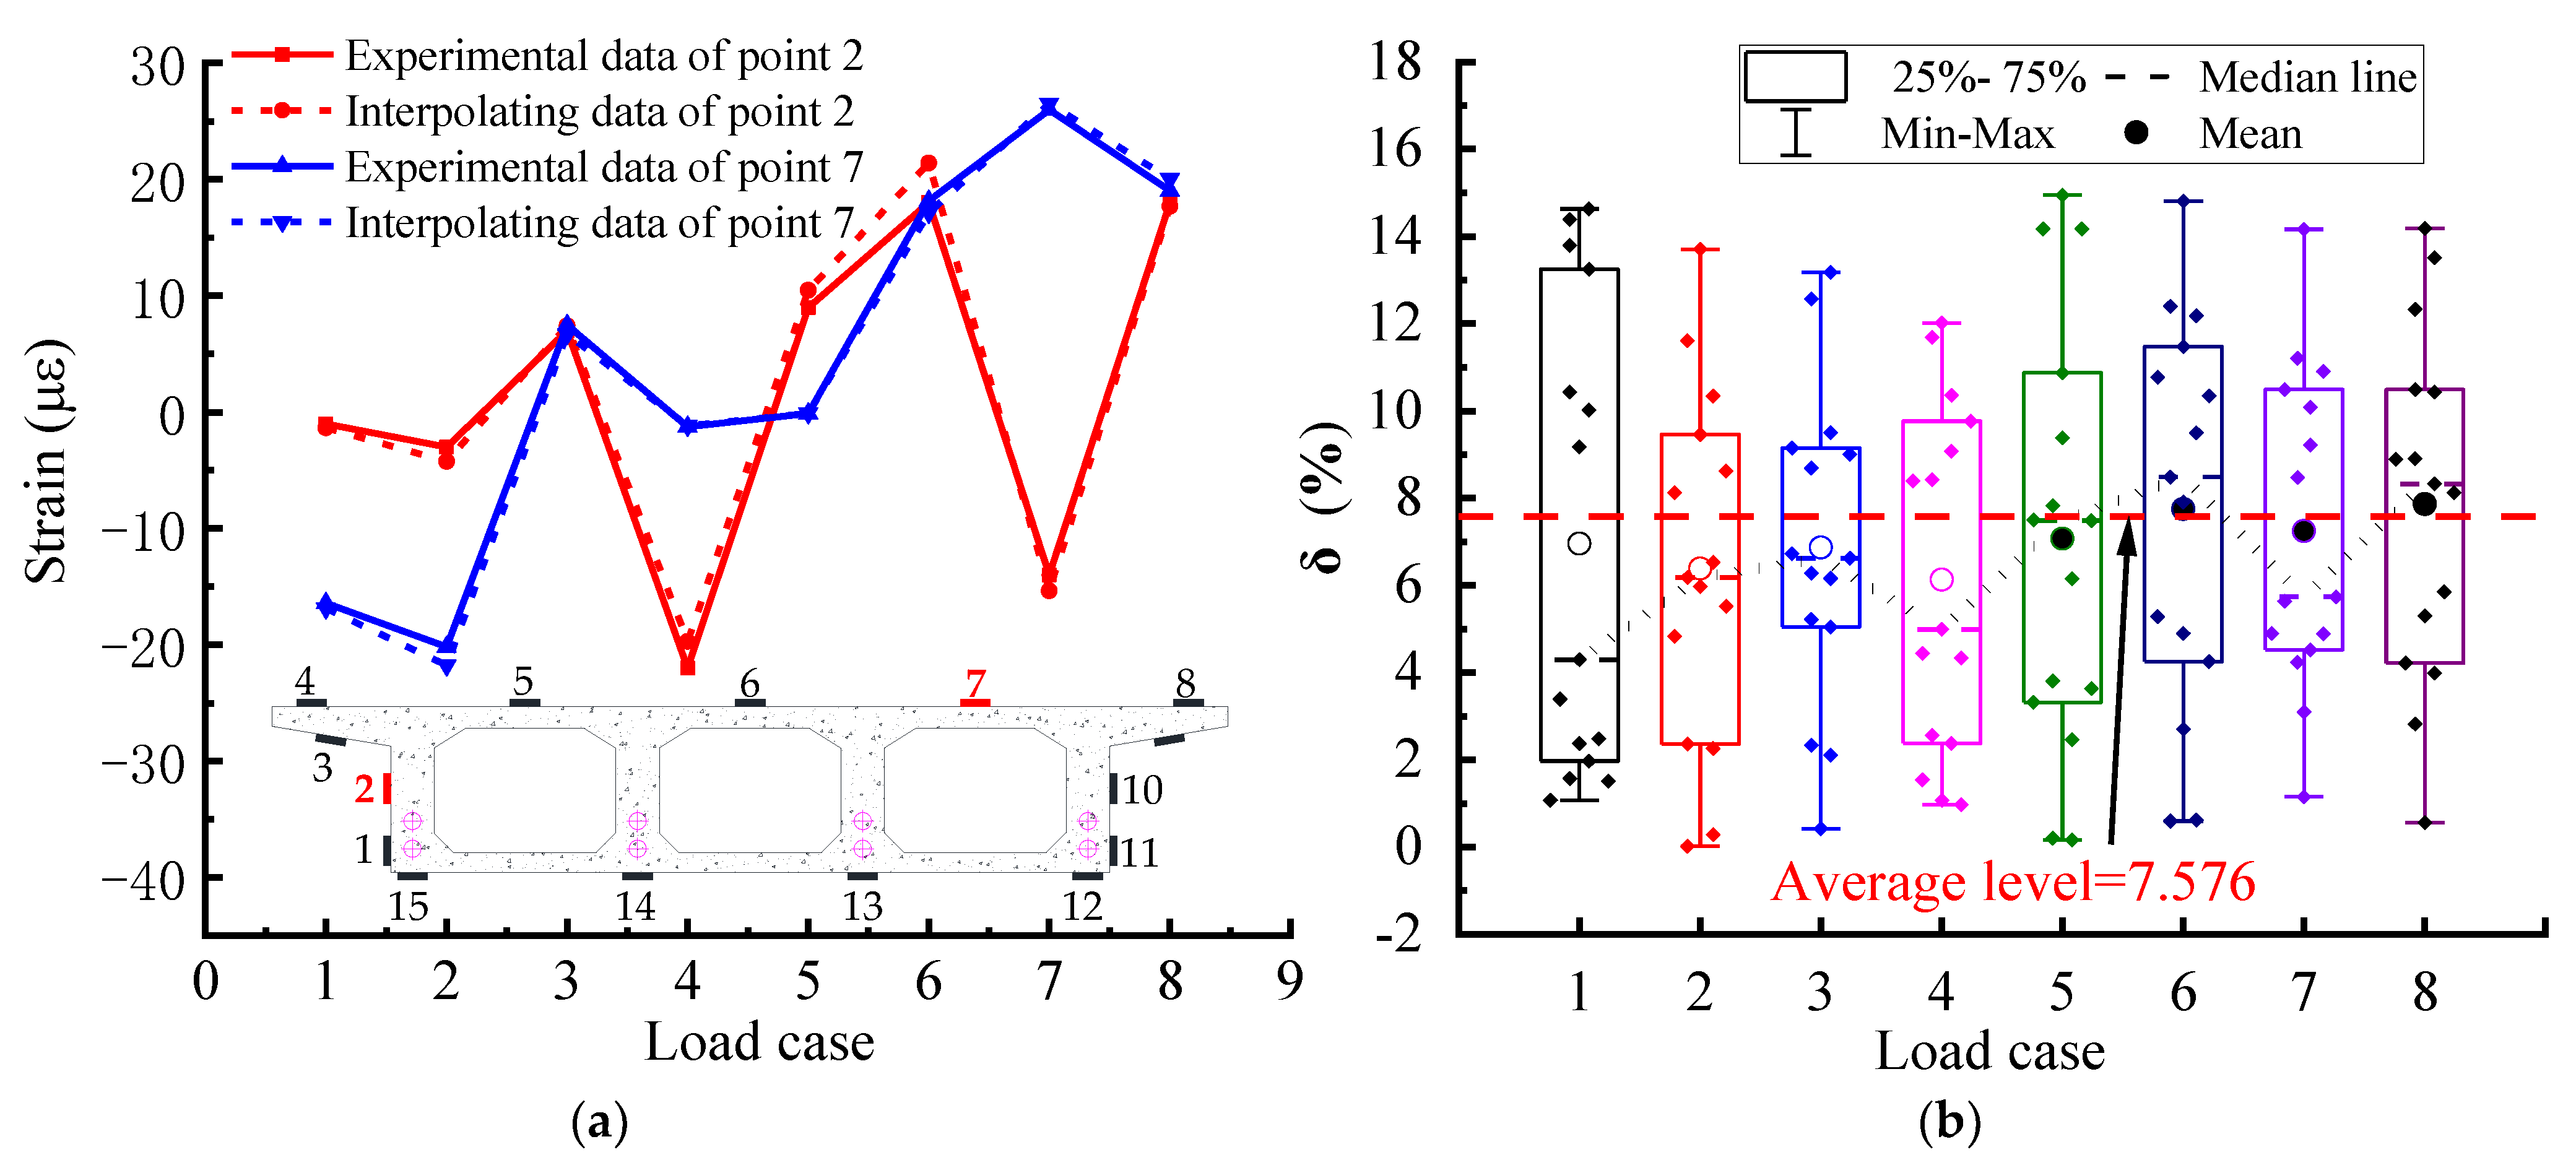
5.3. Evaluation of the Comprehensive Accuracy of the NPI Method
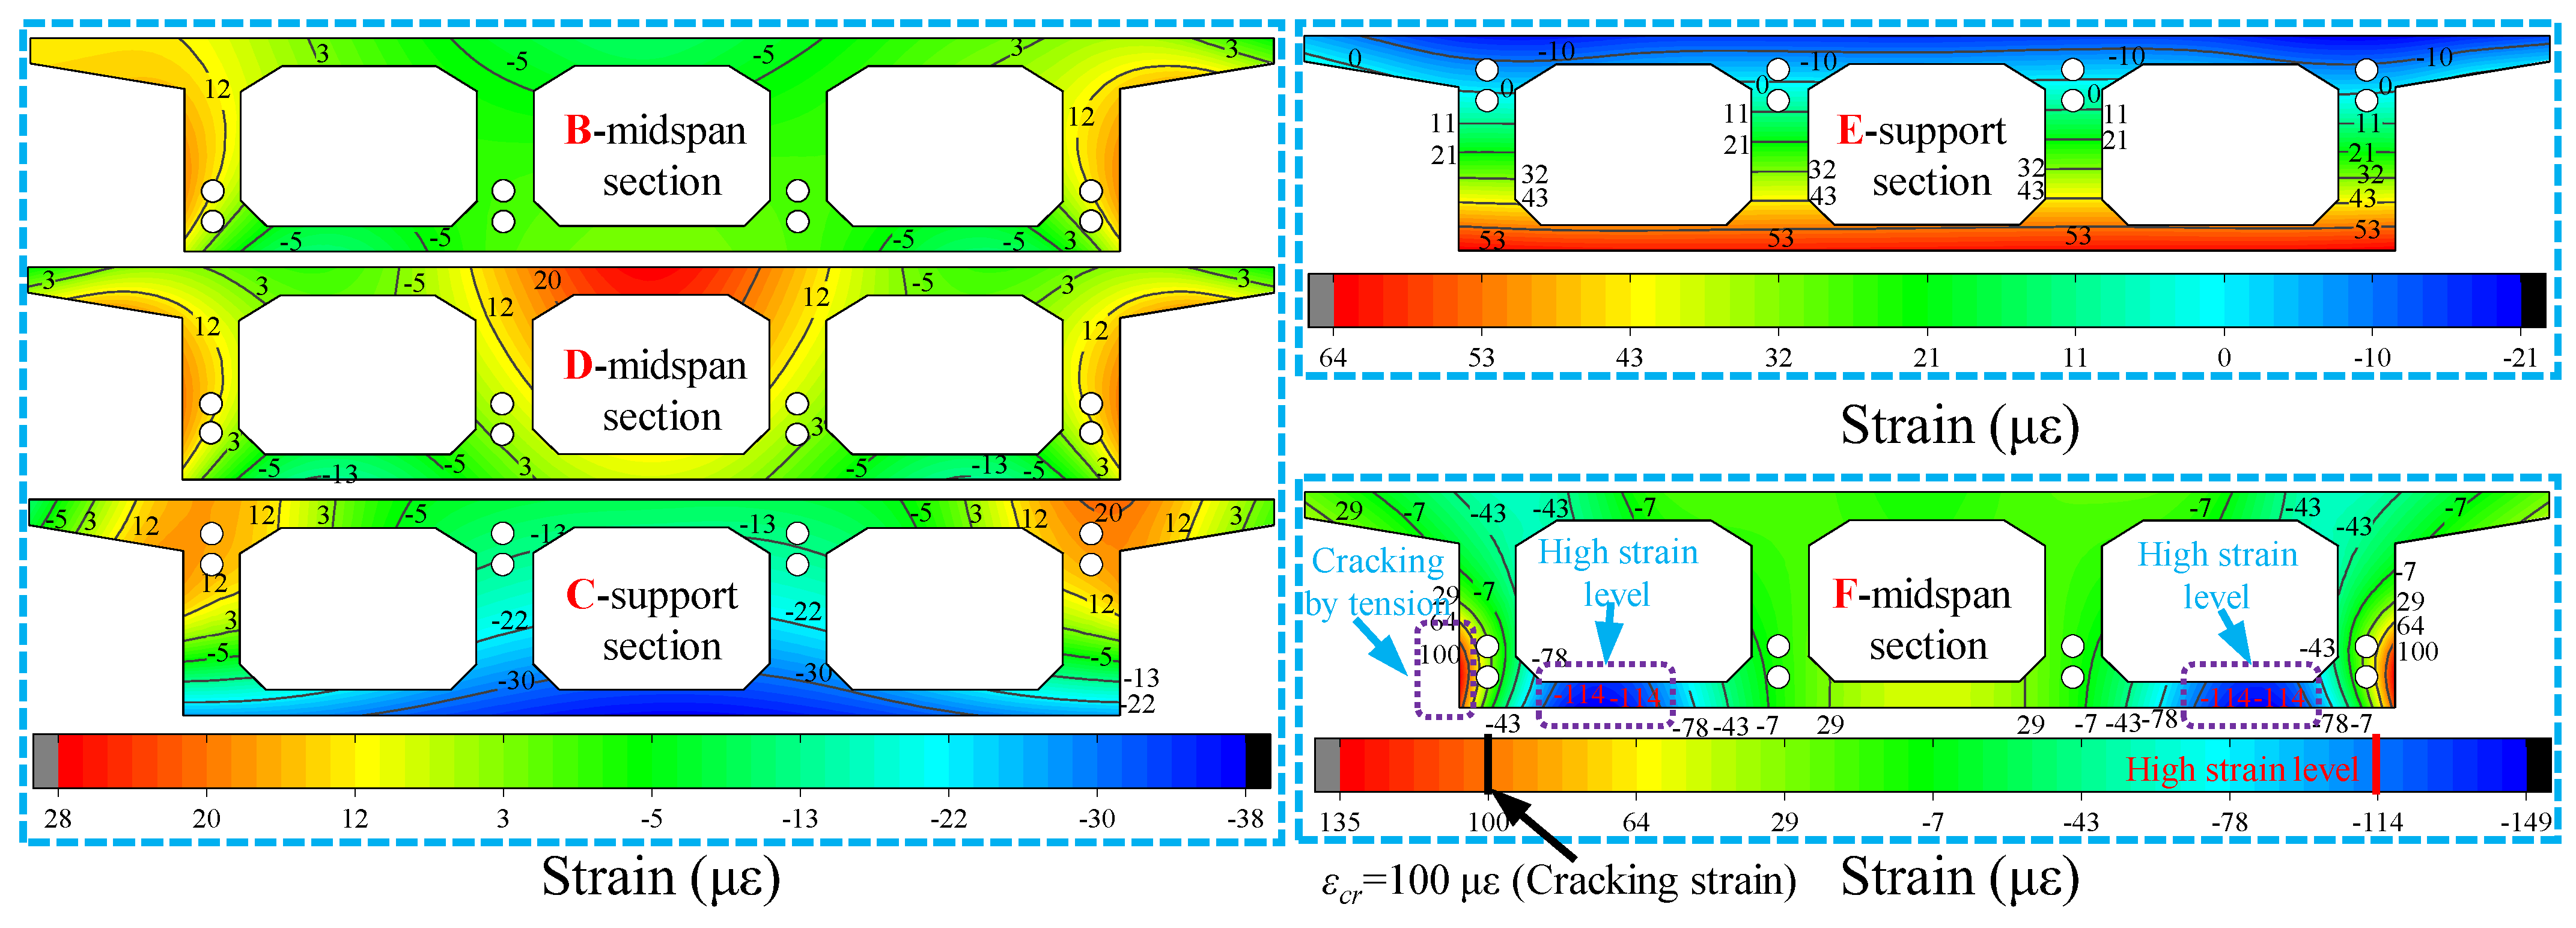
5.4. Strain and Stress Fields Extended by the NPI Method
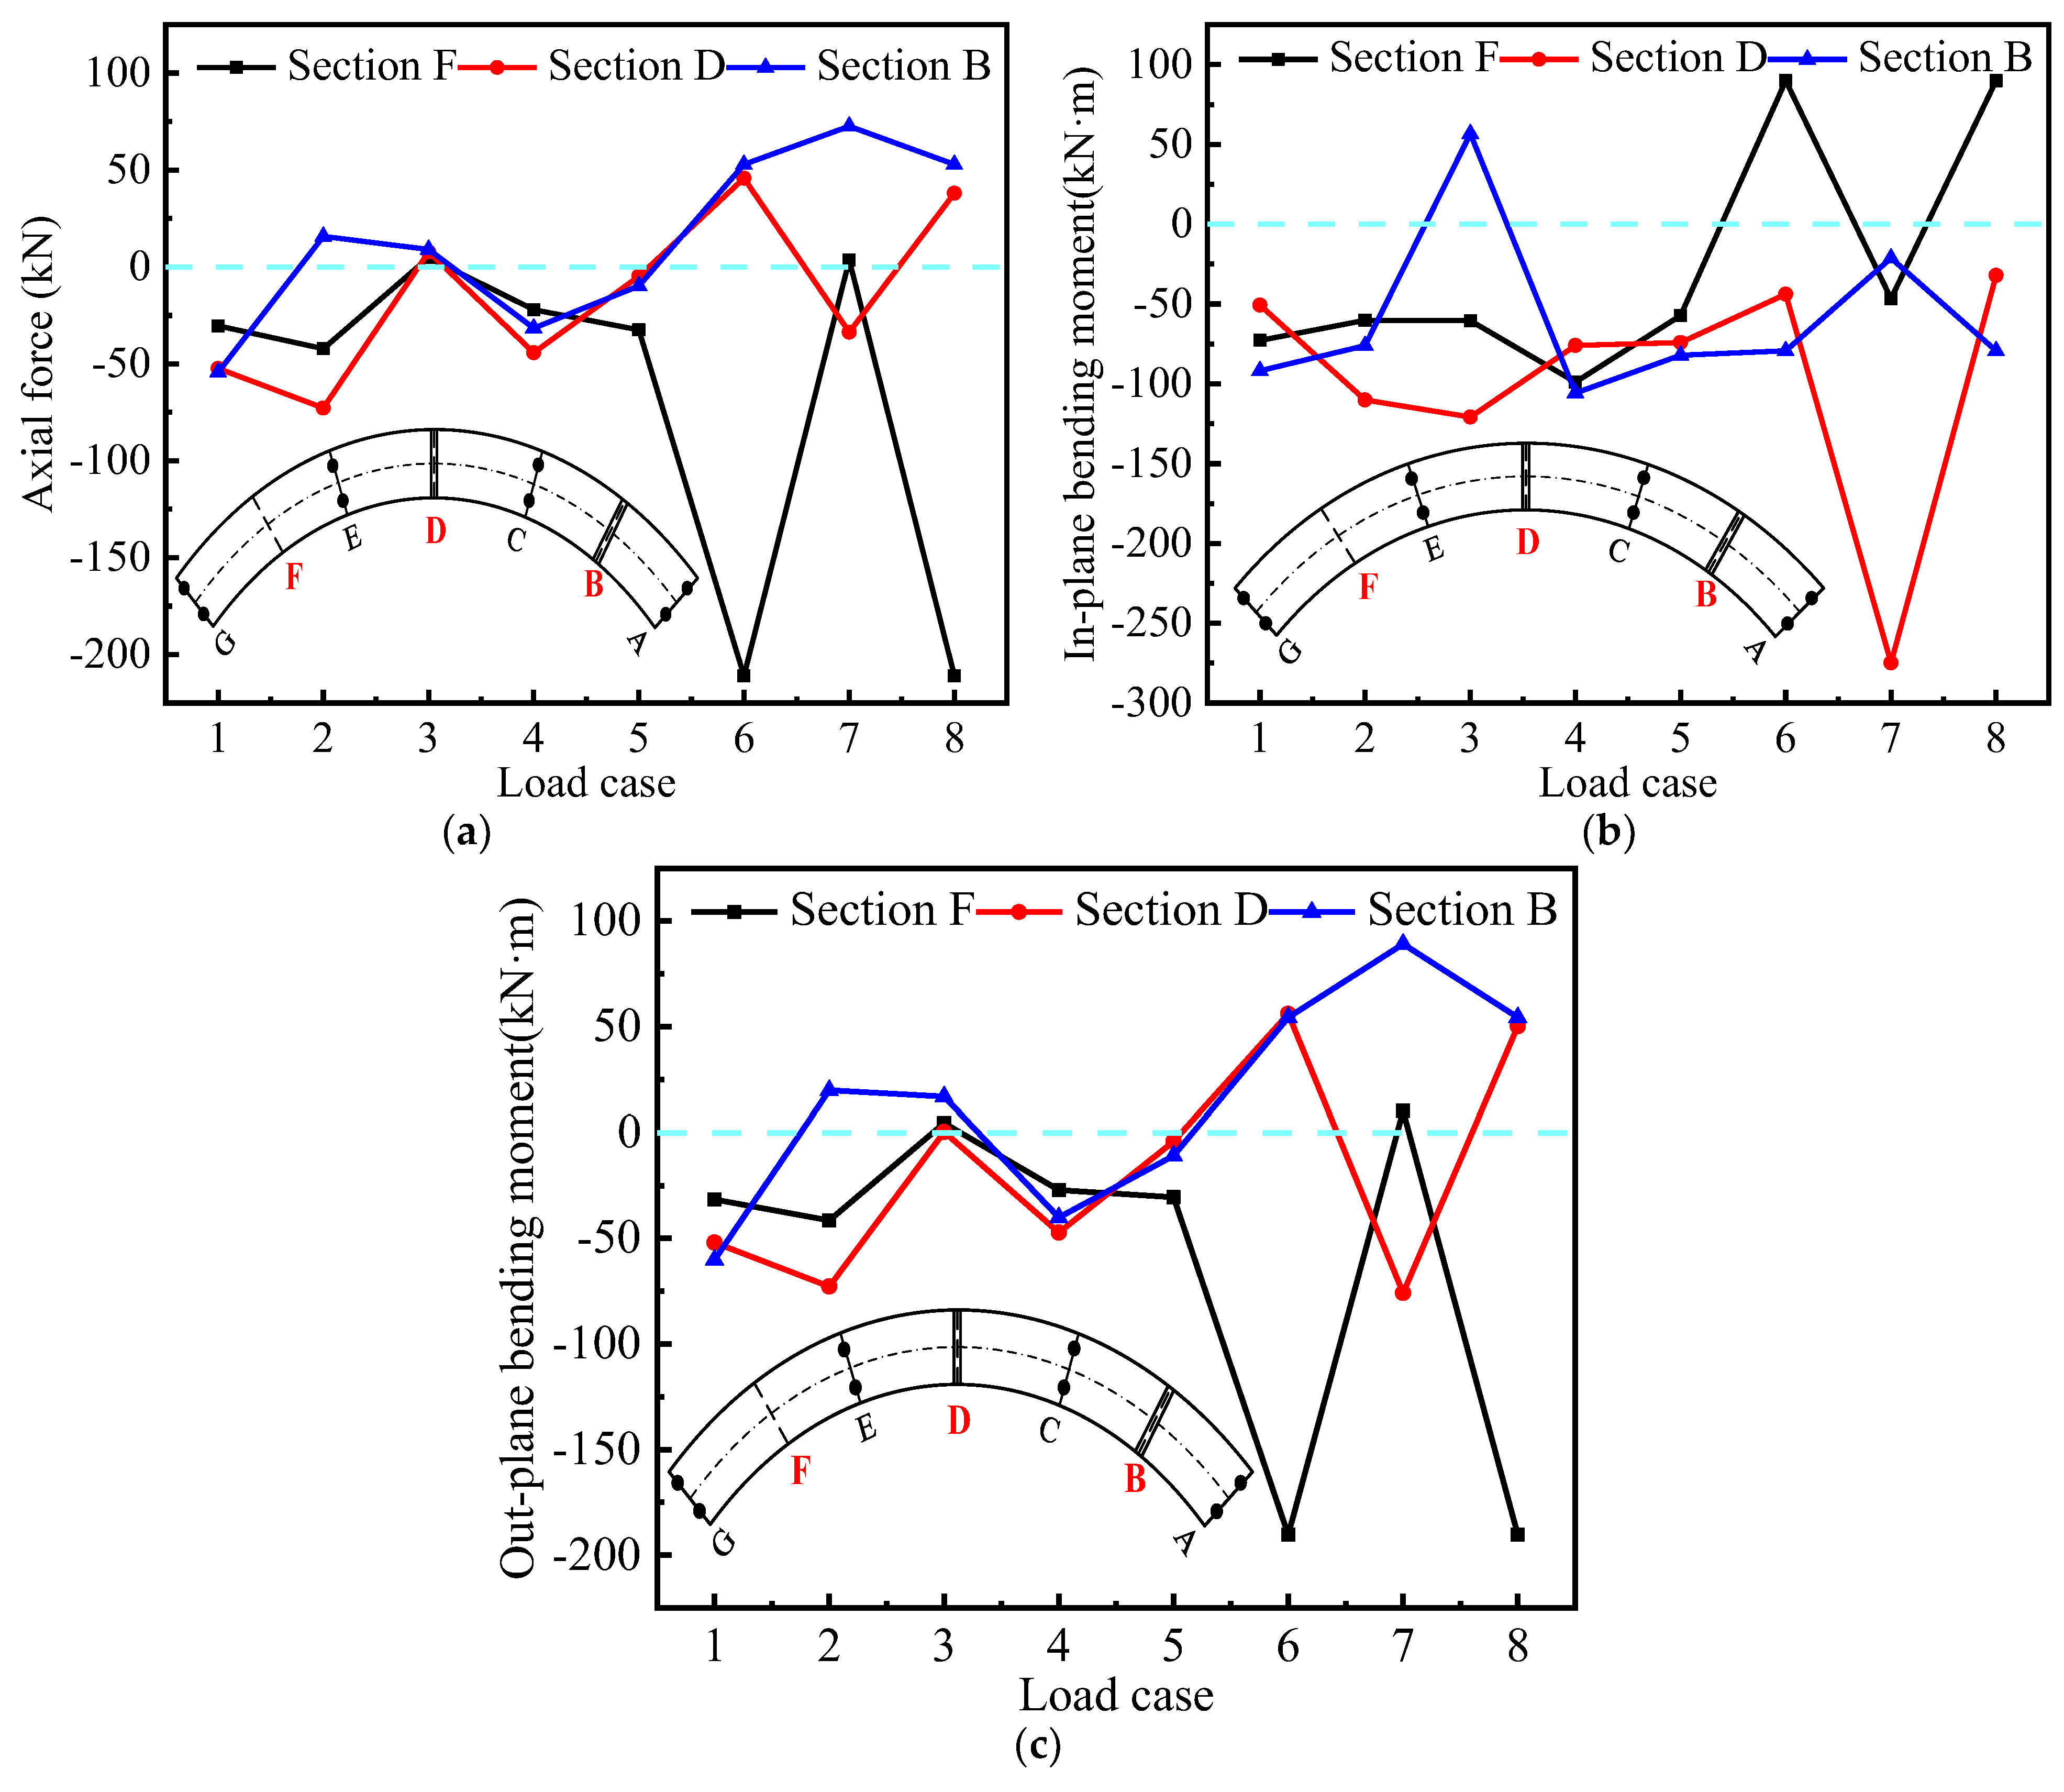
5.5. Modeling of Axial Forces and Bending Stressing States
6. Conclusions
- The GSED obtained from the measured strain data is used to indicate the stressing state pattern of the structure based on the structural stressing state theory. The strain distribution mode of the bridge model, the various internal force values of the cross-section and the torsional effect under different loading cases are analyzed. It is found that the strain, deformation and force in the cross-section of the girder model with a partition beam are more coordinated than those of the bridge model without a partition beam.
- The torsional effect was constructed from the measured deflections, the out-of-plane pure torsional model from the rotational deflection and the in-plane bending model from the sinking deflection, both of which comprise the torsional effect of the curved beam, and the torsional effect maintained some coordination with the inboard and outboard strains. The presence of a partition beam affects the magnitude of internal forces such as axial forces; the overall stress level of the section with a partition beam is higher and more unevenly distributed than that of the section without a partition beam, and the torsional characteristics of the section with partition beam are different, but there is a significant improvement in the torsional effect of the section.
- Due to the presence of the torsional effect in the curved bridge model, the torsional stiffness is significantly smaller than the bending stiffness, and the torsional damage becomes the main factor. The curved bridge model also shows local damage under the action of a smaller stack load, which is more prominent in the inner side of the curved bridge model. The spacer beam has the function of maintaining the stability of the whole bridge in curved girder bridges. Especially for thin web box girders, adding spacers is the best way to reduce section deformation.
- An NPI method with clear physical meaning, based on reasonableness and accuracy, intuitively reflects the strain and stress fields. Torsional deformation easily leads to the outermost side of the bottom of the box girder and is the first to reach the cracking strain of the concrete. The damage to both sides of the box girder at local locations indicates that the structure is in an unstable stressing state, which intuitively reveals the torsional mechanical response of the three-box chamber box girder under the influence of a large curvature.
- The axial internal force and out-of-plane bending moment modes can reflect the force state of the cross-section, and, in general, the bending effect is still the main controlling factor of the box girder. In the symmetric loading case, in-plane bending is still the main influencing factor of structural forces, which has greater similarity with the general linear box girder forces; however, the out-of-plane torsional effect gradually becomes the main influencing factor of large curvature box girder forces under asymmetric loading.
Author Contributions
Funding
Institutional Review Board Statement
Informed Consent Statement
Data Availability Statement
Acknowledgments
Conflicts of Interest
Appendix A

| Instrument | Resistive Strain Gauges | Static Strain Gauge Kit | Displacement Gauges | Resistive Pressure Ring | |||||
|---|---|---|---|---|---|---|---|---|---|
| Machine type | BQ120-60AA | BE120-1AA | JM3813 | JM3812 | JM3815 | YH-50 | YH-1000L | CL-YB-20T | CL-YB-2T |
| Number | 80 | 77 | 1 | 4 | 4 | 15 | 4 | 8 | 4 |
- (1)
- The prestressing load was applied using unbonded prestressing strands, tensioned at both ends.
- (2)
- Pre-loading was carried out before the test to bring all parts of the box girder model into working condition and coordinate with each other.
- (3)
- The constant load of the bridge was applied by the counterweight, and the counterweight blocks were 26.5 cm × 48 cm × 92 cm steel plate concrete blocks, each weighing 300 kg. Due to a large number of counterweights, single-span loading was used here, and the effects were superimposed at the end, which reduced the number of counterweights and reduced the difficulty of the test, and also ensured the smooth conduct of the test.
- (4)
- The live load is also loaded utilizing counterweight blocks, and the loading quantity is calculated according to the internal force effect of each control section under the design load, and the load is arranged according to the principle of influence line to achieve the most unfavorable effect of the control section. The loading sequence of counterweight blocks is from the inside to the outside and from the support to the middle of the span. The loading process is continuous and does not allow too long a pause in the middle process.
- (1)
- Bearing reaction force is used for the transverse law of bearing reaction force.
- (2)
- The strains of each key section are used for the study of the sum of GSED (Esum), stressing state distribution and NPI interpolation calculation, etc.
- (3)
- The displacements of each key section are used to construct the torsional effect.
Appendix B
| Ej (J/m3) | Loading Case | ||||||||
|---|---|---|---|---|---|---|---|---|---|
| Case 1 | Case 2 | Case 3 | Case 4 | Case 5 | Case 6 | Case 7 | Case 8 | ||
| Key cross sections | B | 1470.2 | 2784.1 | 2451.3 | 2839 | 2990.2 | 35.7 | 122.7 | 35.7 |
| C | 45 | 52.6 | 11.1 | 6.5 | 6.6 | 13.1 | 351.2 | 9.7 | |
| D | 61.1 | 63.2 | 2580.5 | 175.2 | 349.2 | 82.6 | 1966.7 | 88.4 | |
| E | 6.1 | 19.6 | 2.2 | 7.4 | 8.3 | 155.6 | 305.7 | 155.6 | |
| F | 52.7 | 45 | 3.5 | 49 | 36.4 | 1400.2 | 110.5 | 1400.2 | |
References
- Heins, C.J.E.J. Box girder bridge design-State of the art. Eng. J. 1978, 15, 126–142. [Google Scholar]
- Shi, J.; Xiao, H.; Zheng, K.; Shen, J.; Zhou, G. Essential stressing state features of a large-curvature continuous steel box-girder bridge model revealed by modeling experimental data. Thin-Walled Struct. 2019, 143, 106247. [Google Scholar] [CrossRef]
- Geisser, S. A predictive approach to the random effect model. Biometrika 1974, 61, 101–107. [Google Scholar] [CrossRef]
- Xu, Q. Linear Elastic Theory and Ultimate Load Carrying Capacity Analysis of Thin-walled Curved Beams. Ph.D. Thesis, Zhejiang University, Hangzhou, China, 2002. (In Chinese). [Google Scholar]
- Huang, H.; Liu, B.; Zhang, Y.; Tian, X. Bearing reaction test and analysis of prestressed concrete curved girder bridge. In Proceedings of the 8th International Symposium on Test and Measurement, Chongqing, China, 23–26 August 2009. (In Chinese). [Google Scholar]
- Timoshenko, S.; Gere, J. Theory of Elastic Stability; McGraw-Hill Book Company: New York, NY, USA; Toronto/London und Kogakusha Company: Tokyo, Japan, 1961. [Google Scholar]
- Hall, D.H. Curved Steel Box-Girder Bridges: State-of-the-Art. J. Struct. Div. 1978, 104, 1719–1739. [Google Scholar]
- Yoo, C.H. Flexural-torsional stability of curved beams. J. Eng. Mech. Div. 1982, 108, 1351–1369. [Google Scholar] [CrossRef]
- Pi, Y.-L.; Trahair, N. In-plane inelastic buckling and strengths of steel arches. J. Struct. Eng. 1996, 122, 734–747. [Google Scholar] [CrossRef]
- Gupta, T.; Kumar, M. Flexural response of skew-curved concrete box-girder bridges. Eng. Struct. 2018, 163, 358–372. [Google Scholar] [CrossRef]
- Choudhury, D.; Scordelis, A.C. Structural Analysis and Response of Curved Prestressed Concrete Box Girder Bridges; National Research Council, Transportation Research Board: Singapore, 1988. [Google Scholar]
- Kataria, N.P.; Jangid, R. Seismic protection of the horizontally curved bridge with semi-active variable stiffness damper and isolation system. Adv. Struct. Eng. 2016, 19, 1103–1117. [Google Scholar] [CrossRef]
- Khan, E.; Lobo, J.A.; Linzell, D.G. Live load distribution and dynamic amplification on a curved prestressed concrete transit rail bridge. J. Bridge Eng. 2018, 23, 04018029. [Google Scholar] [CrossRef]
- Khaloo, A.R.; Kafimosavi, M. Enhancement of flexural design of horizontally curved prestressed bridges. J. Bridge Eng. 2007, 12, 585–590. [Google Scholar] [CrossRef]
- Moreira, L.S.; Sousa, J.B.M., Jr.; Parente, E., Jr. Nonlinear finite element simulation of unbonded prestressed concrete beams. Eng. Struct. 2018, 170, 167–177. [Google Scholar] [CrossRef]
- Cheng, B. Theoretical Study on the Calculation of Anti-Overturning Capacity of Single Column Pier Curved Bridge. Master’s Thesis, Zhejiang University, Hangzhou, China, 2016. (In Chinese). [Google Scholar]
- Yin, L. Analysis for Thin-Walled Box-Section Beam Bridge in Bending and Torsional. Master’s Thesis, Hebei University of Engineering, Handan, China, 2010. (In Chinese). [Google Scholar]
- Samaan, M.; Kennedy, J.B.; Sennah, K. Impact factors for curved continuous composite multiple-box girder bridges. J. Bridge Eng. 2007, 12, 80–88. [Google Scholar] [CrossRef]
- Pi, Y.-L.; Bradford, M.A.; Trahair, N.S. Inelastic analysis and behavior of steel I-beams curved in plan. J. Struct. Eng. 2000, 126, 772–779. [Google Scholar] [CrossRef]
- Yoo, C.H.; Kang, Y.J.; Davidson, J.S. Buckling analysis of curved beams by finite-element discretization. J. Eng. Mech. 1996, 122, 762–770. [Google Scholar] [CrossRef]
- Liu, X.; Zhou, C.; Feng, D.; Fan, X.; Xie, S. Experimental study on interlayer shear properties of ERS pavement system for long-span steel bridges. Constr. Build. Mater. 2017, 143, 198–209. [Google Scholar] [CrossRef]
- Kang, J.; Wang, X.; Yang, J.; Du, Y. Strengthening double curved arch bridges by using extrados section augmentation method. Constr. Build. Mater. 2013, 41, 165–174. [Google Scholar] [CrossRef]
- Shanmugam, N.; Thevendran, V.; Liew, J.R.; Tan, L. Experimental study on steel beams curved in plan. J. Struct. Eng. 1995, 121, 249–259. [Google Scholar] [CrossRef]
- Li, Y.; Yu, Z.; Wu, Q.; Liu, Y.; Wang, S.J.M. Experimental-Numerical Study on the Flexural Ultimate Capacity of Prestressed Concrete Box Girders Subjected to Collision. Materials 2022, 15, 3949. [Google Scholar] [CrossRef]
- Kim, S.-J.; Kim, J.-H.J.; Yi, S.-T.; Md Noor, N.B.; Kim, S.-C. Structural performance evaluation of a precast PSC curved girder bridge constructed using multi-tasking formwork. Int. J. Concr. Struct. Mater. 2016, 10, 1–17. [Google Scholar] [CrossRef] [Green Version]
- Yang, Z.Y.; Zhao, Y.; Liu, Z.S. Research on Stretching Order of Tendons in PC Curved Box Girder Bridge. Adv. Mater. Res. 2011, 219–220, 487–491. [Google Scholar] [CrossRef]
- Sali, J.; Mohan, R.P. Parametric Study of Single Cell Box Girder Bridge under Different Radii of Curvature. Appl. Mech. Mater. 2017, 857, 165–170. [Google Scholar] [CrossRef]
- Seo, J.; Rogers, L.P.; Hu, J.W. Computational seismic evaluation of a curved prestressed concrete I-girder bridge equipped with shape memory alloy. Eur. J. Environ. Civ. Eng. 2020, 24, 1881–1900. [Google Scholar] [CrossRef]
- Shao, S. The Research on Force of the Curved Bridge with Small Radius Big Span. Master’s Thesis, Dalian University of Technology, Dalian, China, 2017. (In Chinese). [Google Scholar]
- Shi, J.; Li, W.; Zheng, K.; Yang, K.; Zhou, G. Experimental investigation into stressing state characteristics of large-curvature continuous steel box-girder bridge model. Constr. Build. Mater. 2018, 178, 574–583. [Google Scholar] [CrossRef]
- Xiao, H.; Luo, L.; Shi, J.; Jiang, H.; Wu, Z. Stressing state analysis of multi-span continuous steel-concrete composite box girder. Eng. Struct. 2021, 246, 113070. [Google Scholar] [CrossRef]
- Shi, J.; Zheng, K.; Tan, Y.; Yang, K.; Zhou, G. Response simulating interpolation methods for expanding experimental data based on numerical shape functions. Comput. Struct. 2019, 218, 1–8. [Google Scholar] [CrossRef]
- Sorensen, S.; Scordelis, A. Computer Program for Curved Prestressed Box Girder Bridge; Report No. Uc SESM80-10; University of Califomia: Berkeley, CA, USA, 1980. [Google Scholar]
- Tian, X. Discussing on the Design Theory of Curved Girder Bridge. Fujian Archit. Constr. 2005, 5, 356–358 (In Chinese). (In Chinese) [Google Scholar]


| Water (kg) | Cement (kg) | Fly Coal Ash (kg) | Mineral Powder (kg) | Sand (kg) | Gravel (kg) | Pumping Agent (kg) |
|---|---|---|---|---|---|---|
| 170 | 346 | 32 | 105 | 716 | 978 | 14 |
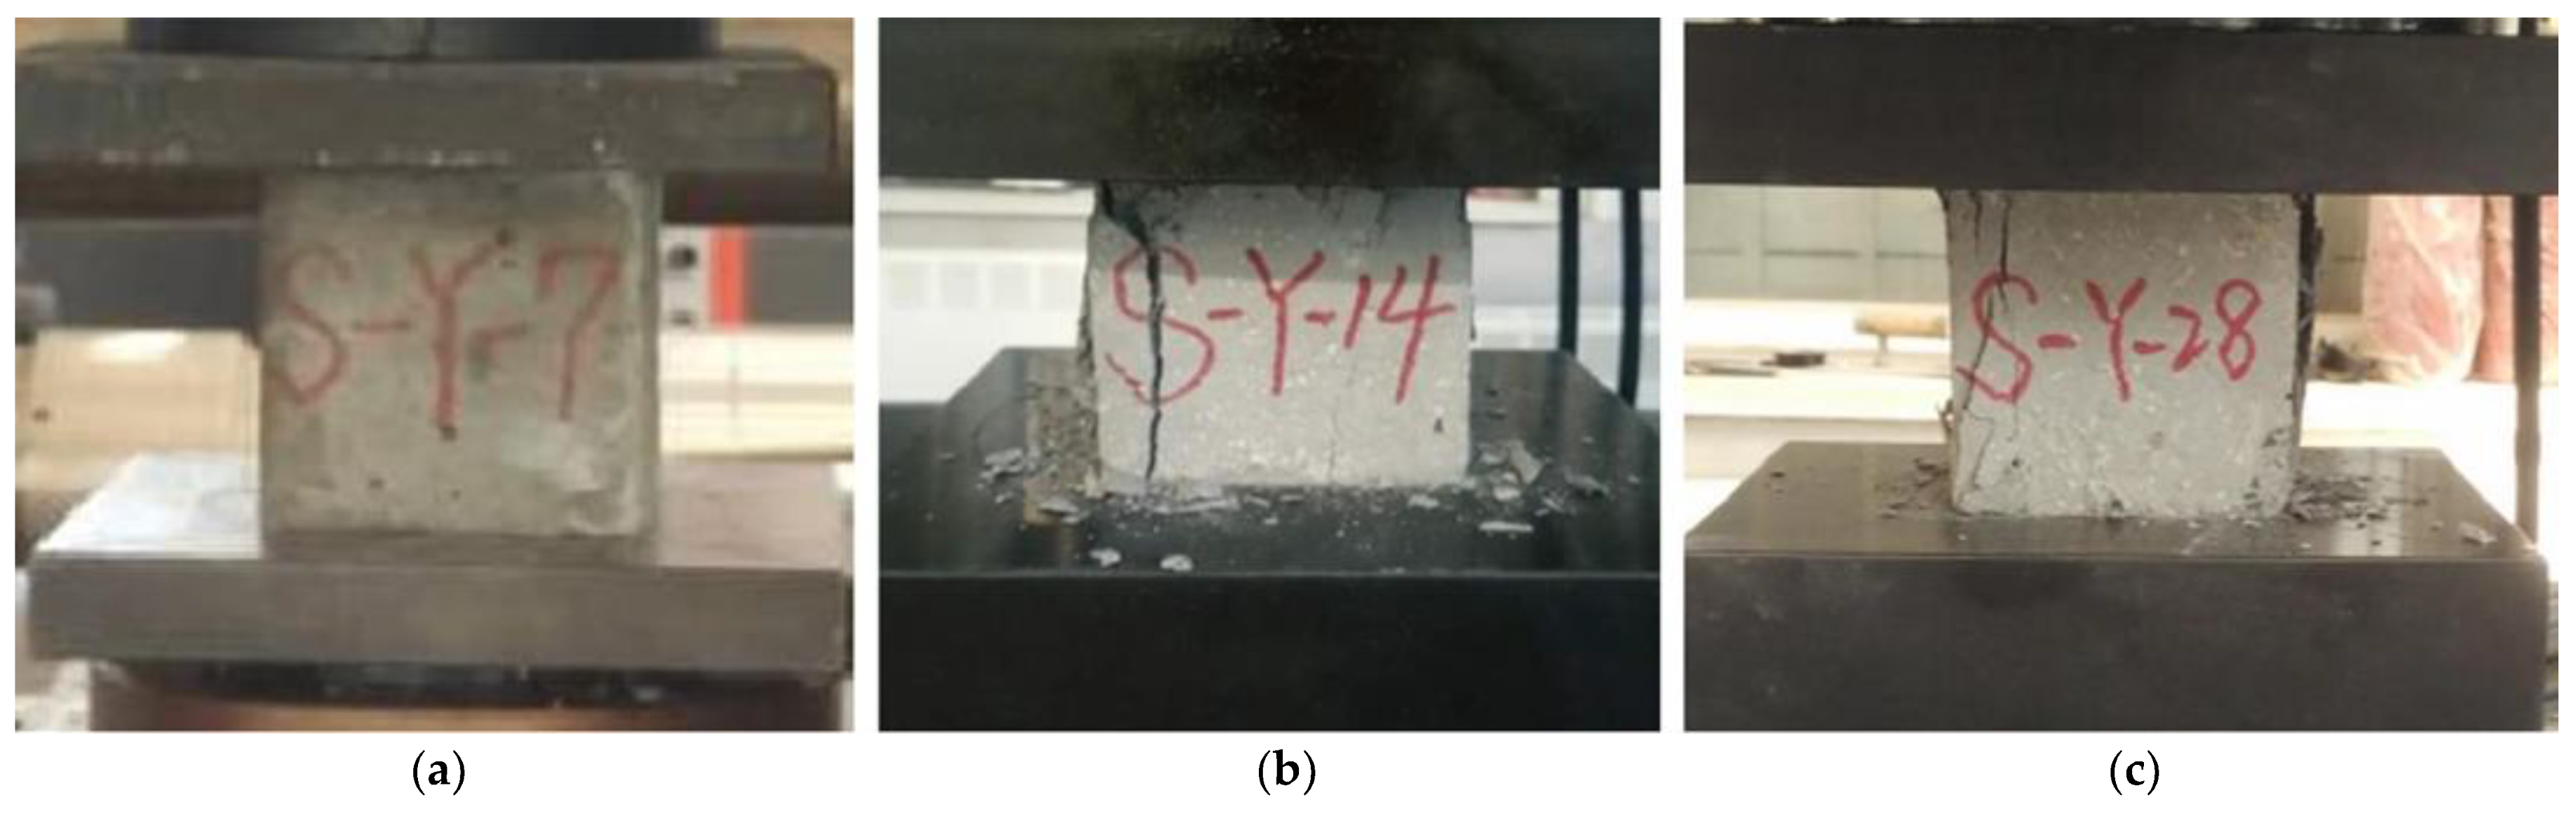
| Compressive Strength (MPa) | Bottom Plate Web/Top Plate | Bottom Plate Web/Top Plate | ||||
|---|---|---|---|---|---|---|
| Age(d) | 7 | 14 | 28 | 7 | 14 | 28 |
| Test sample 1 | 42.5 | 47.1 | 48.6 | 44.6 | 58.4 | 62.2 |
| Test sample 2 | 39.9 | 47.6 | 50.5 | 41.3 | 57.1 | 55.0 |
| Test sample 3 | 38.2 | 51.4 | 49.3 | 47.4 | 43.0 | 48.7 |
| Mean | 40.2 | 48.7 | 49.5 | 44.4 | 52.8 | 55.3 |
| Compressive strength at 0.95 confidence interval | 36.7 | 44.8 | 47.9 | 39.4 | 38.8 | 44.2 |
| Modulus of elasticity (GPa) | Sample 1 | Sample 2 | Sample 3 | Mean |
| 35 | 29 | 35 | 33 |
| Material Type | Diameter (mm) | Ultimate Strength (MPa) | Yield Strength (MPa) | Elongation (%) | Modulus of Elasticity (GPa) |
|---|---|---|---|---|---|
| Prestressed steel strand | 15.2 | 1978.4 | 1865.0 | 4.3 | 196.5 |
| Ordinary steel bar | 6 | 577.8 | 409.3 | 14.5 | 199.1 |
| Loading Case | The Contents of the Loading Case | Loading Schematic Diagram |
|---|---|---|
| Case 1 | Maximum bending moment at mid-span section F by live load | 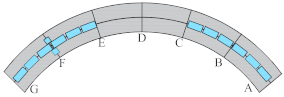 |
| Case 2 | Maximum bending moment at mid-span section B by live load | 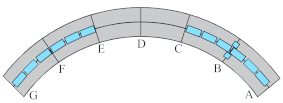 |
| Case 3 | Maximum bending moment at mid-span section D by live load | 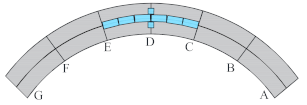 |
| Case 4 | Negative moment of support C by live load |  |
| Case 5 | Negative moment of support E by live load | 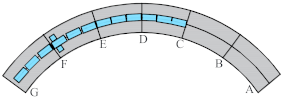 |
| Case 6 | The counterweight load for span E–G (Maximum positive bending moment in span F section) | 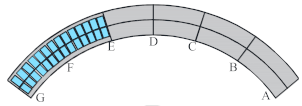 |
| Case 7 | The counterweight load for span C–E (Maximum positive bending moment in span D section) | 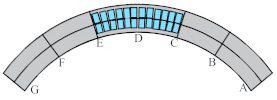 |
| Case 8 | The counterweight load for spans A–C (Maximum positive bending moment in span B section) |  |
Publisher’s Note: MDPI stays neutral with regard to jurisdictional claims in published maps and institutional affiliations. |
© 2022 by the authors. Licensee MDPI, Basel, Switzerland. This article is an open access article distributed under the terms and conditions of the Creative Commons Attribution (CC BY) license (https://creativecommons.org/licenses/by/4.0/).
Share and Cite
Yuan, J.; Luo, L.; Zheng, Y.; Yu, S.; Shi, J.; Wang, J.; Shen, J. Analysis of The Working Performance of Large Curvature Prestressed Concrete Box Girder Bridges. Materials 2022, 15, 5414. https://doi.org/10.3390/ma15155414
Yuan J, Luo L, Zheng Y, Yu S, Shi J, Wang J, Shen J. Analysis of The Working Performance of Large Curvature Prestressed Concrete Box Girder Bridges. Materials. 2022; 15(15):5414. https://doi.org/10.3390/ma15155414
Chicago/Turabian StyleYuan, Jian, Liang Luo, Yuzhou Zheng, Suhui Yu, Jun Shi, Jianan Wang, and Jiyang Shen. 2022. "Analysis of The Working Performance of Large Curvature Prestressed Concrete Box Girder Bridges" Materials 15, no. 15: 5414. https://doi.org/10.3390/ma15155414
APA StyleYuan, J., Luo, L., Zheng, Y., Yu, S., Shi, J., Wang, J., & Shen, J. (2022). Analysis of The Working Performance of Large Curvature Prestressed Concrete Box Girder Bridges. Materials, 15(15), 5414. https://doi.org/10.3390/ma15155414