
A New Stored Energy Model Based on Plastic Work of Back Stress during Cyclic Loading in Polycrystalline Metal


College of Mechanical Science and Engineering, Northeast Petroleum University, Daqing 163318, China
*
Author to whom correspondence should be addressed.
Materials 2022, 15(15), 5267; https://doi.org/10.3390/ma15155267
Submission received: 19 June 2022
/
Revised: 26 July 2022
/
Accepted: 27 July 2022
/
Published: 30 July 2022
(This article belongs to the Special Issue Fatigue Behavior, Lifetime Prediction and Modeling of Welding Process)
Abstract
:Two mesomechanics models were analyzed in an attempt to reveal the relationship between stored energy and back stress. It has been indicated that the portion of elastic stored energy due to residual microstresses (ESR) is closely related to intergranular back stress (Xinter), and the stored energy of dislocations inside grains (ESD) can be estimated with the plastic work of intragranular back stress (Xintra). Then, the evolution of back stress during cyclic loading was studied, and the plastic work of back stress (WpB) was calculated with the low cycle fatigue experimental data of Ti-6Al-4V. The result shows that WpB is partially released at every reverse loading, sufficient to reproduce the evolution of stored energy correctly under cyclic loading. The study also reveals that partially released energy is related to the decrease of Xinter at the initial state of reversal loading resulting from the reduction of the plastic strain incompatibility between grains.
1. Introduction
When a metal deforms plastically, most of the mechanical energy Wp expended in the deformation process is converted into heat Q. The remainder is stored in the material by creating and rearranging crystal imperfections, especially dislocations, stacking faults, etc. [1,2,3]. This is known as the stored energy of cold work ES, related to the damage leading to the initiation of fatigue microcracks [4,5].
Wp = Q + Es
The first attempts to describe stored energy were performed by Farren and Taylor [6]. Later, Taylor and Quinney [7] introduced the concept of stored energy and carried out a thorough study. An extensive review of the early work within this field was published by Bever et al. [8]. In these early studies, heat produced during deformation was measured using thermo-junctions or calorimeters. More attempts have been performed since then and today infrared radiometers or cameras are widely used [9,10,11,12]. Although there are differences in experimental methods, operators, and materials, the general trends are as follows:
- The stored energy Es is only a small part of the total plastic work Wp: only 1% to 15% for the pure metals [8].
The experimental results give impetus to the theoretical description of energy balance in material. One of the possible ways to calculate stored energy is based on the stress–strain curve. Martin [16], who regarded the segment of the plastic work associated with work hardening as accumulating damage, first proposed a stored energy method from the stress–strain curve, as shown in Figure 2a with the shaded area. Later, a dislocation model, on the assumption of the irreversibility of dislocation motion, was established by Tanaka [17] to prove that the shaded area in Figure 2a is the stored energy related to the dislocations of pile-up in a single crystal. However, this method is not available for polycrystalline materials, especially for low cycle fatigue.
Another stored energy method from the stress–strain curve is proposed by Skelton [18,19,20] and Aravas [3]; they suggested that the shaded area in Figure 2b is the internal energy stored in the metal, which is famously known as “complementary plastic strain energy”. However, Szczepinski [21] and Oliferuk et al. [10] pointed out that this method can give us only part of the stored energy related to residual mircrostresses during non-homogeneous plastic deformation between grains (ESR), which is much lower than that corresponding to the creation of defects (mainly dislocations) inside grains (ESD). According to Szczepinski’s separation [21], the total stored energy is a sum of two parts:
ES = ESR + ESD
In order to determine the evolution of the stored energy, the evolution of the defect structure needs to be predicted for the given loading conditions. Chaboche [15] and Mollica et al. [22], Kamlah [23] and Cho et al. [24] calculated the stored energy by a continuum framework with internal variables used to characterize the defect evolution. They found that back stress is an essential internal variable in establishing their stored energy models.
With the fast development of computer technology, Benzerga et al. [2] developed a discrete dislocation plasticity model to calculate the stored energy of cold work associated with defects of dislocations. They also found that most of the energy stored in the dislocations is associated with their long-range stress fields (back stress), which accounted for more than 95%. Recently, mesoscopic microstructure-based modeling approaches such as crystal plasticity finite element method (CPFEM), have been popular for calculating the stored energy in a heterogeneous polycrystalline [25]. However, those methods are too complex to be used in engineering applications.
Both of the two classical stored energy methods shown in Figure 2 are related to flow stress, which is usually composed of friction stress σF and back stress X. The friction stress, corresponding to the stress required locally for a dislocation to move, is mainly related to the short-range obstacles [26]. Many scholars [27,28,29,30] believe that heat dissipation phenomena are related to dislocation movements in the material lattice (internal friction): overcoming short-range obstacles, while back stress refers to the stress associated with a local strain process providing long-range interactions with mobile dislocations. Thus, back stress is closely related to the stored energy, while the friction stress corresponds to the dissipated heat. In addition, back stress can be further divided into two components [31,32], namely intergranular back stress Xinter, relating to the plastic strain incompatibilities between the different grains, and intragranular back stress Xintra, linking to the dislocation distribution structures inside the grains. Thus,
X = Xinter + Xintra
According to the definition, it is not difficult to discover that both ESR and Xinter refer to the heterogeneous deformation between different microstructures, while both ESD and Xintra correspond to the dislocation activities inside grains. Thus, this paper attempts to find the connection between back stress and energy storage by studying the role of back stress in constructing classical energy storage models.
2. Relationship between Stored Energy and Back Stress
2.1. Relationship between ESR and Xinter
The stored energy due to the residual microstresses remaining in a metal (ESR) has been studied by Szczepinski [21], on the basis of a simple mezomechanical model. This model represents a regular array of cuboidal A and B elements (Figure 3), based on the assumption that the elements deformed plastically without strain hardening, but each of them has a different yield stresses, and , respectively, which cause non-homogeneous plastic deformation of the composite during uniaxial tensile loading, as illustrated in Figure 4. At the point of D, when the A element begins to deform plastically, the plastic strain of B element has been ∆εp greater than that of A element, and the plastic strain difference (∆εp) remains unchanged during the subsequent deformation. At the point of E, the friction stress of the composite is , and the back stress is
Note that this model excludes strain hardening of the A and B elements. Hence, the back stress arising during plastic deformation could only be related to plastic strain incompatibilities between grains, namely intergranular back stress Xinter. From Equation (4), the larger the difference between and , the greater value of Xinter, which indicates that Xinter is a macro character of the microscopically structural inhomogeneity.
After unloading, the residual tensile stresses remain in the A element while the residual compressive stresses remain in the B element, as shown in Figure 4, and they are of the same absolute value:
Moreover, they are also equal to Xinter in Equation (4). Thus, Xinter can be used to evaluate the magnitude of residual microstresses. The elastic energy per unit volume stored in the model due to the residual stresses remained in elements is equal:
where and E is the elastic modulus of elements. This energy density is equal to the complementary plastic strain energy density, EC, the shaded triangle ∆CDP in Figure 4, which can be easily estimated from the stress–strain diagram by measuring the area dashed in Figure 2b.
When the uniaxial loading direction is reversed, as shown in Figure 4b, the weaker B element first reaches its compressive yield stress and deforms plastically along M→H. In contrast, the A element remains in the elastic state and deforms along N→H, reducing the plastic strain difference (∆εp) and releasing residual microstresses remaining in elements. At the point of H, where the two reversal loading curves intersect, the plastic strain difference reduces to zero, and the intergranular back stress Xinter = 0, as shown in Figure 4b. After unloading, there are no residual microstresses remaining in A and B elements anymore; That is, , and no elastic energy is stored in the composite as well: .
Thus, at the initial stage of reversal loading, the release of stored energy connected to the residual microstresses is attributed to decreased plastic strain incompatibility from grain to grain.
As the reversal loading continues, the stored energy increases again, as shown in Figure 4b. From H to I, the B element deforms plastically in the reversal direction. In contrast, the A element remains in the elastic state and deforms along H→L. Thus, the degree of the plastic strain incompatibility increases again between elements, which increases the absolute value of intergranular back stress |Xinter|. At the point of J, the intergranular back stress
as shown in Figure 4b. After unloading, residual compressive stresses and residual tensile stresses remain in the A and B elements, respectively:
Thus, during the subsequent reversal loading, the elastic energy per unit volume stored in the model due to residual stresses remaining in elements is equal to the stored energy during the tensile process.
Overall, in the mesomechanics model, our study on the process of loading and reversal loading reveals that the accumulation or dissipation of ESR is related to the increase or decrease of residual microstresses remaining in elements resulting from the increase or decrease of the degree of the plastic strain incompatibility between grains. While the |Xinter| is a macroscopic representation of the residual microstresses, the ESR can be expressed by Xinter in the formula form of Equation (6).
2.2. Relationship between ESD and Xintra
In the real material, besides the energy stored due to residual microstresses (ESR), there is also the energy connected with the creation of defects (mainly dislocations) in particular grains (ESD). Thus, the strain-hardening effect inside grains should be accounted for. A dislocation model was introduced by Tanaka [17] to study the stored energy of dislocations within long-range stress fields inside a single crystal, as shown in Figure 5.
In this model, the dislocations generated in a most favorably oriented grain under the tensile stress are piled up against the grain boundary, as illustrated in Figure 5a, causing the long-range stress inside the grain, namely the dislocation stress τD, corresponding to the intragranular back stress Xintra. The dislocation stress τD and the plastic displacement Φ(x) depend on the dislocation density D(x). The stored energy of dislocations in unit volume has been given by Tanaka [17].
Using the inversion formula of Muskhelishvili, Equation (9) can be simplified as:
where τ is the loading of stress, k is the friction stress and γ is the plastic strain. Therefore, the amount of stored energy of dislocations (ESD) for a single crystal is equal to plastic work done by Xintra, corresponding to the segment of the plastic work associated with work hardening as shown in Figure 5b by the shaded triangles.
The above analysis demonstrates that both ESR and ESD can be simply expressed by Xinter and Xintra, respectively, in Equations (6) and (10). Thus, it is reasonable to assume that there is a close connection between stored energy ES and plastic work of back stress WpB during working hardening.
3. Plastic Work of Back Stress during Cyclic Loading
During cyclic tests, the plastic work of back stress (WpB) is dependent on the evolution of back stress.
3.1. Hysteresis Loop of Back Stress
From a mechanical point of view, the back stress, X, corresponds to the translation of the elastic domain, whereas the friction stress, σF, represents the radius of this domain. Thus, according to Kuhlmann’s method [33], the back stress and friction stress can be extracted directly from the hysteresis loops, as schematically in Figure 6, where σF is determined at a reversed plastic strain offset (εoffset) within the range of 5 × 10⁻⁶~10−3, as suggested in references [32,34,35]. The back stress X can be thus obtained by σa = X + σF. However, this method can only give out the internal stresses at the peak point.
During cyclic loading, Kuhlmann [33] also pointed out that the friction stress is approximately the same at the beginning and end of each half cycle with only slow changes from one cycle to the next, which indicate that only kinematic hardening (represented by X) is taken into account in a complete cycle. Thus, it is justifiable to assume that the size of the elastic domain remains unchanged and only the center of the yield surface travels along the loading path. In the case of kinematic hardening, the stress, at any given moment t, can be given by [36].
where , according to the direction of plastic strain, as illustrated in Figure 7a at A’ point. The circles in Figure 7a represent the yield surface with a fixed radius of σF.
In the case of tension-going, , the back stress increases from E to G along an upward locus . While the loading direction reverses, , the back stress decreases from G to E along a downward locus as shown in Figure 7a with dot lines. Let the short-range interaction stress (σS) equal to the second term of the right-hand side of Equation (11): , then Equation (11) can be rewritten as
The hysteresis loop of σS turns into a rectangle, as shown in Figure 7b with dot lines, and the hysteresis loop of X turns into a fusiform loop, as shown in Figure 7b with bold lines.
In Figure 7b, the total plastic work expended around the hysteresis loop is defined as ‘plastic strain hysteresis energy’, Wp, and is given by . According to Equation (12), the plastic work done by external stress can be divided into two components as follows:
In the first item of Equation (13), the absolute value of σS is equal to the friction stress σF during cyclic plastic deformation; thus, it is defined as plastic work of friction stress, WpF.
This work, corresponding to the shaped rectangle area of the loop in Figure 7b with dot lines, is related to the dissipated work against the friction stress resulting from the movement of dislocations: overcoming short-range obstacles [29].
The second item of Equation (13) is the plastic work done by the back stress, WpB.
This work, corresponding to the shaped spindle area of the loop in Figure 7b, is associated with internal energy stored during the work-hardening process.
3.2. Accumulation and Dissipation of the Plastic Work of Back Stress
In the case of tensile-going loading, as shown in Figure 8a, the plastic work done by the back stress WpB1 can be easily integrated from X1-εp curve, as given by a definite integral of for curve 1 according to the Equation (15). Mathematically, the definite integral is defined as the signed area of the region in the X-εp plane that is bounded by the graph of curve 1 and the εp-axis and two vertical boundary lines. Thus, the area I below the εp-axis subtracts from the total, while the area II above the εp-axis adds to the total. However, during the compression-going loading, as shown in Figure 8b, the orientation of the definite integral of for curve 2 is reversed; thus, the sign of the integral should be switched. Then, the area III above the εp-axis subtracts from the total, while the area IV below the εp-axis adds to the total. The negative areas I and III are related to the release of the previously cumulated plastic work of back stress when the absolute value of back stress |X| decreases to zero at each reverse loading. Finally, the total plastic work of back stress per cycle, ∆WpB, is equal to the area of the closed loop in Figure 8c.
To simplify the calculation, the plastic work of back stress per cycle, ∆WpB, can also be obtained by subtracting the plastic work of friction stress per cycle, ∆WpF, from the total plastic work per cycle, ∆Wp.
in which,
Since the friction stress is assumed to be a constant during a single complete cycle, ∆WpF can be simply expressed by
where ∆εp is the plastic strain range.
In our previous work [37], the low cycle fatigue experiments of Ti-6Al-4V alloy have already been carried out with a total strain-controlled mode, with a ratio of -1, a constant total strain rate of 4 × 10⁻³ s−1 and a triangular waveform performed on a computer-controlled 250 kN MTS810 closed-loop servo-hydraulic test machine at room temperature. Strain control was achieved by extensometer (12 mm gage length) arm tips located on the gage length. The strain amplitude chosen for the present tests ranges from 0.7% to 2.0%. The tests were continued until fracture. The correlation between the low cycle fatigue behavior of Ti-6Al-4V alloy and its microstructure evolution has been discussed in our previous work [37]. This paper will focus on the evolution of the plastic work of back stress during cyclic loading with different strain amplitudes.
Transmission electron microscopy (TEM) examinations were also carried out to study the microstructure evolutions during cyclic deformations. At the small strain amplitude of 0.7%, the heterogeneous dislocation distribution between the adjoining αp grains with different orientations is visible in Figure 9a. The grain boundary acts as a solid barrier to slips, so that the high density of dislocation lines observed in soft grain cannot cross through but only pile up at the grain boundary, which leads to a plastic strain incompatibility between microstructures and generates the long-range internal stresses between hard/soft grains, namely Xinter. When the load is removed, the residual tensile stress remains in hard grains, and residual compressive stress remains in soft grains, as illustrated in Figure 4a. Associated with these residual microstresses is the elastic energy remaining in the internal structure after plastic deformation [21], i.e., ESR. The other part of stored energy, ESD, is related to the high density of dislocation lines in the soft grain and dislocation pile-ups at the grain boundary, which produces the internal stress inside soft αp grain in Figure 9a, namely Xintra. At the high strain amplitude of 2.0%, as shown in Figure 9b, homogeneous dislocation structure is observed in both of the two adjoining αp grains, which indicates that plastic deformation of the Ti-alloy tends to homogenization from grain-to-grain throughout the microstructures. Furthermore, the density of dislocation inside αp grains is larger than that at low strain amplitude. Thus, the contribution of residual microstresses will decrease with the increasing applied strain.
The back stress and friction stress have been extracted from the hysteresis loops with εoffset = 10−4 in reference [37] according to Kuhlmann’s method [33]. The hysteresis loop of back stress can be easily calculated from Equation (12), in which σS is a constant for each half cycle. Based on the numerical integration of X-εp cyclic loops, we can observe the evolution of WpB and its partial released for each half cycle quantitatively. Figure 10a–c give out the evolution of WpB as a function of the total plastic work Wp at strain amplitudes of 0.8%, 1.2%, and 2.0%, respectively. It is observed that the WpB does not change monotonically during a half cycle, but instead decreases first and then increases in sequence. The dotted lines in Figure 10 predict very similar evolutions to the measurements made by Halford [14] as shown in Figure 1, i.e., that the stored energy is released at the very beginning of every reverse loading. According to the theoretical analysis in Section 2.1, the elastic energy connected with the residual microstresses (ESR) stored during the non-homogeneous plastic deformation is partially or completely released at every half cycle while |Xinter| decreases to zero, resulting from the decrease of the degree of the plastic strain incompatibility from grain-to-grain at the initial stage of reversal deformation, which could also be used to explain the phenomenon of the release of stored energy during cyclic loading.
It is convenient to separate the plastic work of back stress changes during a half cycle into a cumulative and a released component, as illustrated in Figure 11. By doing so, the released part of the plastic work of back stress (Wrel), corresponding to the ESR, can be directly compared from test-to-test with different applied strains. Figure 12a shows the half-life plastic work of back stress per cycle ∆WpB and its released energy per cycle ∆Wrel versus strain. The ∆WpB increases linearly with increasing strain while ∆Wrel increases are gently first and then tends to be stable. Thus, as expected, the ratio of ∆Wrel/∆WpB drops exponentially from 18% to 2% for Ti-6Al-4V alloy with increasing strain (Figure 12b), which further confirmed that the proportion of ESR decreases with increasing strain when the plastic deformation between heterogeneous microstructures tends to be more homogeneous.
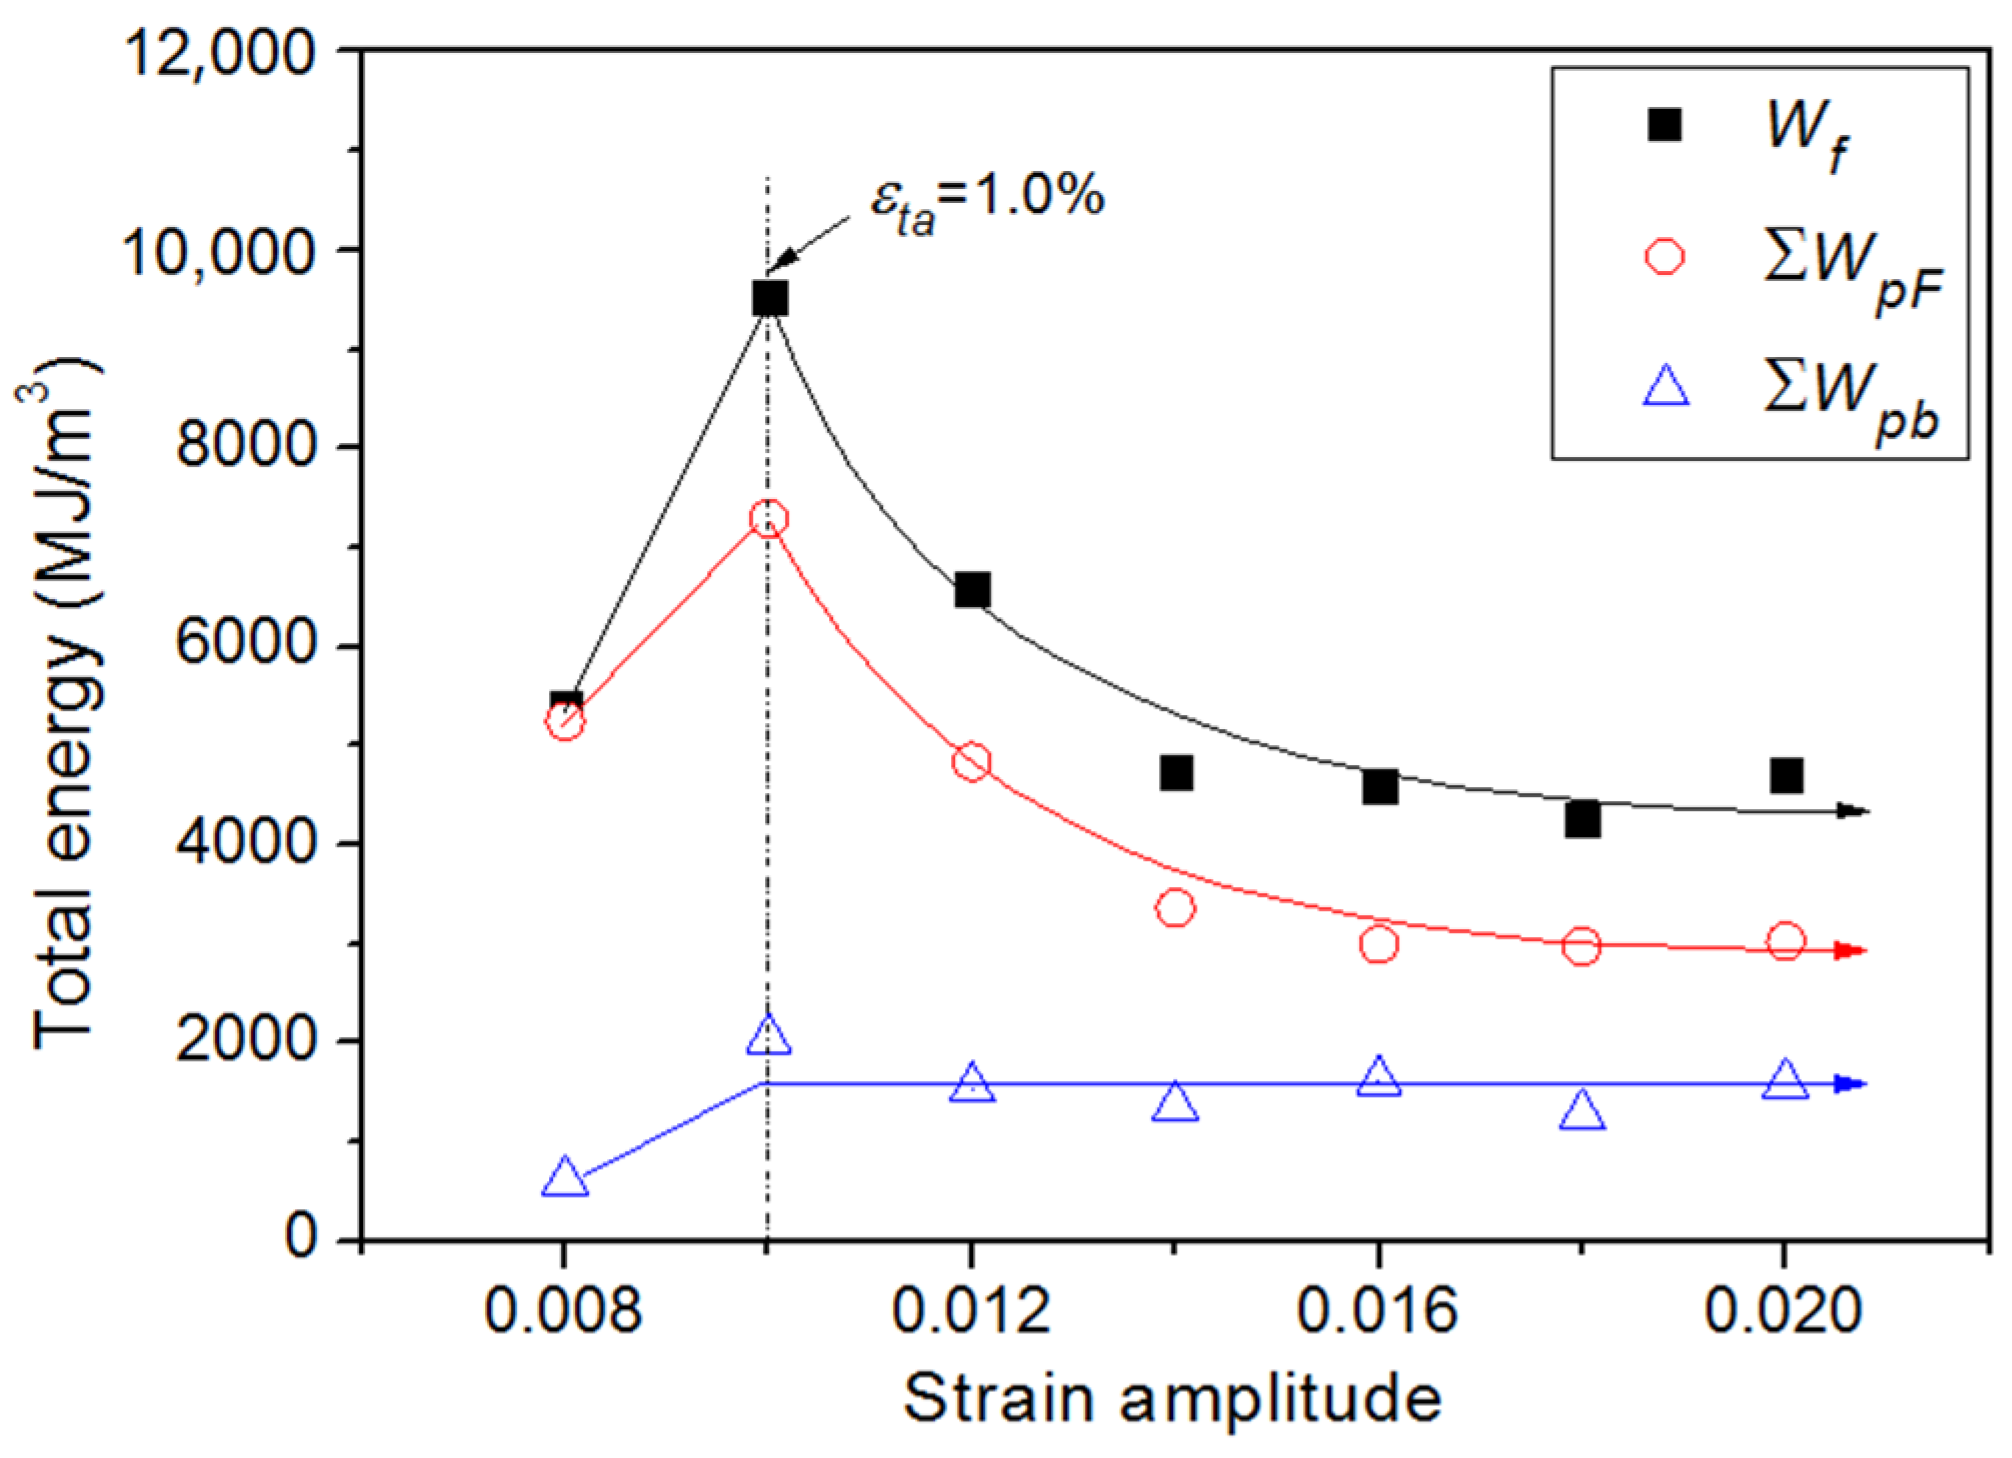
According to the Equations (1), (3), and (4), the ∆Wp, ∆WpF and ∆WpB have been calculated and displayed in Figure 13 as the function of the logarithm of the number of cycles at various applied strains. As can be noted from the comparison between Figure 13a,b, the evolution of ∆WpF are consistent with that of ∆Wp at any applied strain. Both of them increase with cyclic numbers at small strain ranges (εta ≤ 1.0~1.2%) and decrease at large strain ranges (εta > 1.0~1.2%). However, the evolution of ∆WpB has a different tendency, which stays almost constant with increasing cyclic numbers while εta < 1.8%, and shows a decreasing tendency while εta ≥ 1.8% (Figure 13c). The total hysteresis energy (or fatigue toughness) Wf, the total plastic work of friction stress ∑WpF and the total plastic work of back stress ∑WpB up to failure for all specimens tested are also present in Figure 14. All of them show a maximum value at the strain amplitude of 1.0%, which corresponds to the breaking point of the bilinear behavior observed in the C-M plot of Ti-6Al-4V Alloy [37]. It may be seen from Figure 14 that both of Wf and ∑WpF decrease exponentially with increasing applied strain at the strain range of εta ≥ 1.0%, while ∑WpB remains relatively constant over the strain range of εta ≥ 1.0%. Wong et al. [38] also found that the total stored energy is almost constant while the total hysteresis energy varies over the fatigue life range. Thus, the plastic work of back stress is sufficient to correctly reproduce and explain the evolution of stored energy during cyclic loading.
4. Conclusions
In this work, two mesomechanics models were analyzed in an attempt to find the connection between back stress and stored energy. Then the evolution of back stress during cyclic loading was studied, and the plastic work of back stress (WpB) was calculated with the low cycle fatigue experimental data of Ti-6Al-4V. The main findings of this study can be summarized as follows:
- (1)
- Based on the mesomechanics model, our study on the process of cyclic loading reveals that the partial release of stored energy is related to the decrease of residual microstresses remaining in elements resulting from the decrease of the degree of the plastic strain incompatibility between grains. Additionally, the |Xinter| is a macroscopic representation of the residual microstresses.
- (2)
- In Tanaka′s dislocation model, the amount of stored energy of dislocations (ESD) for a single crystal is equal to plastic work done by Xintra.
- (3)
- The plastic work of back stress (WpB) was calculated with the low cycle fatigue experimental data of Ti-6Al-4V. The results show that WpB is partially released at every reverse loading, sufficient to reproduce the evolution of stored energy correctly under cyclic loading. Furthermore, the total plastic work of back stress ∑WpB up to failure is almost constant over the strain range of εta ≥ 1.0%, while the fatigue toughness Wf decrease exponentially with increasing applied strain. Thus, the plastic work of back stress is a more suitable damage criterion.
Is the plastic work of back stress the stored energy? Further theoretical analysis and experimental verification are still needed. The crystal plasticity finite element method (CPFEM) is a useful alternative for quantifying the stored deformation energy. It is also a great tool for investigating the relationship between plastic work of inter/intra back stress and inter/intra stored energy.
Author Contributions
Conceptualization, H.X. and W.L.; methodology, H.X. and Y.Z.; validation, W.L.; formal analysis, X.L.; investigation, H.X. and P.J.; data curation, X.L. and Y.L.; writing—original draft preparation, H.X.; writing—review and editing, X.L. and Y.Z.; supervision, W.L.; project administration, H.X. and W.L.; funding acquisition, H.X. and W.L. All authors have read and agreed to the published version of the manuscript.
Funding
This research work was funded by the Department of Science and Technology of Heilongjiang Province Key R&D Program of Heilongjiang Province, grant number GZ20210122; the Youth funds of Northeast Petroleum University, grant number 2019QNL-16 and 2019QNL-32.
Institutional Review Board Statement
Not applicable.
Informed Consent Statement
Not applicable.
Data Availability Statement
Data can be provided upon request from the corresponding author.
Conflicts of Interest
The authors declare no conflict of interest.
References
- Xiong, Q.L.; Li, Z.; Shimada, T.; Kitamura, T. Energy storage and dissipation of elastic-plastic deformation under shock compression: Simulation and Analysis. Mech. Mater. 2021, 158, 103876. [Google Scholar] [CrossRef]
- Benzerga, A.A.; Bréchet, Y.; Needleman, A.; Van der Giessen, E. The stored energy of cold work: Predictions from discrete dislocation plasticity. Acta Mater. 2005, 53, 4765–4779. [Google Scholar] [CrossRef] [Green Version]
- Aravas, N.; Kim, K.S.; Leckie, F.A. On the calculations of the stored energy of cold work. J. Eng. Mater. Technol. 1990, 112, 465–470. [Google Scholar] [CrossRef] [Green Version]
- Meneghetti, G. Analysis of the fatigue strength of a stainless steel based on the energy dissipation. Int. J. Fatigue 2007, 29, 81–94. [Google Scholar] [CrossRef]
- Xu, Y.; Wan, W.; Dunne, F.P. Microstructural fracture mechanics: Stored energy density at fatigue cracks. J. Mech. Phys. Solids 2021, 146, 104209. [Google Scholar] [CrossRef]
- Farren, W.S.; Taylor, G.I. The heat developed during plastic extension of metals. Proc. R. Soc. Lond. 1925, 107, 422–451. [Google Scholar]
- Taylor, G.I.; Quinney, H. The latent energy remaining in a metal after cold working. Proc. R. Soc. Lond. 1934, 143, 307–326. [Google Scholar]
- Bever, M.B.; Holt, D.L.; Titchener, A.L. The stored energy of cold work. Prog. Mater. Sci. 1973, 17, 5–177. [Google Scholar] [CrossRef]
- Hodowany, J.; Ravichandran, G.; Rosakis, A.J.; Rosakis, P. Partition of plastic work into heat and stored energy in metals. Exp. Mech. 2000, 40, 113–123. [Google Scholar] [CrossRef]
- Oliferuk, W.; Maj, M. Stress–strain curve and stored energy during uniaxial deformation of polycrystals. Eur. J. Mech.-A/Solids 2009, 28, 266–272. [Google Scholar] [CrossRef] [Green Version]
- Oliferuk, W.; Maj, M.; Zembrzycki, K. Determination of the energy storage rate distribution in the area of strain localization using infrared and visible imaging. Exp. Mech. 2015, 55, 753–760. [Google Scholar] [CrossRef] [Green Version]
- Bartels, A.; Bartel, T.; Canadija, M.; Mosler, J. On the thermomechanical coupling in dissipative materials: A variational approach for generalized standard materials. J. Mech. Phys. Solids 2015, 82, 218–234. [Google Scholar] [CrossRef]
- Helm, D. Thermomechanical representation of the stored energy during plastic deformation. Int. J. Mater. Res. 2010, 101, 972–980. [Google Scholar] [CrossRef]
- Halford, G.R. Stored Energy of Cold Work Changes Induced by Cyclic Deformation; University of Illinois at Urbana-Champaign: Champaign, IL, USA, 1966. [Google Scholar]
- Chaboche, J.L. Cyclic viscoplastic constitutive equations, part II: Stored energy—Comparison between models and experiments. J. Appl. Mech. 1993, 60, 822–828. [Google Scholar] [CrossRef]
- Martin, D.E. An energy criterion for low-cycle fatigue. J. Fluids Eng. 1961, 83, 565. [Google Scholar] [CrossRef]
- Tanaka, K.; Mura, T. A dislocation model for fatigue crack initiation. J. Appl. Mech. 1981, 48, 97–103. [Google Scholar] [CrossRef]
- Skelton, R.P. Cyclic stress-strain properties during high strain fatigue. In High Temperature Fatigue; Springer: Dordrecht, The Netherlands, 1987; pp. 27–112. [Google Scholar]
- Skelton, R.P. Bauschinger and yield effects during cyclic loading of high temperature alloys at 550 °C. Mater. Sci. Technol. 1994, 10, 627–639. [Google Scholar] [CrossRef]
- Skelton, R.P. Bauschinger yield in the range 400–1025 C during cyclic deformation of high temperature alloys. Mater. High Temp. 2013, 30, 241–260. [Google Scholar] [CrossRef]
- Szczepiński, W. The stored energy in metals and the concept of residual microstresses in plasticity. Arch. Mech. 2001, 53, 615–629. [Google Scholar]
- Mollica, F.; Rajagopal, K.R.; Srinivasa, A.R. The inelastic behavior of metals subject to loading reversal. Int. J. Plast. 2001, 17, 1119–1146. [Google Scholar] [CrossRef]
- Kamlah, M.; Haupt, P. On the macroscopic description of stored energy and self heating during plastic deformation. Int. J. Plast. 1997, 13, 893–911. [Google Scholar] [CrossRef]
- Cho, H.E.; Hammi, Y.; Bowman, A.L.; Karato, S.I.; Baumgardner, J.R.; Horstemeyer, M.F. A unified static and dynamic recrystallization Internal State Variable (ISV) constitutive model coupled with grain size evolution for metals and mineral aggregates. Int. J. Plast. 2019, 112, 123–157. [Google Scholar] [CrossRef]
- Kim, D.K.; Woo, W.; Park, W.W.; Im, Y.T.; Rollett, A. Mesoscopic coupled modeling of texture formation during recrystallization considering stored energy decomposition. Comput. Mater. Sci. 2017, 129, 55–65. [Google Scholar] [CrossRef] [Green Version]
- Giordana, M.F.; Alvarez-Armas, I.; Armas, A. Microstructural characterization of EUROFER 97 during low-cycle fatigue. J. Nucl. Mater. 2012, 424, 247–251. [Google Scholar] [CrossRef]
- Oliferuk, W.; Świa̧tnicki, W.A.; Grabski, M.W. Effect of the grain size on the rate of energy storage during the tensile deformation of an austenitic steel. Mater. Sci. Eng. A 1995, 197, 49–58. [Google Scholar] [CrossRef]
- Connesson, N.; Maquin, F.; Pierron, F. Dissipative energy: Monitoring microstructural evolutions during mechanical tests. In Thermomechanics and Infra-Red Imaging; Springer: New York, NY, USA, 2011; Volume 7, pp. 59–65. [Google Scholar]
- Maquin, F.; Pierron, F. Heat dissipation measurements in low stress cyclic loading of metallic materials: From internal friction to micro-plasticity. Mech. Mater. 2009, 41, 928–942. [Google Scholar] [CrossRef]
- Caillard, D.; Martin, J.L. (Eds.) Thermally Activated Mechanisms in Crystal Plasticity; Elsevier: Amsterdam, The Netherlands, 2003. [Google Scholar]
- Mughrabi, H. A two-parameter description of heterogeneous dislocation distributions in deformed metal crystals. Mater. Sci. Eng. 1987, 85, 15–31. [Google Scholar] [CrossRef]
- Feaugas, X. On the origin of the tensile flow stress in the stainless steel AISI 316L at 300 K: Back stress and effective stress. Acta Mater. 1999, 47, 3617–3632. [Google Scholar] [CrossRef]
- Kuhlmann-Wilsdorf, D.; Laird, C. Dislocation behavior in fatigue II. Friction stress and back stress as inferred from an analysis of hysteresis loops. Mater. Sci. Eng. 1979, 37, 111–120. [Google Scholar] [CrossRef]
- Fournier, B.; Sauzay, M.; Caës, C.; Noblecourt, M.; Mottot, M. Analysis of the hysteresis loops of a martensitic steel: Part I: Study of the influence of strain amplitude and temperature under pure fatigue loadings using an enhanced stress partitioning method. Mater. Sci. Eng. A 2006, 437, 183–196. [Google Scholar] [CrossRef]
- Moosbrugger, J.C.; Morrison, D.J.; Jia, Y. Nonlinear kinematic hardening rule parameters—relationship to substructure evolution in polycrystalline nickel. Int. J. Plast. 2000, 16, 439–467. [Google Scholar] [CrossRef]
- Lemaitre, J.; Chaboche, J.L. Mechanics of Solid Materials; Cambridge University Press: Cambridge, UK, 1994. [Google Scholar]
- Xu, H.; Ye, D.; Mei, L. A study of the back stress and the friction stress behaviors of Ti-6Al-4V alloy during low cycle fatigue at room temperature. Mater. Sci. Eng. A 2017, 700, 530–539. [Google Scholar] [CrossRef]
- Wong, A.K.; Kirby, G.C., III. A hybrid numerical/experimental technique for determining the heat dissipated during low cycle fatigue. Eng. Fract. Mech. 1990, 37, 493–504. [Google Scholar] [CrossRef]
Figure 1.
The evolution of stored energy versus accumulated plastic work during cyclic loading for metal.
Figure 1.
The evolution of stored energy versus accumulated plastic work during cyclic loading for metal.
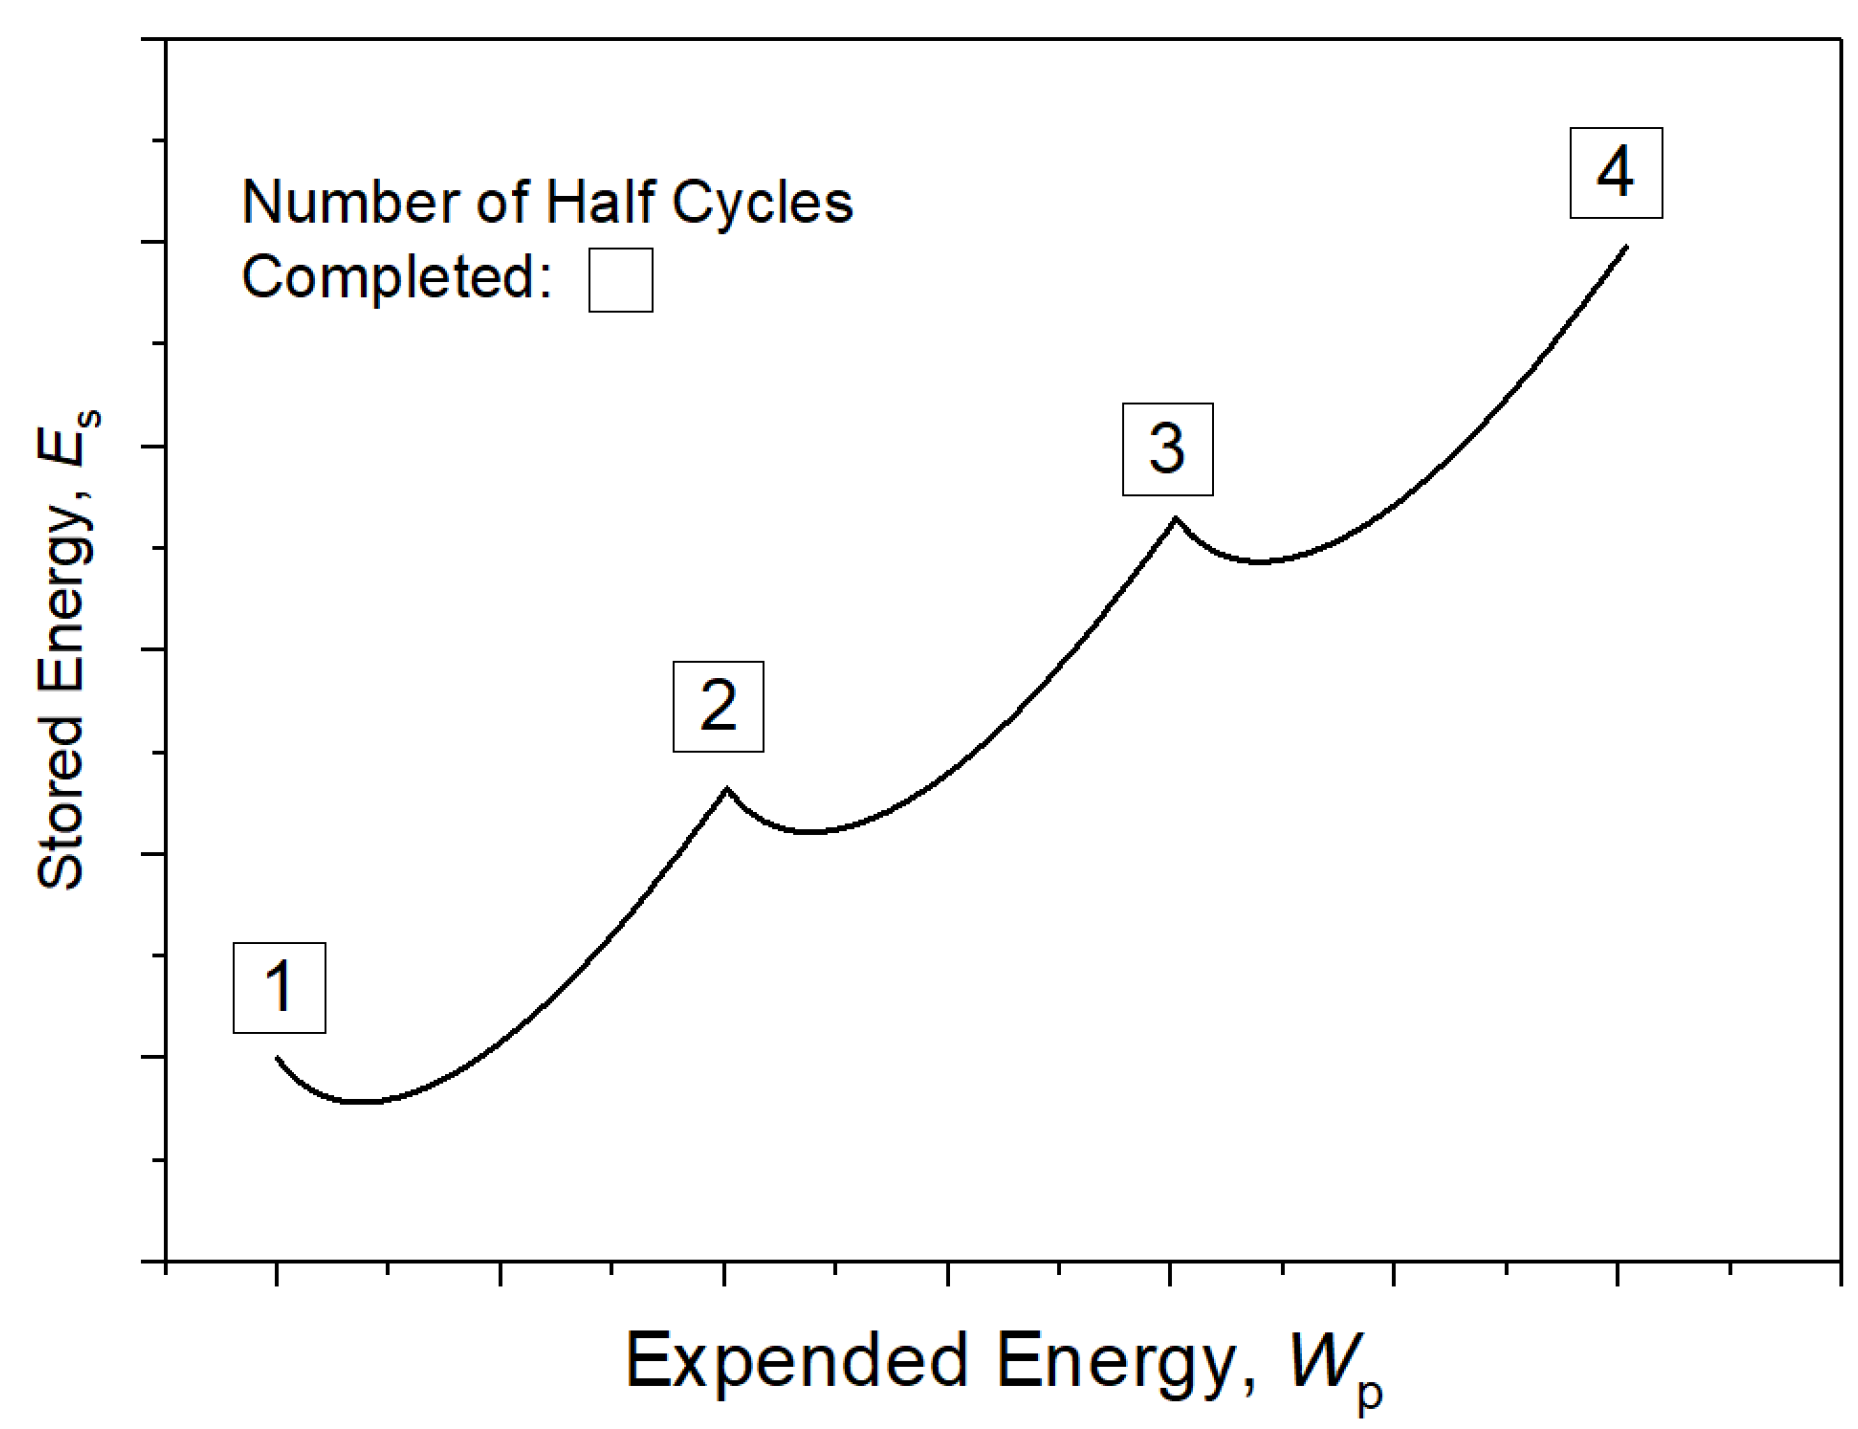
Figure 2.
Stored energy models based on the stress–strain relation: (a) stored energy associated with working hardening; (b) stored energy connected with residual stress.
Figure 2.
Stored energy models based on the stress–strain relation: (a) stored energy associated with working hardening; (b) stored energy connected with residual stress.
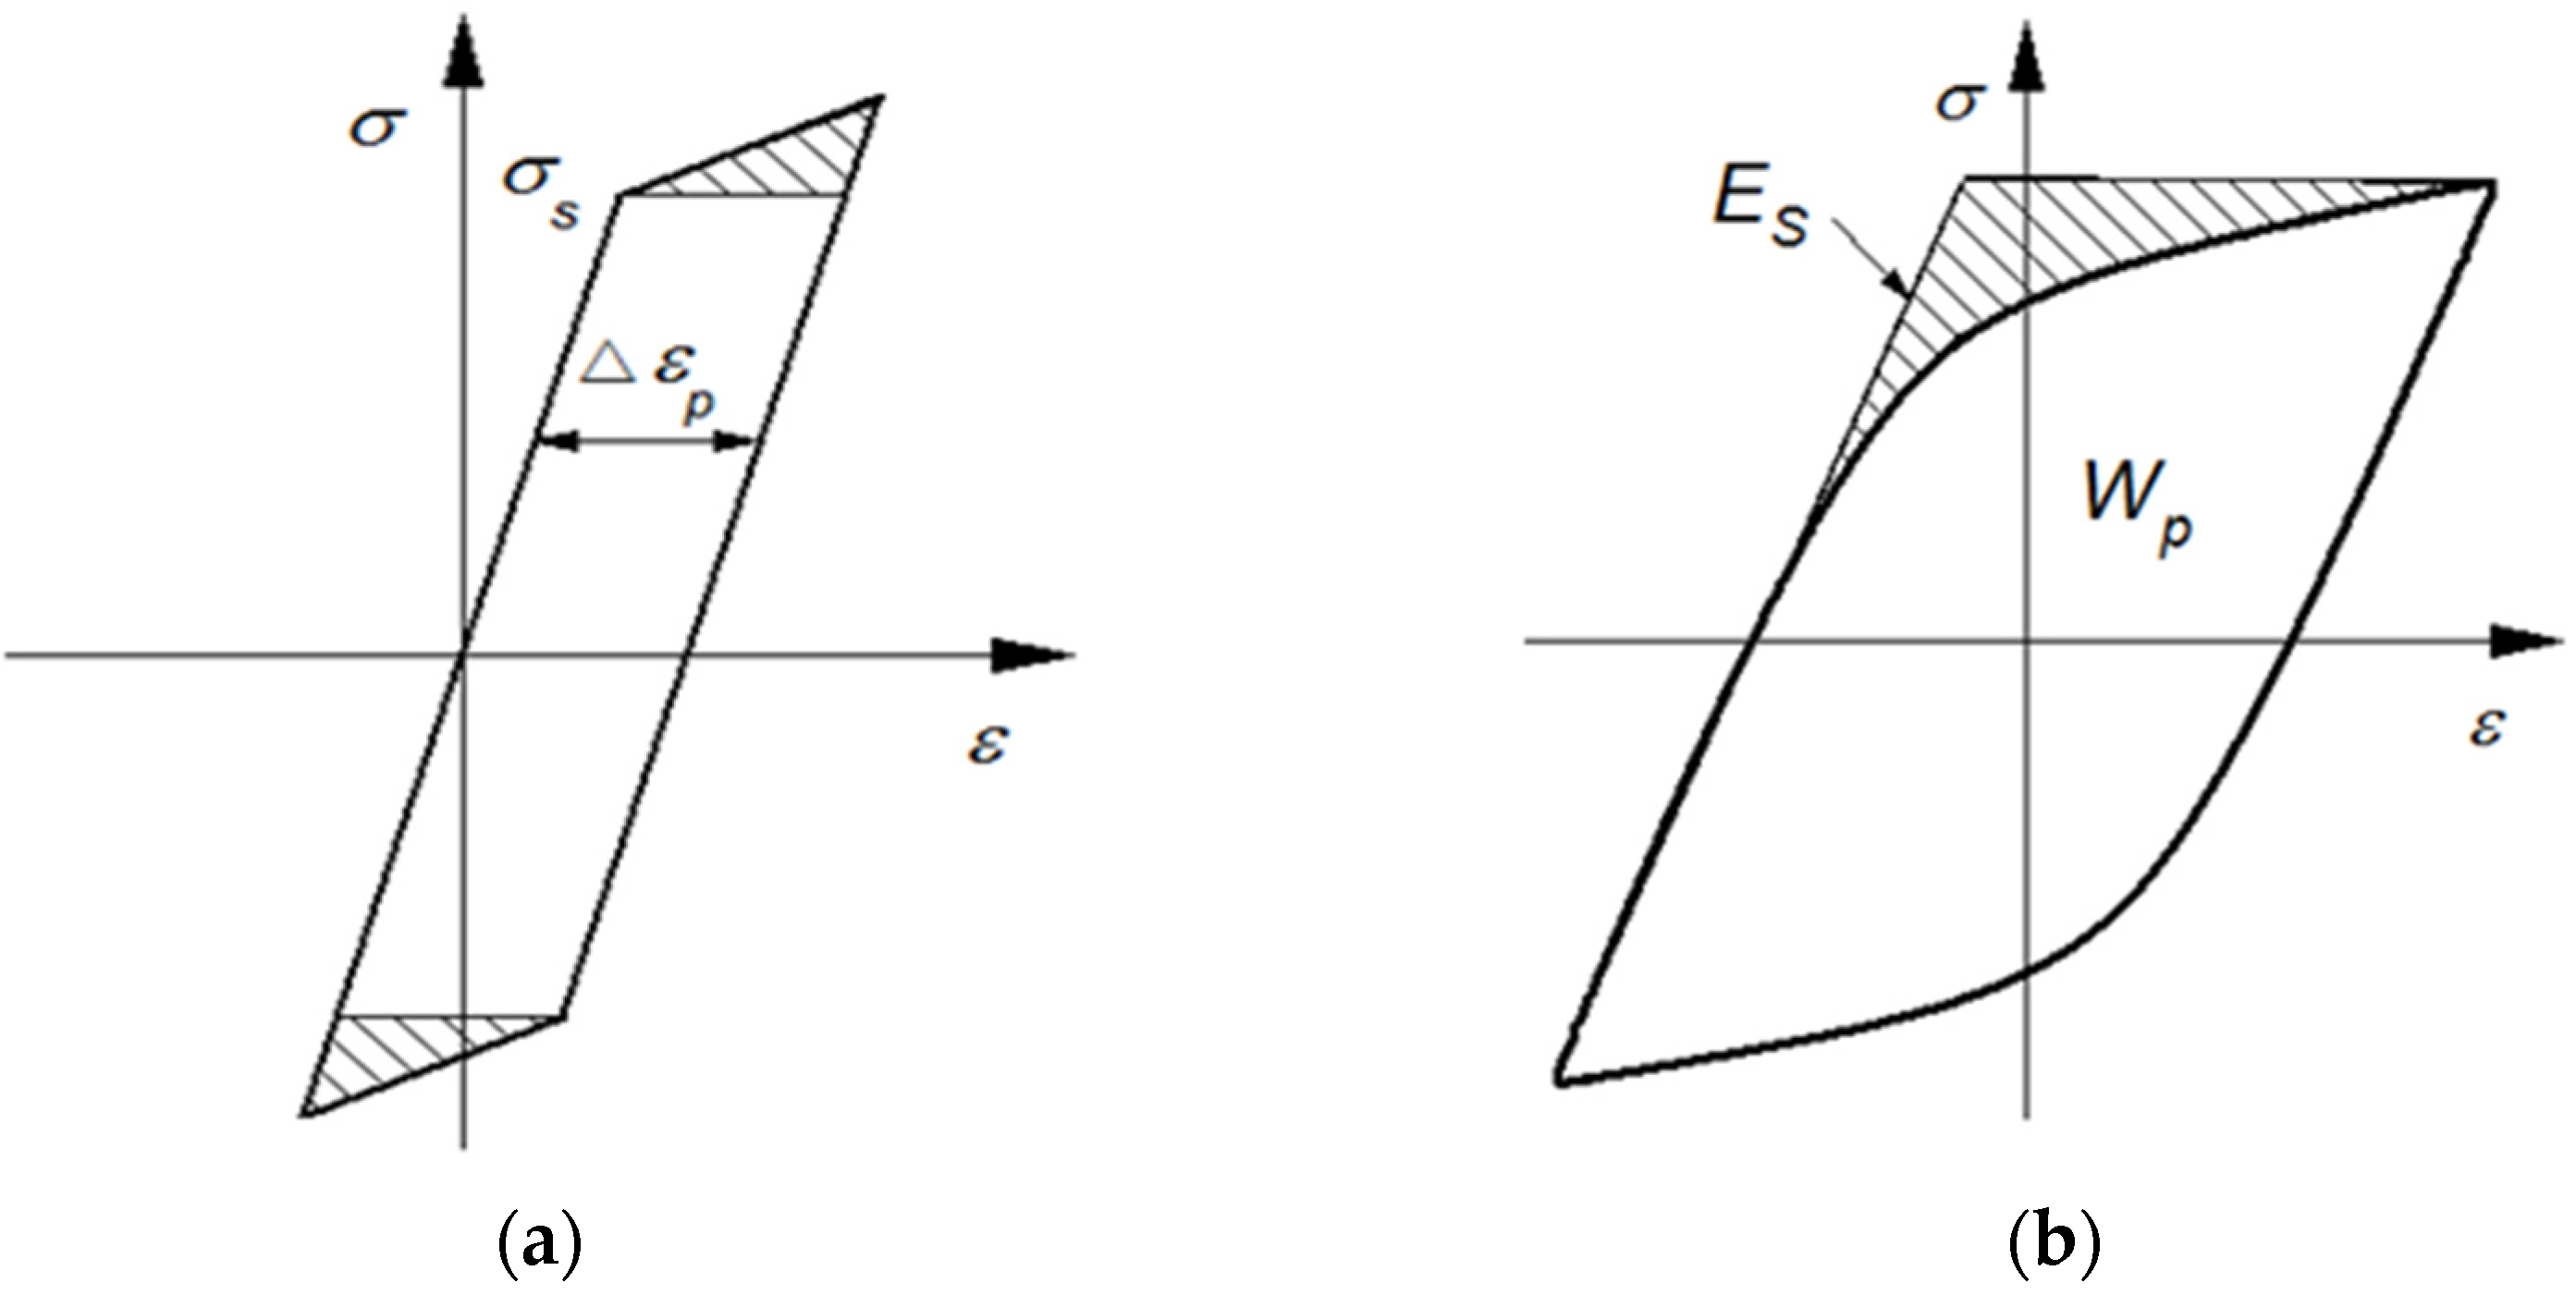
Figure 3.
The mesomechanical model of polycrystalline material consisting two kinds of cuboidal elements with different yield stress.
Figure 3.
The mesomechanical model of polycrystalline material consisting two kinds of cuboidal elements with different yield stress.
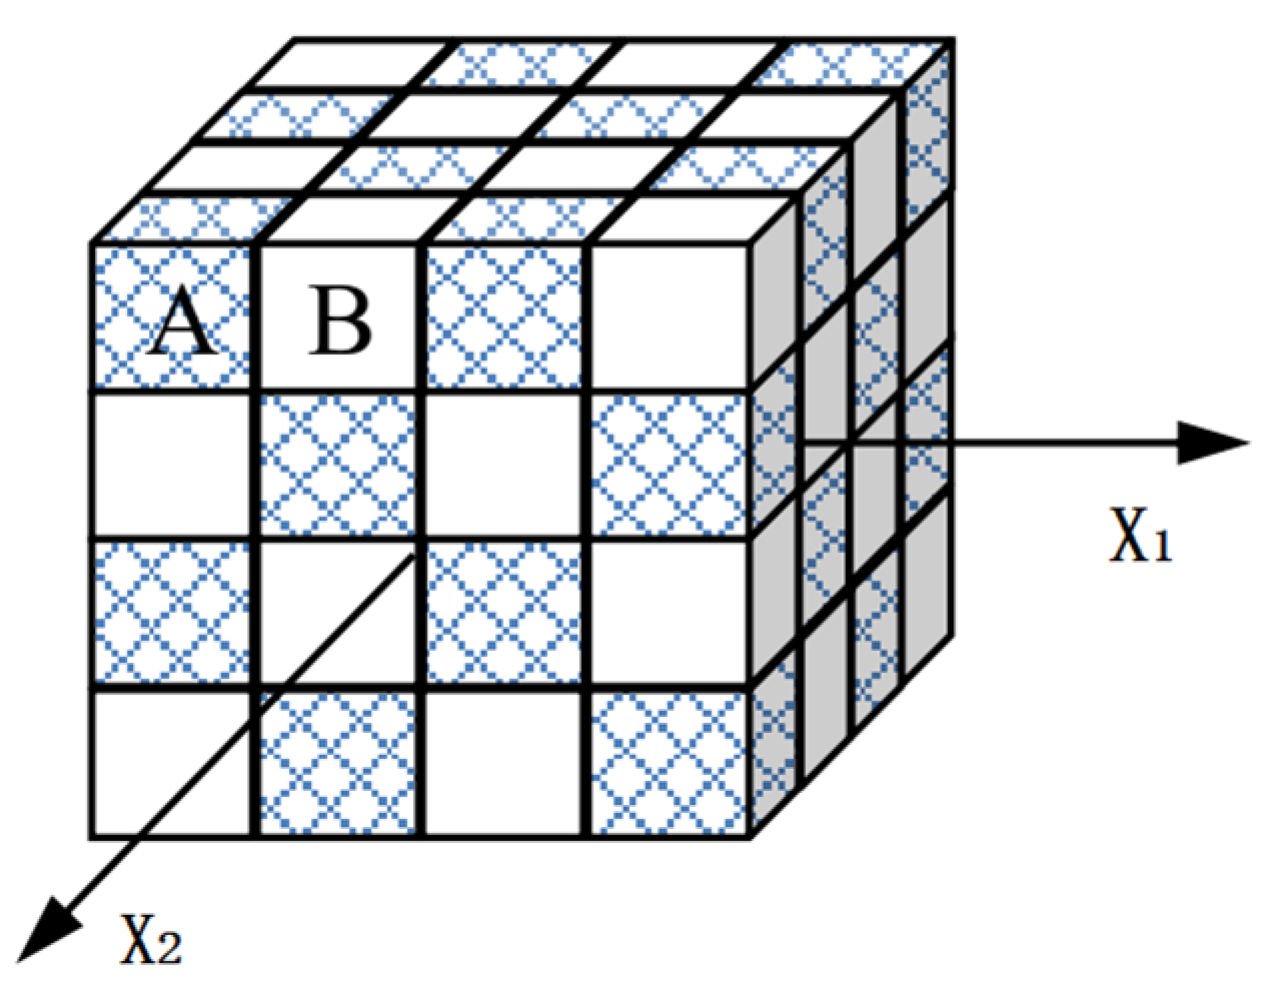
Figure 4.
Stress–strain relation for the model is shown in Figure 3: (a) tension-going and (b) compression-going. The letters “A” and “B” represent two elements with different yield stresses and .
Figure 4.
Stress–strain relation for the model is shown in Figure 3: (a) tension-going and (b) compression-going. The letters “A” and “B” represent two elements with different yield stresses and .

Figure 5.
Stored energy model based on dislocation theory in a single crystal: (a) dislocation motion in a most favorably oriented grain; (b) stored energy in the stress–strain hysteresis loop. The k represents initial yield stress in a single crystal, while the Δγ is the strain range.
Figure 5.
Stored energy model based on dislocation theory in a single crystal: (a) dislocation motion in a most favorably oriented grain; (b) stored energy in the stress–strain hysteresis loop. The k represents initial yield stress in a single crystal, while the Δγ is the strain range.
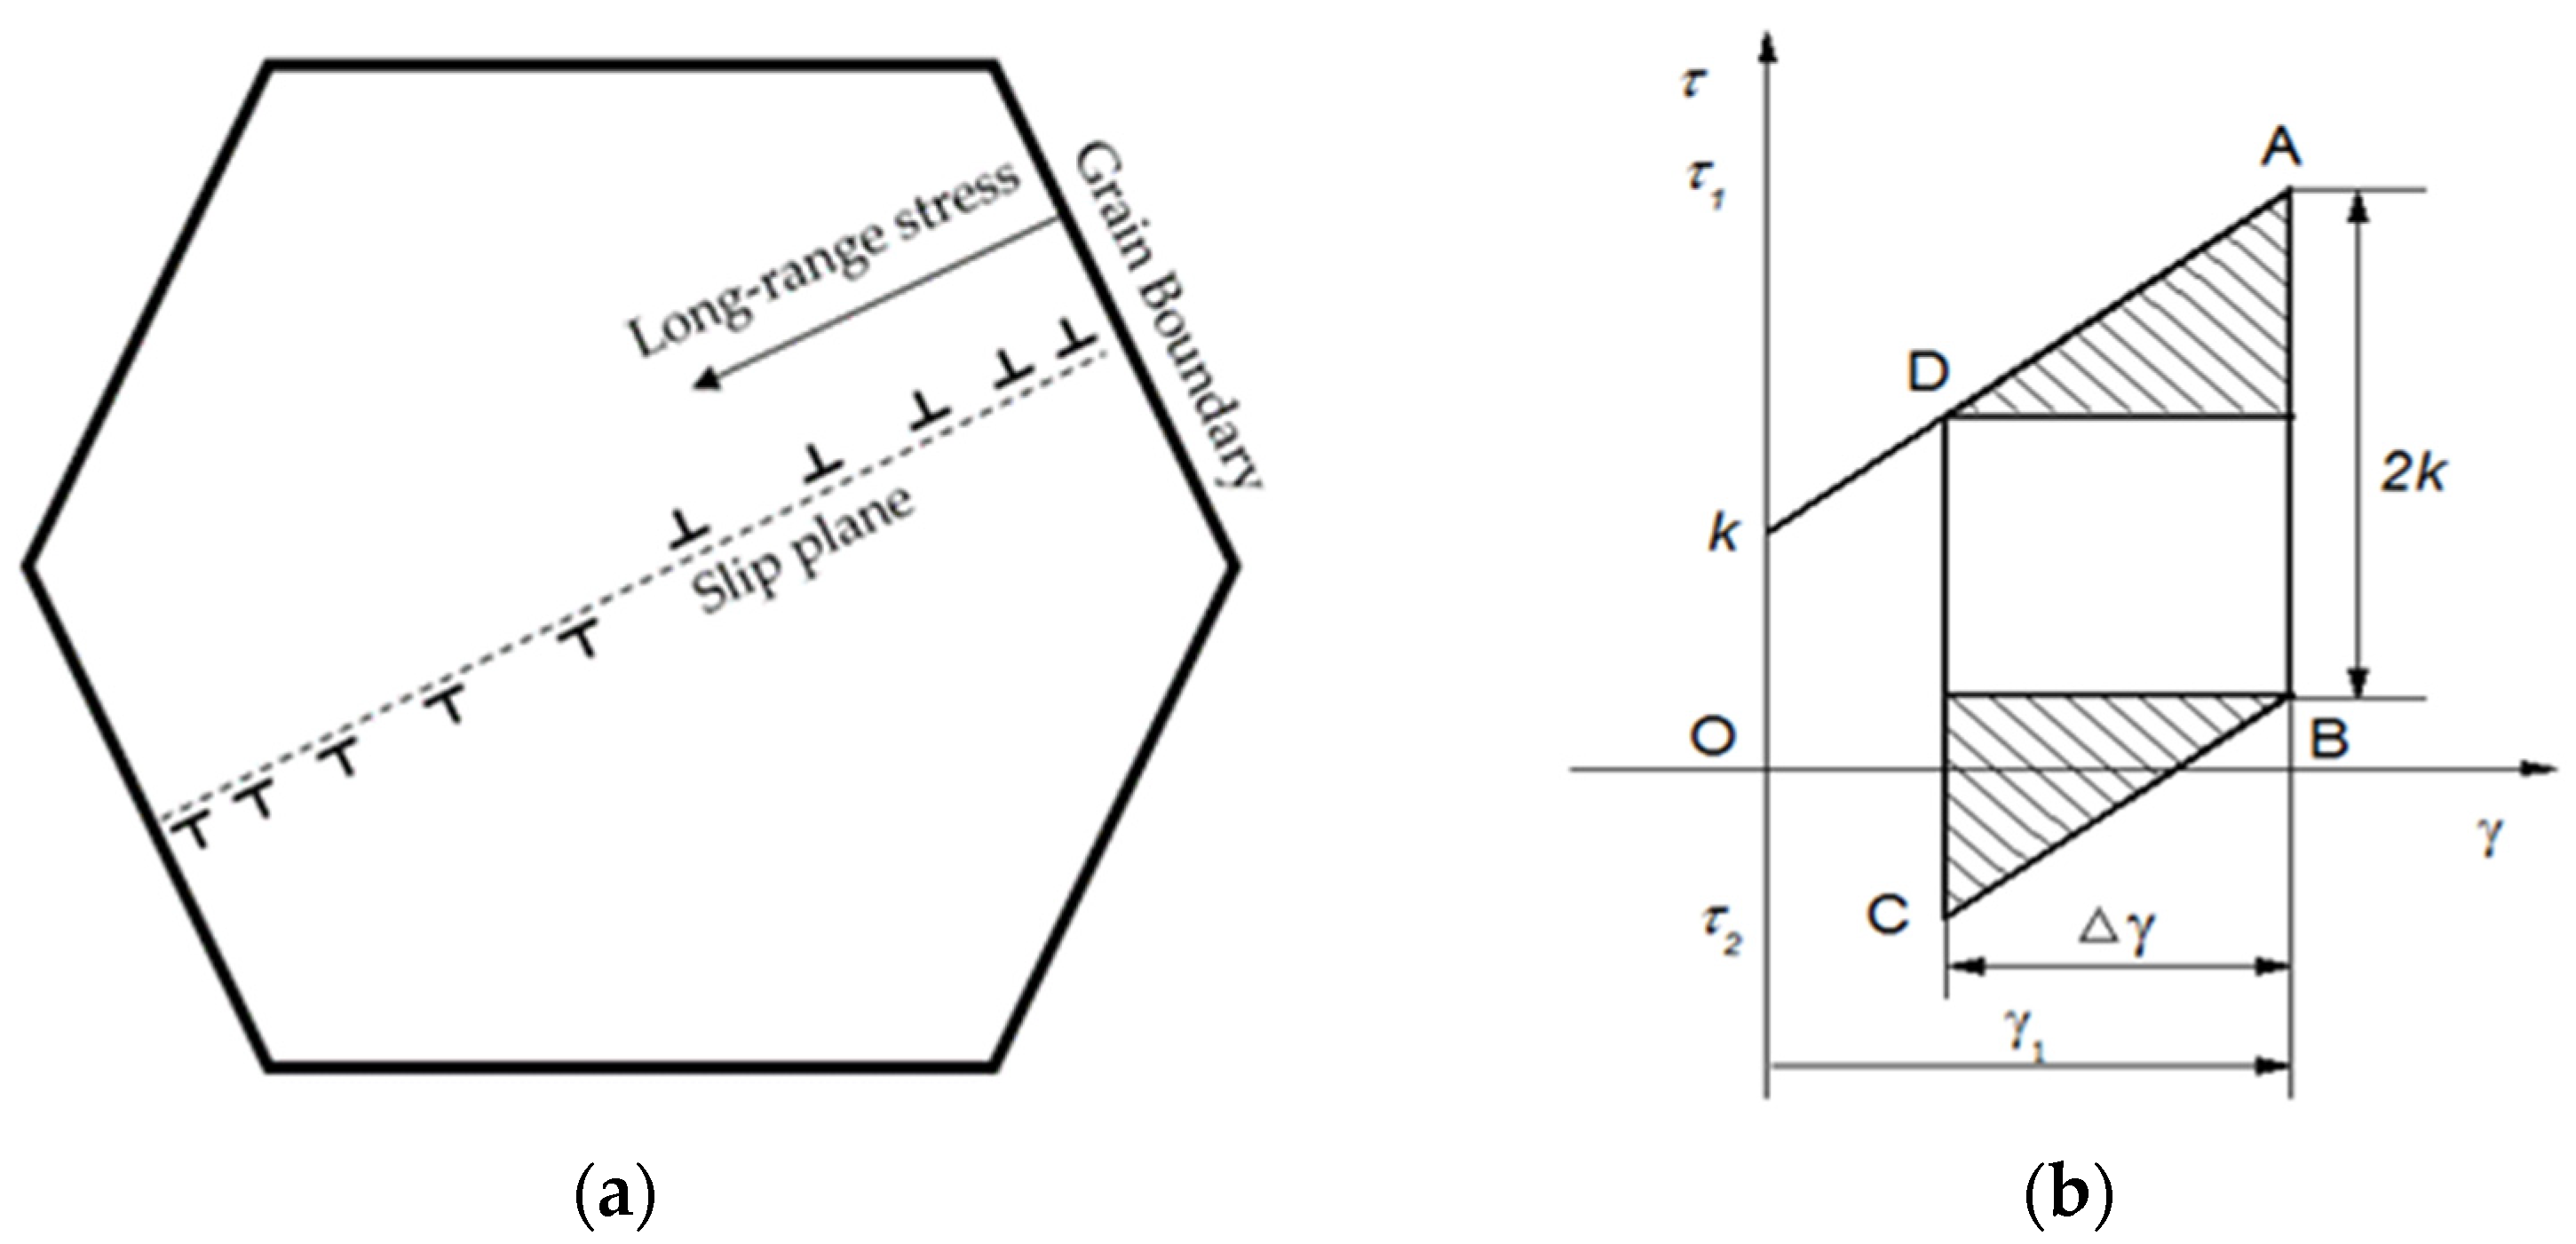
Figure 6.
Determination of the back stress and the friction stress from the hysteresis loop.
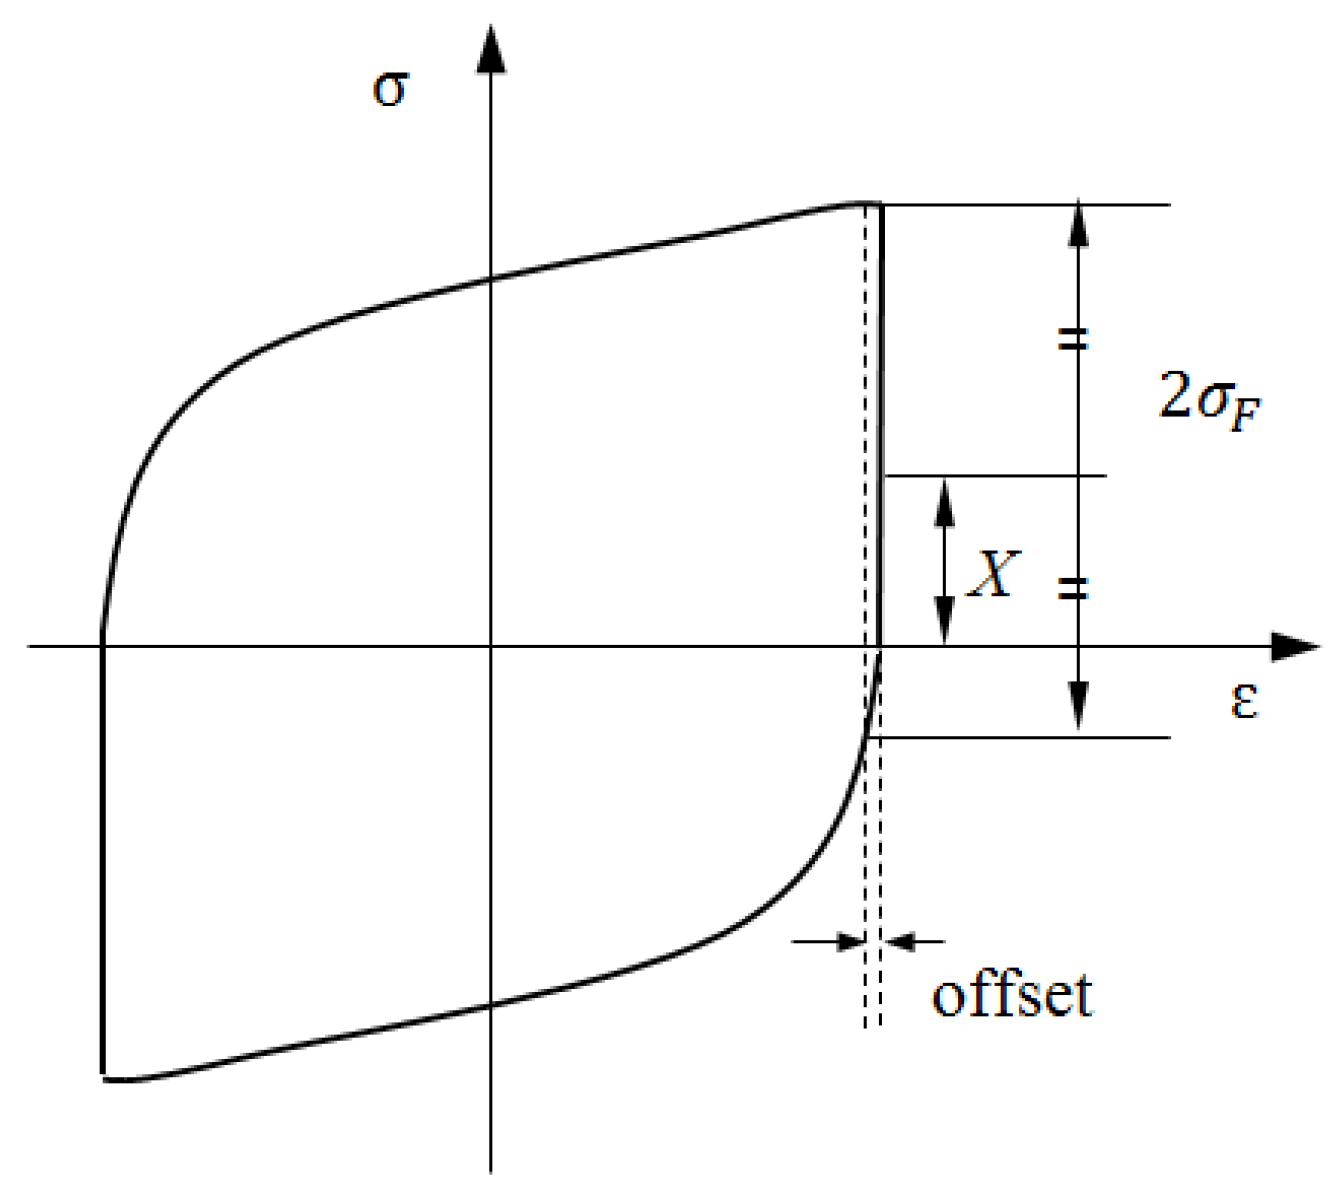
Figure 7.
Internal stresses change around the loop. (a) back stress (blue dot lines); (b) friction stress (red dot lines).
Figure 7.
Internal stresses change around the loop. (a) back stress (blue dot lines); (b) friction stress (red dot lines).
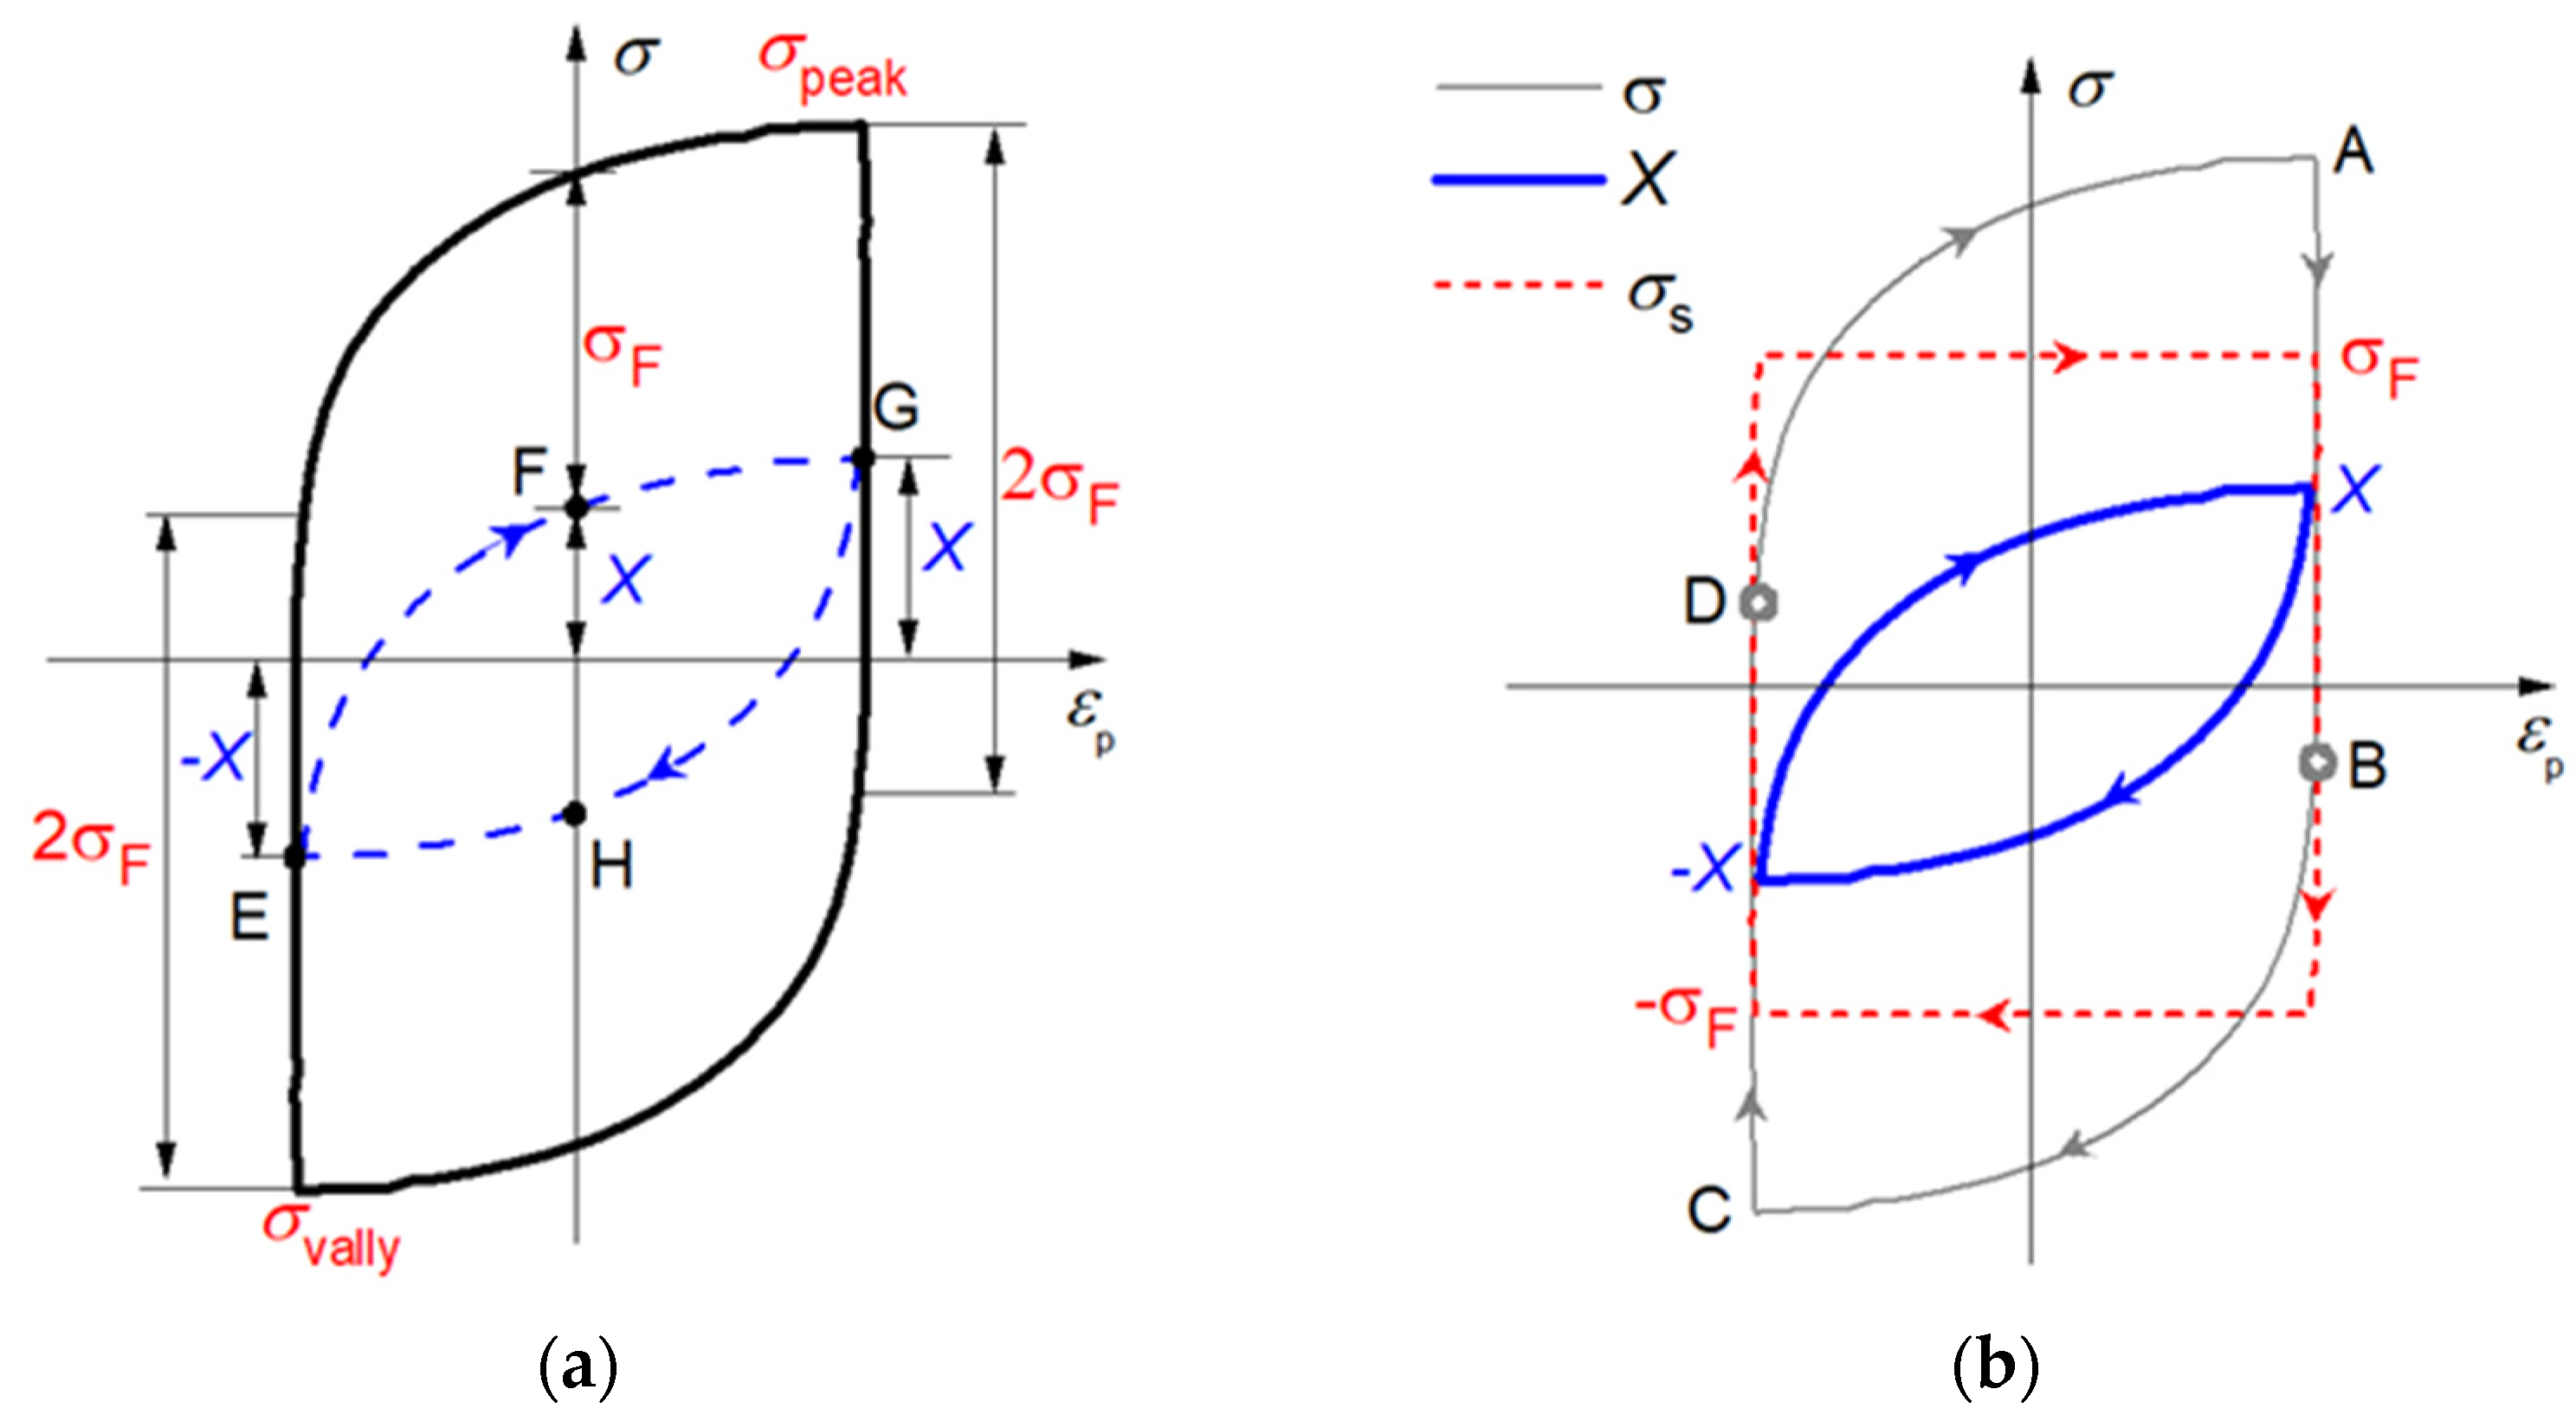
Figure 8.
The accumulation and dissipation of plastic work of back stress during cyclic loading. (a) Curve1: Tension-going; (b) Curve2: Compression-going; (c) Closed loop. The symbol ⊕ represents the positive area, while the symbol ㊀ represents the negative area.
Figure 8.
The accumulation and dissipation of plastic work of back stress during cyclic loading. (a) Curve1: Tension-going; (b) Curve2: Compression-going; (c) Closed loop. The symbol ⊕ represents the positive area, while the symbol ㊀ represents the negative area.
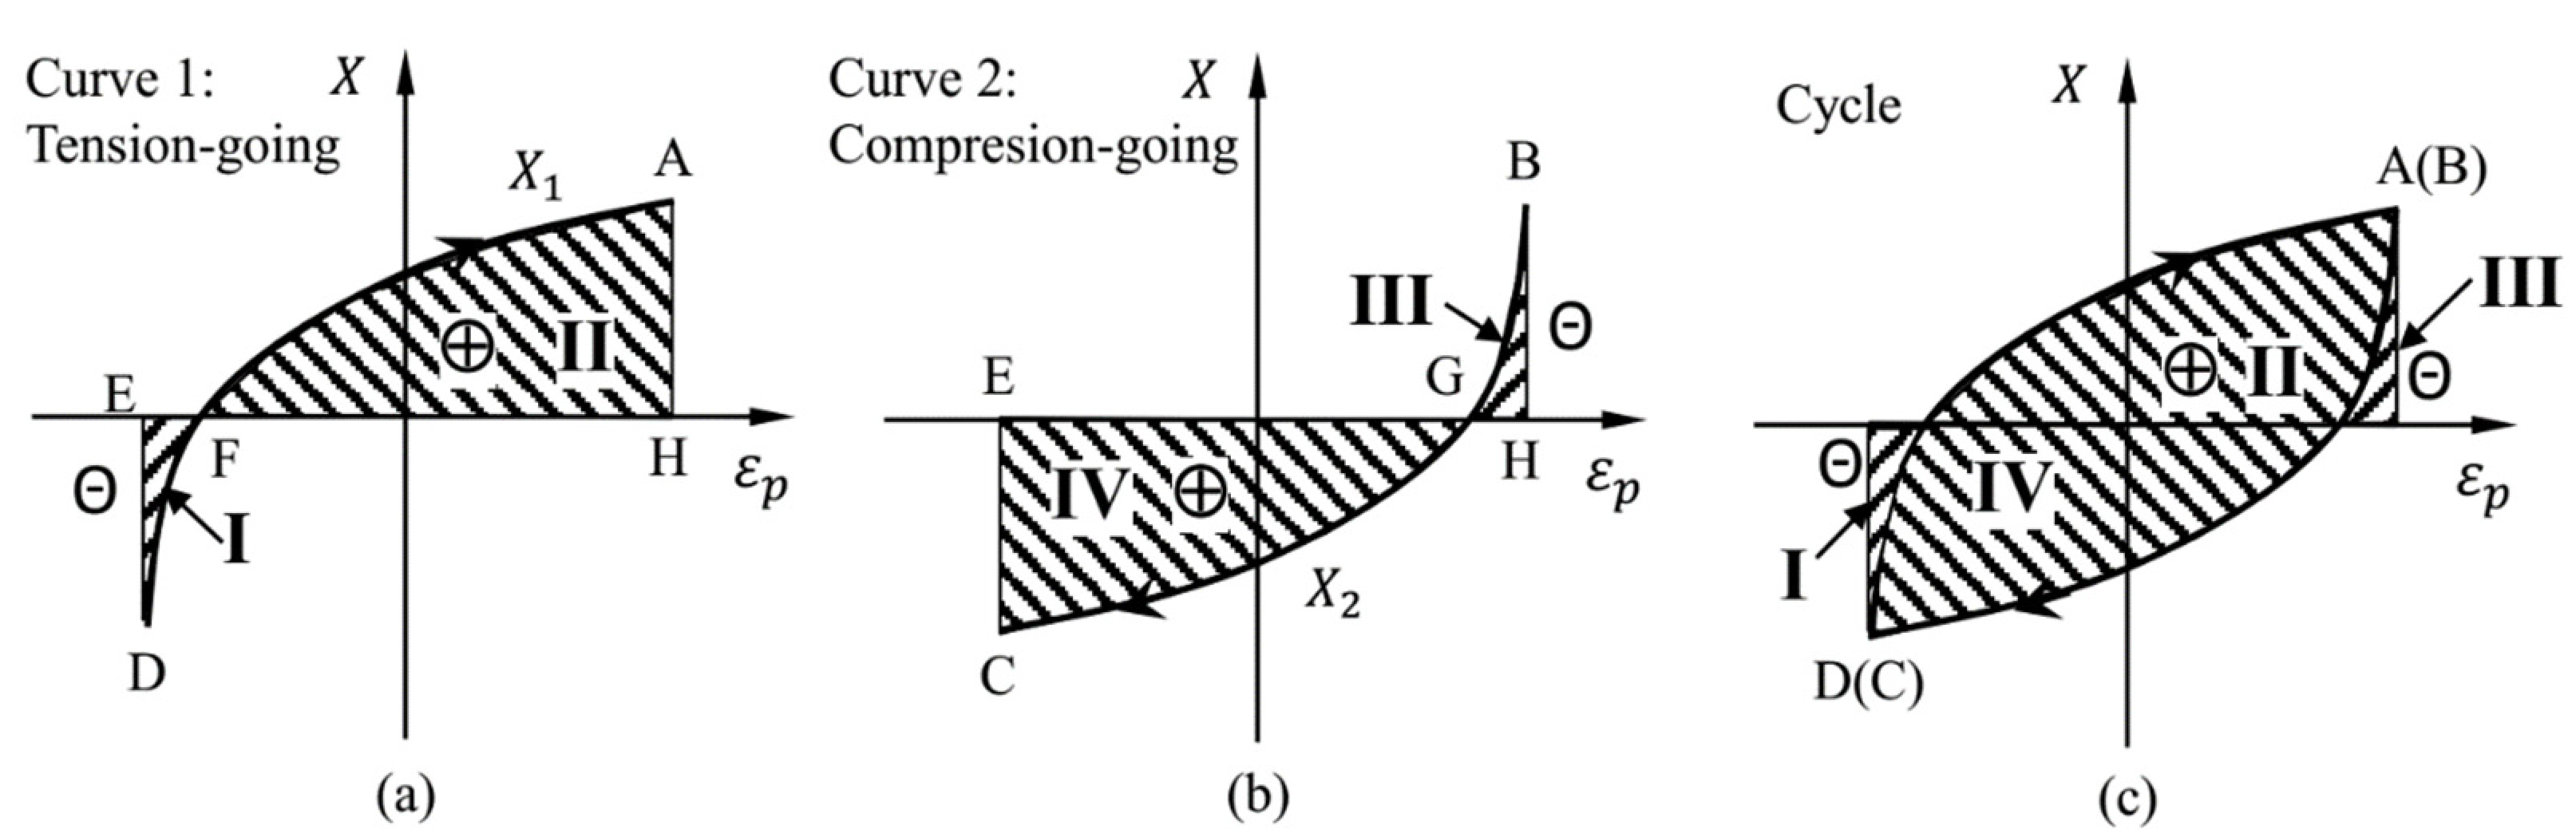
Figure 9.
TEM observations of the fatigue specimen cycled to failure at (a) low strain amplitude of 0.7% and (b) high strain amplitude of 2.0%.
Figure 9.
TEM observations of the fatigue specimen cycled to failure at (a) low strain amplitude of 0.7% and (b) high strain amplitude of 2.0%.

Figure 10.
The accumulated plastic work of back stress vs. accumulated plastic strain energy for Ti-6Al-4V: (a) εta = 0.8%; (b) εta = 1.2%; and (c) εta = 2.0%.
Figure 10.
The accumulated plastic work of back stress vs. accumulated plastic strain energy for Ti-6Al-4V: (a) εta = 0.8%; (b) εta = 1.2%; and (c) εta = 2.0%.
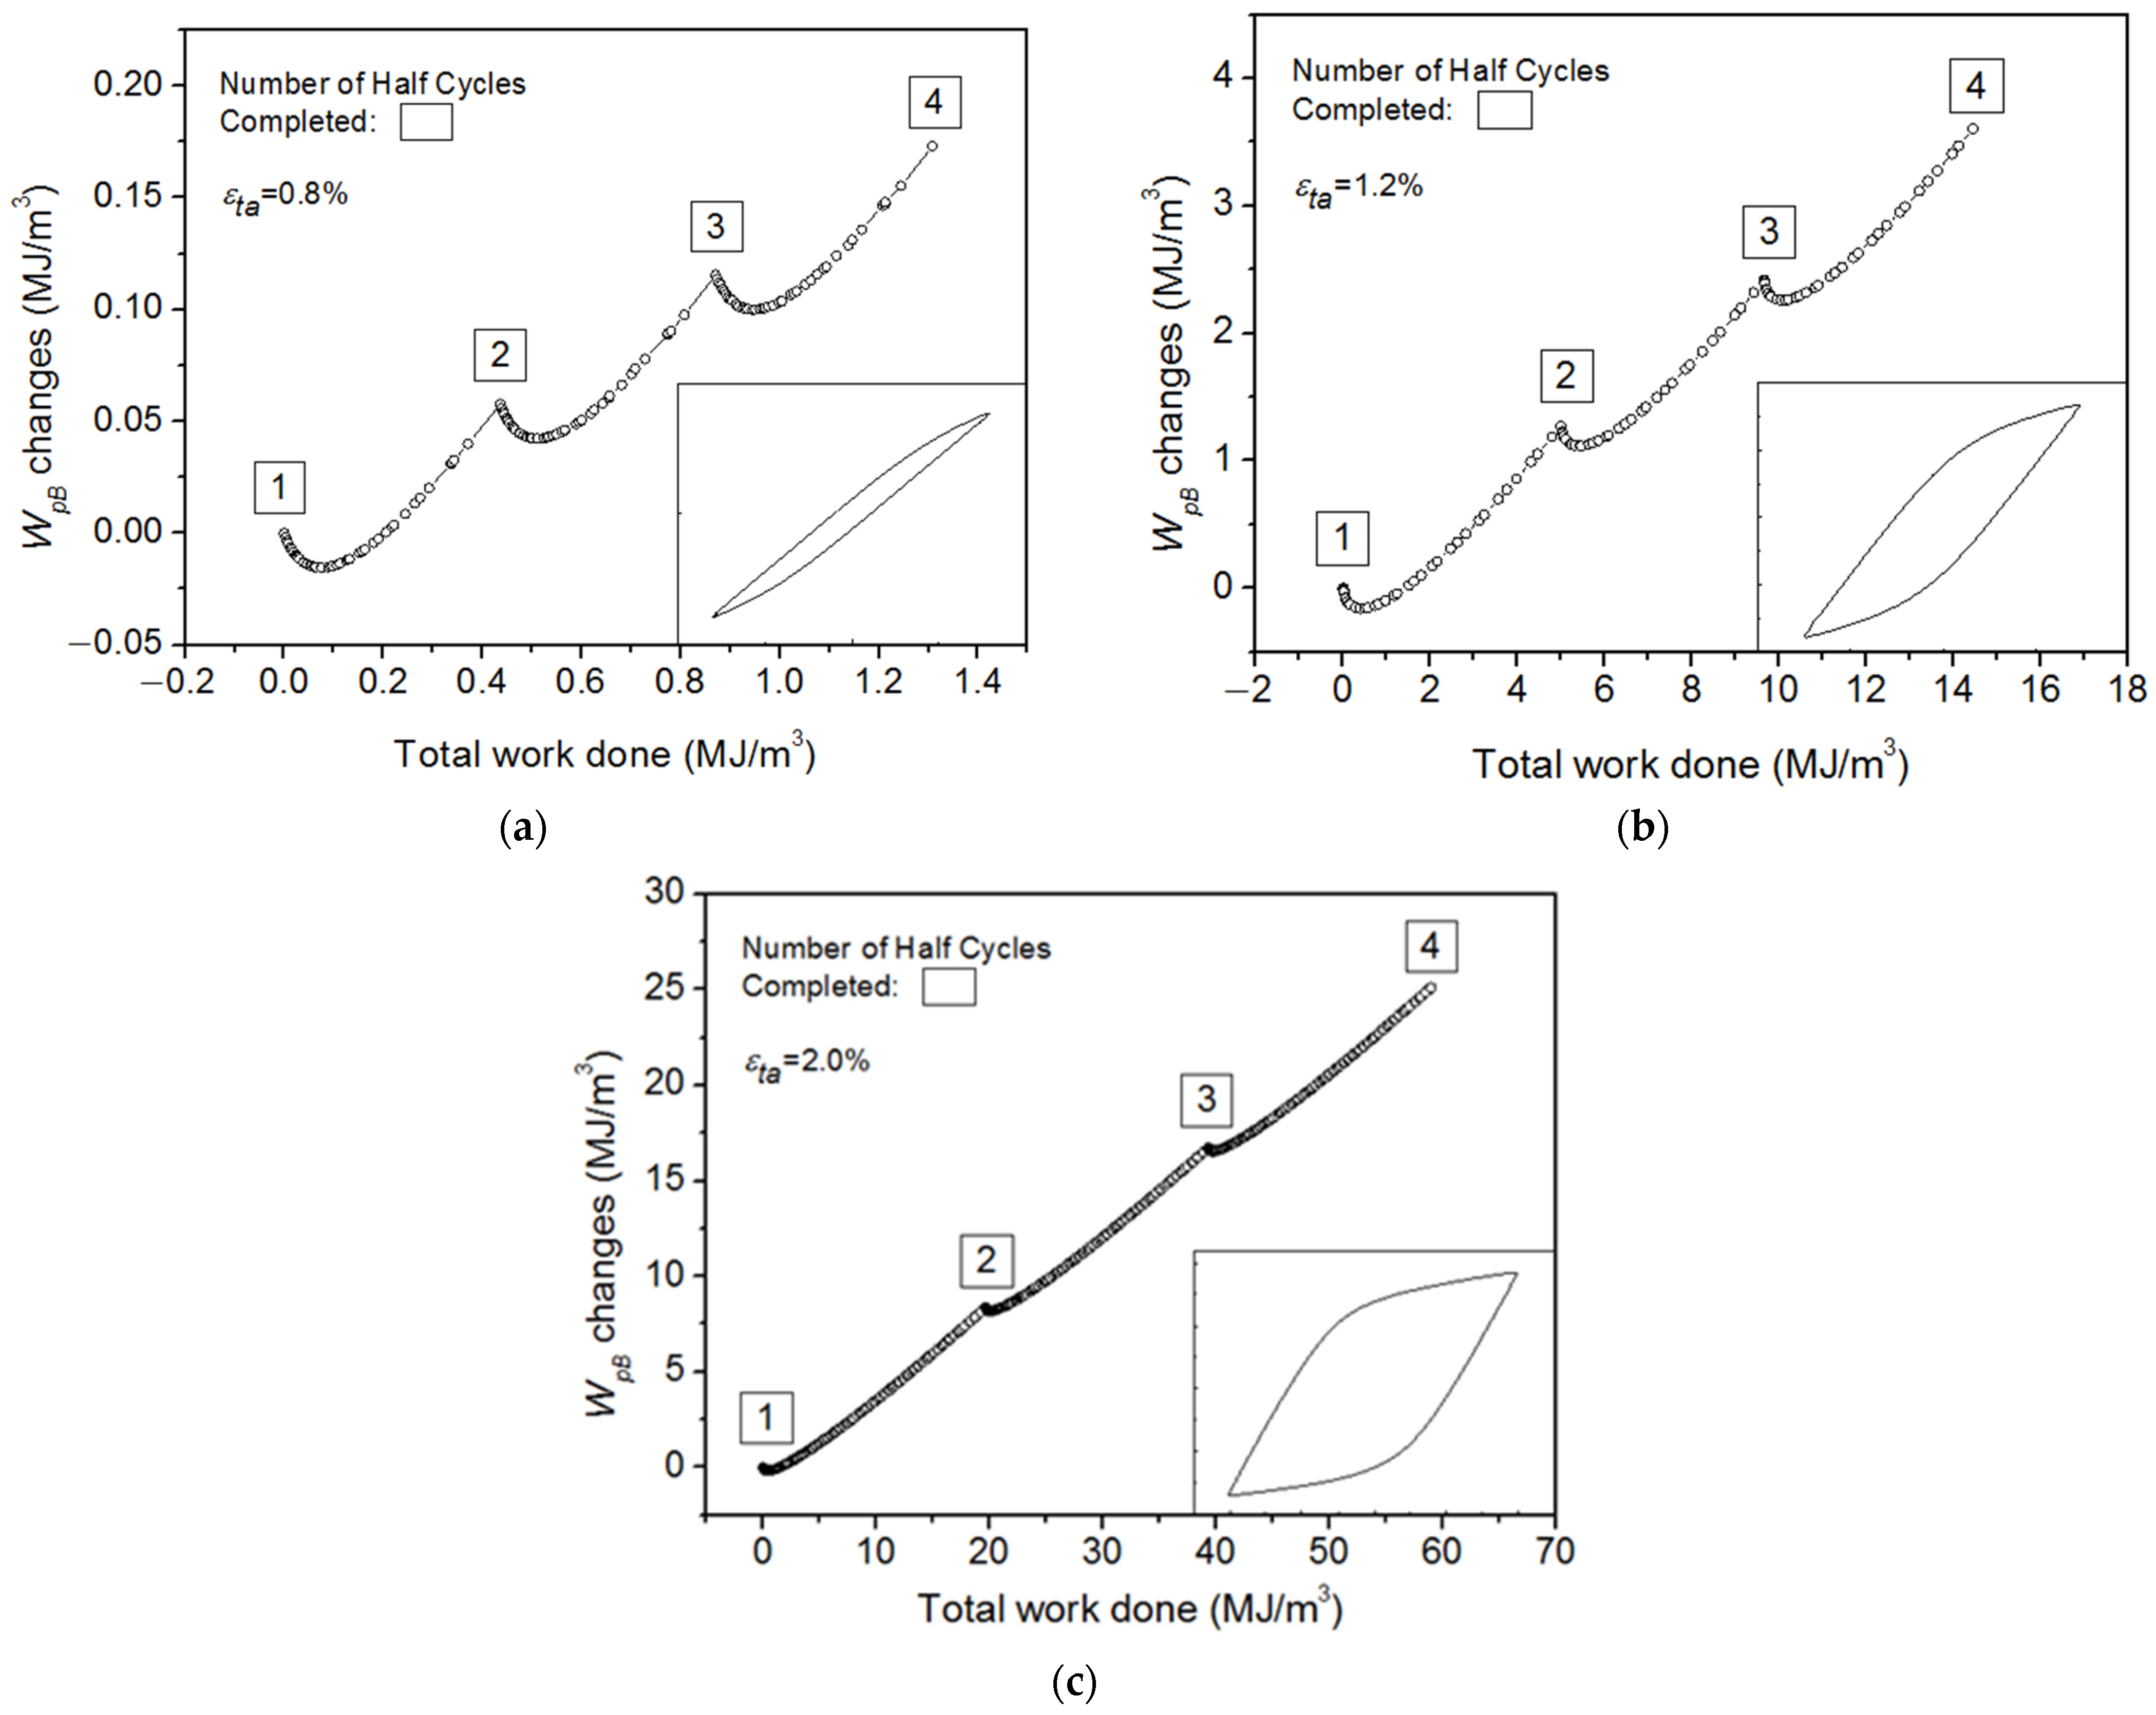
Figure 11.
Schematic cumulative and released plastic work of back stress changes during one half cycle of completely reversed strain.
Figure 11.
Schematic cumulative and released plastic work of back stress changes during one half cycle of completely reversed strain.
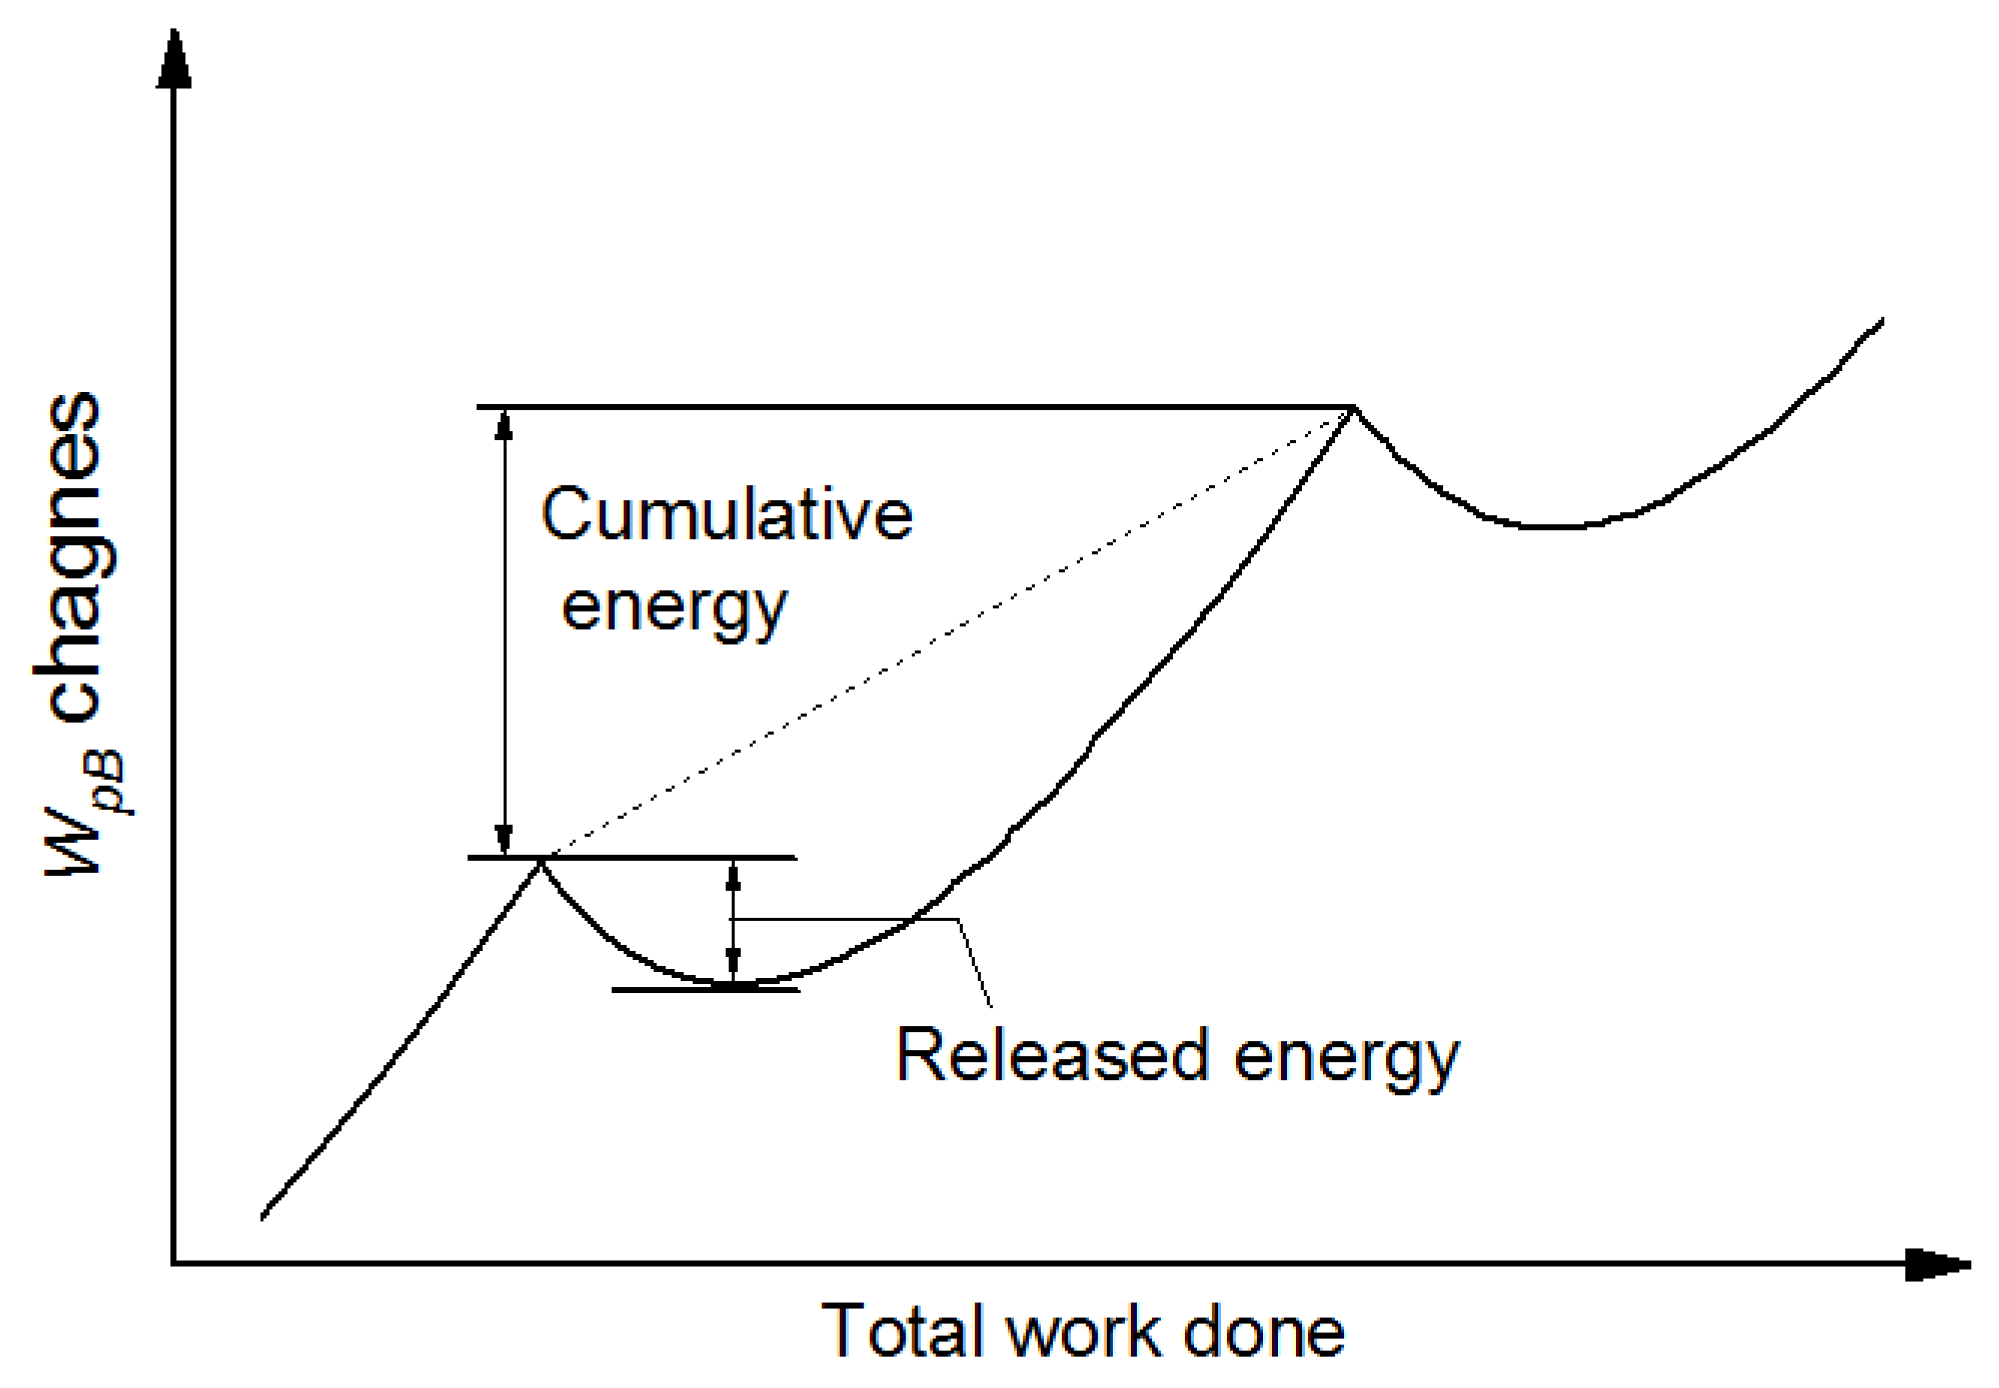
Figure 12.
The relationship between ∆WpB and ∆Wrel: (a) the evolution of ∆WpB and ∆Wrel at half-life versus strain; (b)the evolution of ∆Wrel/∆WpB versus strain.
Figure 12.
The relationship between ∆WpB and ∆Wrel: (a) the evolution of ∆WpB and ∆Wrel at half-life versus strain; (b)the evolution of ∆Wrel/∆WpB versus strain.
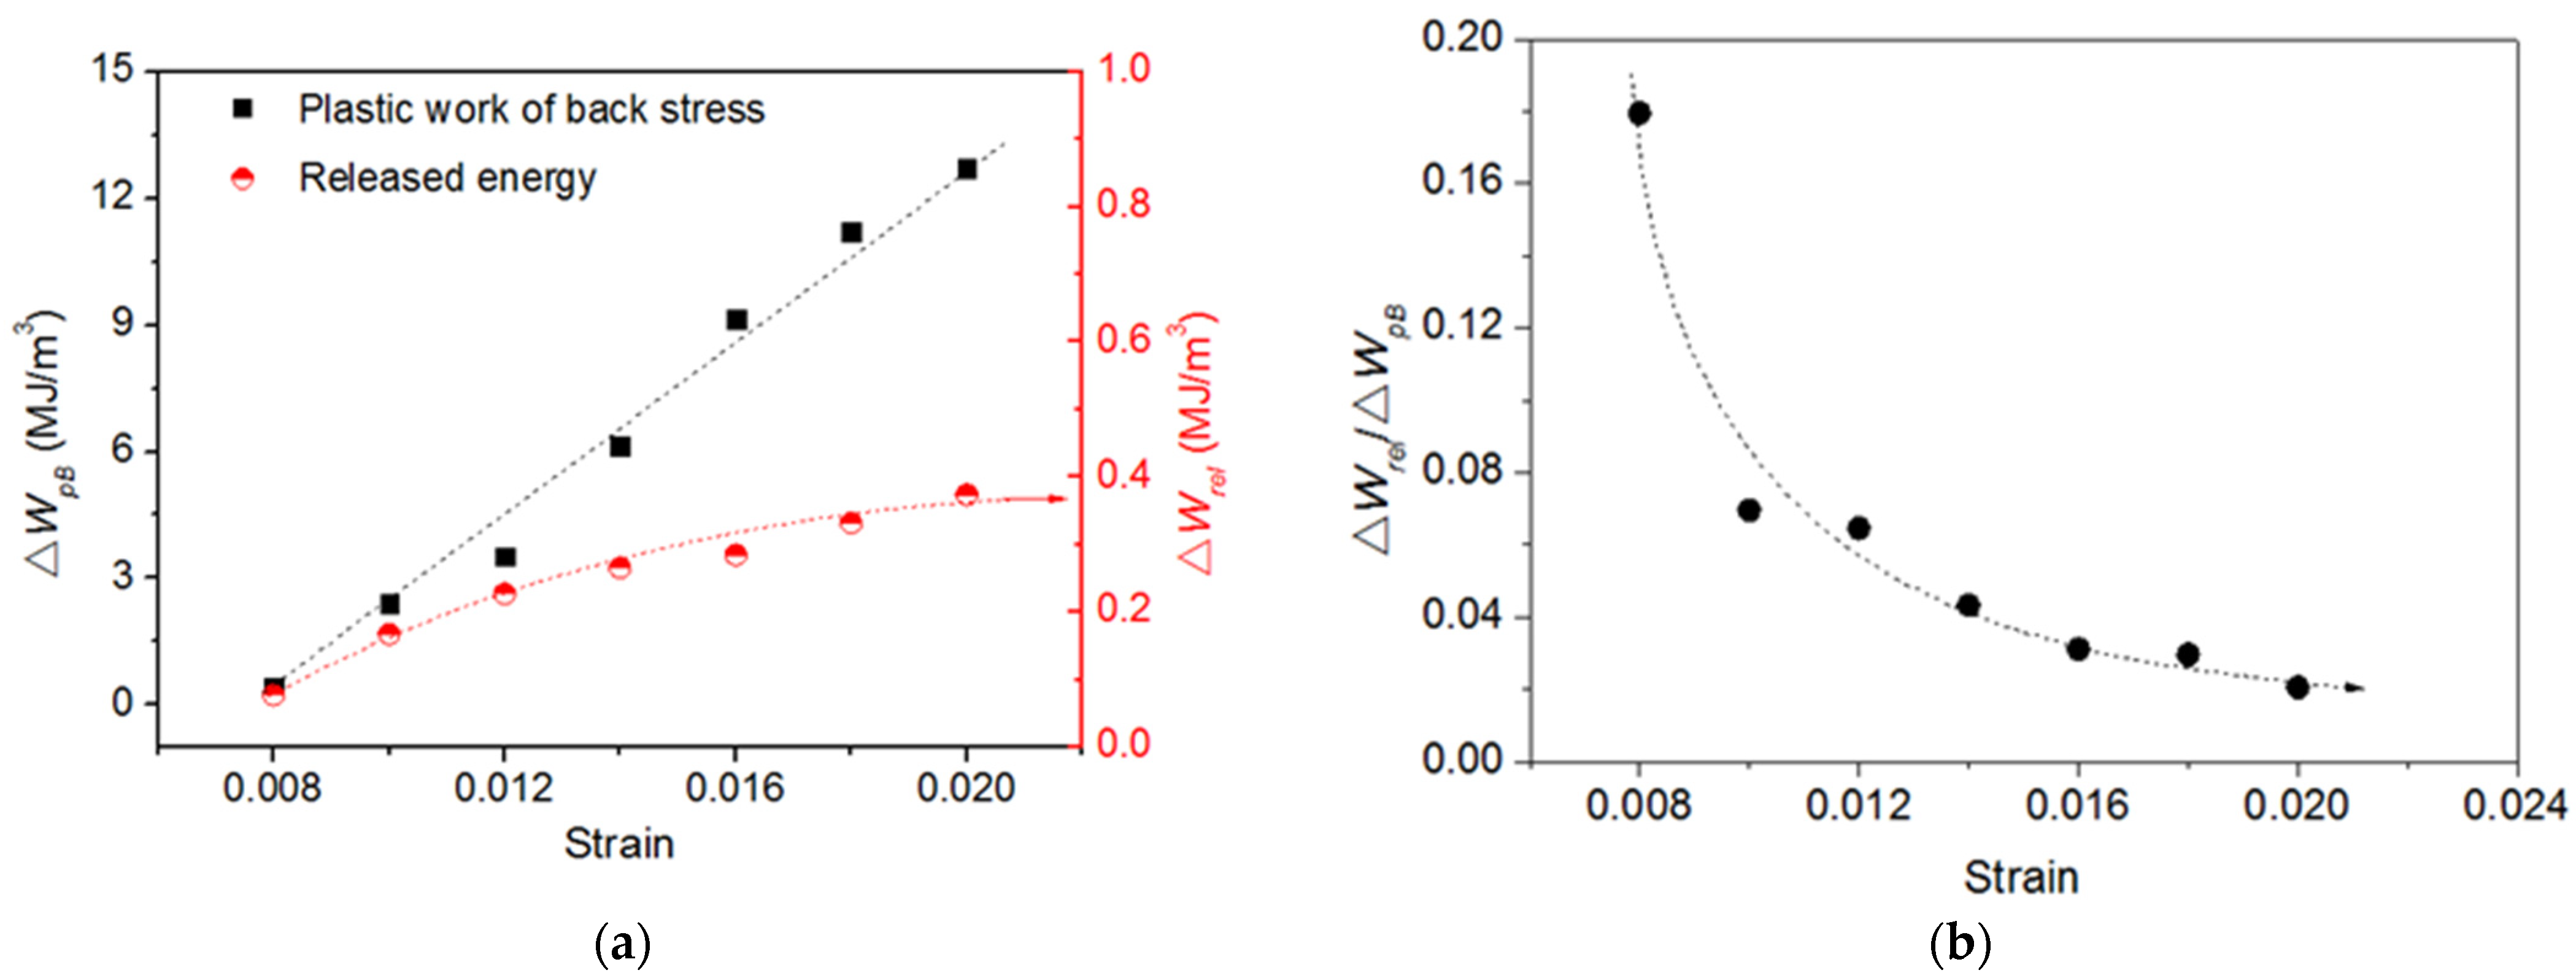
Figure 13.
The evolution of (a) ∆Wp, (b) ∆WpF and (c) ∆WpB with cyclic numbers.

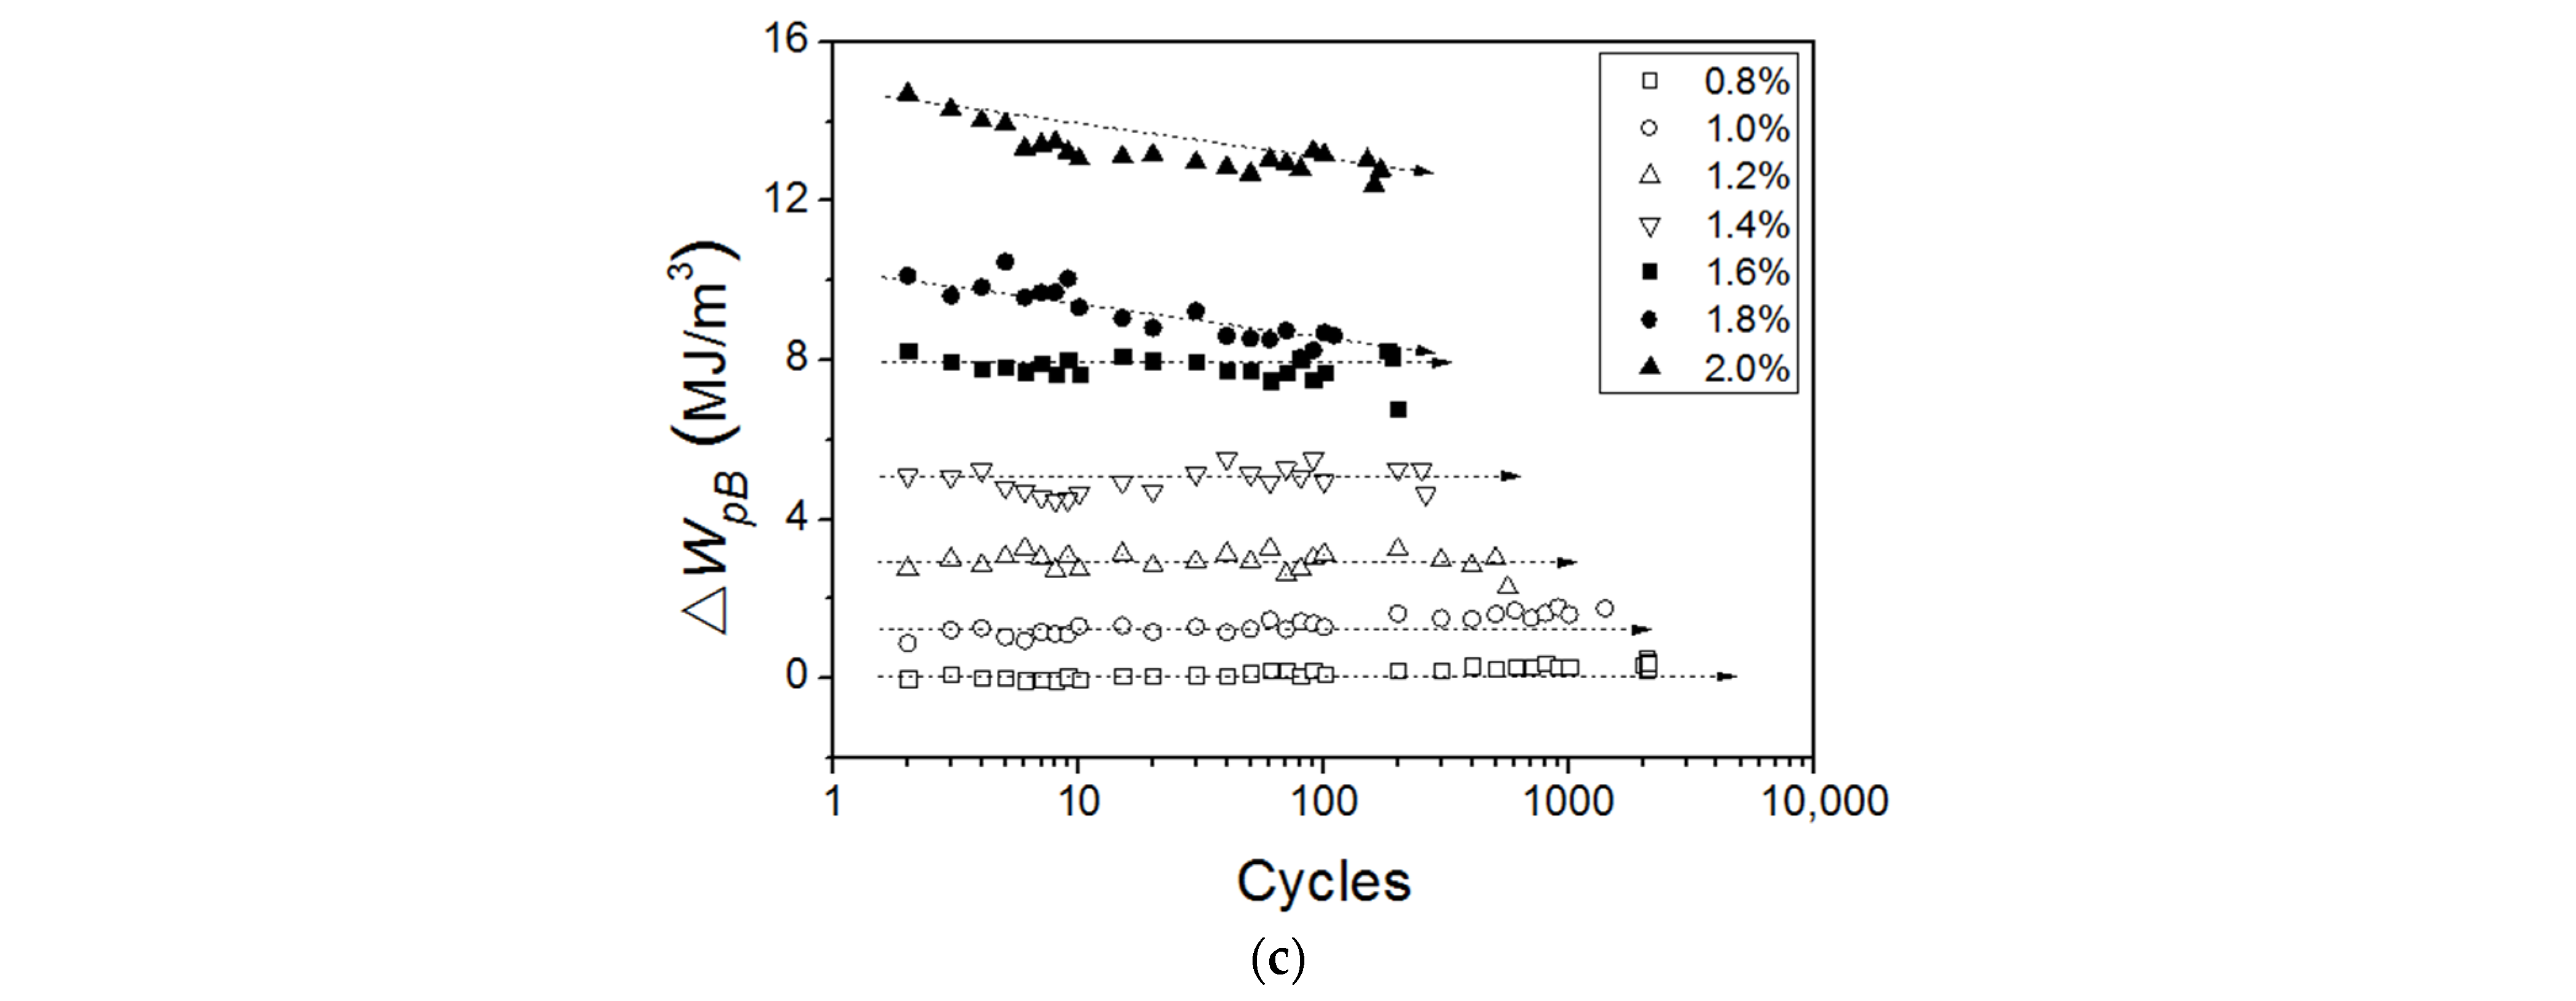
Figure 14.
Total energy densities to failure.
Publisher’s Note: MDPI stays neutral with regard to jurisdictional claims in published maps and institutional affiliations. |
© 2022 by the authors. Licensee MDPI, Basel, Switzerland. This article is an open access article distributed under the terms and conditions of the Creative Commons Attribution (CC BY) license (https://creativecommons.org/licenses/by/4.0/).
Share and Cite
MDPI and ACS Style
Xu, H.; Li, X.; Li, W.; Jiang, P.; Zhao, Y.; Liu, Y. A New Stored Energy Model Based on Plastic Work of Back Stress during Cyclic Loading in Polycrystalline Metal. Materials 2022, 15, 5267. https://doi.org/10.3390/ma15155267
AMA Style
Xu H, Li X, Li W, Jiang P, Zhao Y, Liu Y. A New Stored Energy Model Based on Plastic Work of Back Stress during Cyclic Loading in Polycrystalline Metal. Materials. 2022; 15(15):5267. https://doi.org/10.3390/ma15155267
Chicago/Turabian StyleXu, Haifeng, Xiaopeng Li, Wei Li, Peng Jiang, Yuanbo Zhao, and Yinghonglin Liu. 2022. "A New Stored Energy Model Based on Plastic Work of Back Stress during Cyclic Loading in Polycrystalline Metal" Materials 15, no. 15: 5267. https://doi.org/10.3390/ma15155267
Note that from the first issue of 2016, this journal uses article numbers instead of page numbers. See further details here.