Abstract
Research has focused on creating new methodologies such as supervised machine learning algorithms that can easily calculate the mechanical properties of fiber-reinforced concrete. This research aims to forecast the flexural strength (FS) of steel fiber-reinforced concrete (SFRC) using computational approaches essential for quick and cost-effective analysis. For this purpose, the SFRC flexural data were collected from literature reviews to create a database. Three ensembled models, i.e., Gradient Boosting (GB), Random Forest (RF), and Extreme Gradient Boosting (XGB) of machine learning techniques, were considered to predict the 28-day flexural strength of steel fiber-reinforced concrete. The efficiency of each method was assessed using the coefficient of determination (R2), statistical evaluation, and k-fold cross-validation. A sensitivity approach was also used to analyze the impact of factors on predicting results. The analysis showed that the GB and RF models performed well, and the XGB approach was in the acceptable range. Gradient Boosting showed the highest precision with an R2 of 0.96, compared to Random Forest (RF) and Extreme Gradient Boosting (XGB), which had R2 values of 0.94 and 0.86, respectively. Moreover, statistical and k-fold cross-validation studies confirmed that Gradient Boosting was the best performer, followed by Random Forest (RF), based on reduced error levels. The Extreme Gradient Boosting model performance was satisfactory. These ensemble machine learning algorithms can benefit the construction sector by providing fast and better analysis of material properties, especially for fiber-reinforced concrete.
1. Introduction
The incorporation of steel fibers in concrete improves the mechanical characteristics, i.e., compressive strength, flexural strength, and tensile strength, making the concrete more tough and resistible to cracks, as reported in previous works of literature [,,,,,]. Steel fiber-reinforced concrete significantly increased flexural strength compared to regular concrete []. The flexural behavior of SFRC beams was investigated and it was found that increasing the steel fiber content improved strength, toughness, and load-bearing capability []. The addition of up to 15% steel fibers to concrete increased the frost resistance and longevity of the concrete []. The FS of SFRC was investigated concerning curing time and fiber volume fraction. It was discovered that high-performance steel fiber and a high fiber volume fraction are necessary for SFRC flexural toughness []. The influence of fiber content and concrete strength on SFRC flexural behavior was investigated experimentally []. The addition of silica fume and steel fiber content to high-strength SFRC improved its toughness []. Analytical and experimental results were given on the flexural response of SFRC beams. According to the findings, the increased steel fiber volume enhanced flexural strength, deflection capacity, and post-peak ductility []. The mechanical characteristics of high-strength concrete were studied concerning steel fiber content and coarse particle size. The results showed that increasing the fiber content substantially increased the SFRC’s compressive and flexural toughness []. Natural and synthetic fibers have been utilized to improve the mechanical properties of concrete and cementitious materials [,,,,,,,,,,].
Machine learning (ML) techniques have recently been established, which play a vital role in the civil engineering industry by predicting the mechanical characteristics of concrete with a high degree of precision. ML is a branch of computer science that automates the creation of analytical models and is used to analyze data. ML algorithms are designed to learn from previously collected data. ML has gained popularity due to its ability to handle vast amounts and types of data. In addition, the computational procedure is less costly and more effective. As a consequence, models for evaluating massive and complicated data, as well as for delivering faster and more accurate results, may be created quickly and automatically. The application of these models results in highly exact predictions, allowing for more competent judgments and intelligent actions to be made in real-time without the need for human intervention []. The development of ML models to predict concrete strength is now underway to decrease the wastage of materials and experimental cycles. Artificial intelligence (AI) techniques like machine learning (ML) are among the most advanced modeling methodologies used in civil engineering. These approaches use input variables to model responses. Using supervised machine learning methodologies, researchers have recently focused on the compressive strength of concrete and other strength qualities such as flexural strength, tensile strength, and concrete durability. The M5P model was used by Behnood et al. to investigate concrete’s compressive, flexural, and split tensile strength []. Several studies have attempted to predict concrete strength characteristics [,,,,,,,]. Machine learning methods are employed to forecast concrete strength [,,,,,,,,,,,,,] and the durability of concrete [,,]. Bagging regression (BR) and gradient boosting (GB) models based on a variation of the bootstrap aggregation decision tree (DT) method have been shown in several studies to outperform other stand-alone ML models in terms of concrete strength prediction accuracy [,,,].
The use of machine learning to assess the strength properties of SFRC is novel. However, it is challenging due to the additional factors compared to conventional concrete, such as fiber type, fiber length, fiber diameter, and fiber content. The development of reliable algorithms to forecast the mechanical characteristics of fiber-reinforced concrete is currently ongoing. This study aims to see how three ensembled machine learning algorithms may be utilized to predict the flexural strength of SFRC. Gradient Boosting (GB), Random Forest (RF), and Extreme Gradient Boosting (XGB) are three machine learning (ML) algorithms developed and compared in this work to predict the flexural strength of SFRC. Correlation coefficients (R2) and statistical tests were used to assess the effectiveness of each strategy. In addition, the validity of each approach was validated using k-fold assessment and error distributions. This study is notable since it employs ensemble ML algorithms to predict the FS of SFRC and minimize the experimentation process because experimental works need a significant amount of human work, experimentation costs, and time for material gathering, casting, curing, and testing. Since several factors impact the flexural strength of SFRC, including cement, water, aggregate, additives, fiber volume, fiber length, and fiber diameter, determining their total effect is challenging. With minimum effort, machine learning approaches can determine the combined impact of its components. Since various investigations have been undertaken to estimate the FS of SFRC, ML algorithms require a data set, which may be acquired from prior research. The information gathered may subsequently be used to train machine learning algorithms and predict material strength.
2. Data Description
The dataset was created exclusively utilizing data from hook-end steel fibers concrete. The data were acquired from 17 sources [,,,,,,,,,,,,,,,,]. The factors that significantly impacted the outcome were selected and processed. Consequently, the dataset comprises ten distinct elements, including input and output data. These 10 components were taken into account while predicting SFRC flexural strength, and each of these variables influences SFRC flexural strength.
2.1. Water and Cement
According to prior research, the water-to-cement ratio significantly influences concrete strength. Abbass et al. reported that when the water–cement ratio increases, the flexural strength and compressive strength decrease []. Reddy et al. discovered that the water–cement ratio considerably influenced the flexural and compressive strength of self-consolidating concrete []. In a scientific investigation, Nili et al. demonstrated that SFRC obtained better flexural strength with a lower water–cement ratio []. Merve AÇIKGENÇ et al. investigated the relationship between SFRC splitting tensile and flexural strength using various cement dosages and water–cement ratios []. Wei Li investigated the impact of the water–cement ratio on concrete performance and discovered that when the water–cement ratio rises, the concrete strength diminishes []. M. S. Ahmad Shah et al. experimentally examined the flexural strength of concrete with various water–cement ratios and concluded that the flexural strength increased as the water–cement proportion increased []. Chang Joon Lee et al. looked at how the water–cement ratio and fiber content affected the flexural toughness of SFRC. A lower water–cement ratio and higher fiber volume result in a faster flexural toughness convergence rate []. E. K. Z. Balanji investigated how different water–cement ratios and steel fiber content affected the mechanical characteristics and impact resistance of steel fiber concrete. The influence of steel fibers on mechanical factors and impact resistance was more beneficial when the water–cement ratio was lower []. The water–cement ratio is chosen as a variable impacting the flexural strength of concrete in light of the cited literature.
2.2. Sand and Aggregate
The influence of sand and aggregate proportion on the strength qualities of SFRC has been recognized as a key factor. Kim et al. found that the higher proportion of sand to aggregate boosted the compressive and flexural strength of SFRC []. The amounts of sand and aggregate in concrete caused a noticeable difference in flexural and compressive strength, according to Chitlange et al. []. K. B. Dashrath et al. provided a comparative investigation of the flexural strength of concrete with varied aggregate quantities and kinds []. El-Ariss studied the impact of the water–cement ratio, sand, and gravel, and their various proportions and curing process on the concrete strength []. U. M. Tarek et al. analyzed the effects of various sand–aggregate ratios on concrete strength properties and determined the ideal sand–aggregate ratio []. M. Sunarso and colleagues studied the impacts of sand–aggregate fraction and additive dose on numerous characteristics of high-strength concrete []. The sand to aggregate ratio was considered as a key feature in the ML models design due to its importance in the strength qualities of concrete.
2.3. Superplasticizer
A superplasticizer is a water-reducing chemical used in the manufacture of concrete to increase its strength qualities. To improve the mechanical properties of concrete, superplasticizer and pozzolanic additives were utilized by M. Khan and M. Ali []. According to Aruntas et al., increased superplasticizer concentration enhanced concrete slump and strength properties []. Consequently, a superplasticizer was included in the ML models to assess its impact on SFRC flexural strength.
2.4. Silica Fume
To improve the strength qualities of concrete, silica fume has been utilized in varying quantities. Köksal et al. reported that the compressive and flexural strength of concrete improved with the increased silica fume []. The concrete flexural strength was notably enhanced when steel fibers and silica fume were employed simultaneously, according to M. Nili and V. Afroughsabet []. M. Shafieyzadeh discovered that substituting up to 7.5% of the cement with silica fume increases the flexural strength of concrete by 15% []. M. Shmlls et al. found that the combined dosage of silica fume and fly ash enhanced the strength properties of concrete []. The incorporation of silica fume was identified as a component that influences the strength qualities of SFRC.
2.5. Fly Ash
Fly ash increases the workability of plastic concrete as well as the strength properties of hardened concrete. R. M. K Saravana and A. Sumathi discovered that the addition of fly ash into SFRC enhanced the concrete strength over time []. M. A. Challoob et al. investigated the effect of fly ash and steel fibers on the strength of pozzolana cement concrete []. A.K. Saha found that the concrete strength increased gradually when the fly ash was introduced []. P. Nath and P. Sarker stated that the durability characteristics of high-strength concrete improved with the partially addition of fly ash []. Thus, fly ash was picked as a variable due to its relevance to concrete qualities.
2.6. Steel Fiber Volume, Length and Diameter
The steel fiber proportion, length, and thickness have a notable impact on the flexural strength of concrete, as reported in the literature. Yazici et al. found that the compressive and flexural strength of concrete improved with increased steel fiber []. Köksal et al. revealed that SFRC compressive and flexural strength improved due to an experimental investigation utilizing fiber volume fractions up to 1% []. A. A. Jhatial et al. determined that the increased content of steel fibers improved the flexural and compressive strength []. H. K. Hussain et al. revealed that steel fibers in concrete remarkably enhanced the strength and durability properties of hardened concrete. The flexural strength significantly increased with the incorporation of hooked end textured steel fibers []. According to Hyun-Oh Shin et al., in terms of flexural behavior of ultra-high-performance fiber-reinforced concrete under uniaxial and biaxial stress states, the straight steel fiber is the most effective []. As a result, ML models must include fiber volume, length, and diameter as variables.
Machine learning techniques require a variety of input parameters to obtain the desired outcome. The data used to calculate the 28 days of SFRC’s flexural strength were gathered from the literature. Cement, water, sand, coarse aggregate content, superplasticizer, silica fume, fly ash, hooked steel fiber volume, fiber length, and fiber diameter were all included as inputs in the model, with just one variable–flexural strength–as an outcome. For the 28-day SFRC flexural strength prediction, this study employed 173 data points (mix proportions). The statistical analysis results of the input variables, such as mean, standard error, median, mode, standard deviation, range, minimum, and maximum values, are shown in Table 1. In addition, Figure 1 shows the relative frequency pattern distribution of all input parameters.

Table 1.
Input variables; statistical analysis.
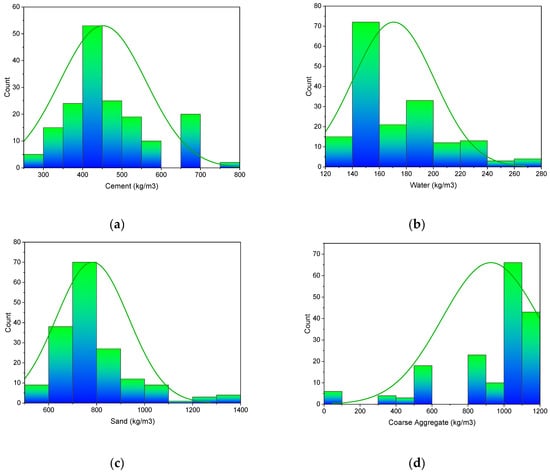
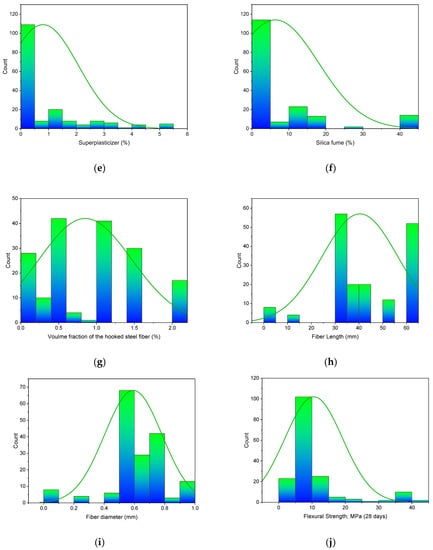
Figure 1.
Input variable; relative frequency pattern: (a) Cement; (b) Water; (c) Sand; (d) Coarse aggregate; (e) Super-plasticizer; (f) Silica fume; (g) Volume fraction of steel hooked fibers; (h) Fiber length; (i) Fiber diameter; (j) Flexural strength.
3. Research Strategy
Anaconda software was used to build the machine learning models, employing python code. The Anaconda navigator is a graphical user interface included in the Anaconda software that allows programs to run that give direction via Conda packages, channels, and environments without requiring command-line skills. It also provides Python and R programming languages for data science and machine learning applications, focusing on package creation and maintenance. This work used three ensembled techniques to estimate the flexural strength of SFRC, i.e., Gradient Boosting (GB), Random Forest (RF), and Extreme Gradient Boosting (XGB). The Anaconda navigator’s Spyder (version: 4.3.5) was used for model execution. The R2 value of the projected outcome from all models was used to gauge the degree of accuracy. R2 values typically vary from 0 to 1, with a more significant number implying more accuracy in predicting the measured and projected results. Statistical checks, error evaluation (including MAE, RMSE), and k-fold cross-validation were conducted to examine the models’ performance. A sensitivity analysis was carried out to check the impact of all input factors. Figure 2 illustrates the research strategy.
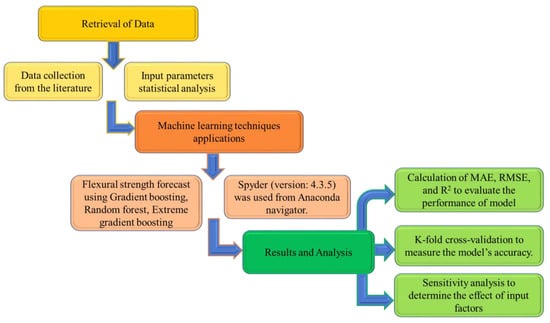
Figure 2.
Methodology of research in order.
4. Results and Discussions
4.1. Statistical Analysis Explanation
Figure 3 shows a trend of statistical analysis using the R-F model to compare actual and anticipated SFRC flexural strength after 28 days. The R-F produces results within the allowed range and slight variations between predicted and actual outcomes. The R2 = 0.94 indicates that the model is effective at estimating outcomes. Figure 4 depicts the R-F model’s deviations and the distribution of investigational and projected outcomes. The distribution’s highest, lowest, and average error values were 7.09, 0.036, and 1.50 MPa, respectively. It was revealed that 52% of the incorrect readings were less than 1 MPa, 44% were between 1–5 MPa, and 3.8% were higher than 5 MPa. These statistics indicate the degree of agreement between expected and actual results.
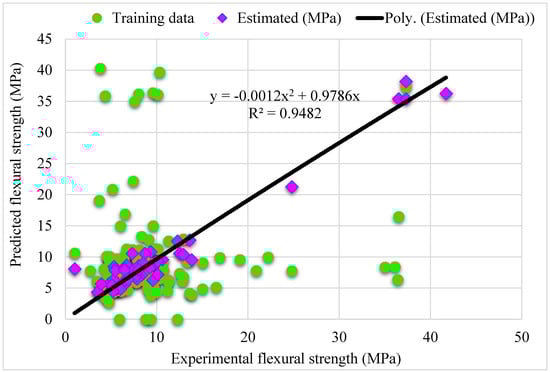
Figure 3.
Relationship for R-F model: Experimental and estimated results.
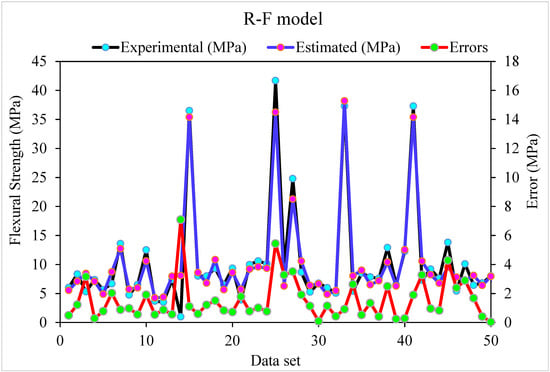
Figure 4.
Experimental, estimated and, error values for R-F model.
The outputs of the G-B model are depicted in Figure 5 and Figure 6. Figure 5 shows the relationship between actual and expected outcomes, with R2 = 0.96–higher than the R-F model–showing that the G-B approach outperforms the R-F. The distribution of actual and predicted values–as well as errors–in the G-B model is depicted in Figure 6. The distribution’s maximum, minimum, and average error values were 5.4, 0.0026, and 1.34 MPa, respectively. According to the data, 42% of incorrect readings were less than 1 MPa, 56% were between 1 and 5 MPa, and 2% were greater than 5 MPa. Based on the R2 and error distribution of the R-F and G-B models, the G-B model can more accurately predict the SFRC flexural strength.
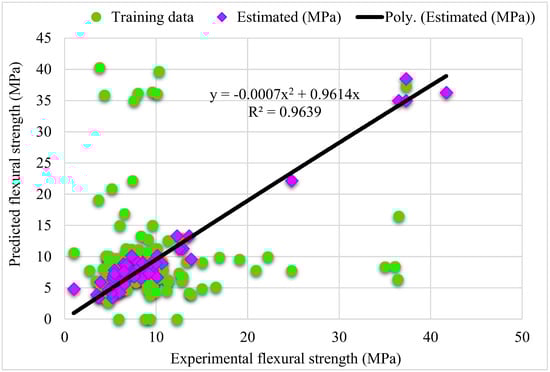
Figure 5.
Experimental and estimated results connection for G-B model.
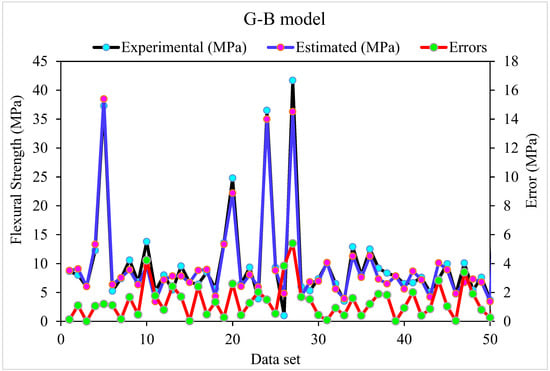
Figure 6.
Experimental, estimated and, error distribution for G-B model.
Figure 7 depicts the relationship between actual and predicted outcomes for the XGB model. The R2 value for the XGB model is 0.86, indicating that it is less precise than the R-F and G-B models. Figure 8 also illustrates the XGB model’s actual and anticipated values and errors distribution. The highest, lowest, and mean errors were 8.88, 0.036, and 2.43 MPa, respectively. According to the findings, 30% of the erroneous values were less than 1 MPa, 58% were between 1 MPa and 5 MPa, and 12% were higher than 5 MPa. Due to reduced inaccuracy and more excellent R2 readings, the G-B model was more precise than the R-F and XGB models in this study. Furthermore, ensembled ML approaches such as R-F, G-B, and XGB employed sub-models to obtain the best evaluation, resulting in flawless results. Consequently, ML techniques, i.e., G-B and R-F, were shown to be more accurate than XGB in predicting outcomes in this investigation.
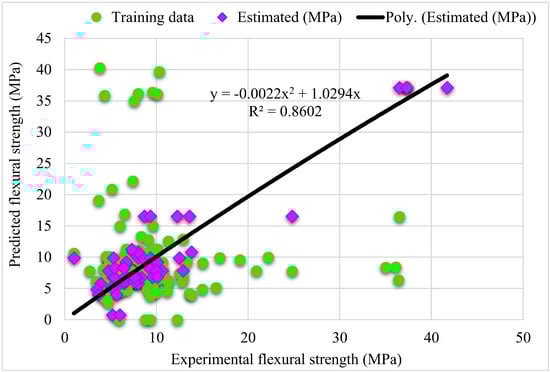
Figure 7.
Experimental and estimated outcomes relationship for XGB model.
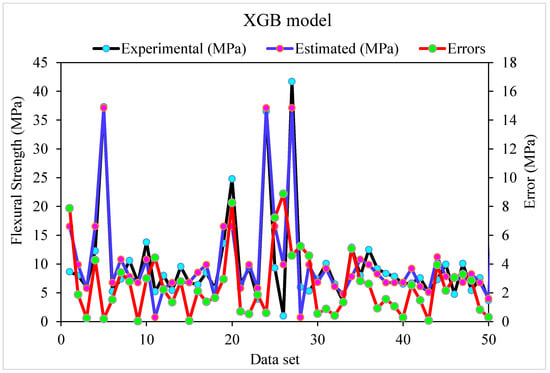
Figure 8.
Experimental, estimated values and, error distribution for XGB model.
4.2. Cross-Validation Using K Fold
The k-fold cross-validation approach is used to verify the model’s validity during execution. This method is frequently used to verify the accuracy of a model in which the data set is spread out and divided into ten groups [,,]. The model was tested with one group, while the other nine were used for training. Overall, 70% of the data set was used in the model training process, with the remaining 30% used to evaluate the models. This process requires randomly dividing the set of observations into k groups or folds of roughly similar size. The first fold is used as a validation set, while the following k-1 folds are used to fit the procedure. The model is deemed more accurate if the R2 value is high and the errors, such as MAE and RMSE, are low. The process needs to be repeated 10 times to provide a satisfactory result. This comprehensive technique is essential for the model’s excellent accuracy. Furthermore, as indicated in Table 2, all models were statistically analyzed as errors (MSE and RMSE). Statistical analysis was used to assess the models’ reaction to estimation, using Equations (1) and (2) from the literature [].
where = total number of sampled data. , = reference values of data sample. , = model-predicted values.
Table 2.
Statistical analysis of the approaches used.
The MAE, RMSE, and R2 distributions for the k-fold cross-validation of Random Forest, Gradient Boosting, and Extreme Gradient Boosting models are shown in Figure 9, Figure 10 and Figure 11. The highest, lowest, and average R2 values for the R-F model are 0.94, 0.34, and 0.69, respectively, as shown in Figure 9. The maximum, minimum, and average R2 values for the G-B model are 0.96, 0.33, and 0.74, respectively, as shown in Figure 10. Figure 11 shows the highest, lowest, and average R2 values for the XGB, which were 0.86, 0.36, and 0.64, respectively. The average MAE and RMSE for the R-F model were 2.94 and 4.58, respectively, when the error values were compared. The average MAE and RMSE for the G-B model were 2.7 and 3.68, respectively, whereas the average MAE and RMSE for the XGB model were 3.32 and 5.10, respectively. The G-B model with the lowest error and highest R2 value performs the best in forecasting outcomes. Table 3 provides the results of the k-fold study for the models used, including MAE, RMSE, and R2 values.
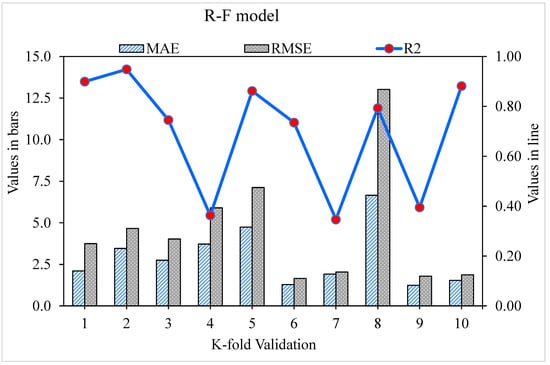
Figure 9.
Random Forest model with K-fold cross-validation representation.
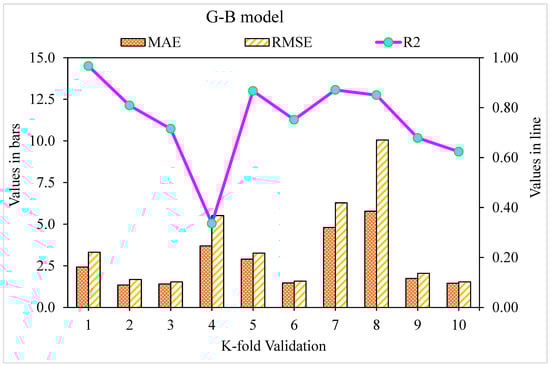
Figure 10.
K-fold cross-validation representation for the Gradient Boosting model.
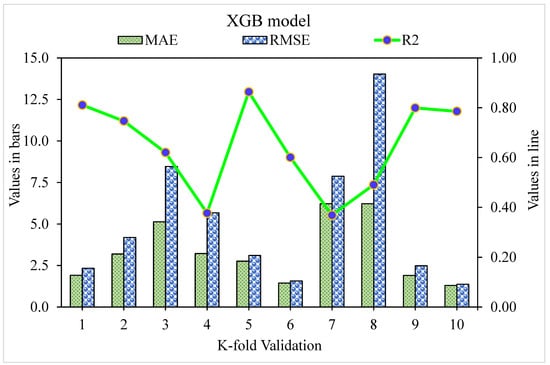
Figure 11.
K-fold cross-validation representation for Extreme Gradient Boosting model.
Table 3.
K-fold cross-validation results.
4.3. Sensitivity Analysis
This research aims to find out how input parameters influence SFRC flexural strength predicting. The influence of input factors on SFRC’s flexural strength prediction can be seen in Figure 12. The essential constituent was determined to be silica fume, which accounted for 21.7% of the total, followed by cement, 15.8%, and superplasticizer, 6.4%. The remaining input components, such as coarse aggregate (8%), water (11.2%), and sand (5.6%), had a lesser influence on the flexural strength of the SFRC forecast. The steel fiber vf, fiber length, and fiber diameter impact were 19.7%, 9.6%, and 2%, respectively. The sensitivity analysis findings were proportionate to the number of input parameters and data points included in the model design. Equations (3) and (4) were used to examine the impact of input variables on model output.
The highest and lowest projected outputs over the output are represented by and , respectively.

Figure 12.
The input variable’s contribution to the forecast.
5. Discussions
The goal of this study was to determine how machine learning approaches may be used to forecast SFRC flexural strength. Random Forest, Gradient Boosting, and Extreme Gradient Boosting were three machine learning methods that were investigated. To determine which strategy is the most exact in prediction, the performance of each approach was tested and compared. The G-B model produced a more precise result, with an R2 value of 0.96. The R2 values of R-F and XGB models were 0.81 and 0.87, respectively. Statistical analysis and the k-fold cross-validation approach were used to confirm the effectiveness of all models. The model works better with minimal error levels. The ML techniques frequently take advantage of the susceptible intern by constructing sub-models, trained on data and maximizing, to boost the value of R2. The variation of R2 values for sub-models, such as Random Forest, Gradient Boosting, and Extreme Gradient Boosting techniques, is shown in Figure 13, Figure 14 and Figure 15. The Random Forest sub-model had highest, lowest, and mean R2 values of 0.94, 0.34, and 0.69, respectively. The Gradient Boosting (G-B) sub-models had maximum, minimum, and average R2 values of 0.96, 0.63, and 0.79, respectively. The highest, lowest, and mean R2 values for Extreme Gradient Boosting sub-models were 0.87, 0.44, and 0.68, respectively. According to these results, the G-B sub-model is more accurate than the R-F and XGB sub-models. A sensitivity analysis was also performed to evaluate how each input parameter influenced the expected flexural strength of the SFRC. The sensitivity analysis determined how much each of the 10 input variables affects the predicted result.
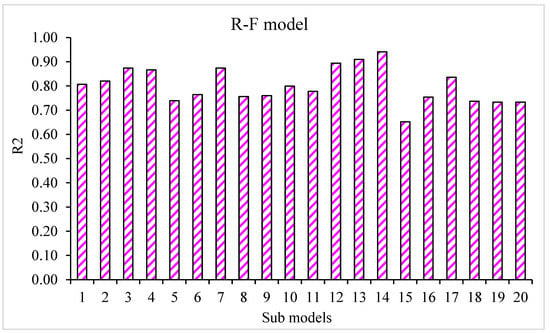
Figure 13.
The coefficient correlation (R2) values of the R-F sub-model.
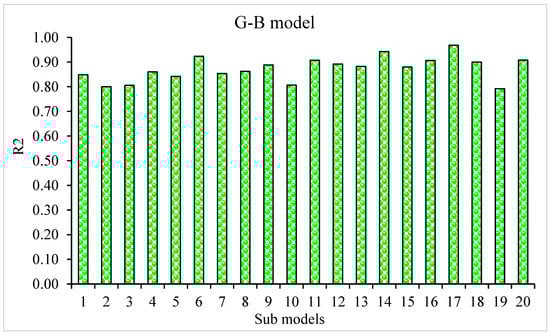
Figure 14.
G-B sub-model’s coefficient correlation (R2) values.
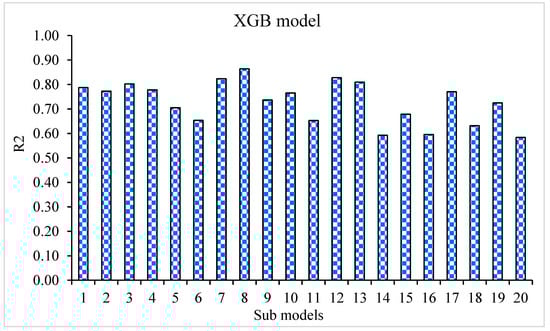
Figure 15.
XGB sub-model’s coefficient correlation (R2) values.
6. Conclusions
This study aimed to put three ensembled ML techniques to the test to estimate the 28-day SFRC flexural strength. Random Forest (R-F), Gradient Boosting (G-B), and Extreme Gradient Boosting (XGB) models were employed to forecast the outcomes. The conclusions of this study are:
- The Extreme Gradient Boosting (XGB) model was less accurate than the Gradient Boosting (G-B) and Random Forest (R-F) models in projecting SFRC flexural strength.
- The Gradient Boosting model outperformed the Extreme Gradient Boosting and Random Forest ensembled machine learning technique in forecasting the 28-days flexural strength of SFRC.
- The Random Forest, Gradient Boosting, and Extreme Gradient Boosting models have a coefficient of determination (R2) values of 0.94, 0.96, and 0.86, respectively. All of the models’ outputs are within acceptable bounds, with slight variance from the exact results.
- The k-fold cross-validation test and statistical analysis demonstrated the model’s performance, which revealed that the Gradient Boosting model outperformed the other models investigated in terms of prediction.
- A sensitivity analysis was utilized to determine how much input parameters mattered. It was discovered that Vf of steel fiber, Fiber length, Fiber diameter, Cement, Silica fume, Water, Sand, Superplasticizer, and Coarse Aggregate contributed 19.7%, 9.6%, 2%, 15.8%, 21.7%, 11.2%, 5.2%, 6.4%, and 8%, respectively, to the outcome’s prediction.
- The ensemble machine learning algorithms, especially Gradient Boosting, can effectively estimate concrete strength qualities without requiring long casting and testing.
Author Contributions
D.Z.: Conceptualization, Investigation, Methodology, Writing-original draft. R.W.: Methodology, Investigation, Data Curation, Writing—Review & Editing. M.S.: Conceptualization, Investigation, Methodology, Writing-original draft, Supervision. N.B.K.: Software, Visualization, Resources, Funding acquisition, Writing—Review & Editing, Supervision. M.A. (Miniar Atig): Validation, Data Curation, Writing—Review & Editing, Funding acquisition, Project administration. A.F.D.: Validation, Formal analysis, Funding acquisition, Writing—Review & Editing. O.A.: Software, Visualization, Resources, Funding acquisition, Writing—Review & Editing. M.A. (Marc Azab): Formal analysis, Data Curation, Writing—Review & Editing, Funding acquisition. All authors have read and agreed to the published version of the manuscript.
Funding
The Authors extend their appreciation to the Deanship of Scientific Research at King Khalid University for funding this work through the Large Groups Project under grant number RGP. 2/104/43.
Institutional Review Board Statement
Not applicable.
Informed Consent Statement
Not applicable.
Data Availability Statement
Data will be made available upon request from corresponding author.
Acknowledgments
The Authors extend their appreciation to the Deanship of Scientific Research at King Khalid University for funding this work through the Large Groups Project under grant number RGP. 2/104/43.
Conflicts of Interest
There is no conflict of interest among the authors.
References
- Khan, M.; Cao, M.; Xie, C.; Ali, M. Effectiveness of hybrid steel-basalt fiber reinforced concrete under compression. Case Stud. Constr. Mater. 2022, 16, e00941. [Google Scholar] [CrossRef]
- Khan, M.; Cao, M.; Chu, S.; Ali, M. Properties of hybrid steel-basalt fiber reinforced concrete exposed to different surrounding conditions. Constr. Build. Mater. 2022, 322, 126340. [Google Scholar] [CrossRef]
- Cao, M.; Xie, C.; Li, L.; Khan, M. The relationship between reinforcing index and flexural parameters of new hybrid fiber reinforced slab. Comput. Concr. 2018, 22, 481–492. [Google Scholar] [CrossRef]
- Cao, M.; Khan, M. Effectiveness of multiscale hybrid fiber reinforced cementitious composites under single degree of freedom hydraulic shaking table. Struct. Concr. 2020, 22, 535–549. [Google Scholar] [CrossRef]
- Ali, B.; Kurda, R.; Ahmed, H.; Alyousef, R. Effect of recycled tyre steel fiber on flexural toughness, residual strength, and chloride permeability of high-performance concrete (HPC). J. Sustain. Cem. Mater. 2022, 1–17. [Google Scholar] [CrossRef]
- Ali, B. Development of environment-friendly and ductile recycled aggregate concrete through synergetic use of hybrid fibers. Environ. Sci. Pollut. Res. 2022, 29, 34452–34463. [Google Scholar] [CrossRef] [PubMed]
- Yazıcı, G.; Inan, G.; Tabak, V. Effect of aspect ratio and volume fraction of steel fiber on the mechanical properties of SFRC. Constr. Build. Mater. 2007, 21, 1250–1253. [Google Scholar] [CrossRef]
- Yoo, D.-Y.; Yoon, Y.-S.; Banthia, N. Flexural response of steel-fiber-reinforced concrete beams: Effects of strength, fiber content, and strain-rate. Cem. Concr. Compos. 2015, 64, 84–92. [Google Scholar] [CrossRef]
- Nili, M.; Azarioon, A.; Danesh, A.; Deihimi, A. Experimental study and modeling of fiber volume effects on frost resistance of fiber reinforced concrete. Int. J. Civ. Eng. 2016, 16, 263–272. [Google Scholar] [CrossRef]
- Jang, S.; Yun, H. Effects of Curing Age and Fiber Volume Fraction on Flexural Behavior of High-Strength Steel Fiber-Reinforced Concrete. J. Korean Soc. Hazard Mitig. 2016, 16, 15–21. [Google Scholar] [CrossRef]
- Lee, J.-H.; Cho, B.; Choi, E. Flexural capacity of fiber reinforced concrete with a consideration of concrete strength and fiber content. Constr. Build. Mater. 2017, 138, 222–231. [Google Scholar] [CrossRef]
- Köksal, F.; Altun, F.; Yiğit, I.; Şahin, Y. Combined effect of silica fume and steel fiber on the mechanical properties of high strength concretes. Constr. Build. Mater. 2008, 22, 1874–1880. [Google Scholar] [CrossRef]
- Yoo, D.-Y.; Yoon, Y.-S.; Banthia, N. Predicting the post-cracking behavior of normal- and high-strength steel-fiber-reinforced concrete beams. Constr. Build. Mater. 2015, 93, 477–485. [Google Scholar] [CrossRef]
- Jang, S.-J.; Yun, H.-D. Combined effects of steel fiber and coarse aggregate size on the compressive and flexural toughness of high-strength concrete. Compos. Struct. 2018, 185, 203–211. [Google Scholar] [CrossRef]
- Khan, M.; Ali, M. Improvement in concrete behavior with fly ash, silica-fume and coconut fibres. Constr. Build. Mater. 2019, 203, 174–187. [Google Scholar] [CrossRef]
- Li, L.; Khan, M.; Bai, C.; Shi, K. Uniaxial Tensile Behavior, Flexural Properties, Empirical Calculation and Microstructure of Multi-Scale Fiber Reinforced Cement-Based Material at Elevated Temperature. Materials 2021, 14, 1827. [Google Scholar] [CrossRef]
- Kytinou, V.K.; Chalioris, C.E.; Karayannis, C.G.G.; Elenas, A. Effect of Steel Fibers on the Hysteretic Performance of Concrete Beams with Steel Reinforcement—Tests and Analysis. Materials 2020, 13, 2923. [Google Scholar] [CrossRef]
- Cao, M.; Mao, Y.; Khan, M.; Si, W.; Shen, S. Different testing methods for assessing the synthetic fiber distribution in cement-based composites. Constr. Build. Mater. 2018, 184, 128–142. [Google Scholar] [CrossRef]
- Khan, M.; Cao, M.; Xie, C.; Ali, M. Hybrid fiber concrete with different basalt fiber length and content. Struct. Concr. 2021, 23, 346–364. [Google Scholar] [CrossRef]
- Khan, M.; Cao, M.; Hussain, A.; Chu, S. Effect of silica-fume content on performance of CaCO3 whisker and basalt fiber at matrix interface in cement-based composites. Constr. Build. Mater. 2021, 300, 124046. [Google Scholar] [CrossRef]
- Arshad, S.; Sharif, M.B.; Irfan-Ul-Hassan, M.; Khan, M.; Zhang, J.-L. Efficiency of Supplementary Cementitious Materials and Natural Fiber on Mechanical Performance of Concrete. Arab. J. Sci. Eng. 2020, 45, 8577–8589. [Google Scholar] [CrossRef]
- Xie, C.; Cao, M.; Guan, J.; Liu, Z.; Khan, M. Improvement of boundary effect model in multi-scale hybrid fibers reinforced cementitious composite and prediction of its structural failure behavior. Compos. Part B Eng. 2021, 224, 109219. [Google Scholar] [CrossRef]
- Chalioris, C.; Liotoglou, F. Tests and simplified behavioural model for steel fibrous concrete under compression. In Advances in Civil Engineering and Building Materials IV; Taylor and Francis Group: Abingdon, UK, 2015; pp. 195–200. [Google Scholar] [CrossRef]
- Karayannis, C.G. Analysis and Experimental Study for Steel Fibre Pullout from Cementitious Matrices. Adv. Compos. Lett. 2000, 9, 243–255. [Google Scholar] [CrossRef]
- Chalioris, C.E.; Kosmidou, P.-M.K.; Karayannis, C.G. Cyclic Response of Steel Fiber Reinforced Concrete Slender Beams: An Experimental Study. Materials 2019, 12, 1398. [Google Scholar] [CrossRef] [PubMed]
- Nita, S. Machine Learning Techniques Used in Big Data. Sci. Bull. Nav. Acad. 2016, 19, 466–471. [Google Scholar] [CrossRef]
- Behnood, A.; Golafshani, E.M. Machine learning study of the mechanical properties of concretes containing waste foundry sand. Constr. Build. Mater. 2020, 243, 118152. [Google Scholar] [CrossRef]
- Young, B.A.; Hall, A.; Pilon, L.; Gupta, P.; Sant, G. Can the compressive strength of concrete be estimated from knowledge of the mixture proportions?: New insights from statistical analysis and machine learning methods. Cem. Concr. Res. 2018, 115, 379–388. [Google Scholar] [CrossRef]
- Akande, K.O.; Owolabi, T.O.; Twaha, S.; Olatunji, S.O. Performance Comparison of SVM and ANN in Predicting Compressive Strength of Concrete. IOSR J. Comput. Eng. 2014, 16, 88–94. [Google Scholar] [CrossRef]
- Chou, J.-S.; Tsai, C.-F.; Pham, A.-D.; Lu, Y.-H. Machine learning in concrete strength simulations: Multi-nation data analytics. Constr. Build. Mater. 2014, 73, 771–780. [Google Scholar] [CrossRef]
- Duan, J.; Asteris, P.G.; Nguyen, H.; Bui, X.-N.; Moayedi, H. A novel artificial intelligence technique to predict compressive strength of recycled aggregate concrete using ICA-XGBoost model. Eng. Comput. 2020, 37, 3329–3346. [Google Scholar] [CrossRef]
- Gupta, S.M. Support Vector Machines based Modelling of Concrete Strength. World Acad. Sci. Eng. Technol. 2007, 36, 305–311. [Google Scholar]
- Chou, J.-S.; Pham, A.-D. Enhanced artificial intelligence for ensemble approach to predicting high performance concrete compressive strength. Constr. Build. Mater. 2013, 49, 554–563. [Google Scholar] [CrossRef]
- Deepa, C.; Sathiyakumari, K.; Sudha, V. Prediction of the Compressive Strength of High Performance Concrete Mix using Tree Based Modeling. Int. J. Comput. Appl. 2010, 6, 18–24. [Google Scholar] [CrossRef]
- Erdal, H.I. Two-level and hybrid ensembles of decision trees for high performance concrete compressive strength prediction. Eng. Appl. Artif. Intell. 2013, 26, 1689–1697. [Google Scholar] [CrossRef]
- Öztaş, A.; Pala, M.; Özbay, E.; Kanca, E.; Çaǧlar, N.; Bhatti, M.A. Predicting the compressive strength and slump of high strength concrete using neural network. Constr. Build. Mater. 2006, 20, 769–775. [Google Scholar] [CrossRef]
- Sarıdemir, M. Predicting the compressive strength of mortars containing metakaolin by artificial neural networks and fuzzy logic. Adv. Eng. Softw. 2009, 40, 920–927. [Google Scholar] [CrossRef]
- Anwar, M.K.; Shah, S.A.R.; Azab, M.; Shah, I.; Chauhan, M.K.S.; Iqbal, F. Structural Performance of GFRP Bars Based High-Strength RC Columns: An Application of Advanced Decision-Making Mechanism for Experimental Profile Data. Buildings 2022, 12, 611. [Google Scholar] [CrossRef]
- Deifalla, A.; Zapris, A.; Chalioris, C. Multivariable Regression Strength Model for Steel Fiber-Reinforced Concrete Beams under Torsion. Materials 2021, 14, 3889. [Google Scholar] [CrossRef]
- Salem, N.M.; Deifalla, A. Evaluation of the Strength of Slab-Column Connections with FRPs Using Machine Learning Algorithms. Polymers 2022, 14, 1517. [Google Scholar] [CrossRef]
- Azam, R.; Riaz, M.R.; Farooq, M.U.; Ali, F.; Mohsan, M.; Deifalla, A.F.; Mohamed, A.M. Optimization-Based Economical Flexural Design of Singly Reinforced Concrete Beams: A Parametric Study. Materials 2022, 15, 3223. [Google Scholar] [CrossRef]
- Ni, H.-G.; Wang, J.-Z. Prediction of compressive strength of concrete by neural networks. Cem. Concr. Res. 2000, 30, 1245–1250. [Google Scholar] [CrossRef]
- Sobhani, J.; Najimi, M.; Pourkhorshidi, A.R.; Parhizkar, T. Prediction of the compressive strength of no-slump concrete: A comparative study of regression, neural network and ANFIS models. Constr. Build. Mater. 2010, 24, 709–718. [Google Scholar] [CrossRef]
- Awoyera, P.O.; Kirgiz, M.S.; Viloria, A.; Ovallos-Gazabon, D. Estimating strength properties of geopolymer self-compacting concrete using machine learning techniques. J. Mater. Res. Technol. 2020, 9, 9016–9028. [Google Scholar] [CrossRef]
- Li, Y.; Zhang, Q.; Kamiński, P.; Deifalla, A.F.; Sufian, M.; Dyczko, A.; Ben Kahla, N.; Atig, M. Compressive Strength of Steel Fiber-Reinforced Concrete Employing Supervised Machine Learning Techniques. Materials 2022, 15, 4209. [Google Scholar] [CrossRef]
- Nafees, A.; Khan, S.; Javed, M.F.; Alrowais, R.; Mohamed, A.M.; Mohamed, A.; Vatin, N.I. Forecasting the Mechanical Properties of Plastic Concrete Employing Experimental Data Using Machine Learning Algorithms: DT, MLPNN, SVM, and RF. Polymers 2022, 14, 1583. [Google Scholar] [CrossRef]
- Nafees, A.; Javed, M.F.; Khan, S.; Nazir, K.; Farooq, F.; Aslam, F.; Musarat, M.A.; Vatin, N.I. Predictive Modeling of Mechanical Properties of Silica Fume-Based Green Concrete Using Artificial Intelligence Approaches: MLPNN, ANFIS, and GEP. Materials 2021, 14, 7531. [Google Scholar] [CrossRef]
- Khan, M.; Lao, J.; Dai, J.-G. Comparative study of advanced computational techniques for estimating the compressive strength of UHPC. J. Asian Concr. Fed. 2022, 8, 51–68. [Google Scholar] [CrossRef]
- Shah, S.A.R.; Azab, M.; ElDin, H.M.S.; Barakat, O.; Anwar, M.K.; Bashir, Y. Predicting Compressive Strength of Blast Furnace Slag and Fly Ash Based Sustainable Concrete Using Machine Learning Techniques: An Application of Advanced Decision-Making Approaches. Buildings 2022, 12, 914. [Google Scholar] [CrossRef]
- Hodhod, O.; Ahmed, H. Modeling the corrosion initiation time of slag concrete using the artificial neural network. HBRC J. 2014, 10, 231–234. [Google Scholar] [CrossRef]
- Carmichael, R. Relationships between Young’s Modulus, Compressive Strength, Poisson’s Ratio, and Time for Early Age Concrete. Swarthmore. 2009. Available online: http://www.engin.swarthmore.edu/~rcarmic1/e82report.pdf (accessed on 9 June 2022).
- Bal, L.; Buyle-Bodin, F. Artificial neural network for predicting drying shrinkage of concrete. Constr. Build. Mater. 2012, 38, 248–254. [Google Scholar] [CrossRef]
- Zhu, Y.; Ahmad, A.; Ahmad, W.; Vatin, N.I.; Mohamed, A.M.; Fathi, D. Predicting the Splitting Tensile Strength of Recycled Aggregate Concrete Using Individual and Ensemble Machine Learning Approaches. Crystals 2022, 12, 569. [Google Scholar] [CrossRef]
- Ahmad, A.; Ahmad, W.; Aslam, F.; Joyklad, P. Compressive strength prediction of fly ash-based geopolymer concrete via advanced machine learning techniques. Case Stud. Constr. Mater. 2021, 16, e00840. [Google Scholar] [CrossRef]
- Ahmad, W.; Ahmad, A.; Ostrowski, K.A.; Aslam, F.; Joyklad, P.; Zajdel, P. Application of Advanced Machine Learning Approaches to Predict the Compressive Strength of Concrete Containing Supplementary Cementitious Materials. Materials 2021, 14, 5762. [Google Scholar] [CrossRef] [PubMed]
- Yuan, X.; Tian, Y.; Ahmad, W.; Ahmad, A.; Usanova, K.I.; Mohamed, A.M.; Khallaf, R. Machine Learning Prediction Models to Evaluate the Strength of Recycled Aggregate Concrete. Materials 2022, 15, 2823. [Google Scholar] [CrossRef]
- Song, P.S.; Hwang, S. Mechanical properties of high-strength steel fiber-reinforced concrete. Constr. Build. Mater. 2004, 18, 669–673. [Google Scholar] [CrossRef]
- Johnson, D.A.; Pedersen, N.; Jacobsen, C.B. Effect of steel fibers on flexural behaviour of normal and high strength concrete. Int. J. Civ. Environ. Eng. 2014, 8, 22–26. [Google Scholar]
- Lee, H.-H.; Lee, H.-J. Characteristic Strength and Deformation of SFRC Considering Steel Fiber Factor and Volume fraction. J. Korea Concr. Inst. 2004, 16, 759–766. [Google Scholar] [CrossRef]
- Oh, Y.-H. Evaluation of Flexural Strength for Normal and High Strength Concrete with Hooked Steel Fibers. J. Korea Concr. Inst. 2008, 20, 531–539. [Google Scholar] [CrossRef][Green Version]
- Dinh, N.H.; Park, S.-H.; Choi, K.-K. Effect of dispersed micro-fibers on tensile behavior of uncoated carbon textile-reinforced cementitious mortar after high-temperature exposure. Cem. Concr. Compos. 2021, 118, 103949. [Google Scholar] [CrossRef]
- Thomas, J.; Ramaswamy, A. Mechanical Properties of Steel Fiber-Reinforced Concrete. J. Mater. Civ. Eng. 2007, 19, 385–392. [Google Scholar] [CrossRef]
- Sivakumar, A.; Santhanam, M. Mechanical properties of high strength concrete reinforced with metallic and non-metallic fibres. Cem. Concr. Compos. 2007, 29, 603–608. [Google Scholar] [CrossRef]
- Afroughsabet, V.; Ozbakkaloglu, T. Mechanical and durability properties of high-strength concrete containing steel and polypropylene fibers. Constr. Build. Mater. 2015, 94, 73–82. [Google Scholar] [CrossRef]
- Atis, C.; Karahan, O. Properties of steel fiber reinforced fly ash concrete. Constr. Build. Mater. 2007, 23, 392–399. [Google Scholar] [CrossRef]
- Soulioti, D.V.; Barkoula, N.M.; Paipetis, A.; Matikas, T.E. Effects of Fibre Geometry and Volume Fraction on the Flexural Behaviour of Steel-Fibre Reinforced Concrete. Strain 2009, 47 (Suppl. S1), e535–e541. [Google Scholar] [CrossRef]
- Yoon, S.B.; Park, E.S. An experimental study on the mechanical properties and long-term deformations of high-strength steel fiber reinforced concrete. J. Korean Soc. Civ. Eng. 2006, 26, 401–409. [Google Scholar]
- Abbass, W.; Khan, M.I.; Mourad, S. Evaluation of mechanical properties of steel fiber reinforced concrete with different strengths of concrete. Constr. Build. Mater. 2018, 168, 556–569. [Google Scholar] [CrossRef]
- Reddy, V.M.; Rao, M.V.S. Effect of w/c ratio on workability and mechanical properties of high strength Self Compacting Concrete (M70 grade). IOSR J. Mech. Civ. Eng. 2014, 11, 15–21. [Google Scholar] [CrossRef]
- Nili, M.; Afroughsabet, V. Combined effect of silica fume and steel fibers on the impact resistance and mechanical properties of concrete. Int. J. Impact Eng. 2010, 37, 879–886. [Google Scholar] [CrossRef]
- Açikgenç, M.; Alyamaç, K.E.; Ulucan, Z.Ç. Relation between Splitting Tensile and Flexural Strengths of Steel Fiber-Reinforced Concrete Relation between Splitting Tensile and Flexural Strengths. 2015, no. August 2016. Available online: https://www.researchgate.net/publication/278022867_Relation_between_Splitting_Tensile_and_Flexural_Strengths_of_Steel_Fiber-Reinforced_Concrete (accessed on 9 June 2022).
- Li, W. Analysis of the Influence of Water-cement Ratio on Concrete Strength. E3S Web Conf. 2021, 283, 01016. [Google Scholar] [CrossRef]
- Shah, M.S.A.; Noor, N.M.; Kueh, A.B.H.; Tamin, M.N. Effects of water-cement ratio and notches to the flexural strength of concrete. IOP Conf. Ser. Mater. Sci. Eng. 2020, 849, 1–10. [Google Scholar] [CrossRef]
- Lee, C.J.; Lange, D.A.; Lee, J.Y.; Shin, S.W. Effects of Fiber Volume Fraction and Water/Cement Ratio on Toughness Development of Steel Fiber Reinforced Concrete. J. Korea Inst. Build. Constr. 2013, 13, 20–28. [Google Scholar] [CrossRef]
- Balanji, E.K.Z. Effect Of Water/Cement Ratio and Fiber Content on Mechanical Properties and Impact Resistance of Steel Fiber Reinforced Concrete Mixtures. Master’s Thesis, Ege University, Bornova, Turkey. [CrossRef]
- Kim, J.J.; Kim, D.J.; Kang, S.T.; Lee, J.H. Influence of sand to coarse aggregate ratio on the interfacial bond strength of steel fibers in concrete for nuclear power plant. Nucl. Eng. Des. 2012, 252, 1–10. [Google Scholar] [CrossRef]
- Chitlange, M.R.; Pajgade, P.S. Strength appraisal of artificial sand as fine aggregate in SFRC. J. Eng. Appl. Sci. 2010, 5, 34–38. [Google Scholar]
- Dashrath, K.B.; Anil, N.M.; Wakchaure, M.R.; Kulkarni, V.P.; Nagar, A. Effect of aggregate types on flexural strength of concrete. Int. J. Sci. Eng. Technol. 2014, 909, 906–909. [Google Scholar]
- El-Ariss, B. Effect of reducing coarse aggregates on concrete strength. Constr. Build. Mater. 2006, 20, 149–157. [Google Scholar] [CrossRef]
- Sunarso, M.; Soeprapto, G.; Murdono, F. Effect of sand-to-aggregate volume ratio on mechanical properties concrete. IABSE-JSCE Jt. Conf. Adv. Bridg. Eng. 2020, 59, 1–16. [Google Scholar]
- Sunarso, M.; Soeprapto, G.; Murdono, F. Effect of sand to aggregate ratio and dosage of admixture on high strength concrete properties. In Proceedings of the AIP Conference Proceedings, Palembang, Indonesia, 14–17 August 2017; Volume 1903. [Google Scholar] [CrossRef]
- Khan, M.; Ali, M. Effect of super plasticizer on the properties of medium strength concrete prepared with coconut fiber. Constr. Build. Mater. 2018, 182, 703–715. [Google Scholar] [CrossRef]
- Aruntaş, H.Y.; Cemalgil, S.; Şimşek, O.; Durmuş, G.; Erdal, M. Effects of super plasticizer and curing conditions on properties of concrete with and without fiber. Mater. Lett. 2008, 62, 3441–3443. [Google Scholar] [CrossRef]
- Nili, M.; Afroughsabet, V. Property assessment of steel–fibre reinforced concrete made with silica fume. Constr. Build. Mater. 2012, 28, 664–669. [Google Scholar] [CrossRef]
- Shafieyzadeh, M. Prediction of Flexural Strength of Concretes Containing Silica Fume and Styrene-Butadiene Rubber (SBR) with an Empirical Model. J. Inst. Eng. Ser. A 2015, 96, 349–355. [Google Scholar] [CrossRef]
- Shmlls, M.; Bozsaky, D.; Horváth, T. Compressive, flexural and splitting strength of fly ash and silica fume concrete. Pollack Period. 2022, 17, 50–55. [Google Scholar] [CrossRef]
- Saravana, R.M.K.; Sumathi, A. Effect of fly ash in fiber reinforced concrete composites. Jordan J. Civ. Eng. 2017, 11, 30–39. [Google Scholar]
- Challoob, M.A.; Srivastava, V.; Materials, A. Effect of Fly Ash and Steel Fibre on Portland Pozzolana Cement Concrete. Int. J. Eng. Trends Technol. 2013, 5, 144–147. [Google Scholar]
- Saha, A.K. Effect of class F fly ash on the durability properties of concrete. Sustain. Environ. Res. 2018, 28, 25–31. [Google Scholar] [CrossRef]
- Nath, P.; Sarker, P. Effect of Fly Ash on the Durability Properties of High Strength Concrete. Procedia Eng. 2011, 14, 1149–1156. [Google Scholar] [CrossRef]
- Jhatial, A.A.; Sohu, S.; Bhatti, N.-U.; Lakhiar, M.T.; Oad, R. Effect of steel fibres on the compressive and flexural strength of concrete. Int. J. Adv. Appl. Sci. 2018, 5, 16–21. [Google Scholar] [CrossRef]
- Hussain, H.K.; Abbas, A.M.; Ojaimi, M.F. Fiber-Type Influence on the Flexural Behavior of RC Two-Way Slabs with an Opening. Buildings 2022, 12, 279. [Google Scholar] [CrossRef]
- Shin, H.-O.; Kim, K.; Oh, T.; Yoo, D.-Y. Effects of fiber type and specimen thickness on flexural behavior of ultra-high-performance fiber-reinforced concrete subjected to uniaxial and biaxial stresses. Case Stud. Constr. Mater. 2021, 15, e00726. [Google Scholar] [CrossRef]
- Ahmad, A.; Chaiyasarn, K.; Farooq, F.; Ahmad, W.; Suparp, S.; Aslam, F. Compressive Strength Prediction via Gene Expression Programming (GEP) and Artificial Neural Network (ANN) for Concrete Containing RCA. Buildings 2021, 11, 324. [Google Scholar] [CrossRef]
- Leinweber, D.J. Stupid Data Miner Tricks: Overfitting the S&P500. J. Investig. 2007, 16, 15–22. [Google Scholar] [CrossRef]
- Kohavi, R. A Study of Cross-Validation and Bootstrap for Accuracy Estimation and Model Selection. Int. Jt. Conf. Artif. Intell. 1995, 30, 133. [Google Scholar]
- Farooq, F.; Ahmed, W.; Akbar, A.; Aslam, F.; Alyousef, R. Predictive modeling for sustainable high-performance concrete from industrial wastes: A comparison and optimization of models using ensemble learners. J. Clean. Prod. 2021, 292, 126032. [Google Scholar] [CrossRef]
Publisher’s Note: MDPI stays neutral with regard to jurisdictional claims in published maps and institutional affiliations. |
© 2022 by the authors. Licensee MDPI, Basel, Switzerland. This article is an open access article distributed under the terms and conditions of the Creative Commons Attribution (CC BY) license (https://creativecommons.org/licenses/by/4.0/).