
Green Synthesis of Zinc Oxide Nanoparticles Using Red Seaweed for the Elimination of Organic Toxic Dye from an Aqueous Solution

 ,
, 

 ,
,  and
and 
Abstract
:1. Introduction
2. Materials and Methods
2.1. Collection and Preparation of Seaweeds
2.2. ZnO Nanoparticle Synthesis
2.3. Reagents and Chemicals
2.4. Characterization
2.5. Adsorption Equilibrium Procedure
2.5.1. Batch Adsorption Studies
2.5.2. Adsorption Kinetics, Equilibrium, and Thermodynamic Studies
2.5.3. Analysis of Errors
3. Results and Discussion
3.1. ZnO-NP Characterization
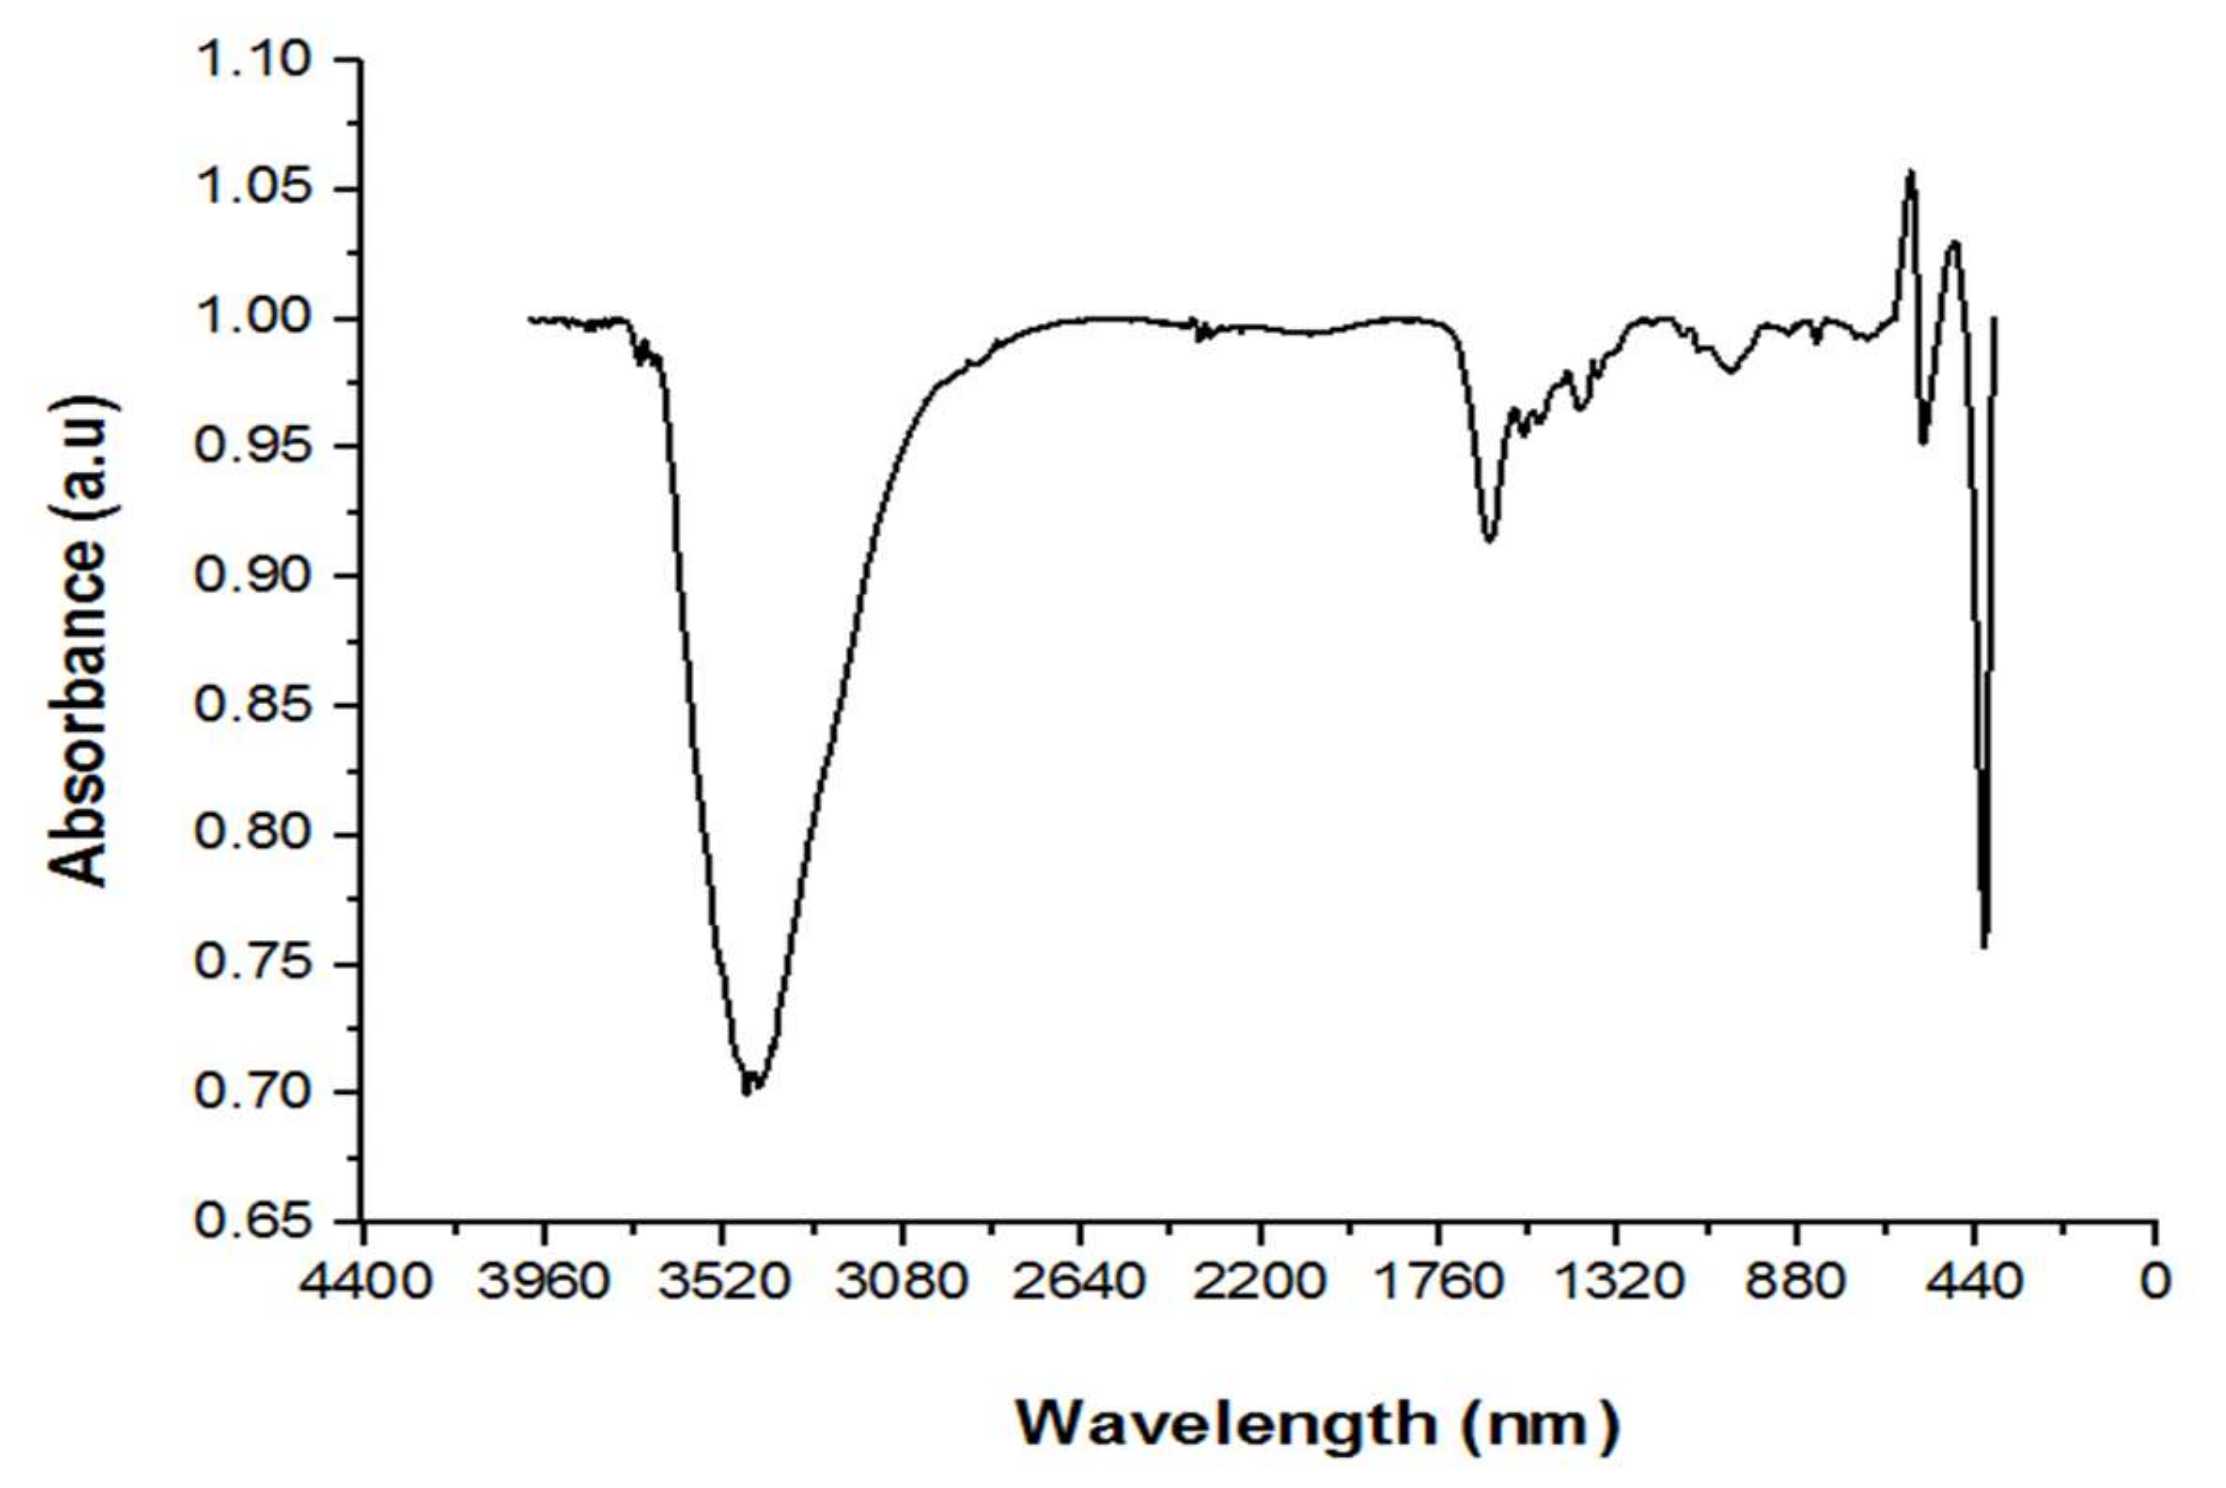
3.1.1. FTIR
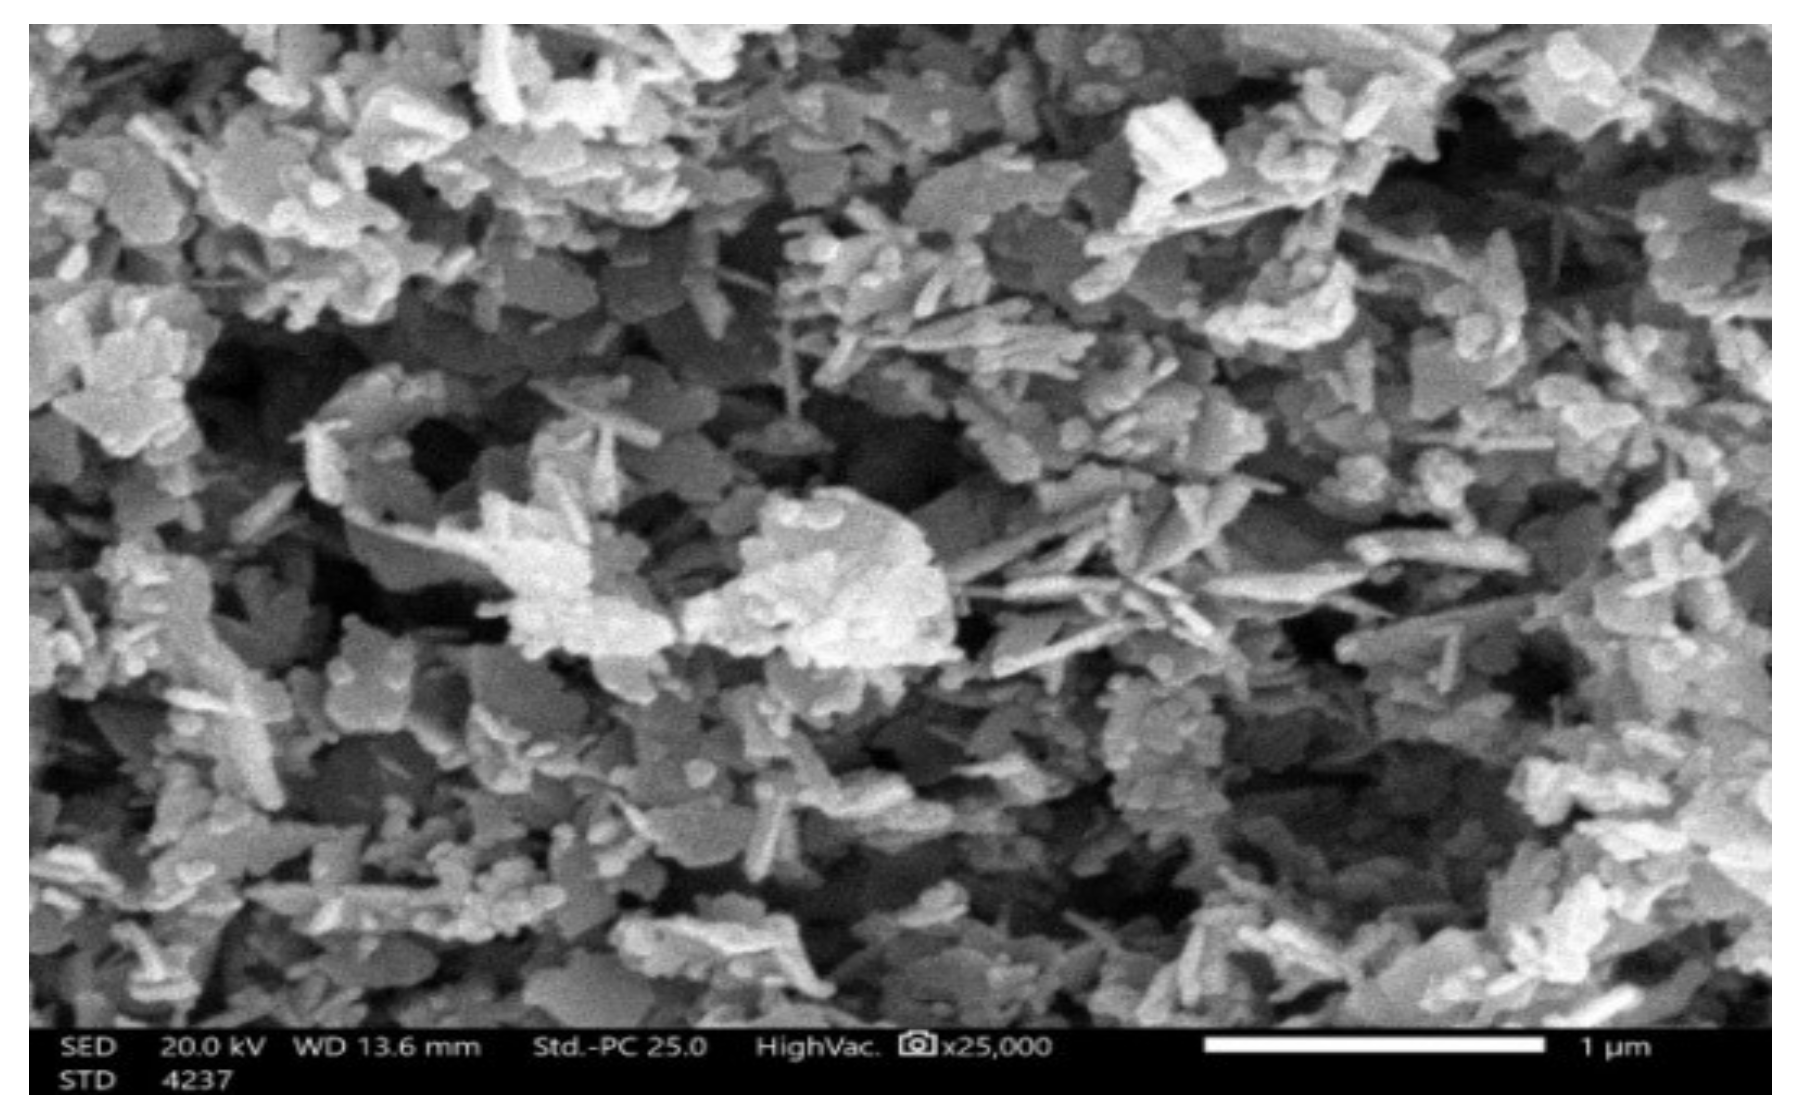
3.1.2. SEM
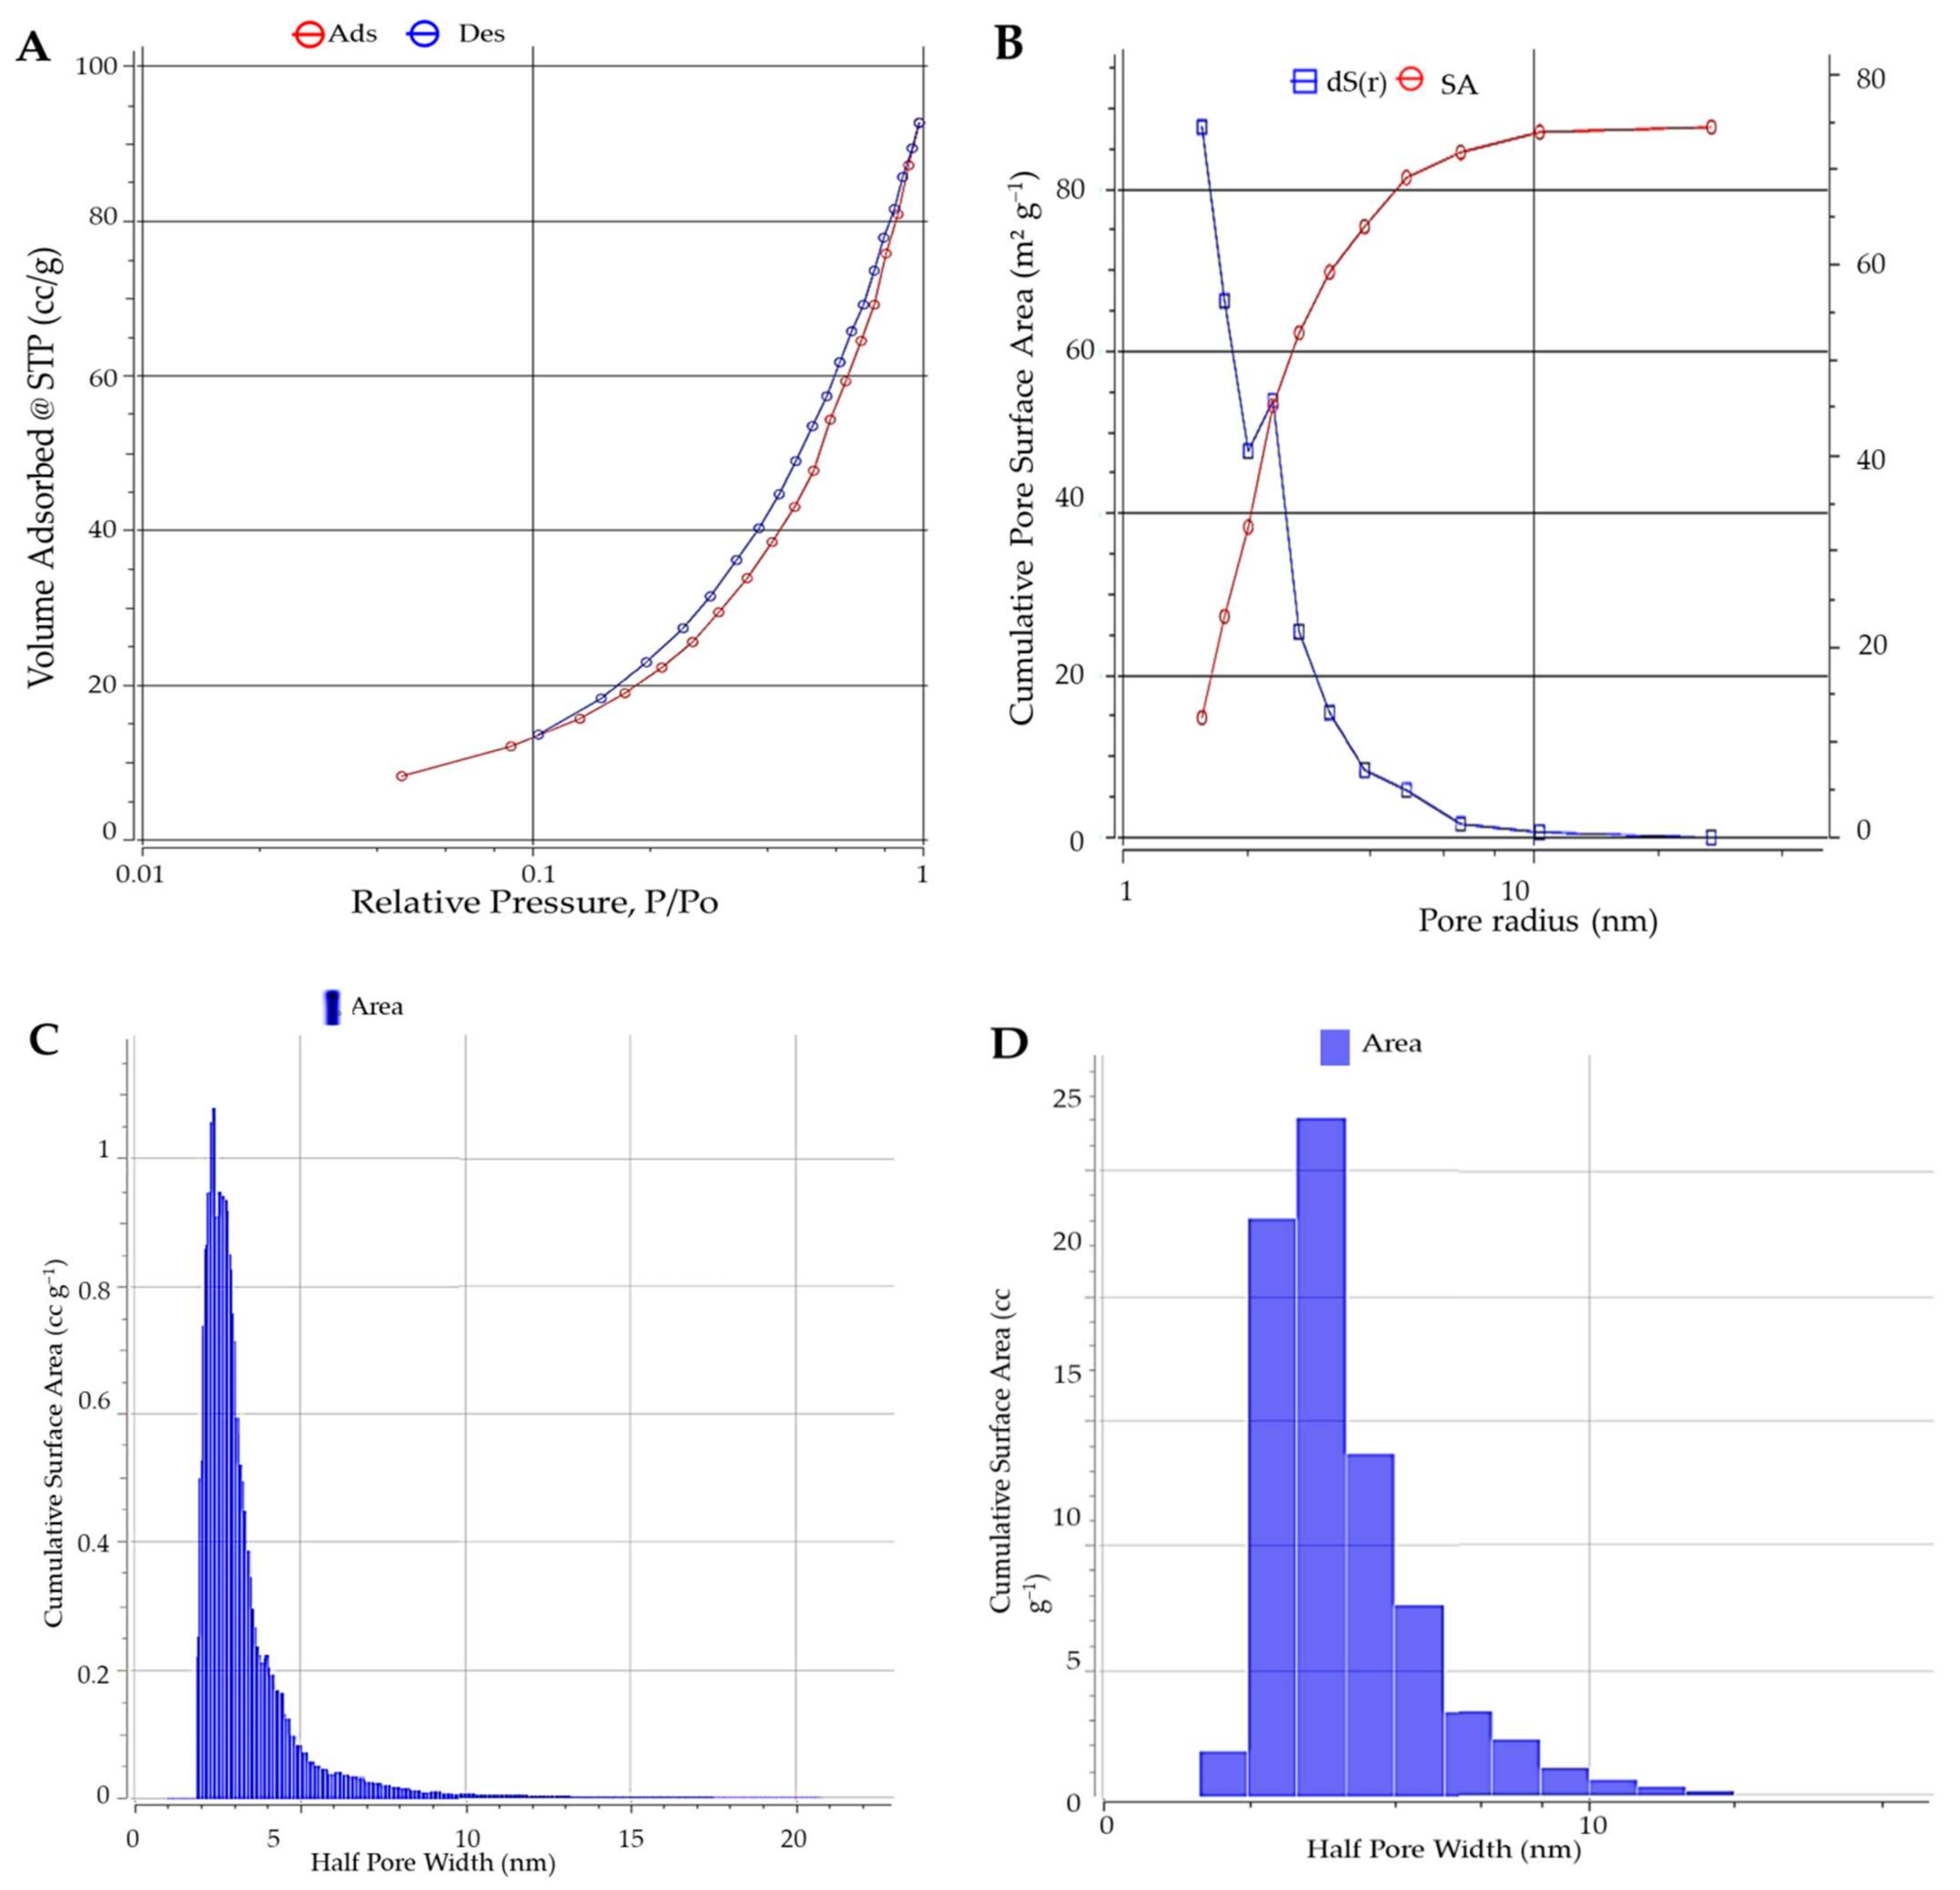
3.1.3. BET
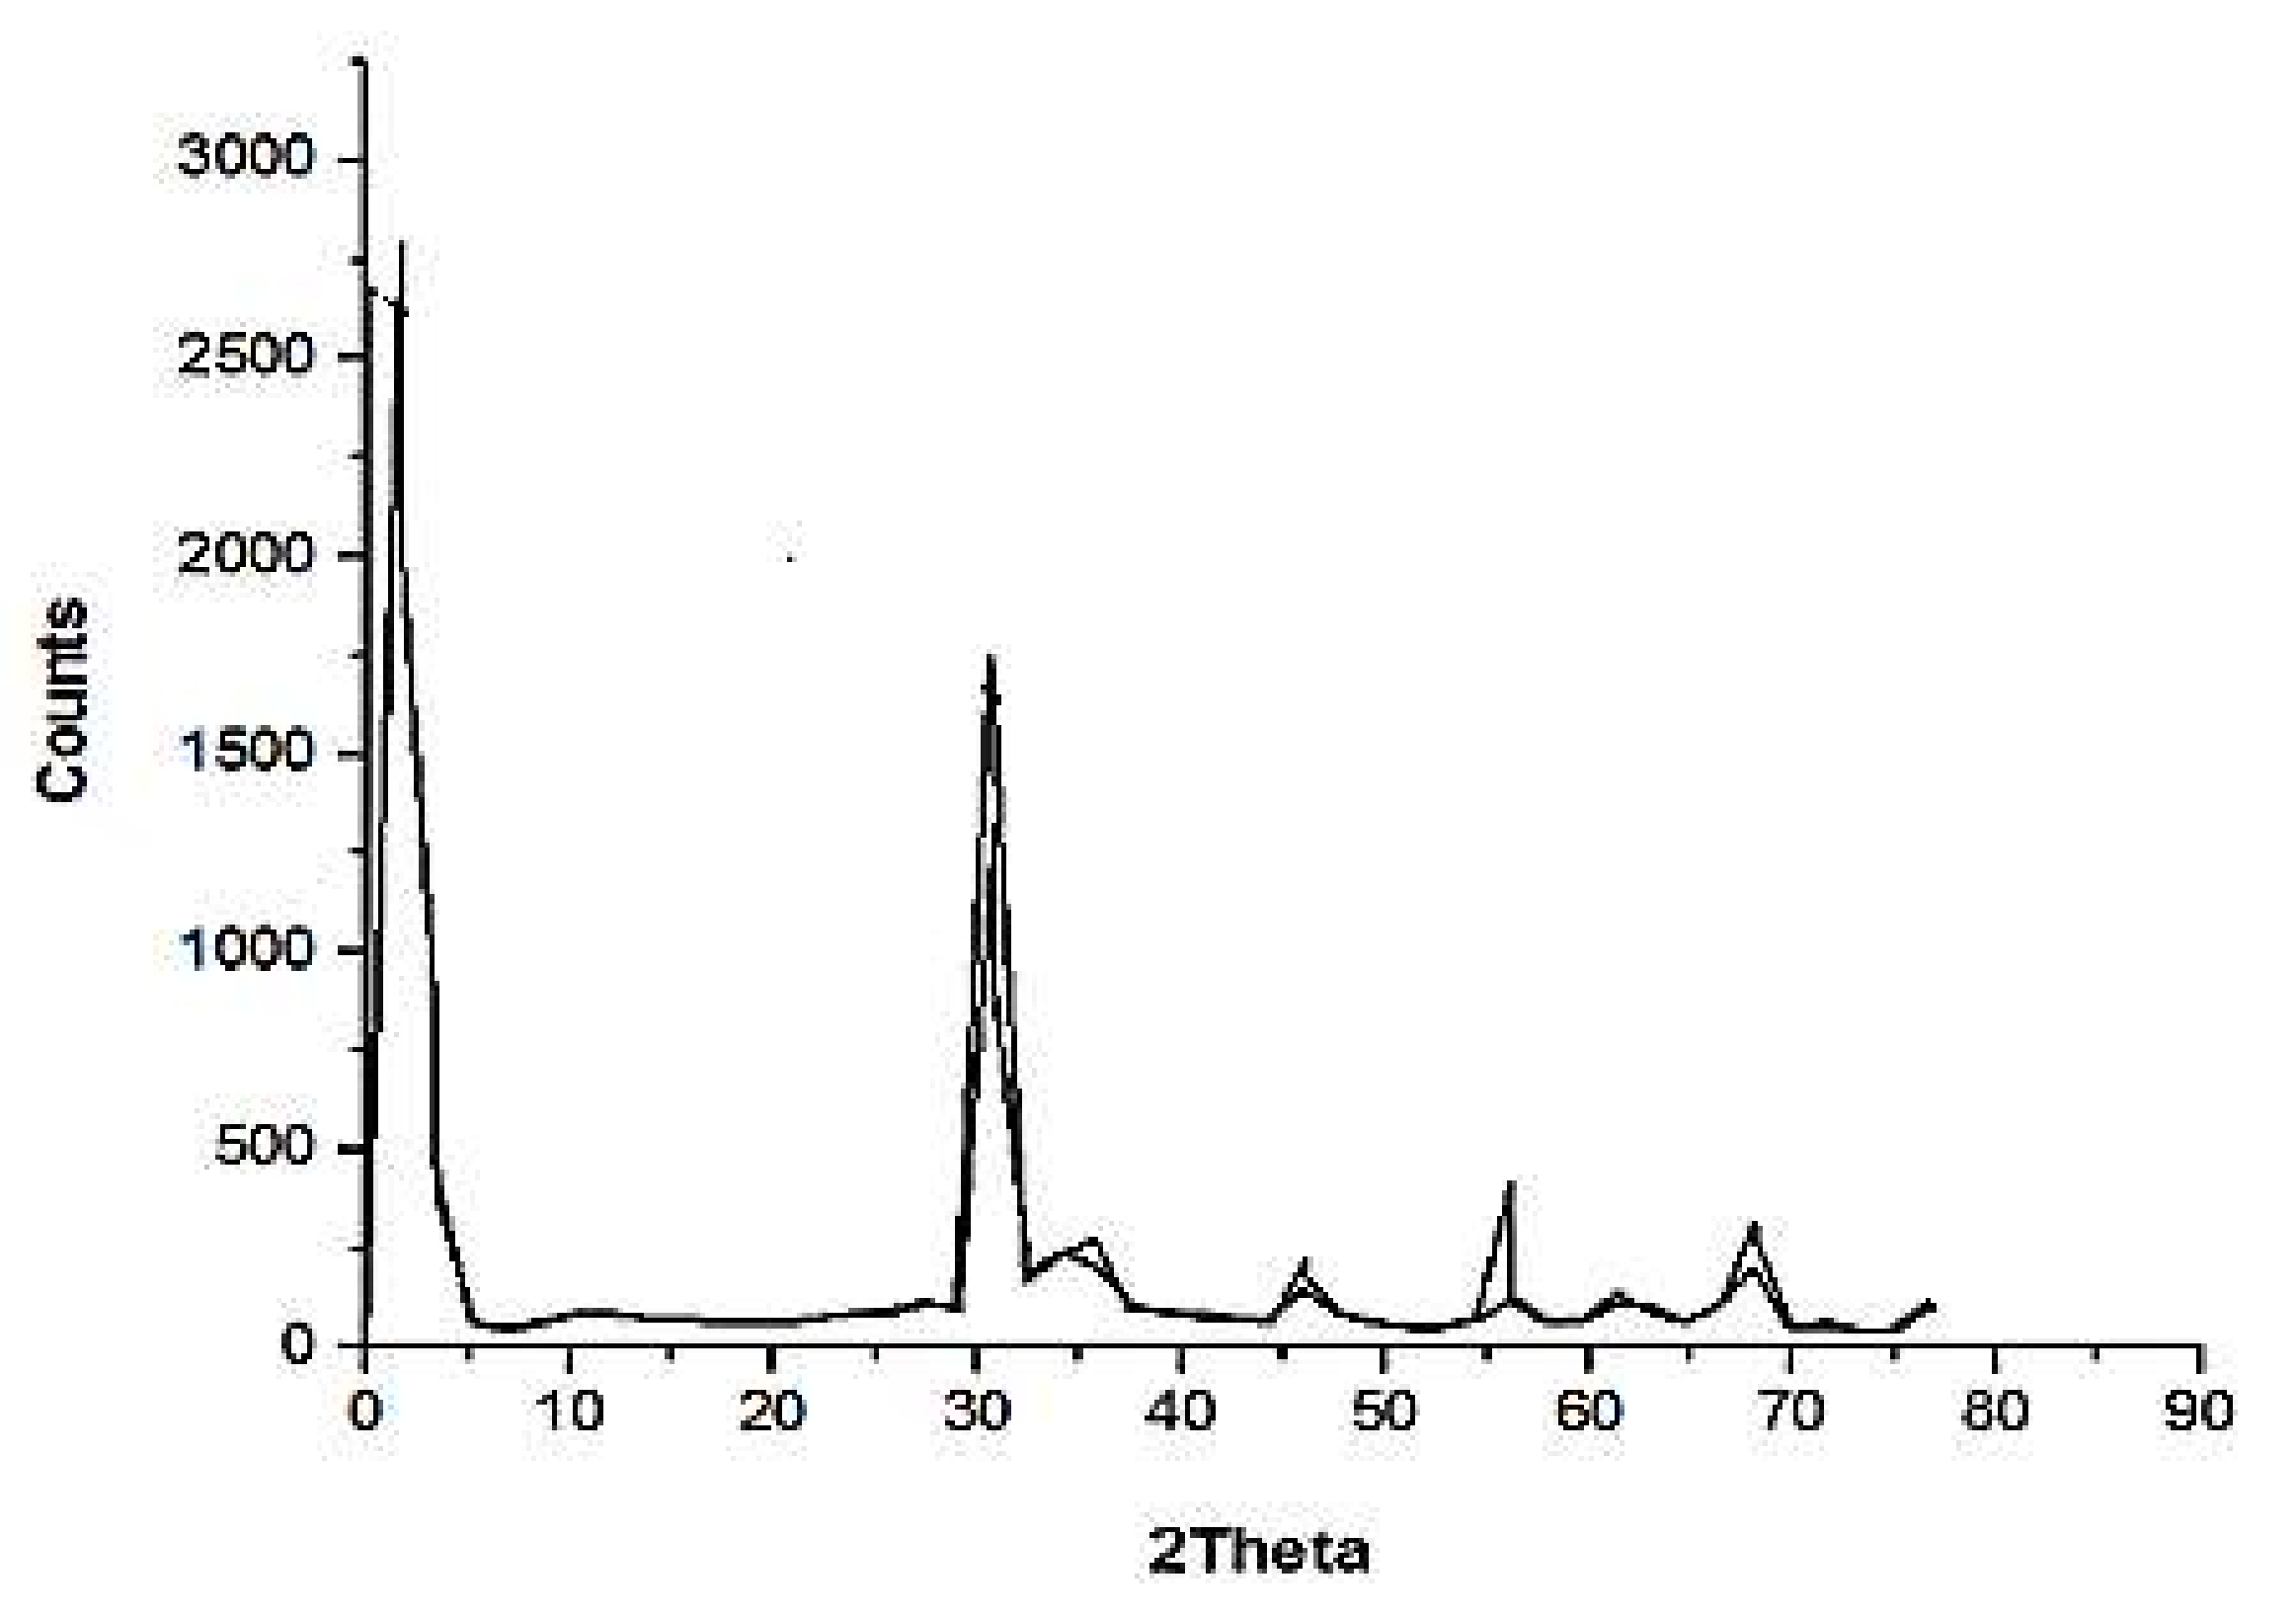
3.2. XRD Study
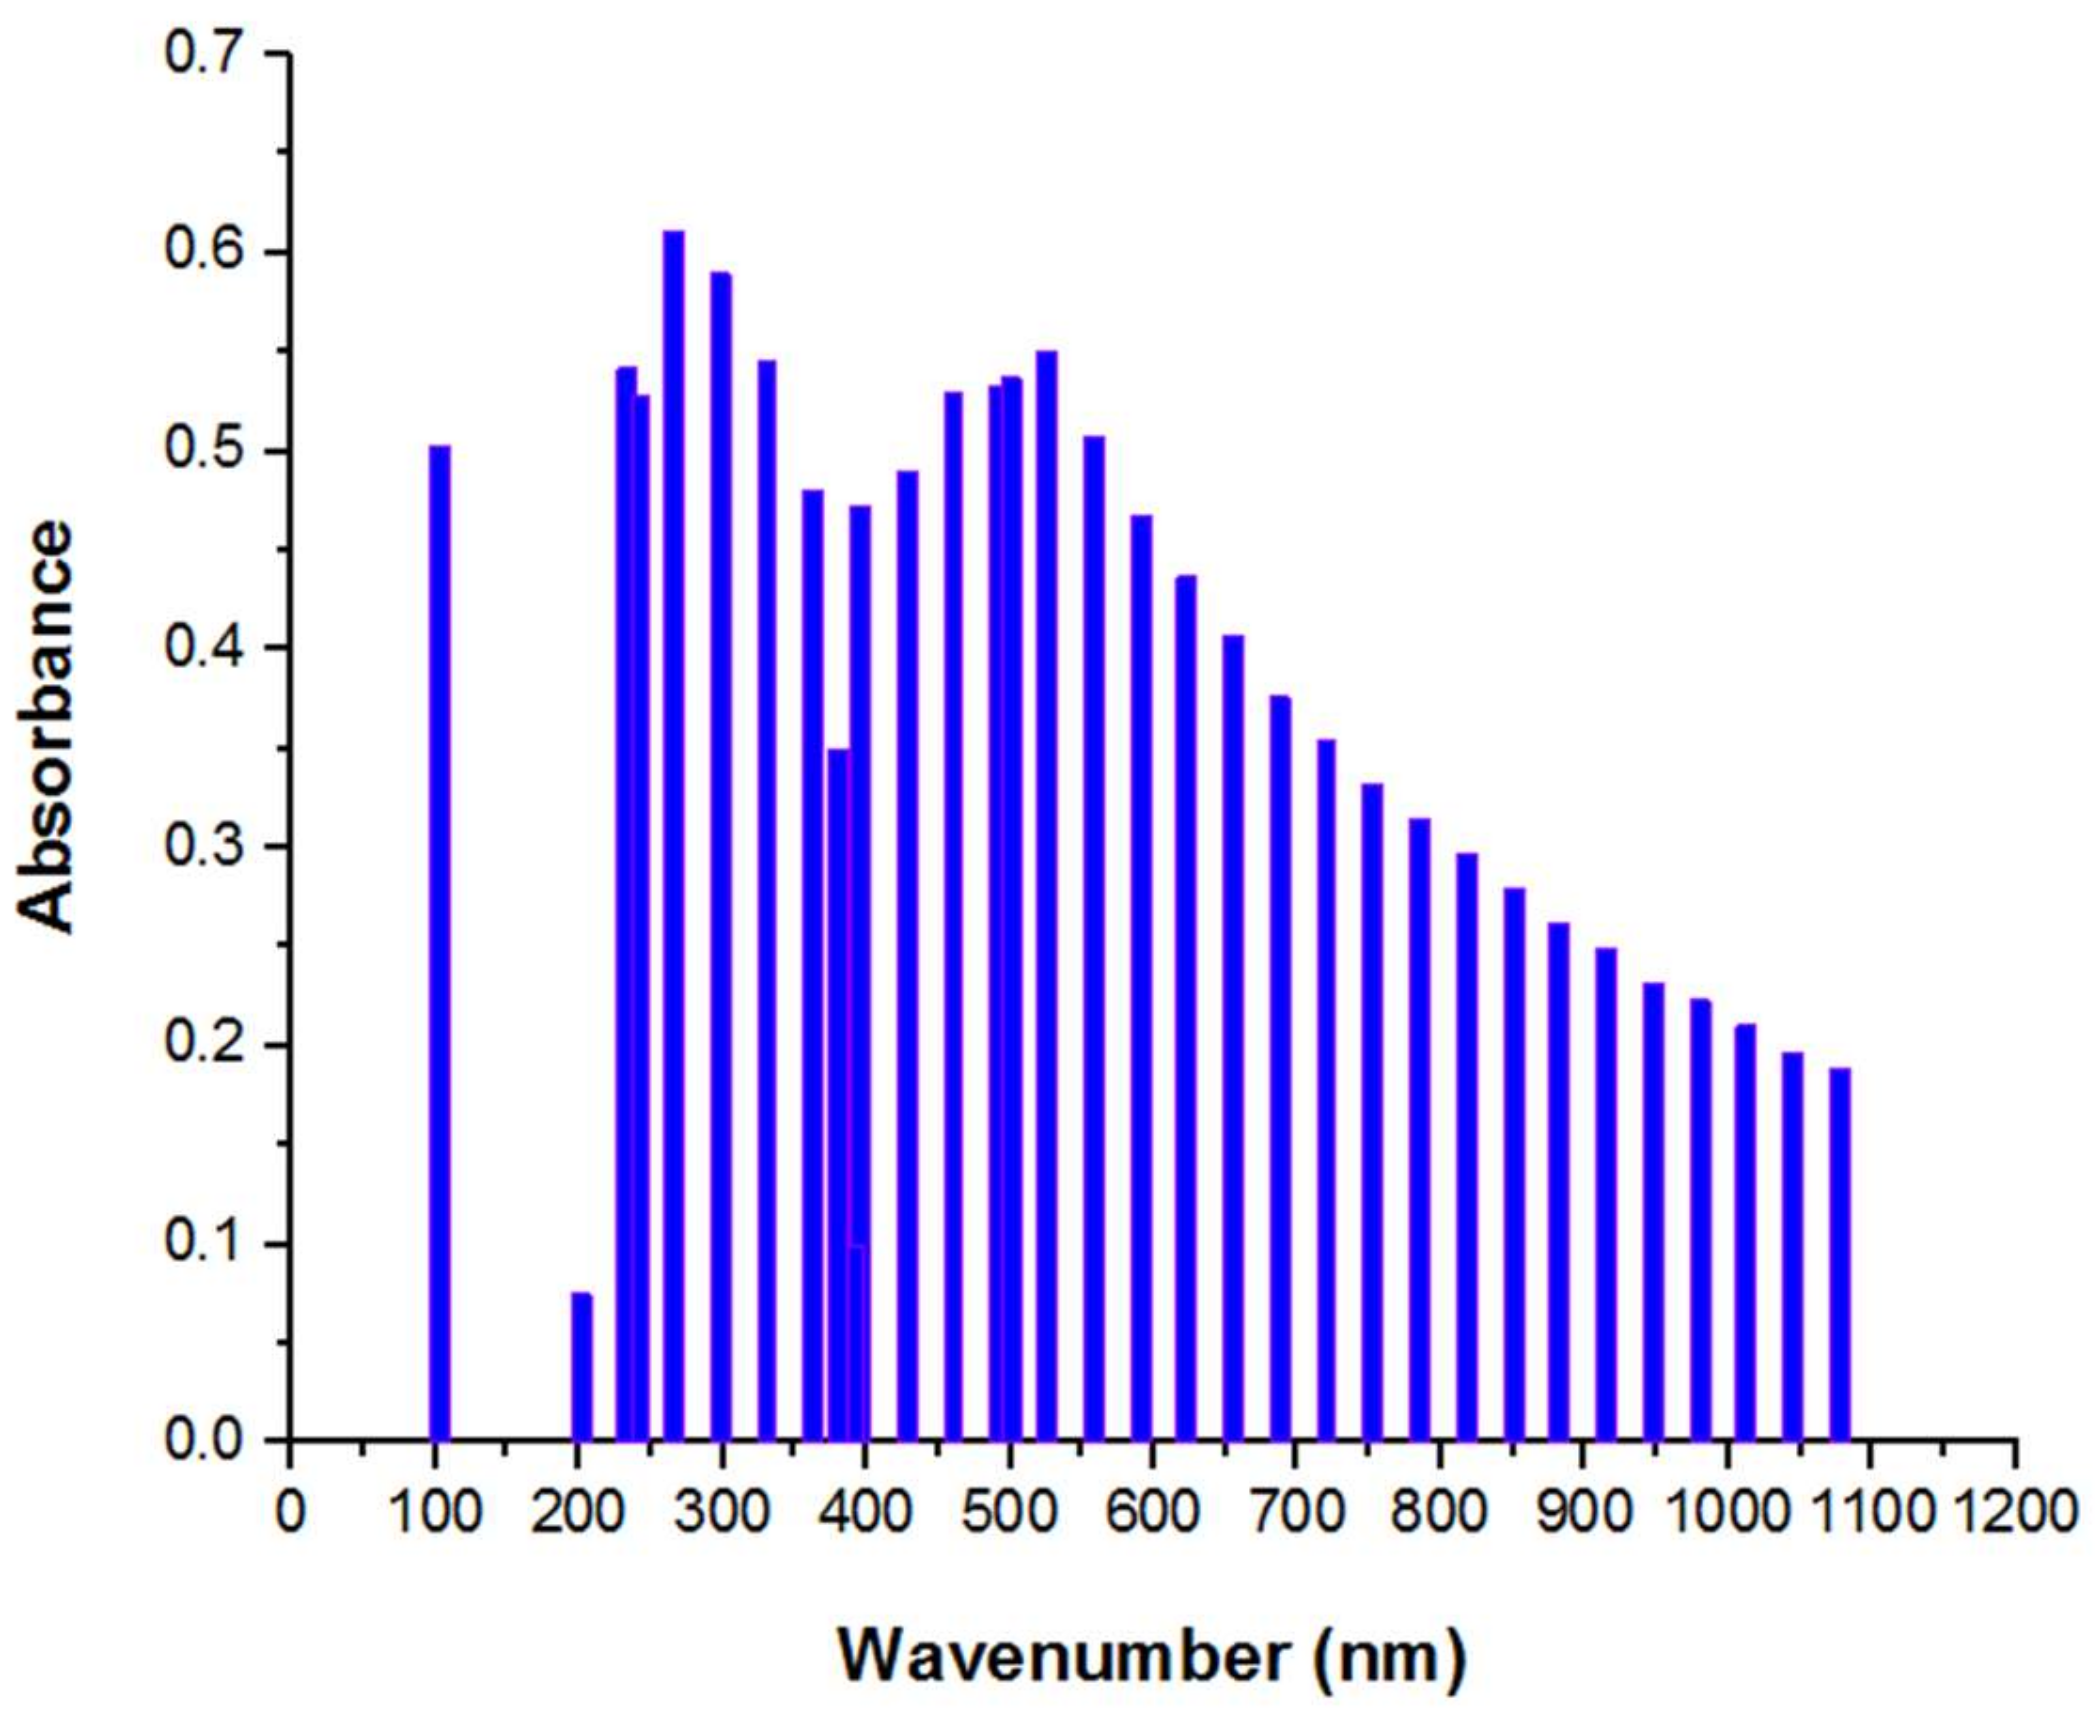
3.3. UV
3.4. Influence of Experimental Parameters on the Adsorption Mechanism
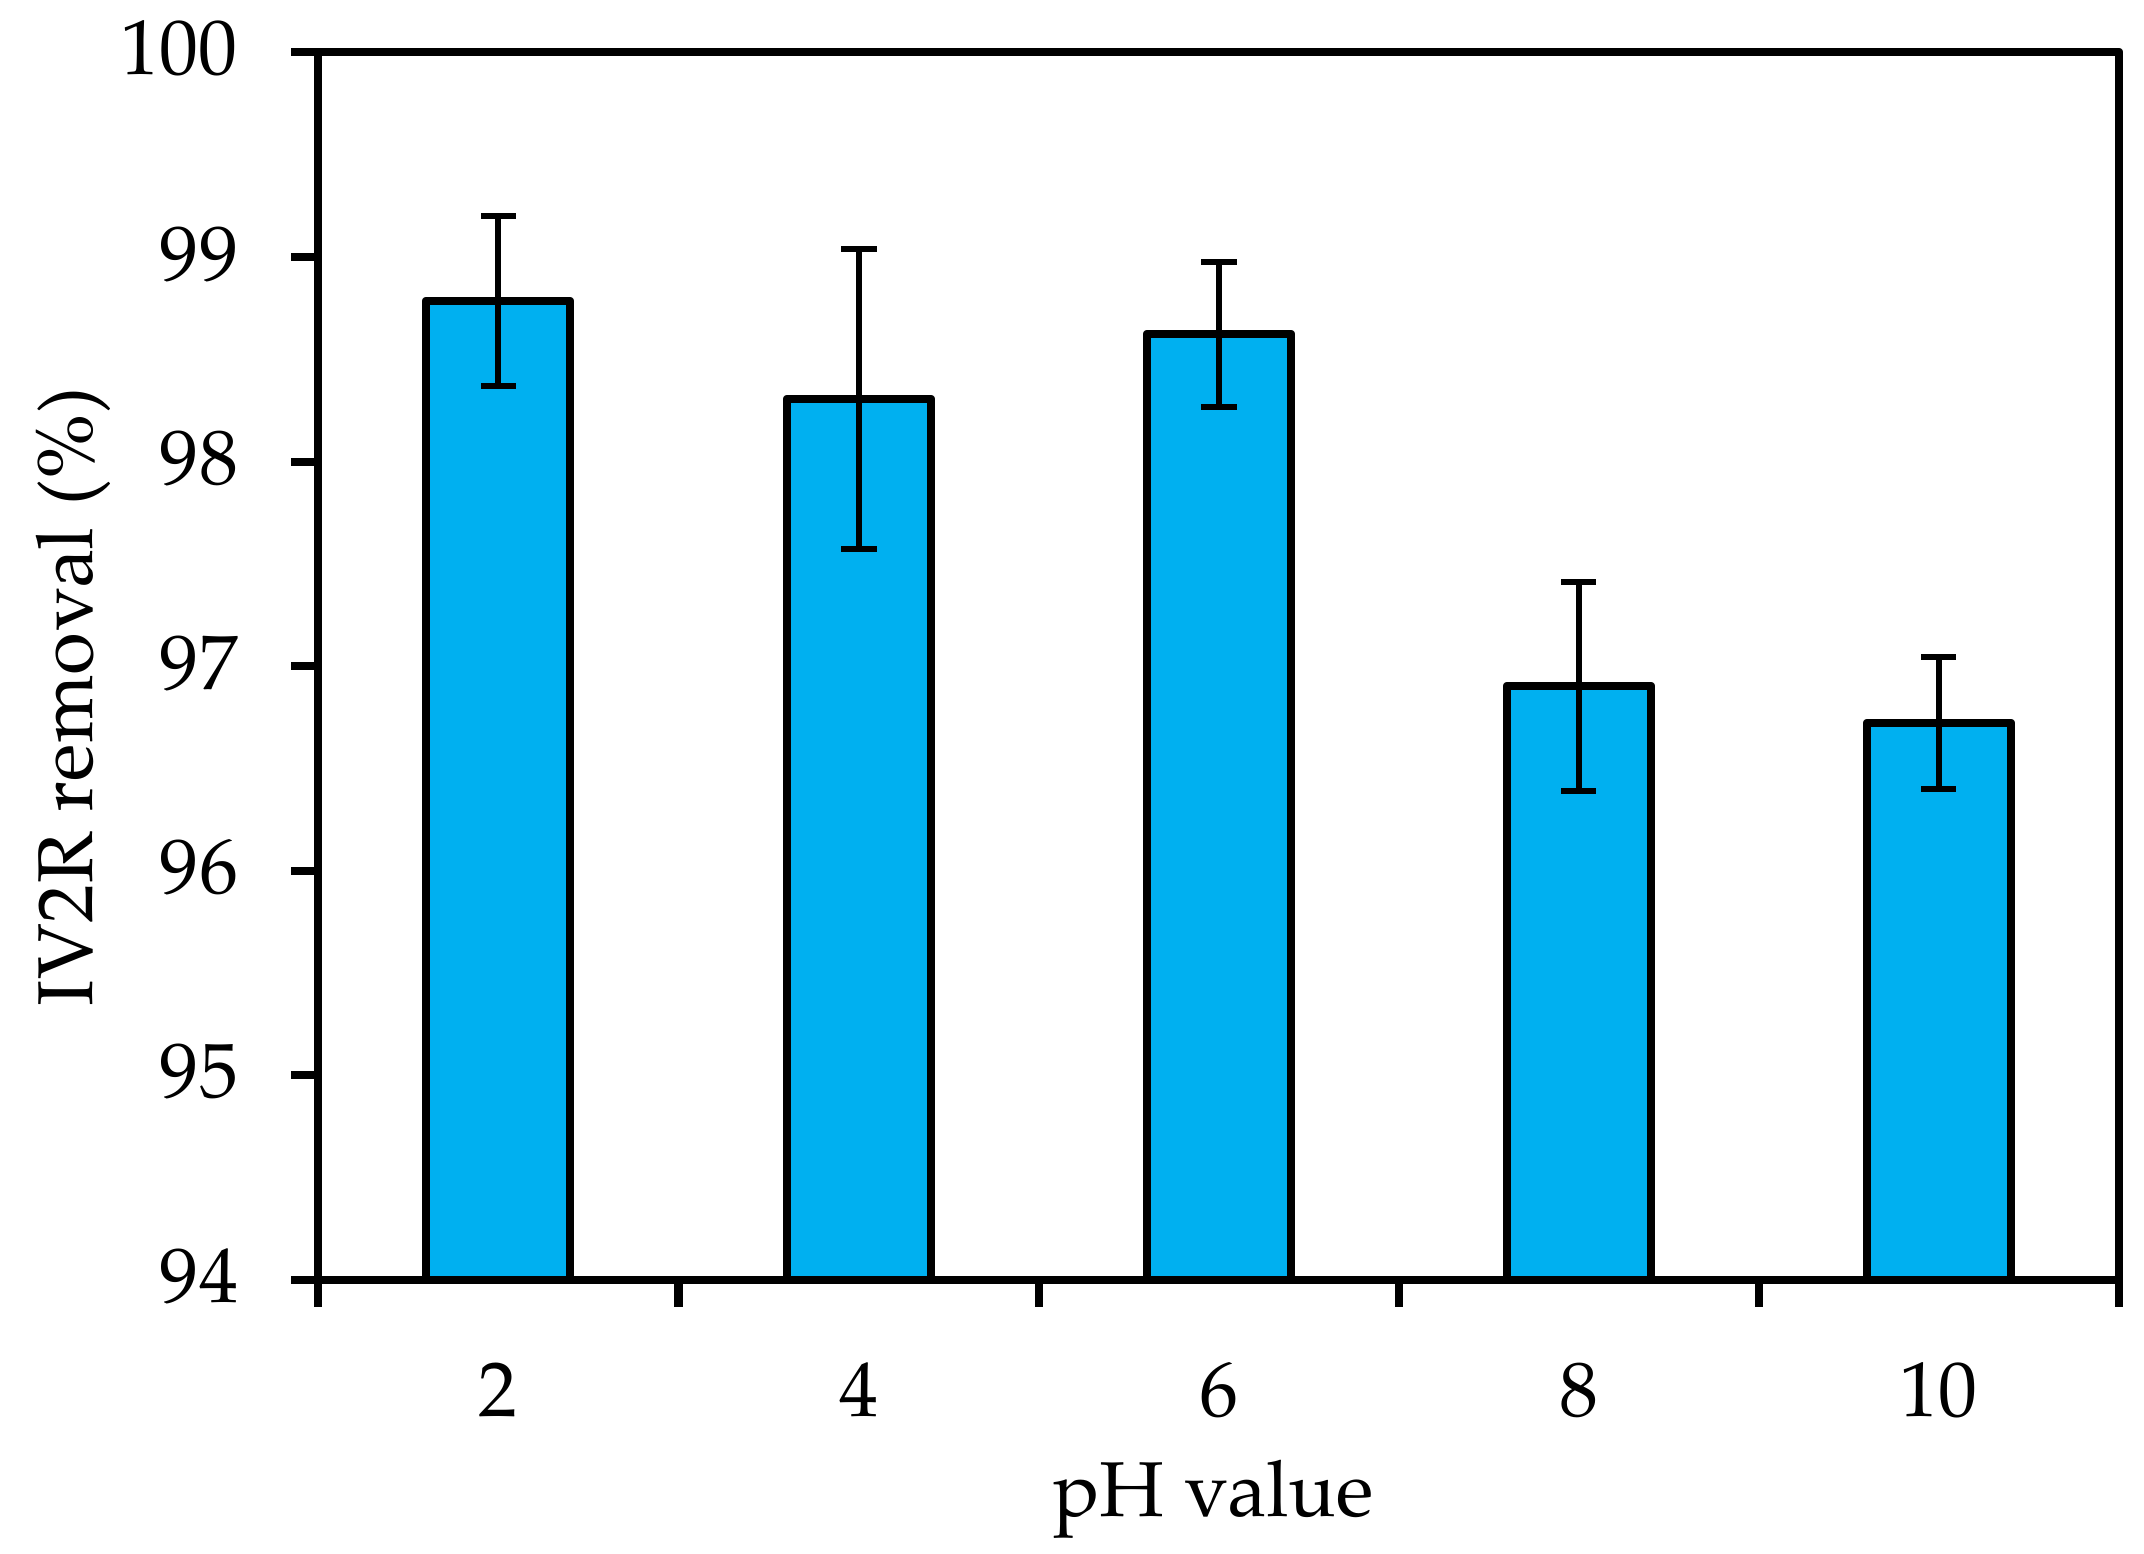
3.4.1. pH
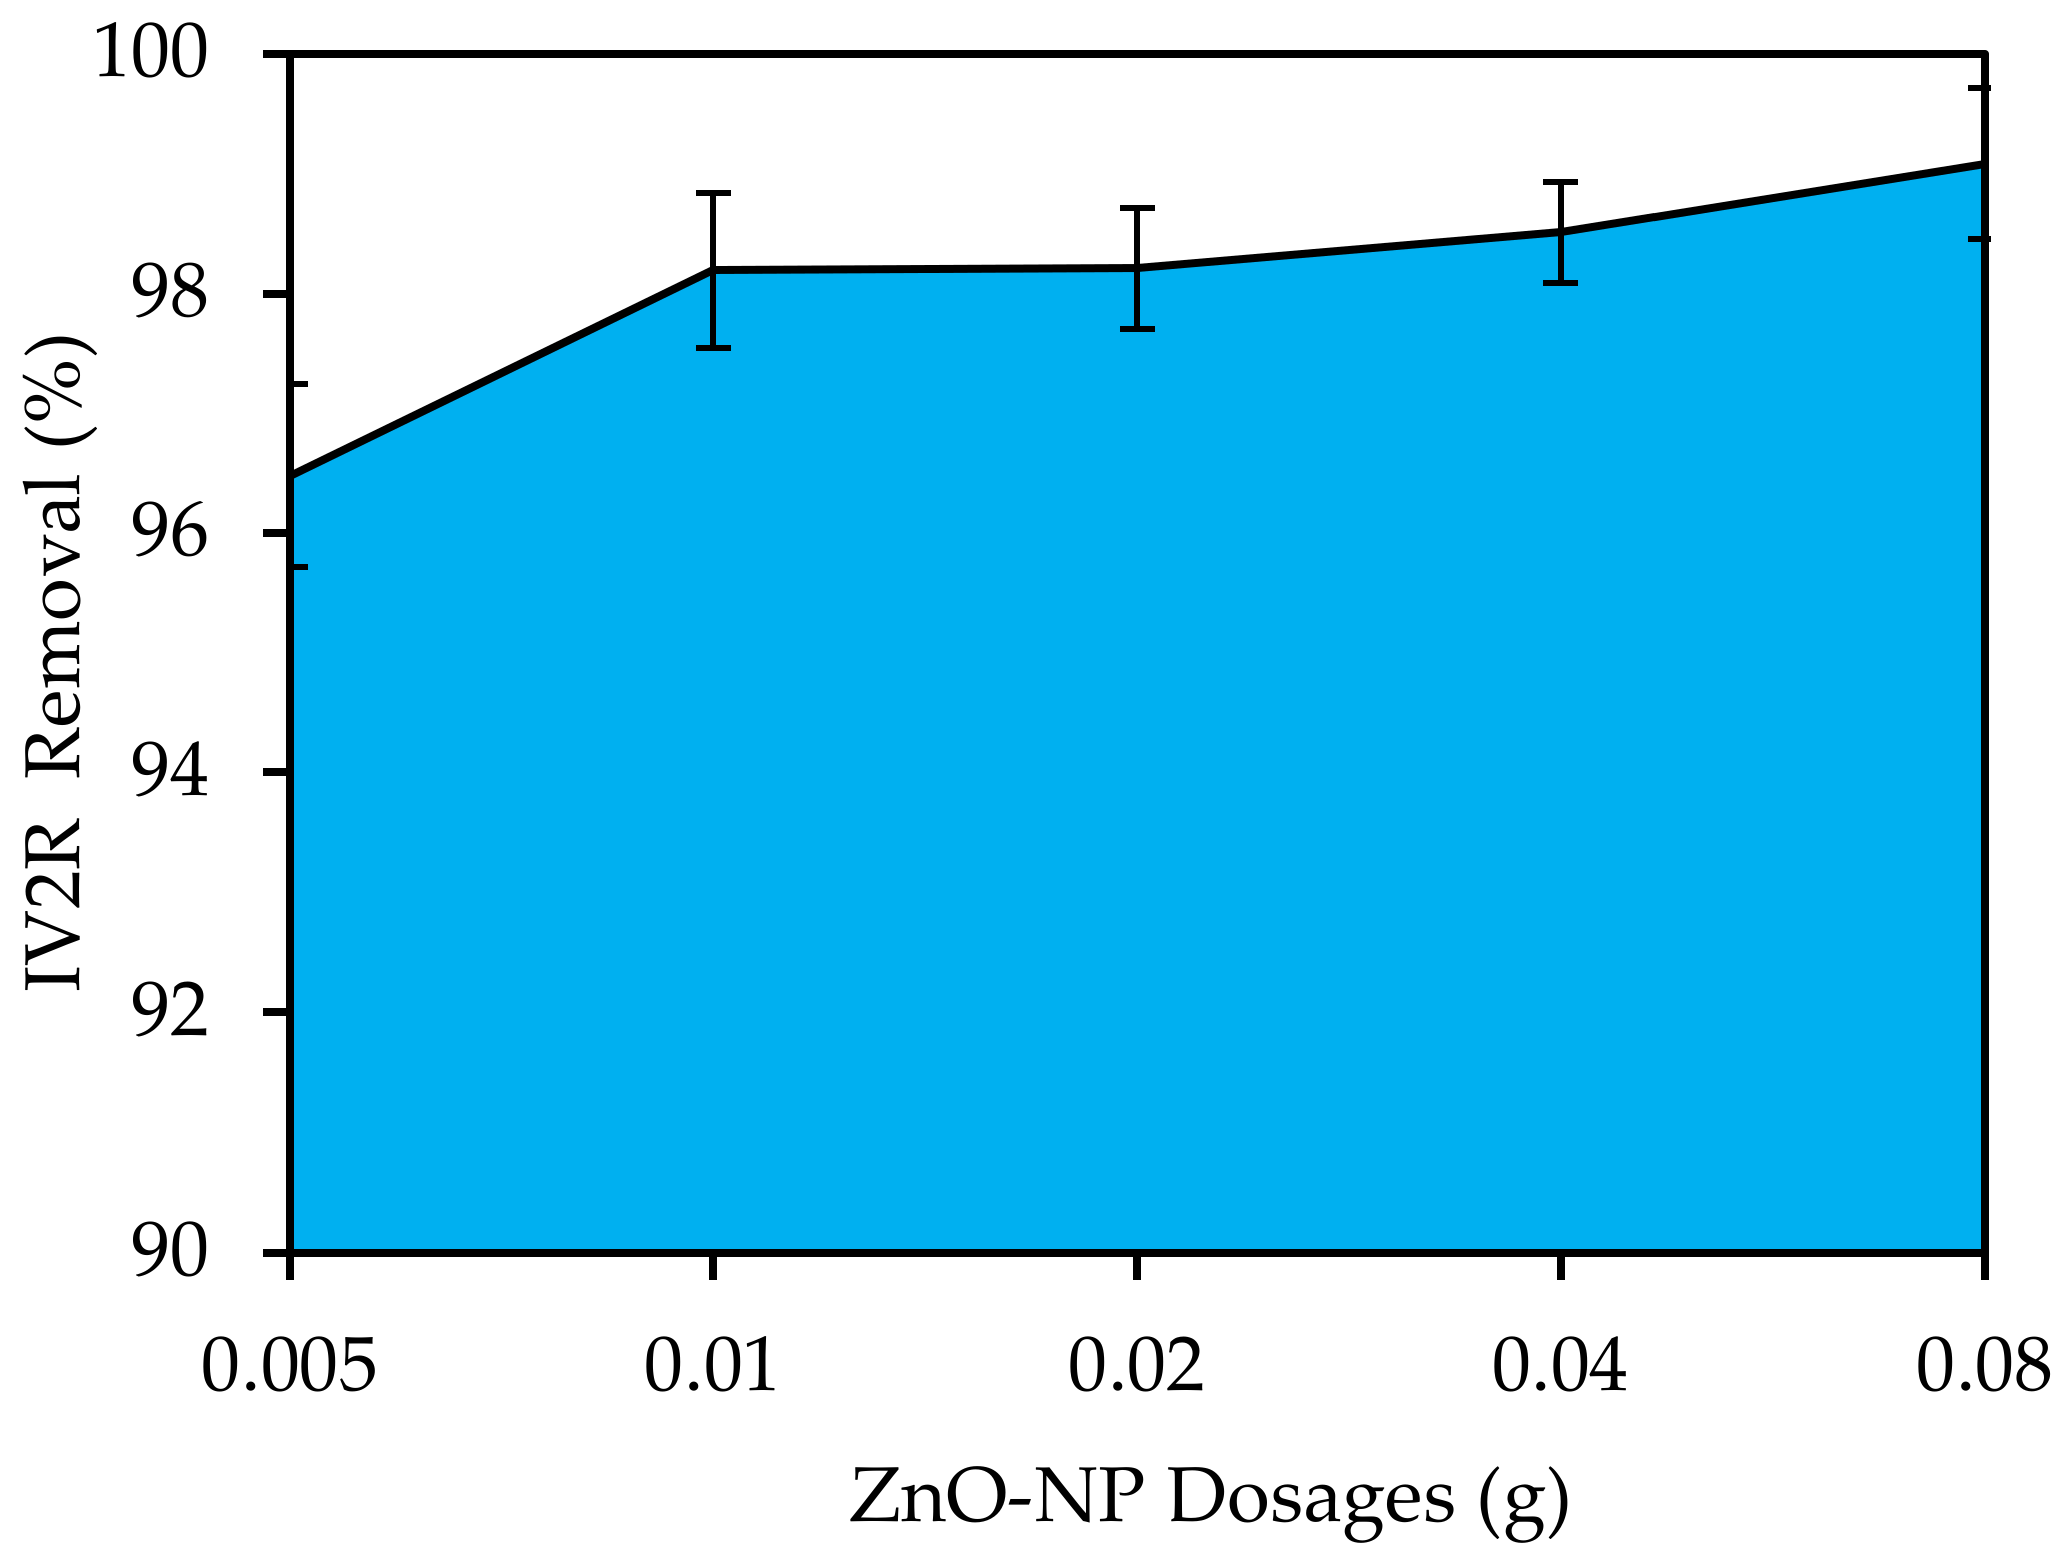
3.4.2. ZnO-NP Dosages
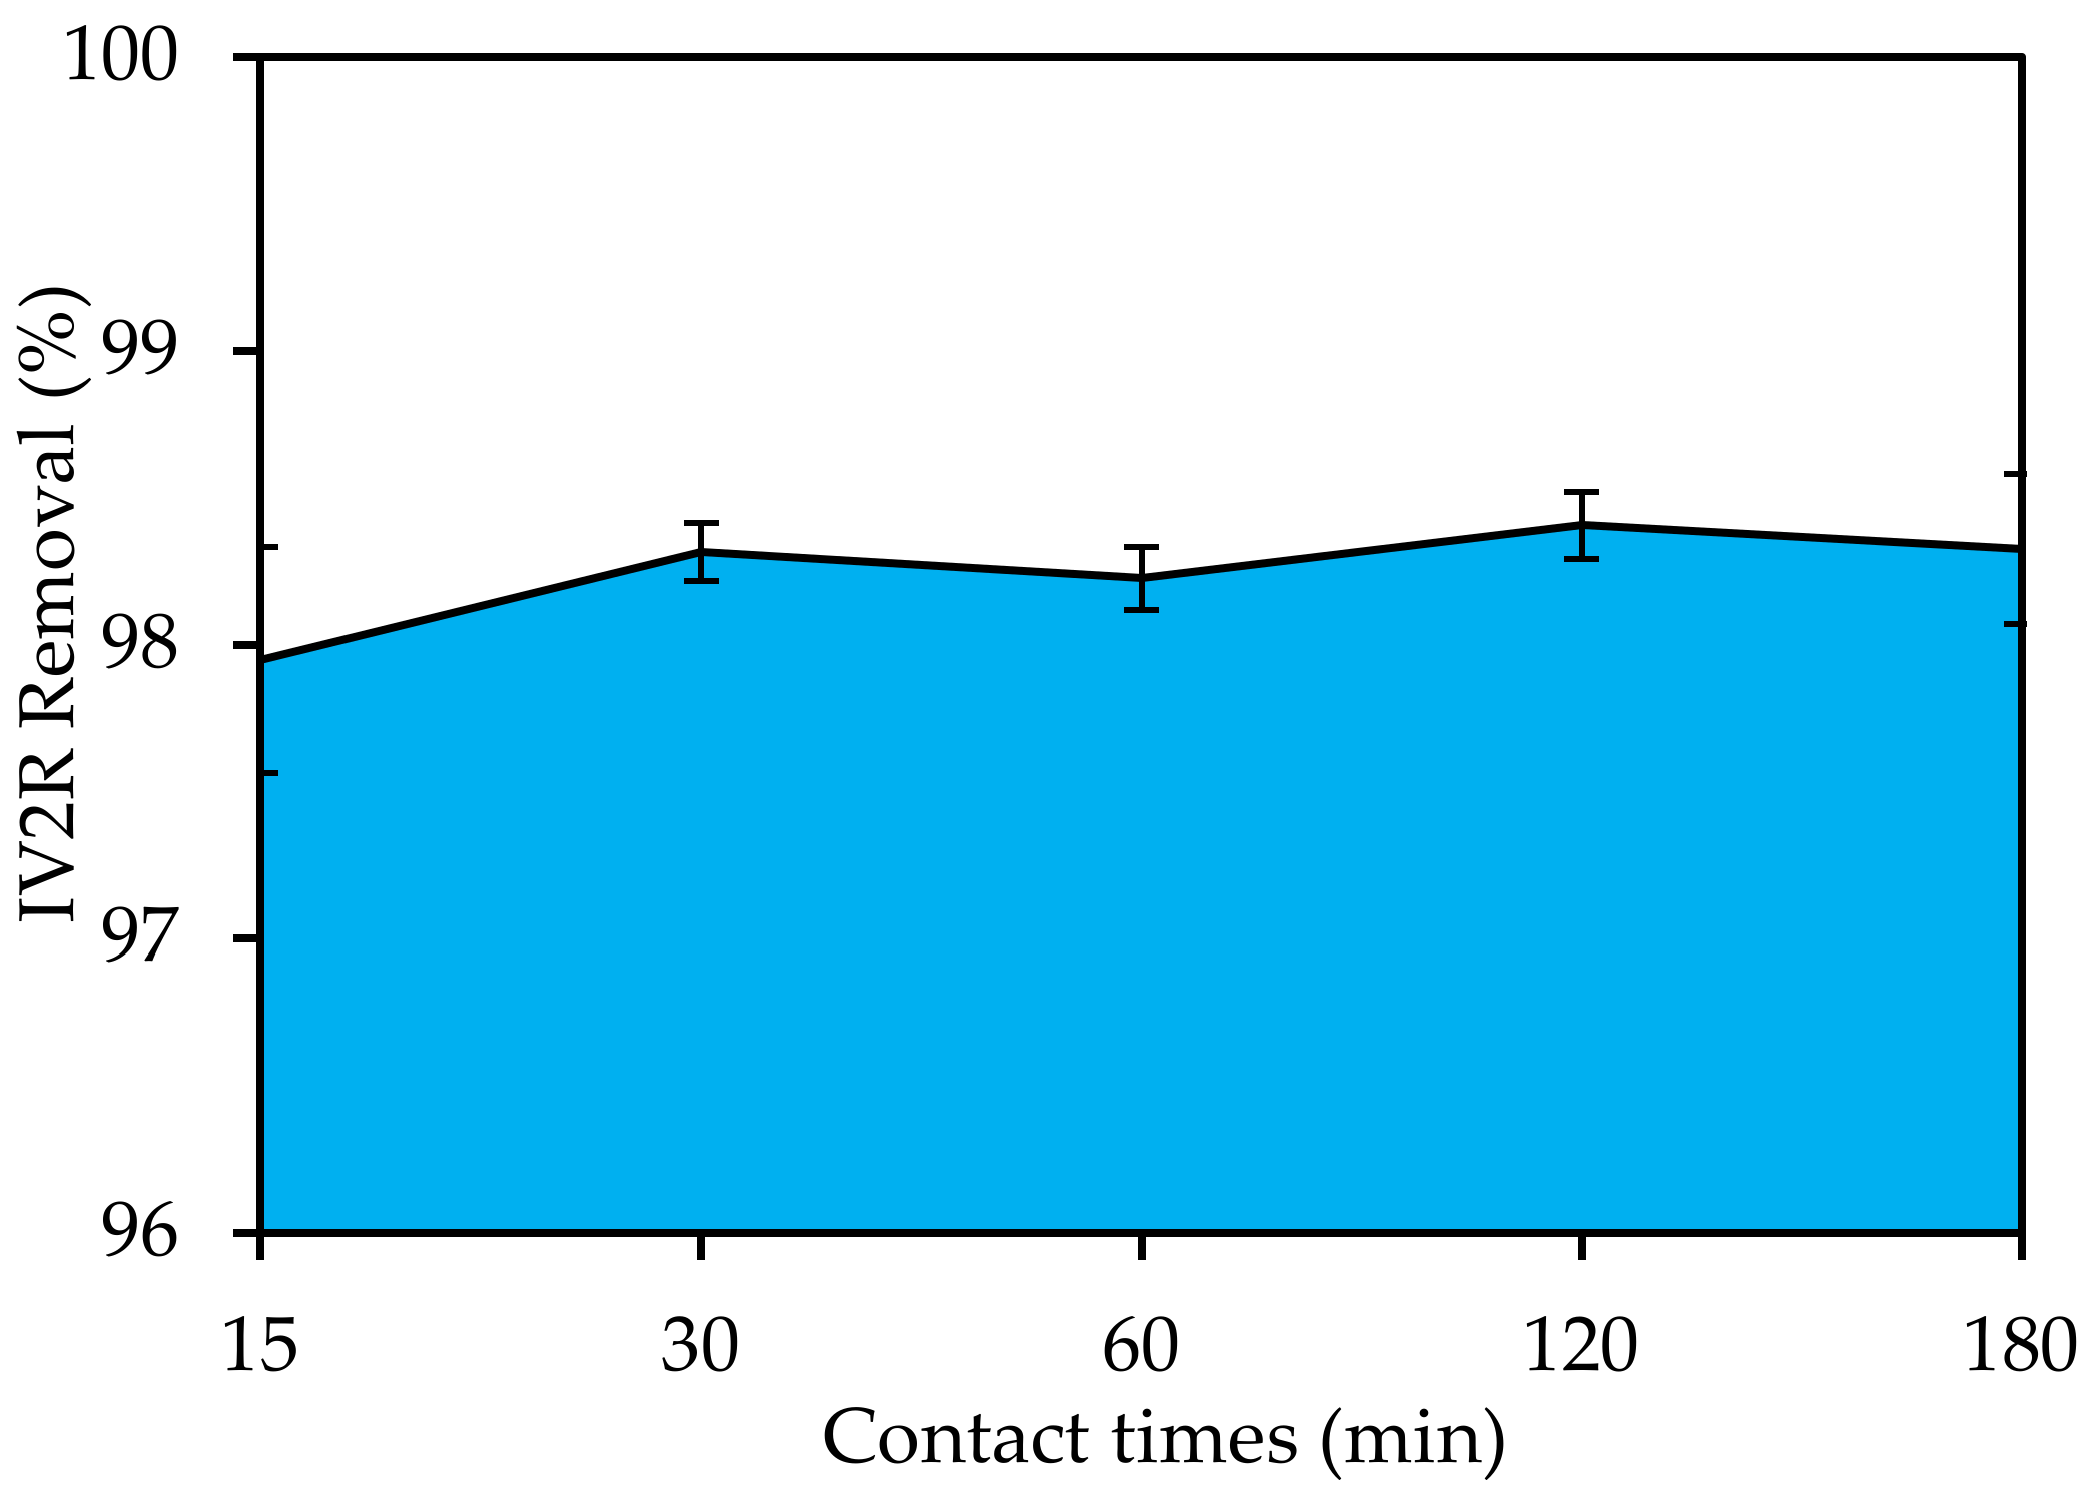
3.4.3. Contact Times
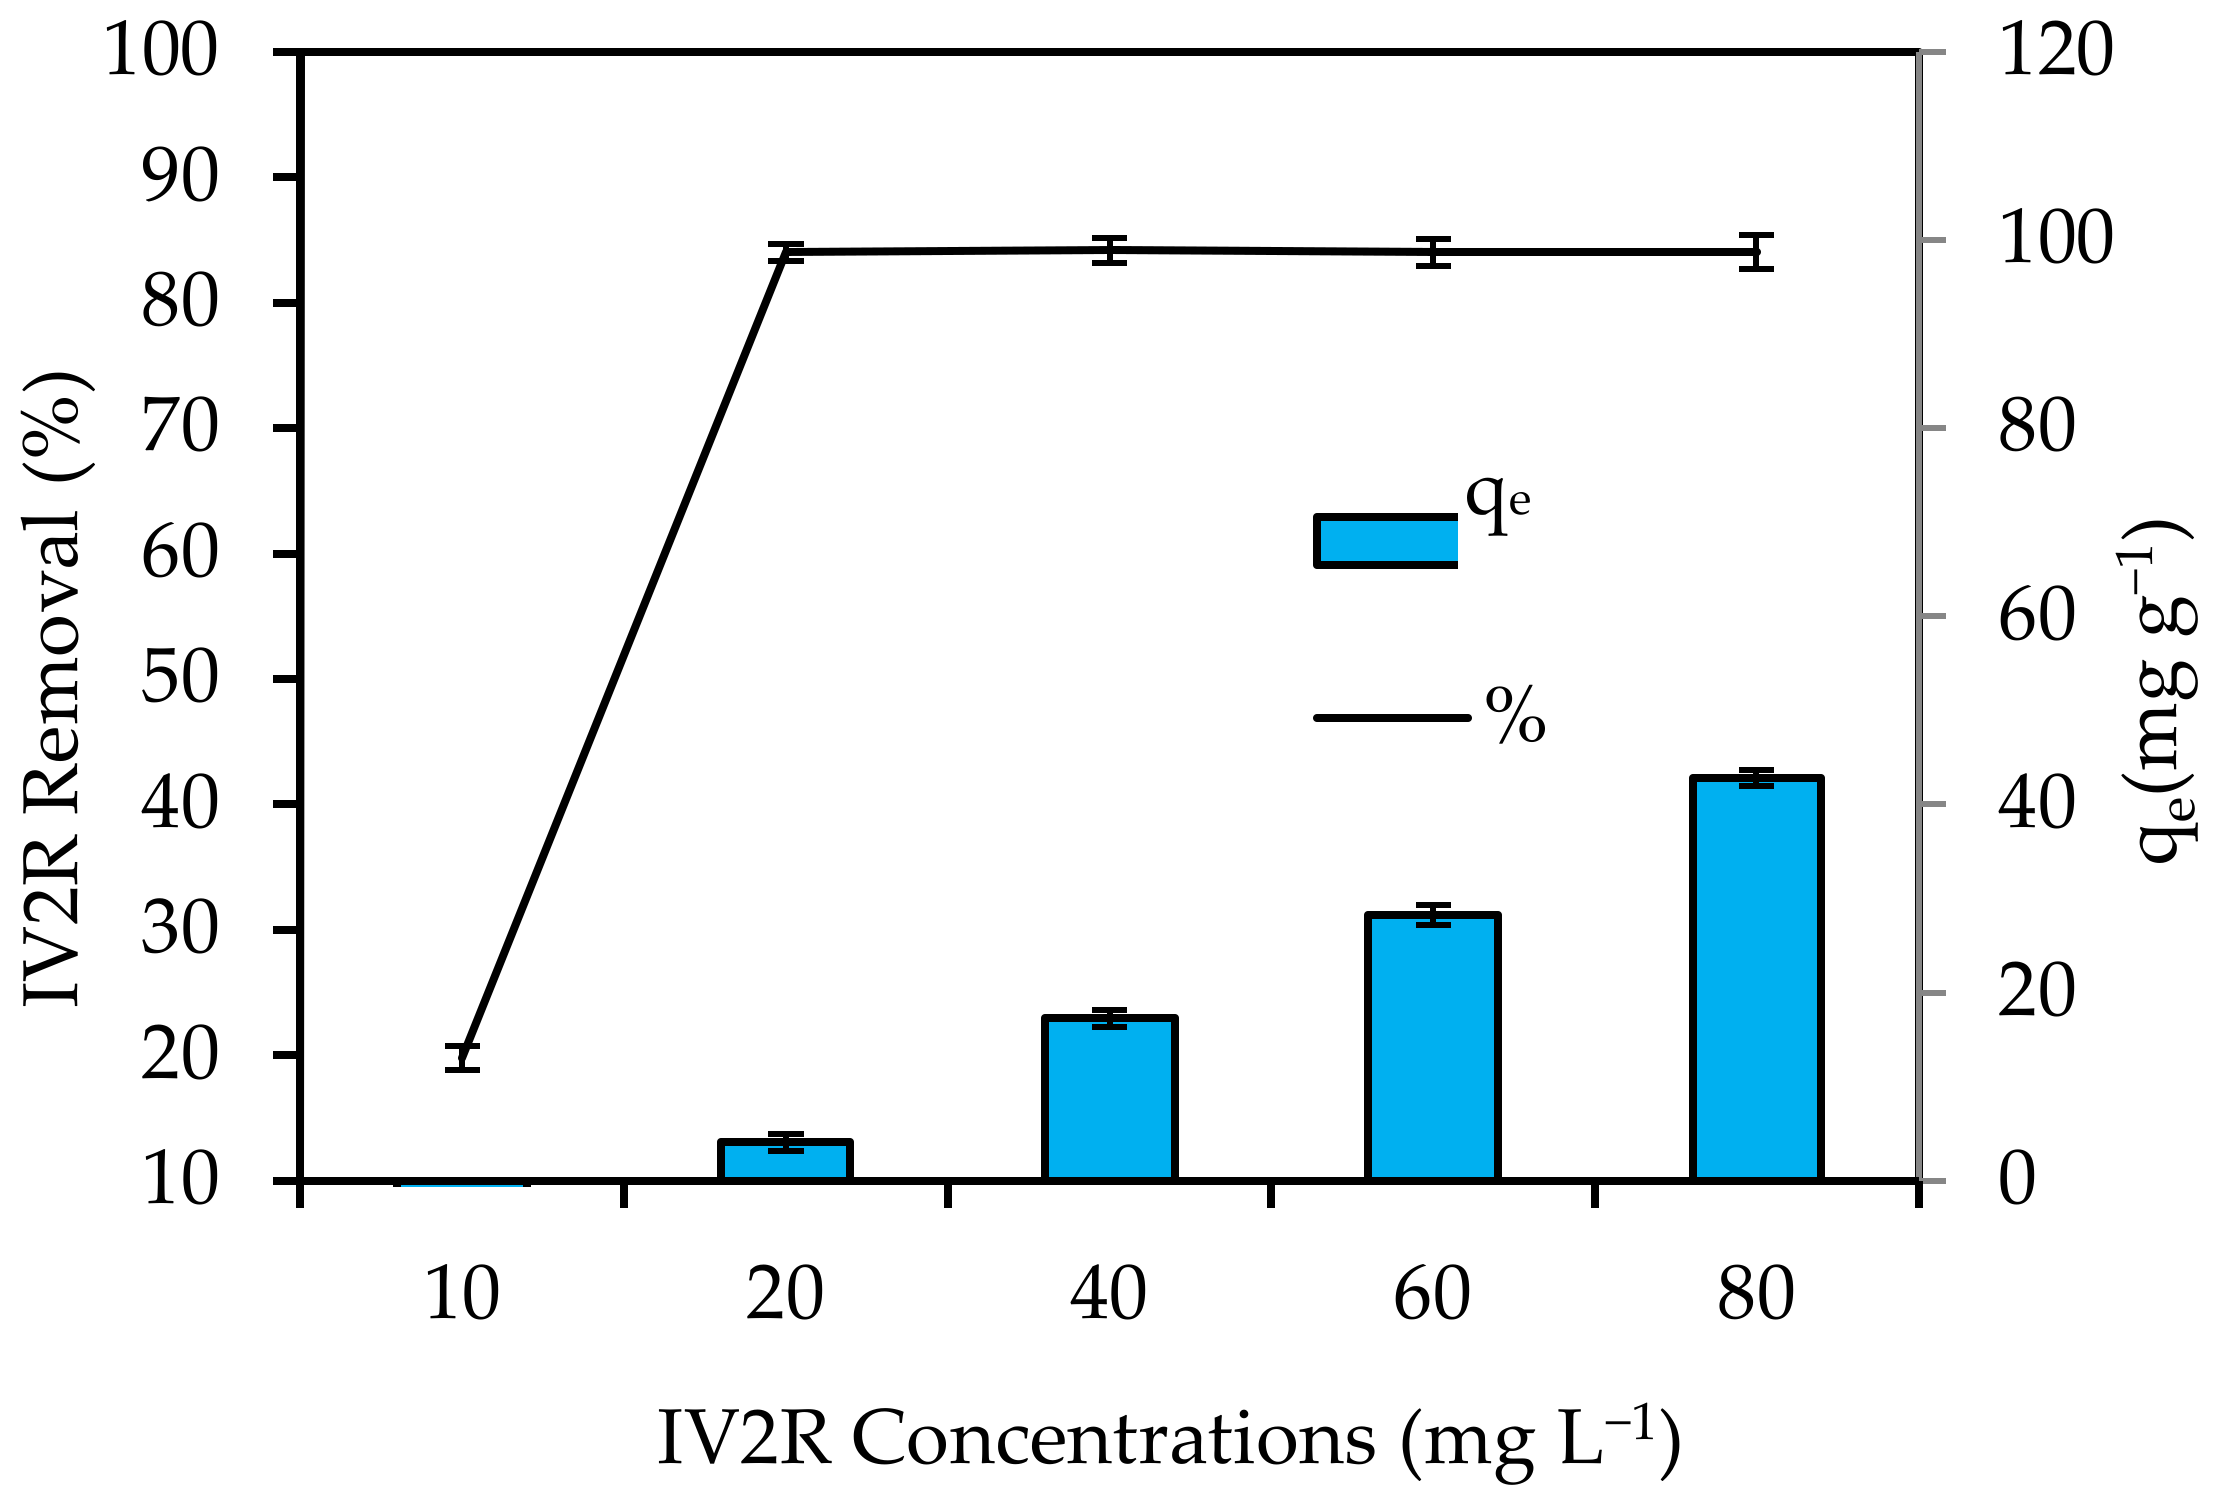
3.4.4. Initial IV2R Concentration
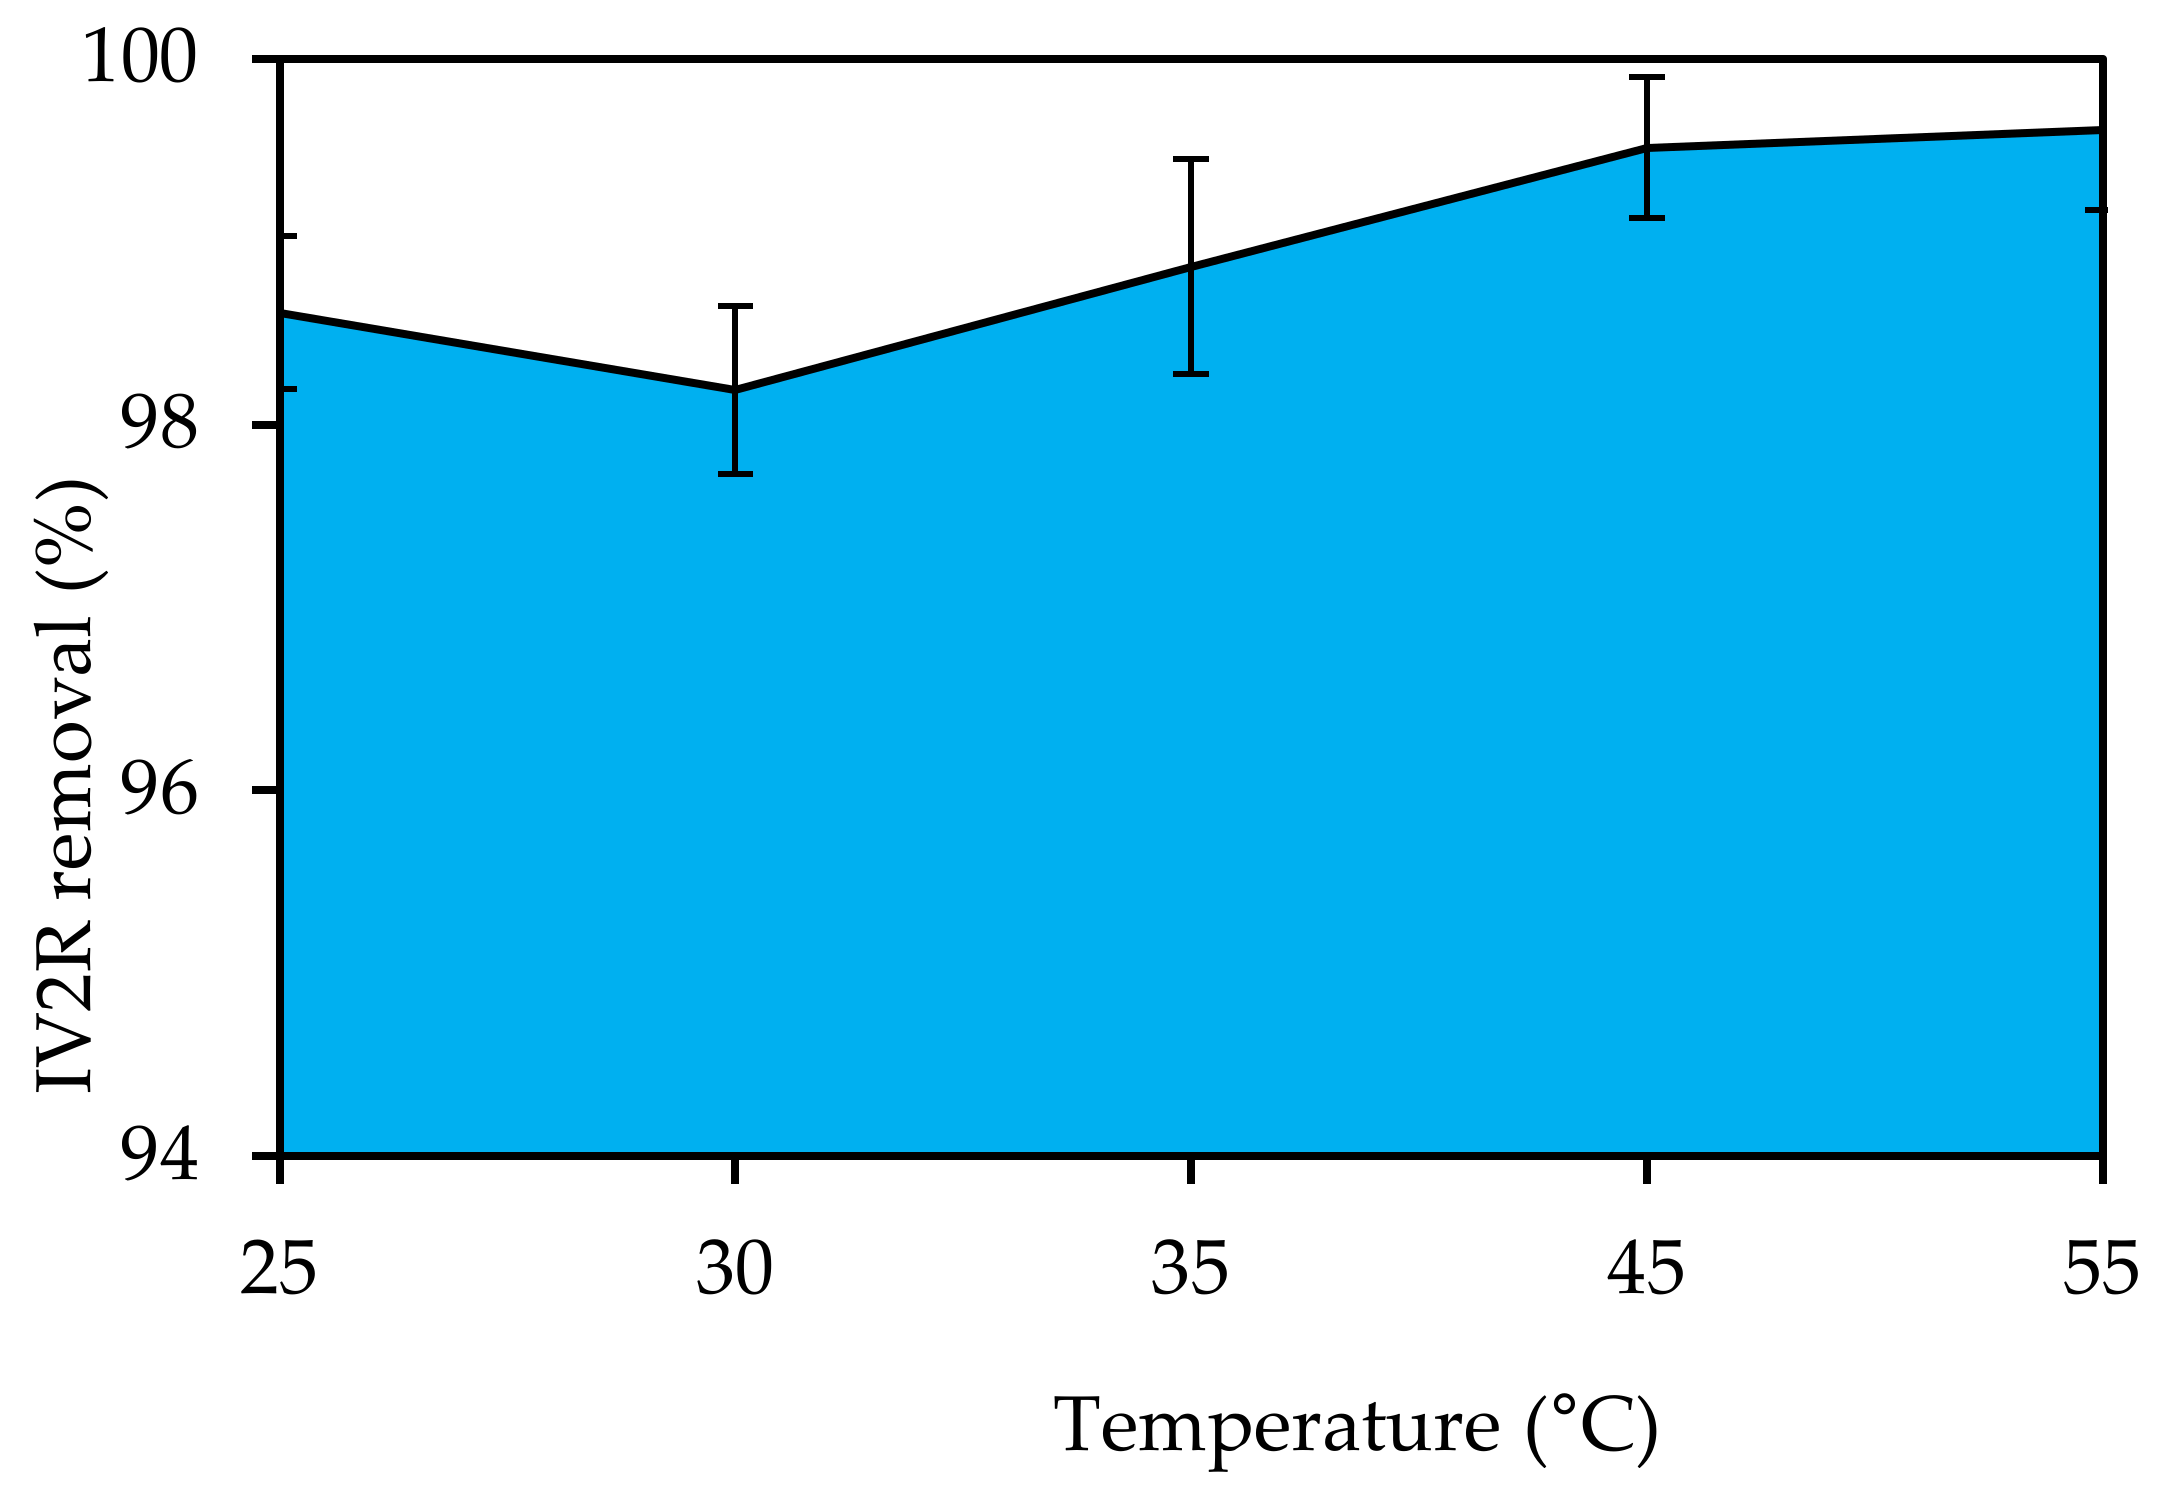
3.4.5. Temperature
3.5. Adsorption Isotherms
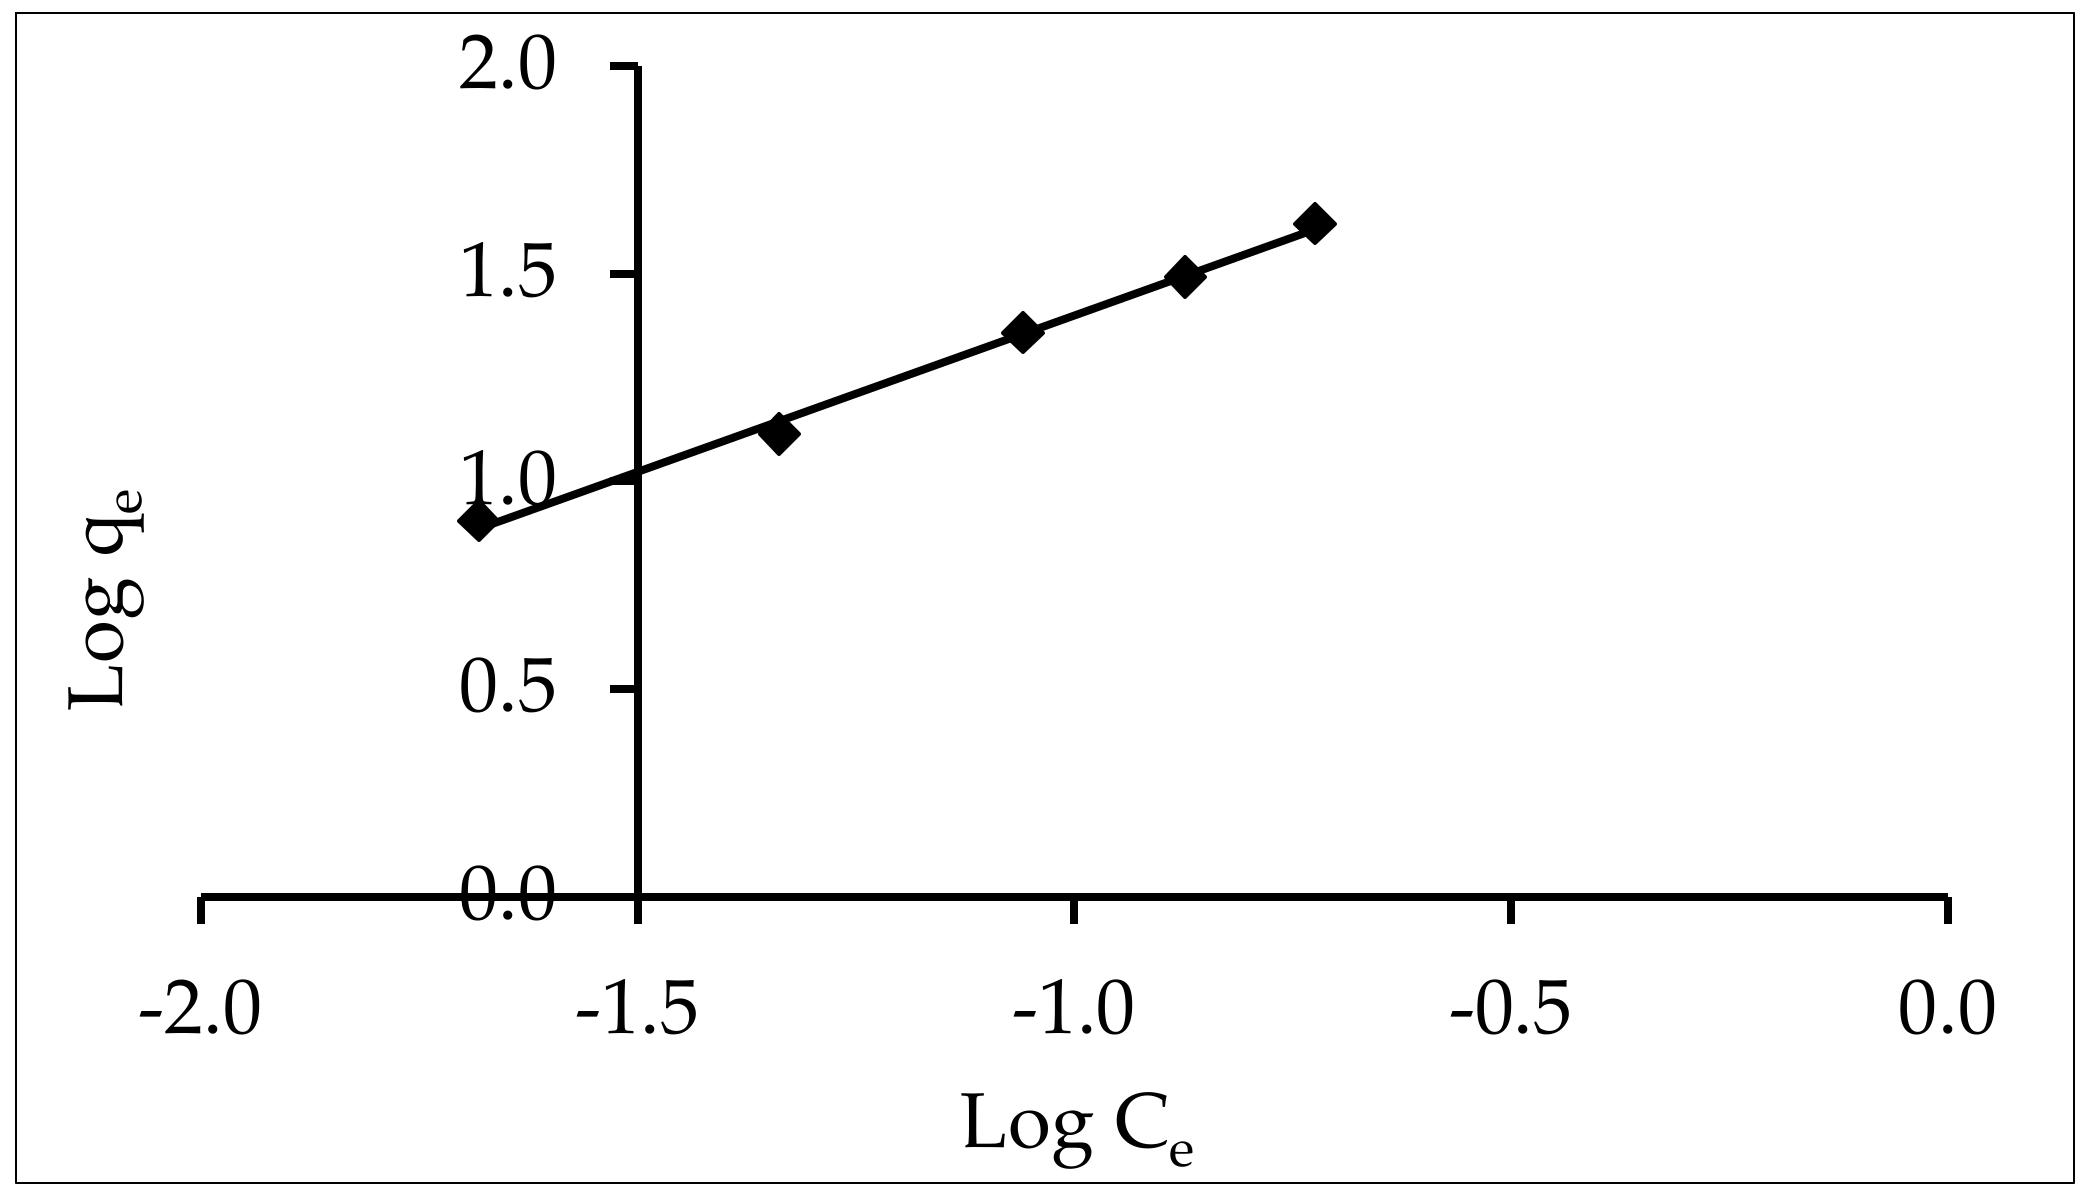
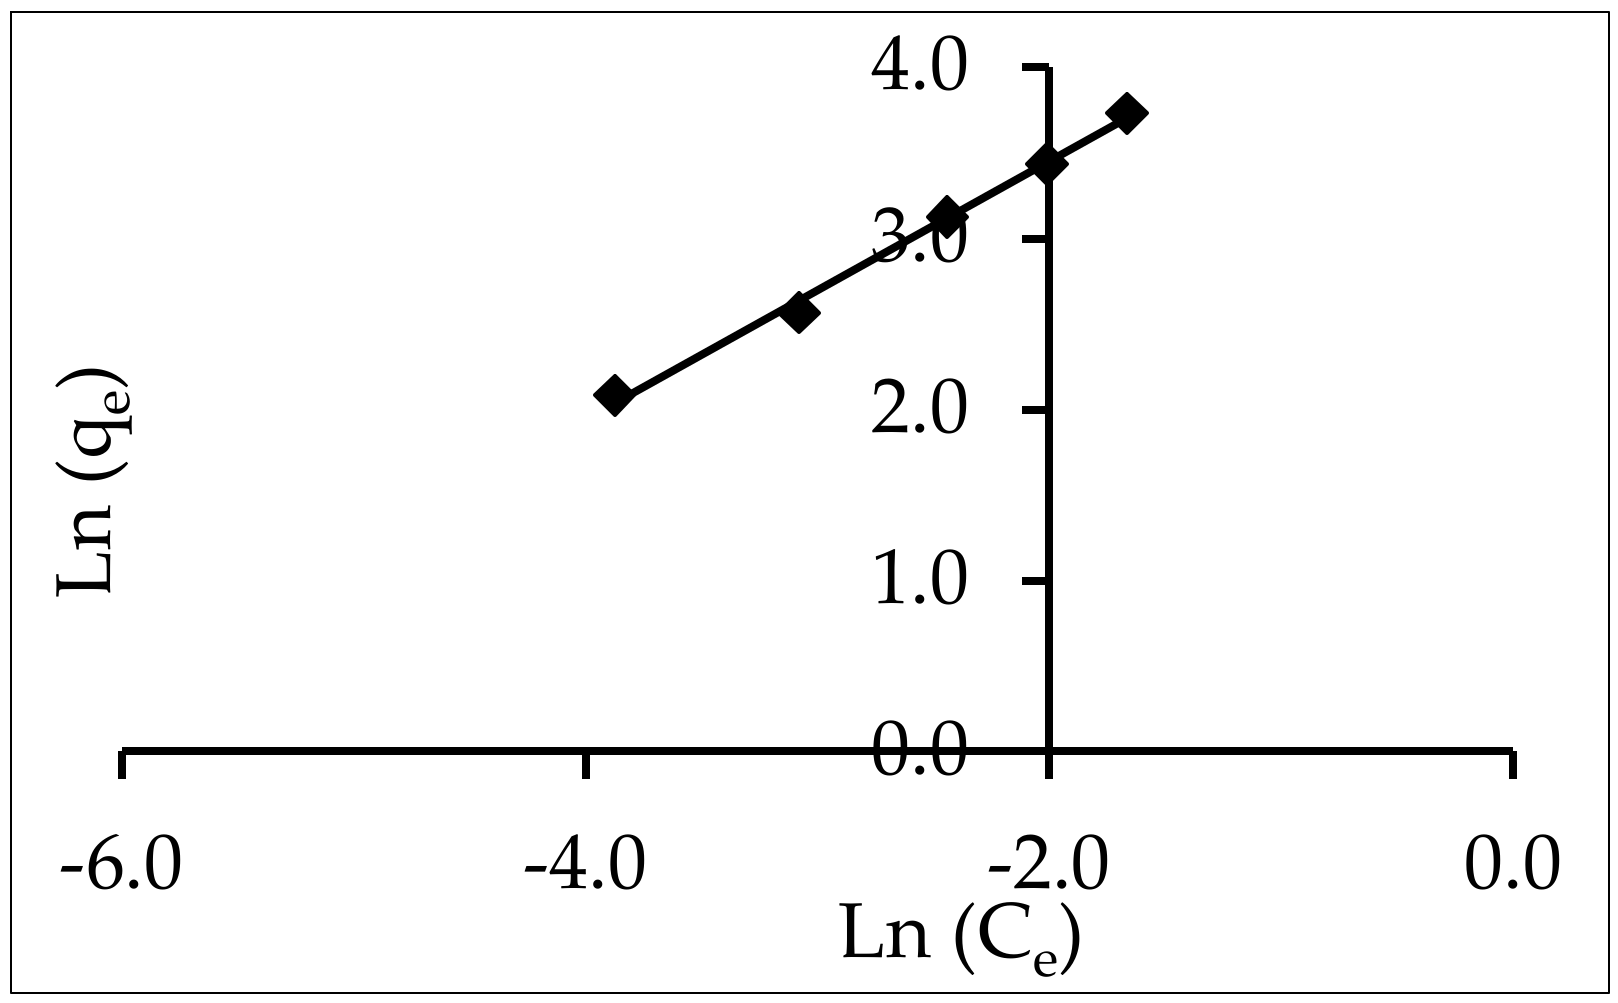
3.5.1. Freundlich Isotherm
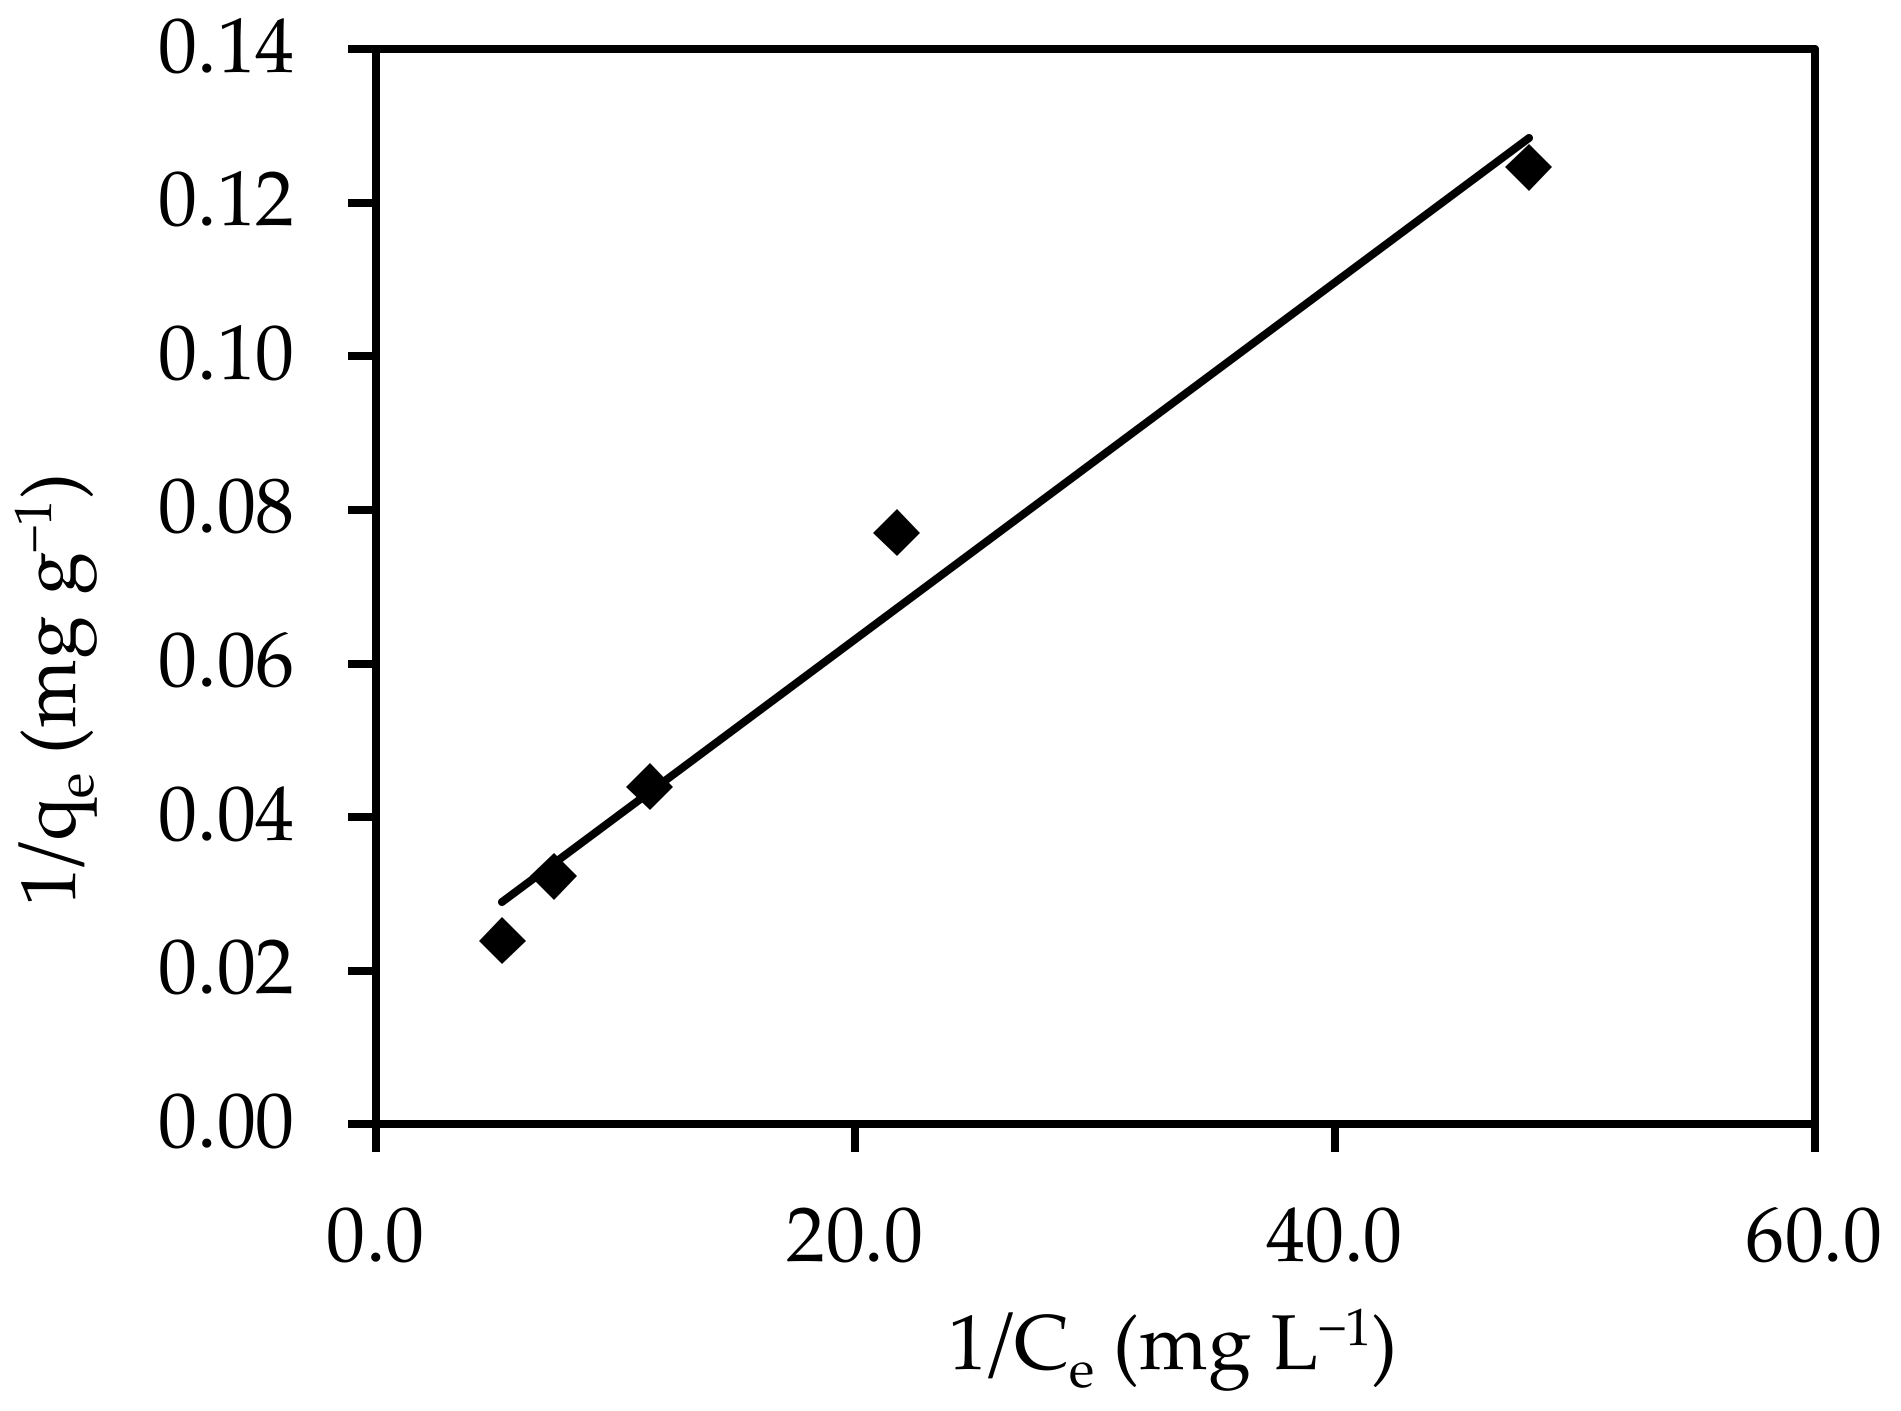
3.5.2. Langmuir
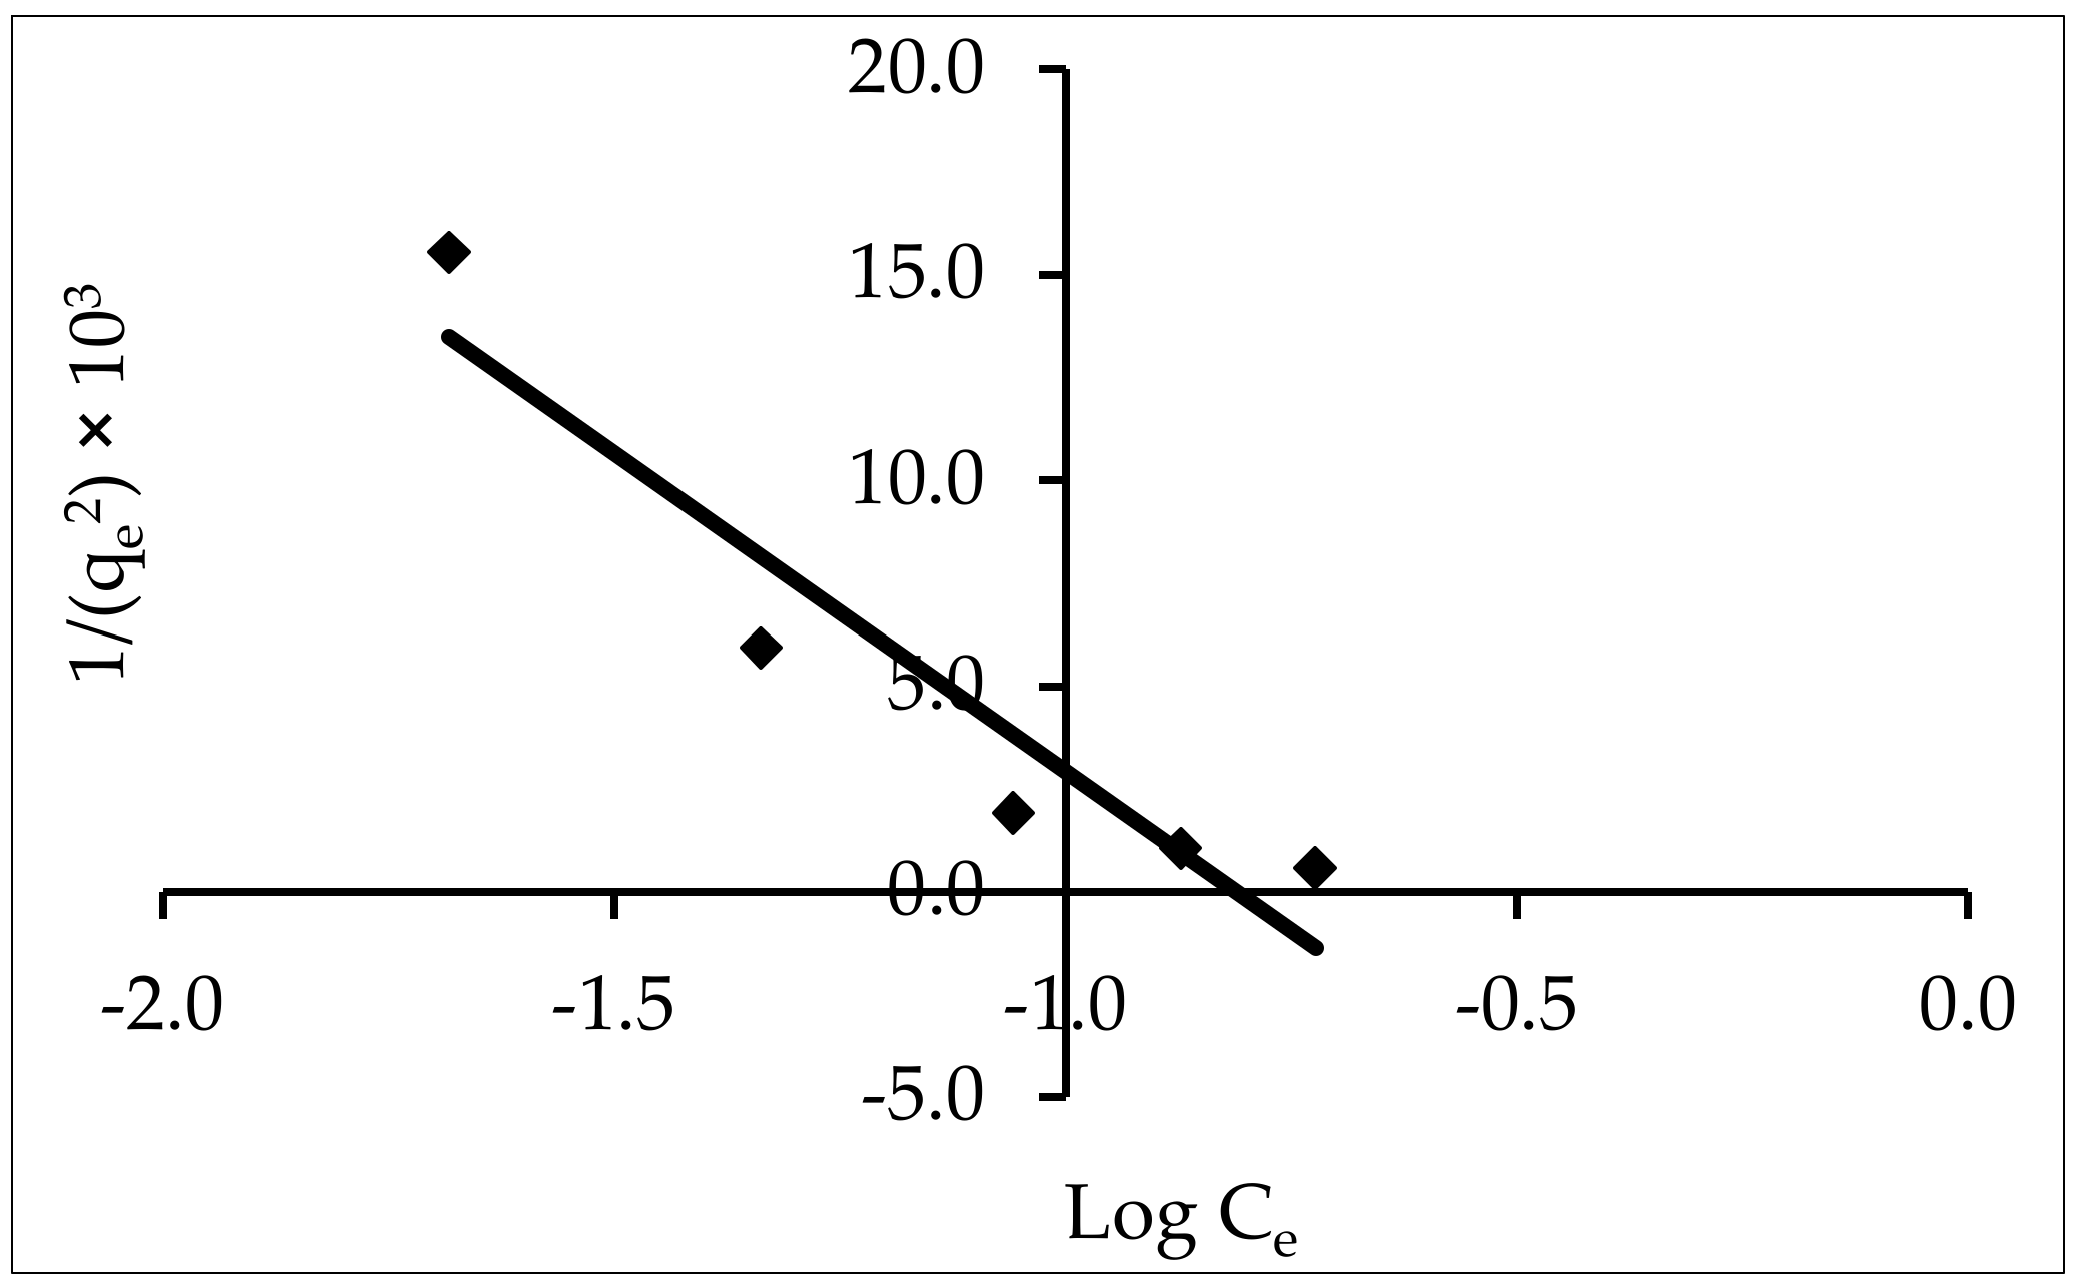
3.5.3. Harkins–Jura
3.5.4. Halsay
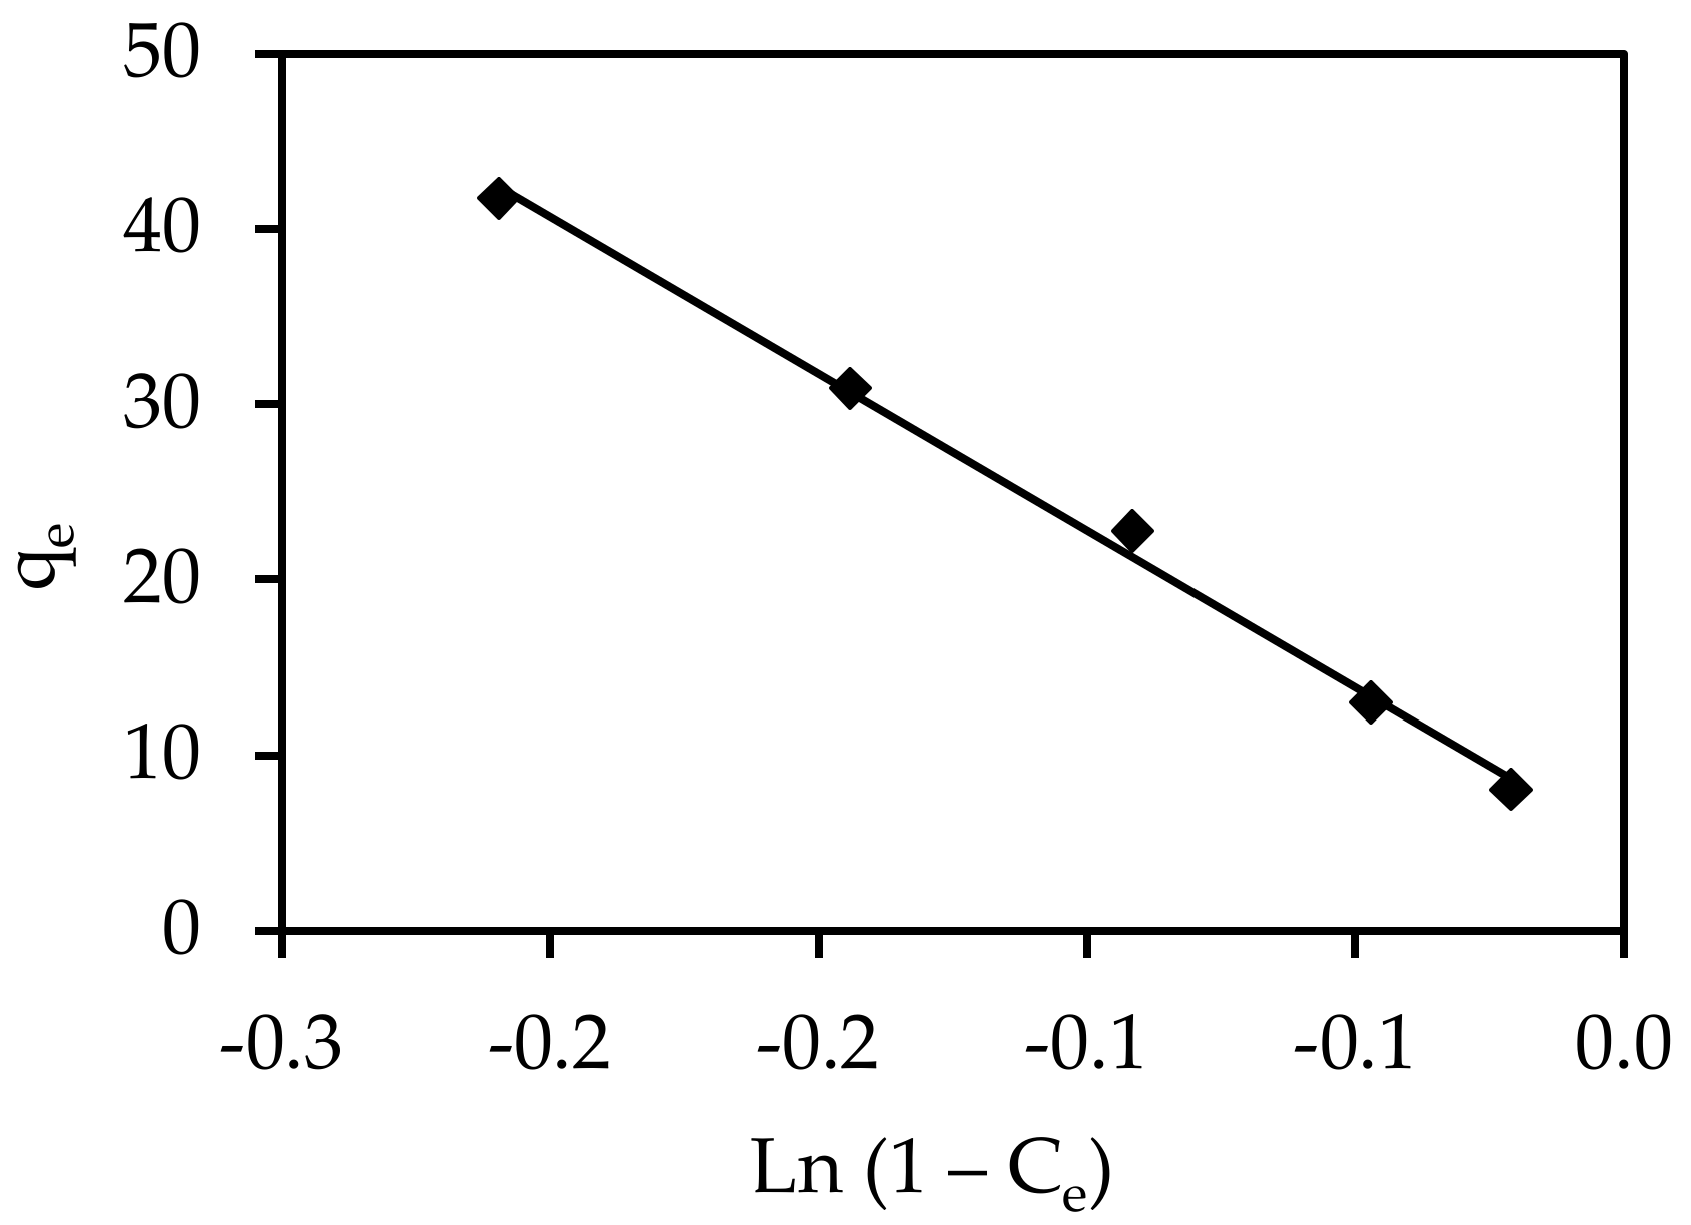
3.5.5. Smith
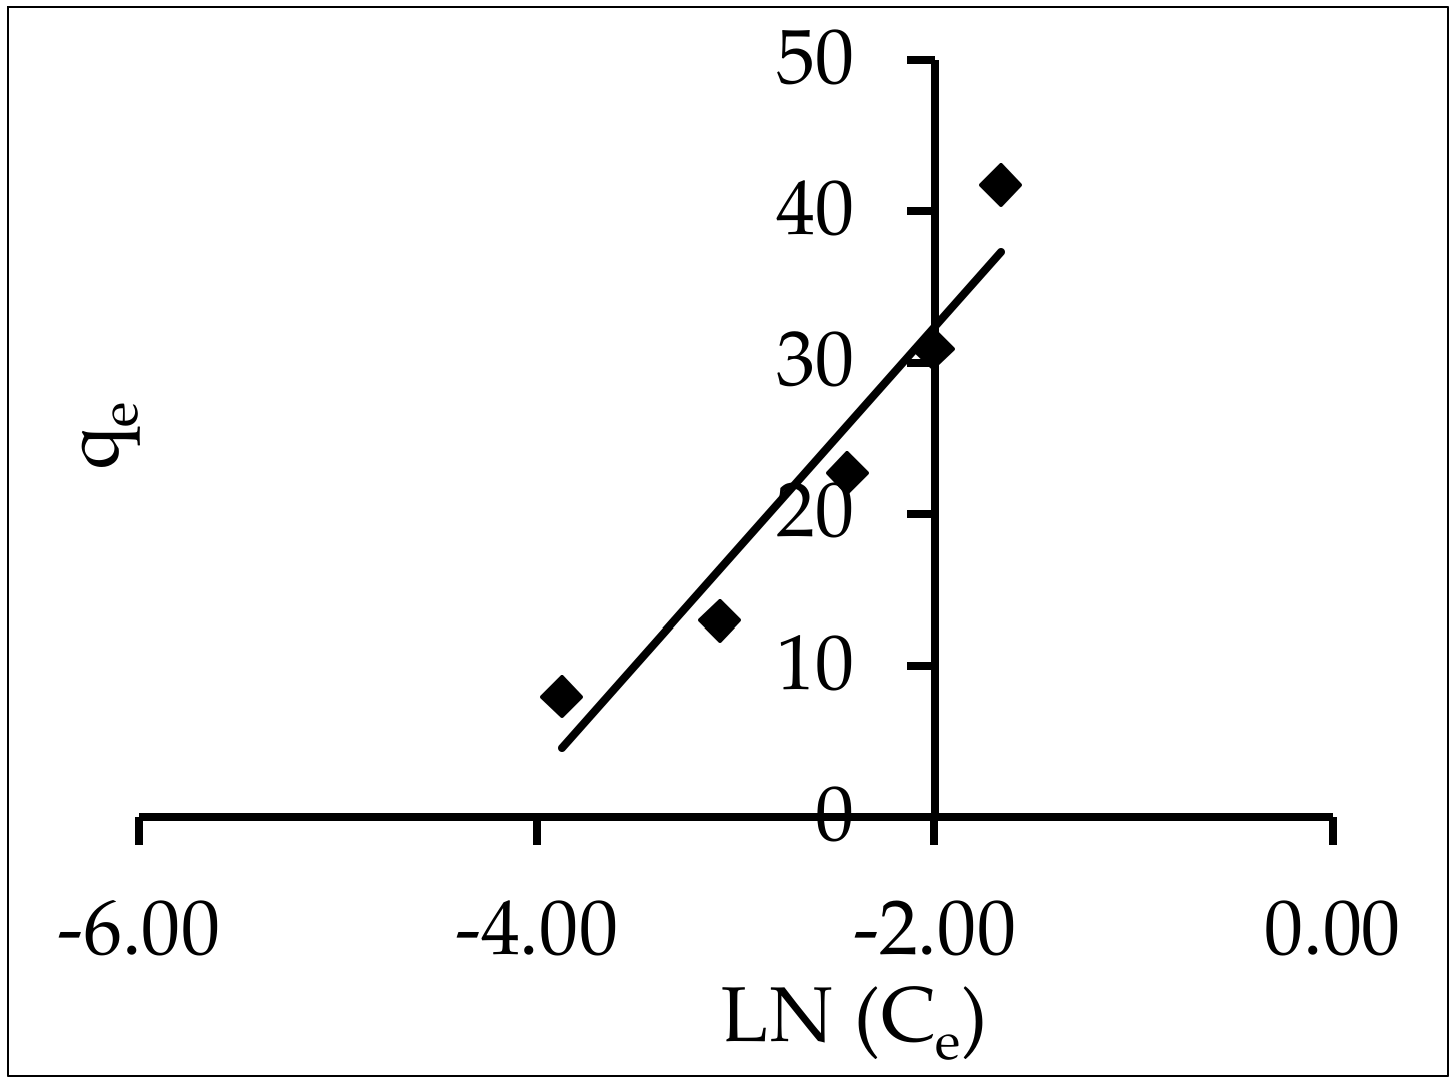
3.5.6. Tempkin
3.6. Models of Sorption Kinetics
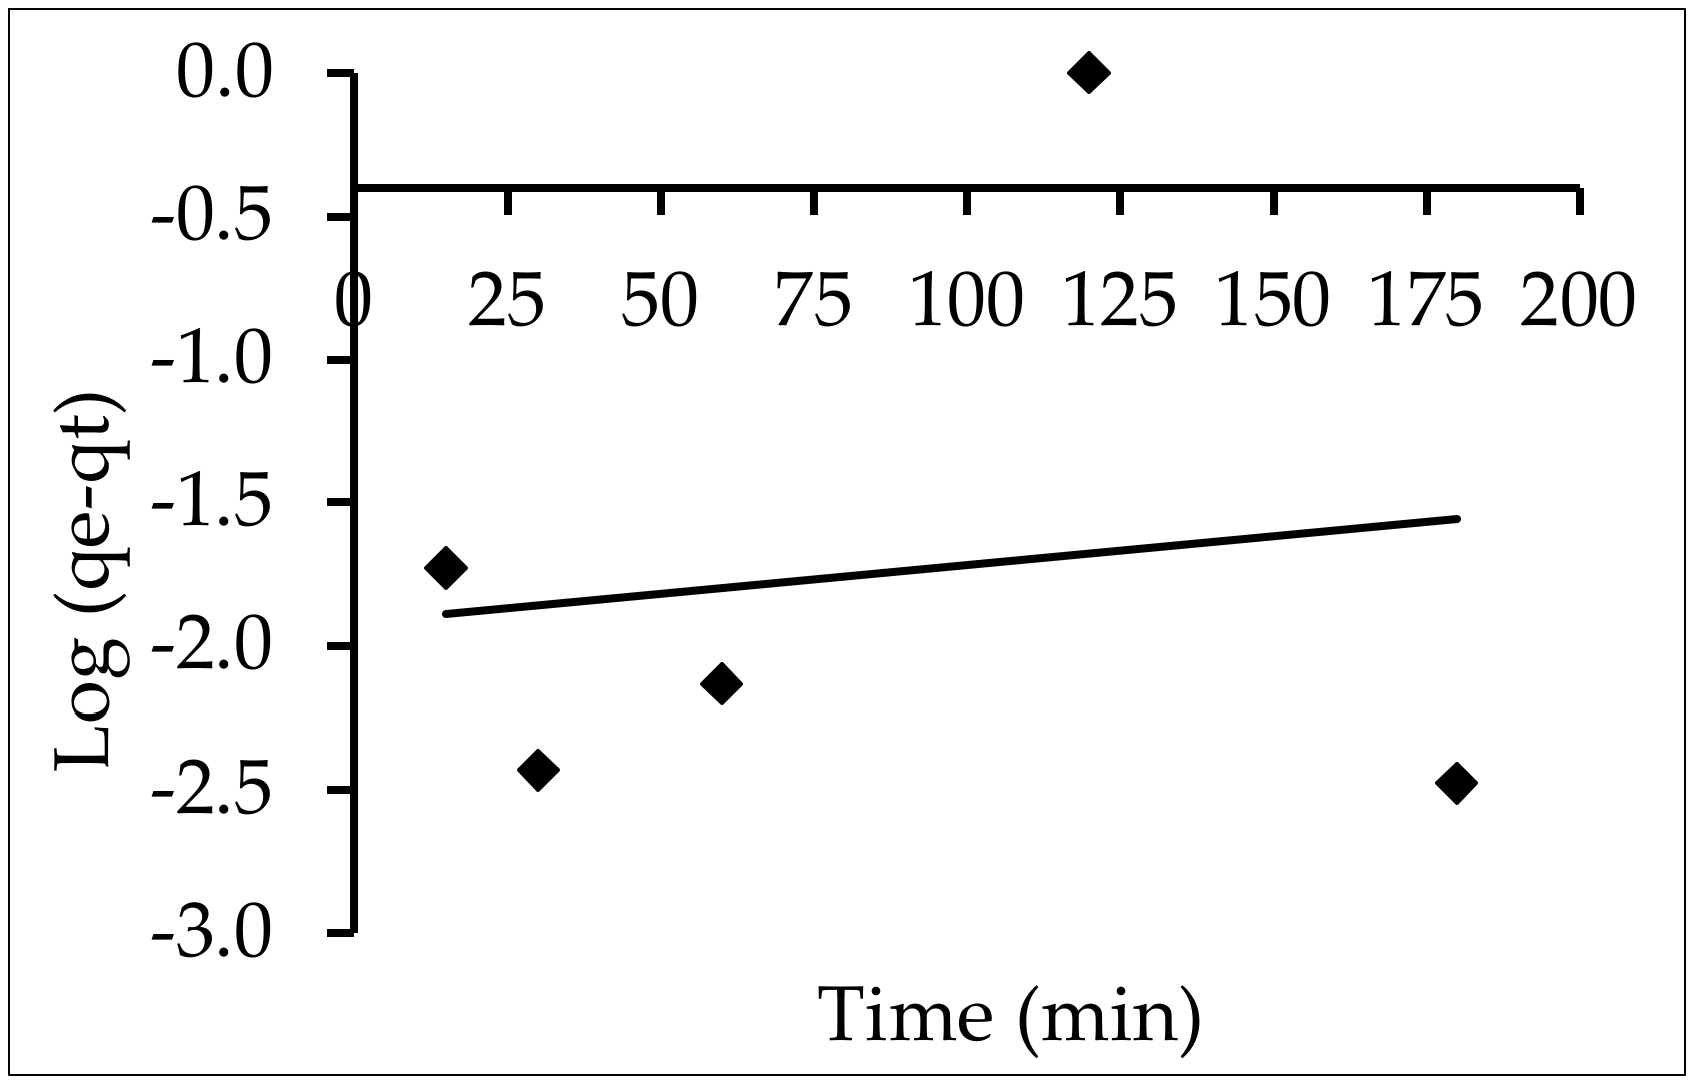
3.6.1. Pseudo-First-Order Model
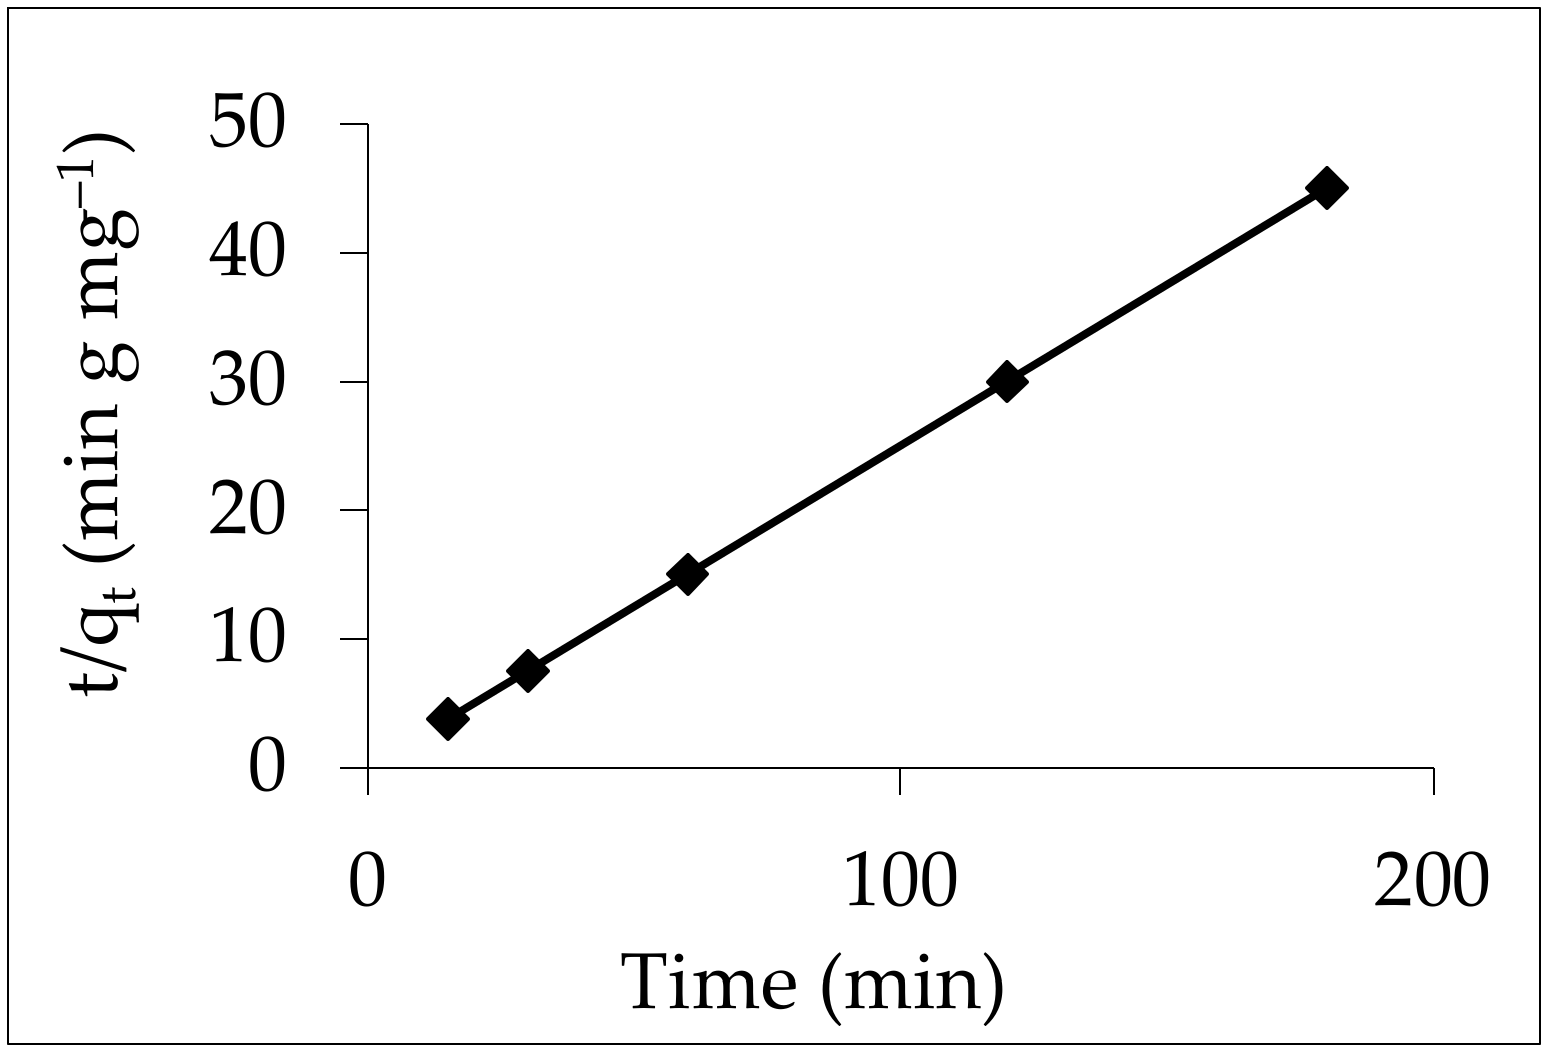
3.6.2. Pseudo-Second-Order Model
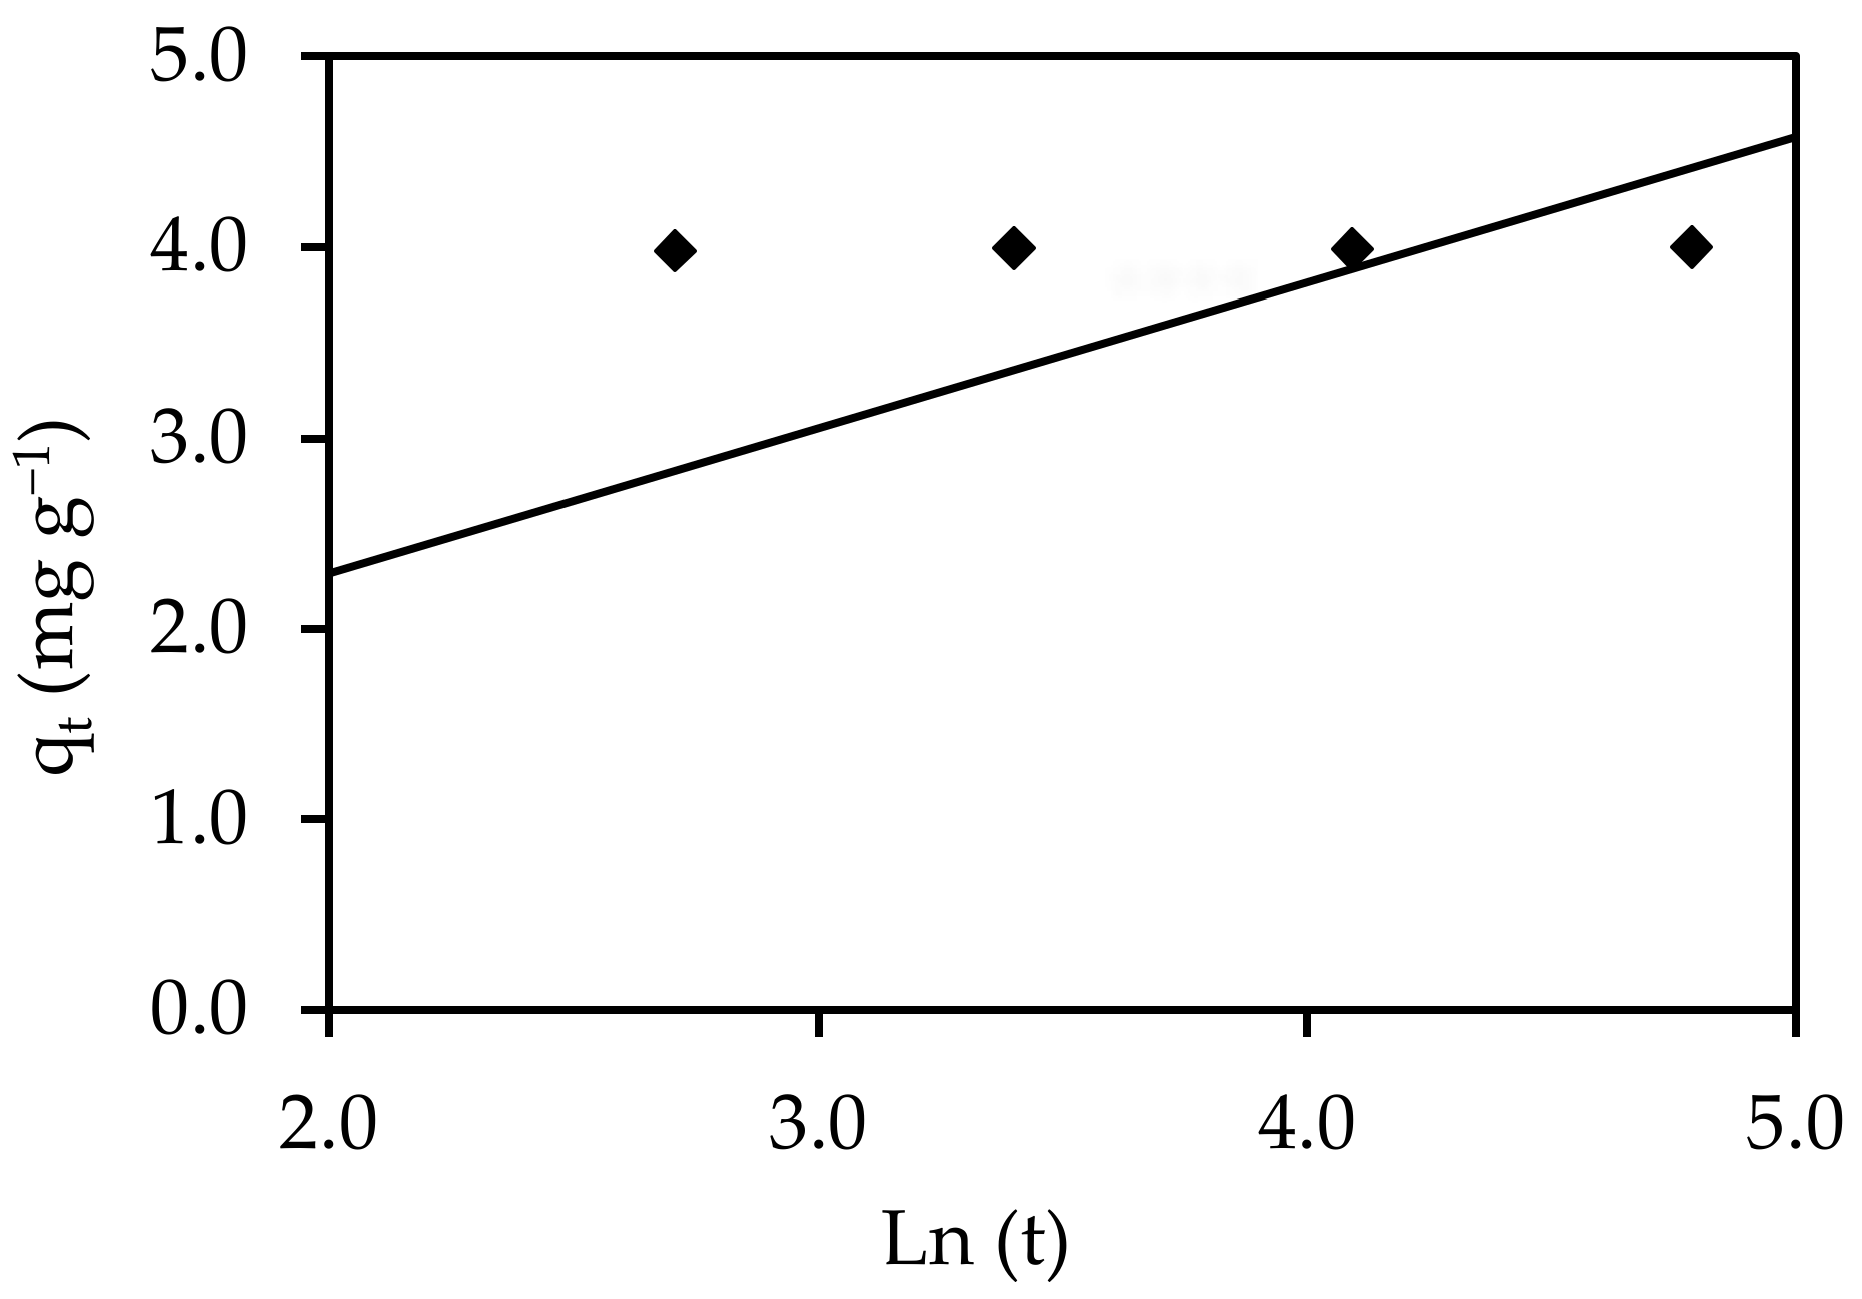
3.6.3. Model of Interparticle Diffusion
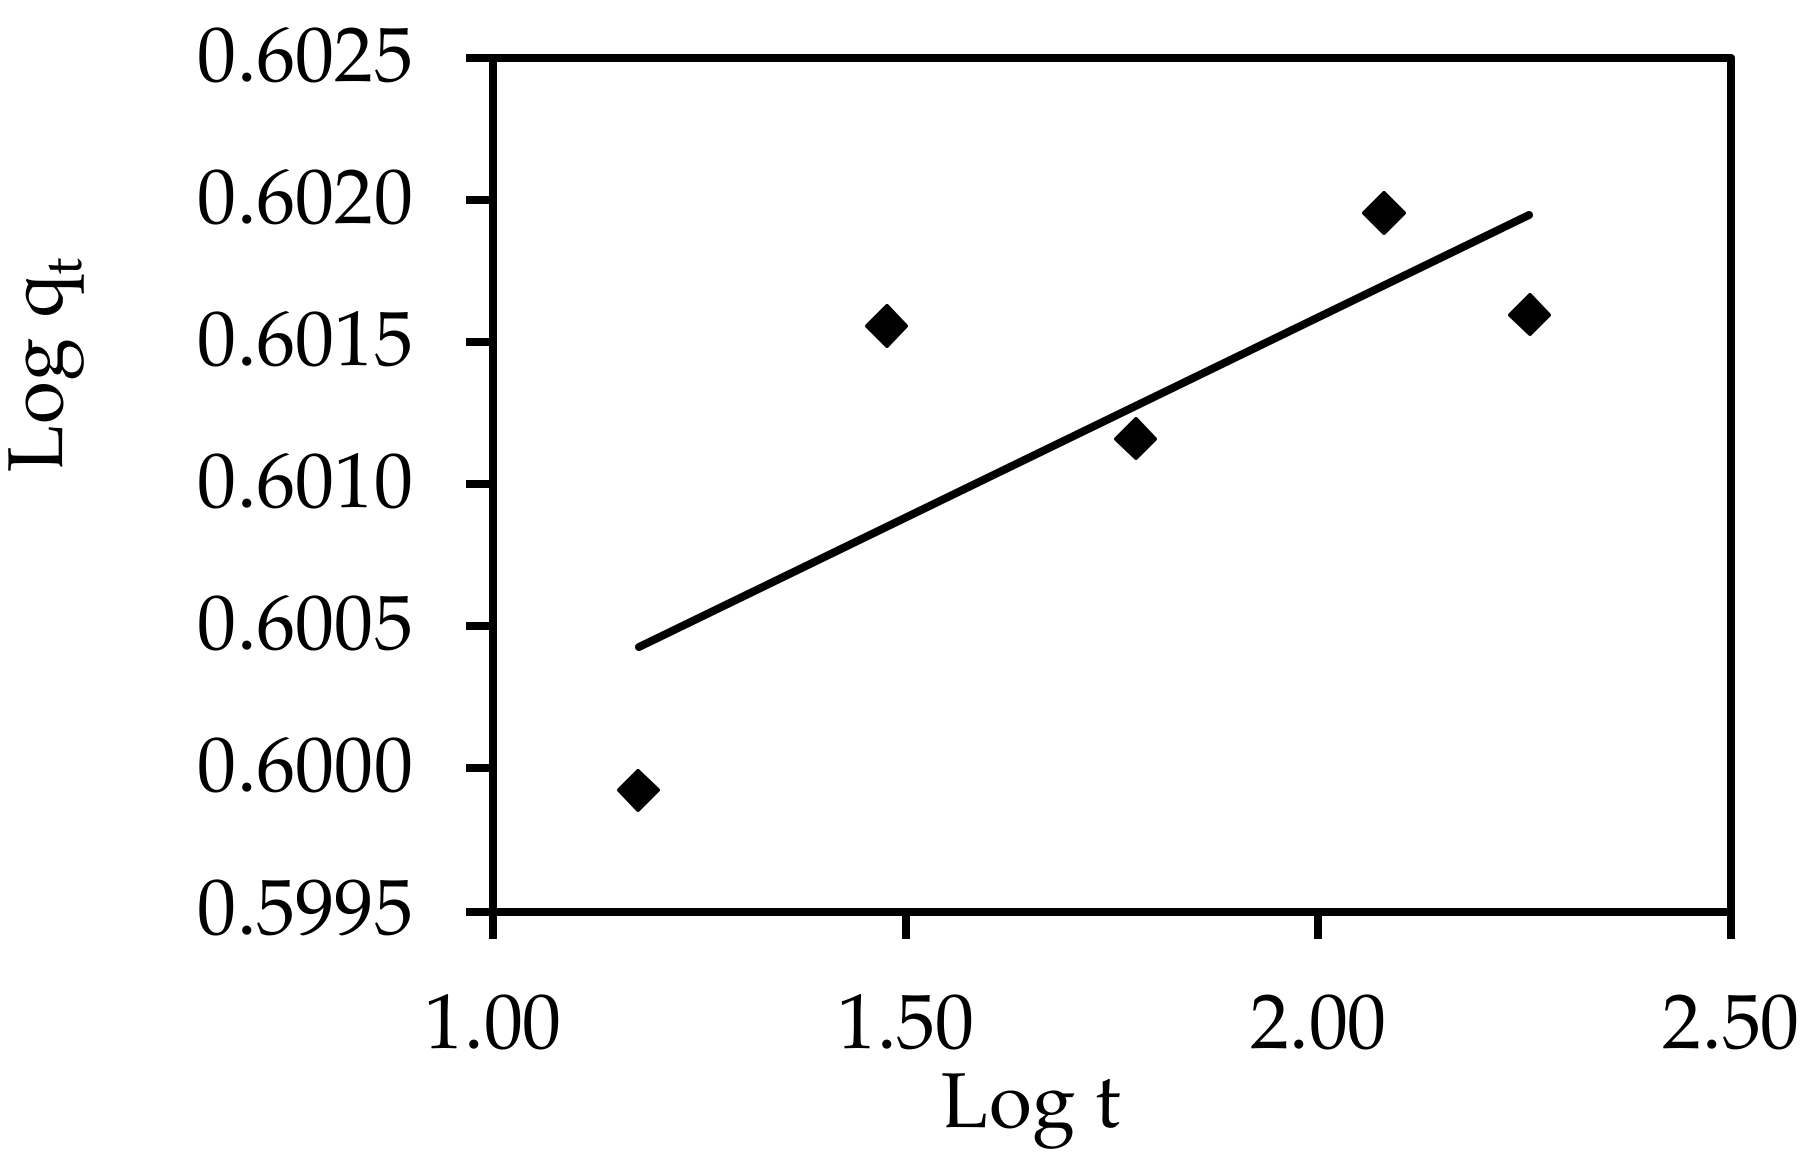
3.6.4. Elovich Model
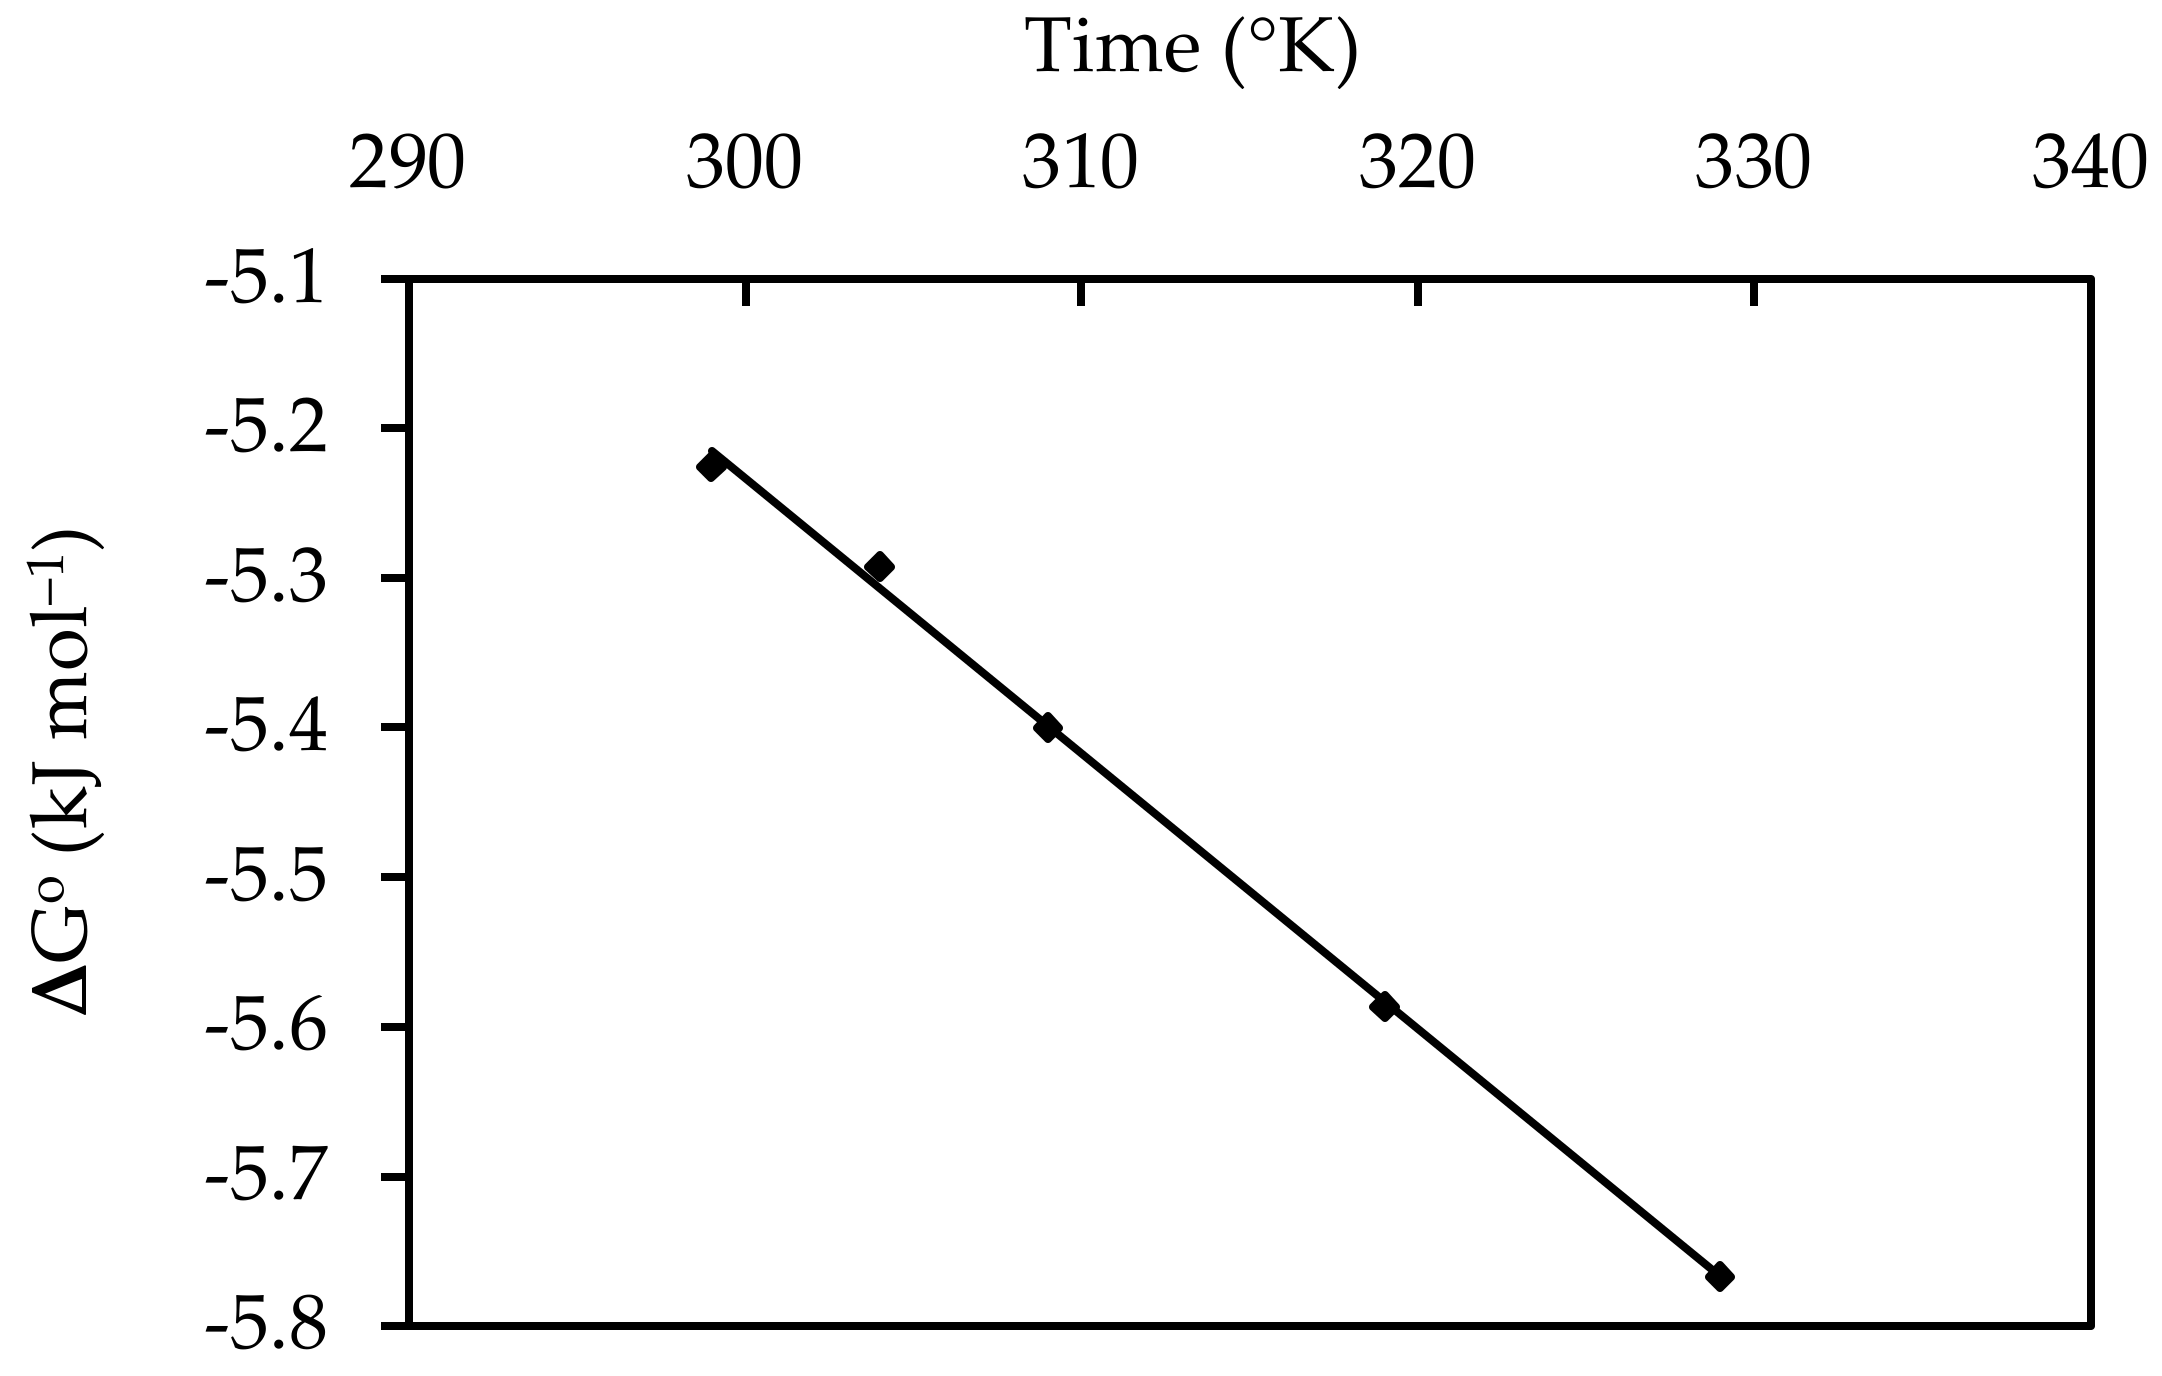
3.7. Thermodynamic Studies
3.8. Dye Removal Mechanism
3.9. Synthetic Dye Effluent Treatment
3.10. Comparison with Other Adsorbents
4. Conclusions
Author Contributions
Funding
Institutional Review Board Statement
Informed Consent Statement
Data Availability Statement
Acknowledgments
Conflicts of Interest
References
- Mansour, A.T.; Alprol, A.E.; Abualnaja, K.M.; El-Beltagi, H.S.; Ramadan, K.; Ashour, M. The Using of Nanoparticles of Microalgae in Remediation of Toxic Dye from Industrial Wastewater: Kinetic and Isotherm Studies. Materials 2022, 15, 3922. [Google Scholar] [CrossRef]
- Abualnaja, K.M.; Alprol, A.E.; Ashour, M.; Mansour, A.T. Influencing Multi-Walled Carbon Nanotubes for the Removal of Ismate Violet 2R Dye from Wastewater: Isotherm, Kinetics, and Thermodynamic Studies. Appl. Sci. 2021, 11, 4786. [Google Scholar] [CrossRef]
- Barwal, I.; Ranjan, P.; Kateriya, S.; Yadav, S.C. Cellular oxido-reductive proteins of Chlamydomonas reinhardtii control the biosynthesis of silver nanoparticles. J. Nanobiotechnol. 2011, 9, 56. [Google Scholar] [CrossRef]
- Frattini, A.; Pellegri, N.; Nicastro, D.; De Sanctis, O. Effect of amine groups in the synthesis of Ag nanoparticles using aminosilanes. Mater. Chem. Phys. 2005, 94, 148–152. [Google Scholar] [CrossRef]
- Abualnaja, K.M.; Alprol, A.E.; Abu-Saied, M.A.; Mansour, A.T.; Ashour, M. Studying the Adsorptive Behavior of Poly(Acrylonitrile-co-Styrene) and Carbon Nanotubes (Nanocomposites) Impregnated with Adsorbent Materials towards Methyl Orange Dye. Nanomaterials 2021, 11, 1144. [Google Scholar] [CrossRef]
- Burmistrov, D.E.; Yanykin, D.V.; Paskhin, M.O.; Nagaev, E.V.; Efimov, A.D.; Kaziev, A.V.; Ageychenkov, D.G.; Gudkov, S.V. Additive Production of a Material Based on an Acrylic Polymer with a Nanoscale Layer of Zno Nanorods Deposited Using a Direct Current Magnetron Discharge: Morphology, Photoconversion Properties, and Biosafety. Materials 2021, 14, 6586. [Google Scholar] [CrossRef]
- Abdulwahid, K.E.; Dwaish, A.S.; Dakhil, O.A. Green synthesis and characterization of zinc oxide nanoparticles from Cladophora glomerata and its antifungal activity against some fungal isolates. Plant Arch. 2019, 19, 3527–3532. [Google Scholar]
- Vilar, V.J.; Botelho, C.M.; Boaventura, R.A. Chromium and zinc uptake by algae Gelidium and agar extraction algal waste: Kinetics and equilibrium. J. Hazard. Mater. 2007, 149, 643–649. [Google Scholar] [CrossRef]
- Sharawy, Z.Z.; Ashour, M.; Labena, A.; Alsaqufi, A.S.; Mansour, A.T.; Abbas, E. Effects of dietary Arthrospira platensis nanoparticles on growth performance, feed utilization, and growth-related gene expression of Pacific white shrimp, Litopenaeus vannamei. Aquaculture 2022, 551, 737905. [Google Scholar] [CrossRef]
- Metwally, A.S.; El-Naggar, H.A.; El-Damhougy, K.A.; Bashar, M.A.E.; Ashour, M.; Abo-Taleb, H.A.H. GC-MS analysis of bioactive components in six different crude extracts from the Soft Coral (Sinularia maxim) collected from Ras Mohamed, Aqaba Gulf, Red Sea, Egypt. Egypt. J. Aquat. Biol. Fish. 2020, 24, 425–434. [Google Scholar] [CrossRef]
- Kaur, P.J.; Kaushik, G.; Siddiqui, R.; Goyal, P.K. Biomedical applications of some green synthesized metal nanomaterials. In Green Nanomaterials for Industrial Applications; Elsevier: Amsterdam, The Netherlands, 2022; pp. 71–91. [Google Scholar] [CrossRef]
- A Abo-Taleb, H.; F Zeina, A.; Ashour, M.; M Mabrouk, M.; E Sallam, A.; MM El-feky, M. Isolation and cultivation of the freshwater amphipod Gammarus pulex (Linnaeus, 1758), with an evaluation of its chemical and nutritional content. Egypt. J. Aquat. Biol. Fish. 2020, 24, 69–82. [Google Scholar] [CrossRef]
- Ashour, M.; Mabrouk, M.M.; Abo-Taleb, H.A.; Sharawy, Z.Z.; Ayoub, H.F.; Van Doan, H.; Davies, S.J.; El-Haroun, E.; Goda, A.M.S.A. A liquid seaweed extract (TAM®) improves aqueous rearing environment, diversity of zooplankton community, whilst enhancing growth and immune response of Nile tilapia, Oreochromis niloticus, challenged by Aeromonas hydrophila. Aquaculture 2021, 543, 736915. [Google Scholar] [CrossRef]
- Ashour, M.; Alprol, A.E.; Heneash, A.M.M.; Saleh, H.; Abualnaja, K.M.; Alhashmialameer, D.; Mansour, A.T. Ammonia Bioremediation from Aquaculture Wastewater Effluents Using Arthrospira platensis NIOF17/003: Impact of Biodiesel Residue and Potential of Ammonia-Loaded Biomass as Rotifer Feed. Materials 2021, 14, 5460. [Google Scholar] [CrossRef] [PubMed]
- Ashour, M.; Hassan, S.M.; Elshobary, M.E.; Ammar, G.A.G.; Gaber, A.; Alsanie, W.F.; Mansour, A.T.; El-Shenody, R. Impact of Commercial Seaweed Liquid Extract (TAM®) Biostimulant and Its Bioactive Molecules on Growth and Antioxidant Activities of Hot Pepper (Capsicum annuum). Plants 2021, 10, 1045. [Google Scholar] [CrossRef] [PubMed]
- Alprol, A.E.; Heneash, A.M.; Ashour, M.; Abualnaja, K.M.; Alhashmialameer, D.; Mansour, A.T.; Sharawy, Z.Z.; Abu-Saied, M.A.; Abomohra, A.E.-F. Potential Applications of Arthrospira platensis Lipid-Free Biomass in Bioremediation of Organic Dye from Industrial Textile Effluents and Its Influence on Marine Rotifer (Brachionus plicatilis). Materials 2021, 14, 4446. [Google Scholar] [CrossRef]
- Khalaf, M.A. Biosorption of reactive dye from textile wastewater by non-viable biomass of Aspergillus niger and Spirogyra sp. Bioresour. Technol. 2008, 99, 6631–6634. [Google Scholar] [CrossRef]
- Ghoneim, M.M.; El-Desoky, H.S.; El-Moselhy, K.M.; Amer, A.; Abou El-Naga, E.H.; Mohamedein, L.I.; Al-Prol, A.E. Removal of cadmium from aqueous solution using marine green algae, Ulva lactuca. Egypt. J. Aquat. Res. 2014, 40, 235–242. [Google Scholar] [CrossRef]
- Nourmoradi, H.; Ghiasvand, A.; Noorimotlagh, Z. Removal of methylene blue and acid orange 7 from aqueous solutions by activated carbon coated with zinc oxide (ZnO) nanoparticles: Equilibrium, kinetic, and thermodynamic study. Desalination Water Treat. 2015, 55, 252–262. [Google Scholar] [CrossRef]
- AlProl, A.E. Study of environmental concerns of dyes and recent textile effluents treatment technology: A review. Asian J. Fish. Aquat. Res 2019, 3, 1–18. [Google Scholar]
- Clarke, E.; Anliker, R. Organic dyes and pigments. In Anthropogenic Compounds; Springer: Berlin/Heidelberg, Germany, 1980; pp. 181–215. [Google Scholar]
- Amer, A.; Abdel-Moneim, M. Bioremediation of Reactive Blue 19 and Reactive Black 5 from Aqueous Solution by using Fungi Aspergillus niger. Int. J. Curr. Microbiol. Appl. Sci. 2017, 6, 1676–1686. [Google Scholar]
- Alprol, A.E.; Heneash, A.M.M.; Soliman, A.M.; Ashour, M.; Alsanie, W.F.; Gaber, A.; Mansour, A.T. Assessment of Water Quality, Eutrophication, and Zooplankton Community in Lake Burullus, Egypt. Diversity 2021, 13, 268. [Google Scholar] [CrossRef]
- Keharia, H.; Madamwar, D. Bioremediation concepts for treatment of dye containing wastewater: A review. Indian J. Exp. Biol. 2003, 41, 1068–1075. [Google Scholar] [PubMed]
- Al-Tohamy, R.; Ali, S.S.; Li, F.; Okasha, K.M.; Mahmoud, Y.A.-G.; Elsamahy, T.; Jiao, H.; Fu, Y.; Sun, J. A critical review on the treatment of dye-containing wastewater: Ecotoxicological and health concerns of textile dyes and possible remediation approaches for environmental safety. Ecotoxicol. Environ. Saf. 2022, 231, 113160. [Google Scholar] [CrossRef] [PubMed]
- Sun, D.; Zhang, Z.; Wang, M.; Wu, Y. Adsorption of reactive dyes on activated carbon developed from Enteromorpha prolifera. Am. J. Anal. Chem. 2013, 4, 33867. [Google Scholar] [CrossRef]
- Falaki, Z.; Bashiri, H. Preparing an adsorbent from the unused solid waste of Rosewater extraction for high efficient removal of Crystal Violet. J. Iran. Chem. Soc. 2021, 18, 2689–2702. [Google Scholar] [CrossRef]
- Babel, S.; Opiso, E.M. Removal of Cr from synthetic wastewater by sorption into volcanic ash soil. Int. J. Environ. Sci. Technol. (Tehran) 2007, 4, 99–107. [Google Scholar] [CrossRef]
- El-Moselhy, K.; Abdel-Azzem, M.; Amer, A.; Al-Prol, A. Adsorption of Cu (II) and Cd (II) from aqueous solution by using rice husk adsorbent. Phys. Chem. Indian J. 2017, 12, 109–122. [Google Scholar]
- Al Prol, A.E.; Abd El Azzem, M.; Amer, A.; El-Metwally, M.E.; Abd El-Hamid, H.T.; El-Moselhy, K.M. Adsorption of cadmium (II) ions from aqueous solution onto mango leaves. Asian J. Phys. Chem. Sci. 2017, 2, 1–11. [Google Scholar] [CrossRef]
- Rajasulochana, P.; Preethy, V. Comparison on efficiency of various techniques in treatment of waste and sewage water–A comprehensive review. Resour. Effic. Technol. 2016, 2, 175–184. [Google Scholar] [CrossRef]
- Abul, A.; Samad, S.; Huq, D.; Moniruzzaman, M.; Masum, M. Textile dye removal from wastewater effluents using chitosan-ZnO nanocomposite. J. Text. Sci. Eng. 2015, 5, 3. [Google Scholar]
- Fomina, M.; Gadd, G.M. Biosorption: Current perspectives on concept, definition and application. Bioresour. Technol. 2014, 160, 3–14. [Google Scholar] [CrossRef]
- Zafar, M.N.; Dar, Q.; Nawaz, F.; Zafar, M.N.; Iqbal, M.; Nazar, M.F. Effective adsorptive removal of azo dyes over spherical ZnO nanoparticles. J. Mater. Res. Technol. 2019, 8, 713–725. [Google Scholar] [CrossRef]
- Wang, X.; Guo, Y.; Yang, L.; Han, M.; Zhao, J.; Cheng, X. Nanomaterials as sorbents to remove heavy metal ions in wastewater treatment. J. Environ. Anal. Toxicol. 2012, 2, 154–158. [Google Scholar] [CrossRef]
- Özgür, Ü.; Alivov, Y.I.; Liu, C.; Teke, A.; Reshchikov, M.; Doğan, S.; Avrutin, V.; Cho, S.-J.; Morkoç, H. A comprehensive review of ZnO materials and devices. J. Appl. Phys. 2005, 98, 11. [Google Scholar] [CrossRef]
- Borysiewicz, M.A. ZnO as a functional material, a review. Crystals 2019, 9, 505. [Google Scholar] [CrossRef]
- Azizi, S.; Ahmad, M.B.; Namvar, F.; Mohamad, R. Green biosynthesis and characterization of zinc oxide nanoparticles using brown marine macroalga Sargassum muticum aqueous extract. Mater. Lett. 2014, 116, 275–277. [Google Scholar] [CrossRef]
- Naseer, M.; Aslam, U.; Khalid, B.; Chen, B. Green route to synthesize Zinc Oxide Nanoparticles using leaf extracts of Cassia fistula and Melia azadarach and their antibacterial potential. Sci. Rep. 2020, 10, 1–10. [Google Scholar] [CrossRef]
- Ashour, M.; El-Shafei, A.A.; Khairy, H.M.; Abd-Elkader, D.Y.; Mattar, M.A.; Alataway, A.; Hassan, S.M. Effect of Pterocladia capillacea Seaweed Extracts on Growth Parameters and Biochemical Constituents of Jew’s Mallow. Agronomy 2020, 10, 420. [Google Scholar] [CrossRef]
- Hassaan, M.A.; Hosny, S.; ElKatory, M.R.; Ali, R.M.; Rangreez, T.A.; El Nemr, A. Dual action of both green and chemically synthesized zinc oxide nanoparticles: Antibacterial activity and removal of Congo red dye. Desalin. Water Treat 2021, 218, 423–435. [Google Scholar] [CrossRef]
- Doustkhah, E.; Esmat, M.; Fukata, N.; Ide, Y.; Hanaor, D.A.; Assadi, M.H.N. MOF-derived nanocrystalline ZnO with controlled orientation and photocatalytic activity. Chemosphere 2022, 303, 134932. [Google Scholar] [CrossRef]
- Lagergren, S.K. About the theory of so-called adsorption of soluble substances. Sven. Vetenskapsakad. Handingarl. 1898, 24, 1–39. [Google Scholar]
- Yang, S.I.; Seth, J.; STRACHAN, J.P.; Gentemann, S.; Kim, D.; Holten, D.; Lindsey, J.S.; Bocian, D.F. Ground and excited state electronic properties of halogenated tetraarylporphyrins. Tuning the building blocks for porphyrin-based photonic devices. J. Porphyr. Phthalocyanines 1999, 3, 117–147. [Google Scholar] [CrossRef]
- Ng, J.; Cheung, W.; McKay, G. Equilibrium studies of the sorption of Cu (II) ions onto chitosan. J. Colloid Interface Sci. 2002, 255, 64–74. [Google Scholar] [CrossRef]
- Sparks, D.L. Soil Physical Chemistry; CRC press: Boca Raton, FL, USA, 1998. [Google Scholar]
- Anand, M.; Suresh, S. Marine seaweed Sargassum wightii extract as a low-cost sensitizer for ZnO photoanode based dye-sensitized solar cell. Adv. Nat. Sci. Nanosci. Nanotechnol. 2015, 6, 035008. [Google Scholar] [CrossRef]
- Pandimurugan, R.; Thambidurai, S. Novel seaweed capped ZnO nanoparticles for effective dye photodegradation and antibacterial activity. Adv. Powder Technol. 2016, 27, 1062–1072. [Google Scholar] [CrossRef]
- Sparks, D. Kinetics of reactions in pure and mixed systems. In Soil Physical Chemistry; Sparks, D.L., Ed.; CRC Press: Boca Raton, FL, USA, 1986; pp. 83–145. [Google Scholar]
- Wahab, R.; Kim, Y.-S.; Shin, H.-S. Fabrication, characterization and growth mechanism of heterostructured zinc oxide nanostructures via solution method. Curr. Appl. Phys. 2011, 11, 334–340. [Google Scholar] [CrossRef]
- Zandsalimi, Y.; Taymori, P.; Darvishi Cheshmeh Soltani, R.; Rezaee, R.; Abdullahi, N.; Safari, M. Photocatalytic removal of Acid Red 88 dye using zinc oxide nanoparticles fixed on glass plates. J. Adv. Environ. Health Res. 2015, 3, 102–110. [Google Scholar]
- Azizi, S.; Mahdavi Shahri, M.; Mohamad, R. Green synthesis of zinc oxide nanoparticles for enhanced adsorption of lead ions from aqueous solutions: Equilibrium, kinetic and thermodynamic studies. Molecules 2017, 22, 831. [Google Scholar] [CrossRef] [PubMed]
- Yu, J.-G.; Yu, L.-Y.; Yang, H.; Liu, Q.; Chen, X.-H.; Jiang, X.-Y.; Chen, X.-Q.; Jiao, F.-P. Graphene nanosheets as novel adsorbents in adsorption, preconcentration and removal of gases, organic compounds and metal ions. Sci. Total Environ. 2015, 502, 70–79. [Google Scholar] [CrossRef]
- Gupta, V.; Agarwal, A.; Singh, M.; Singh, N. Removal of Red RB dye from aqueous solution by belpatra bark charcoal (BBC) adsorbent. J. Mater. Environ. Sci. 2017, 8, 3654–3665. [Google Scholar]
- Meena, A.K.; Kadirvelu, K.; Mishra, G.; Rajagopal, C.; Nagar, P. Adsorptive removal of heavy metals from aqueous solution by treated sawdust (Acacia arabica). J. Hazard. Mater. 2008, 150, 604–611. [Google Scholar] [CrossRef]
- Abate, G.Y.; Alene, A.N.; Habte, A.T.; Getahun, D.M. Adsorptive removal of malachite green dye from aqueous solution onto activated carbon of Catha edulis stem as a low cost bio-adsorbent. Environ. Syst. Res. 2020, 9, 1–13. [Google Scholar] [CrossRef]
- Mondal, N.K.; Kar, S. Potentiality of banana peel for removal of Congo red dye from aqueous solution: Isotherm, kinetics and thermodynamics studies. Appl. Water Sci. 2018, 8, 1–12. [Google Scholar] [CrossRef]
- Rafatullah, M.; Sulaiman, O.; Hashim, R.; Ahmad, A. Adsorption of methylene blue on low-cost adsorbents: A review. J. Hazard. Mater. 2010, 177, 70–80. [Google Scholar] [CrossRef] [PubMed]
- Kumar, P.S.; Kirthika, K. Equilibrium and kinetic study of adsorption of nickel from aqueous solution onto bael tree leaf powder. J. Eng. Sci. Technol. 2009, 4, 351–363. [Google Scholar]
- Hameed, B.; Chin, L.; Rengaraj, S. Adsorption of 4-chlorophenol onto activated carbon prepared from rattan sawdust. Desalination 2008, 225, 185–198. [Google Scholar] [CrossRef]
- Tempkin, M.; Pyzhev, V. Kinetics of ammonia synthesis on promoted iron catalyst. Acta Phys. Chim. USSR 1940, 12, 327. [Google Scholar]
- Su, J.; Lin, H.-f.; Wang, Q.-P.; Xie, Z.-M.; Chen, Z.-l. Adsorption of phenol from aqueous solutions by organomontmorillonite. Desalination 2011, 269, 163–169. [Google Scholar] [CrossRef]
- Cheung, W.; Szeto, Y.; McKay, G. Intraparticle diffusion processes during acid dye adsorption onto chitosan. Bioresour. Technol. 2007, 98, 2897–2904. [Google Scholar] [CrossRef]
- Liu, Q.-S.; Zheng, T.; Wang, P.; Jiang, J.-P.; Li, N. Adsorption isotherm, kinetic and mechanism studies of some substituted phenols on activated carbon fibers. Chem. Eng. J. 2010, 157, 348–356. [Google Scholar] [CrossRef]
- Hadi, M.; Samarghandi, M.R.; McKay, G. Equilibrium two-parameter isotherms of acid dyes sorption by activated carbons: Study of residual errors. Chem. Eng. J. 2010, 160, 408–416. [Google Scholar] [CrossRef]
- Jamshidi, H.; Ghaedi, M.; Sabzehmeidani, M.M.; Bagheri, A.R. Comparative study of acid yellow 119 adsorption onto activated carbon prepared from lemon wood and ZnO nanoparticles loaded on activated carbon. Appl. Organomet. Chem. 2018, 32, e4080. [Google Scholar] [CrossRef]
- Nakamura, T.; Kawasaki, N.; Tanada, S.; Tamura, T.; Shimizu, Y. Indigo carmine removal by charcoal from rice bran as an agricultural by-product. Toxicol. Environ. Chem. 2005, 87, 321–327. [Google Scholar] [CrossRef]
- Nakamura, T.; Hirata, M.; Kawasaki, N.; Tanada, S.; Tamura, T.; Nakahori, Y. Decolorization of indigo carmine by charcoal from extracted residue of coffee beans. J. Environ. Sci. Health Part A 2003, 38, 555–562. [Google Scholar] [CrossRef] [PubMed]
- El-Azazy, M.; Dimassi, S.N.; El-Shafie, A.S.; Issa, A.A. Bio-waste Aloe vera leaves as an efficient adsorbent for titan yellow from wastewater: Structuring of a novel adsorbent using Plackett-Burman factorial design. Appl. Sci. 2019, 9, 4856. [Google Scholar] [CrossRef]
- Mitrogiannis, D.; Markou, G.; Çelekli, A.; Bozkurt, H. Biosorption of methylene blue onto Arthrospira platensis biomass: Kinetic, equilibrium and thermodynamic studies. J. Environ. Chem. Eng. 2015, 3, 670–680. [Google Scholar] [CrossRef]
- Villabona-Ortíz, Á.; Figueroa-Lopez, K.J.; Ortega-Toro, R. Kinetics and Adsorption Equilibrium in the Removal of Azo-Anionic Dyes by Modified Cellulose. Sustainability 2022, 14, 3640. [Google Scholar] [CrossRef]


| Characteristics | Value |
|---|---|
| Dye name | Ismate violet 2R |
| Wavelength (λ max) | 550 nm |
| Mol. wt. | 700 |
| Molecular formula | C22H14N4O11S3CuCl |
| C.I. name | IV2R |
| Molecular structure |  |
| Surface Characteristics | Value |
|---|---|
| BET surface area | 113.751 m2 g−1 |
| Langmuir method | 215.295 m2 g−1 |
| Average pore size | 2.52797 nm |
| Total pore volume | 0.14378 C2 g−1 |
| DH desorption | 84.0658 m2 g−1 |
| BJH desorption | 82.2329 m2 g−1 |
| Average particle radius | 1.1988 nm |
| Polarizability | 1.46 (mL mol−1) |
| Surface atom density | 13.1 (mol cm2) |
| RMSE | X2 | Value | Isotherm Parameter | Isotherm Model |
|---|---|---|---|---|
| 0.046 | 0.001 | 0.754 | 1/n | Freundlich |
| 34.30 | KF (mg−1−1/n L1/n g−1) | |||
| 0.995 | R2 | |||
| 0.047 | 0.002 | 59.88 | Qmax (mg g−1) | Langmuir |
| 7.26 | Ka | |||
| 0.979 | R2 | |||
| 0.038 | RL | |||
| 14.995 | 65.439 | 0.06 | AHJ | Harkins–Jura |
| 0.81 | BHJ | |||
| 0.894 | R2 | |||
| 0.054 | 0.001 | 0.753 | 1/nH | Halsey |
| 721 | KH | |||
| 0.995 | R2 | |||
| 0.004 | 0.000 | 4.940 | Wbs | Smith |
| 178.730 | Ws | |||
| 0.995 | R2 | |||
| 16.192 | 76.305 | 14.65 | AT | Tempkin |
| 65.36 | BT | |||
| 592.46 | bT | |||
| 0.926 | R2 |
| Model | Parameter | Value |
|---|---|---|
| First-order kinetic | qe (calc.) | 82.41 |
| K1 (min−1) | 4.66 × 10⁻³ | |
| R2 | 0.018 | |
| Second-order kinetic | qe (calc.) (mg g−1) | 4.00 |
| K2 (mg g−1 min−1) | 5.69 | |
| R2 | 1 | |
| qe (exp.) | 3.99 | |
| Interparticle diffusion | Kdif (min1/2) | 0.0014 |
| C | 0.60 | |
| R2 | 0.615 | |
| Elovich | Β (mg g−1 min−1) | 1.31 |
| α (g mg−1) | 25,510.02 | |
| R2 | 0.771 |
| Temperature (°C) | ∆G° (kJ mol−1) | ∆H° (kJ mol−1) | ΔS° (J mol−1) |
|---|---|---|---|
| 25 | −5.22548 | 0.287 | −0.018 |
| 30 | −5.29248 | ||
| 35 | −5.3995 | ||
| 45 | −5.58672 | ||
| 55 | −5.76682 |
| Ref. | qe (mg g−1) | Contact Time (min) | pH | Organic Dyes | Adsorptions |
|---|---|---|---|---|---|
| [66] | 116.29 | 4 | Ay 199 | ZnO-NPs-AC | |
| [19] | 66.66 | 120 | 9 | methylene blue | AC–ZnO |
| [67] | 9.7 | 180 | 7 | indigo carmine | Charcoal from rice bran |
| [68] | 30 | 1200 | - | indigo carmine | Charcoal from extracted residue of coffee beans |
| [69] | 55.25 | 5 | 4 | Titan yellow | Aloe vera |
| [70] | 312.5 | 60–120 | 7.5 | methylene blue | Arthrospira platensis biomass |
| [71] | 2.13 | 480 | 4.9 | tartrazine | Cellulose extracted from wheat residue |
| Current study | 59.88 | 60–120 | 2 | Ismate violet 2R (IV2R) | Green ZnO-NPs (prepared from red seaweed (Pterocladia Capillacea)) |
Publisher’s Note: MDPI stays neutral with regard to jurisdictional claims in published maps and institutional affiliations. |
© 2022 by the authors. Licensee MDPI, Basel, Switzerland. This article is an open access article distributed under the terms and conditions of the Creative Commons Attribution (CC BY) license (https://creativecommons.org/licenses/by/4.0/).
Share and Cite
Mansour, A.T.; Alprol, A.E.; Khedawy, M.; Abualnaja, K.M.; Shalaby, T.A.; Rayan, G.; Ramadan, K.M.A.; Ashour, M. Green Synthesis of Zinc Oxide Nanoparticles Using Red Seaweed for the Elimination of Organic Toxic Dye from an Aqueous Solution. Materials 2022, 15, 5169. https://doi.org/10.3390/ma15155169
Mansour AT, Alprol AE, Khedawy M, Abualnaja KM, Shalaby TA, Rayan G, Ramadan KMA, Ashour M. Green Synthesis of Zinc Oxide Nanoparticles Using Red Seaweed for the Elimination of Organic Toxic Dye from an Aqueous Solution. Materials. 2022; 15(15):5169. https://doi.org/10.3390/ma15155169
Chicago/Turabian StyleMansour, Abdallah Tageldein, Ahmed E. Alprol, Mohamed Khedawy, Khamael M. Abualnaja, Tarek A. Shalaby, Gamal Rayan, Khaled M. A. Ramadan, and Mohamed Ashour. 2022. "Green Synthesis of Zinc Oxide Nanoparticles Using Red Seaweed for the Elimination of Organic Toxic Dye from an Aqueous Solution" Materials 15, no. 15: 5169. https://doi.org/10.3390/ma15155169
APA StyleMansour, A. T., Alprol, A. E., Khedawy, M., Abualnaja, K. M., Shalaby, T. A., Rayan, G., Ramadan, K. M. A., & Ashour, M. (2022). Green Synthesis of Zinc Oxide Nanoparticles Using Red Seaweed for the Elimination of Organic Toxic Dye from an Aqueous Solution. Materials, 15(15), 5169. https://doi.org/10.3390/ma15155169