
Experimental Study on the Manufacturing of Steel Inclined Walls by Directed Energy Deposition Based on Dimensional and 3D Surface Roughness Measurements

 ,
,  ,
,  , ,
, ,  and
and 
Abstract
:1. Introduction
2. Methodology
2.1. Materials and Equipment
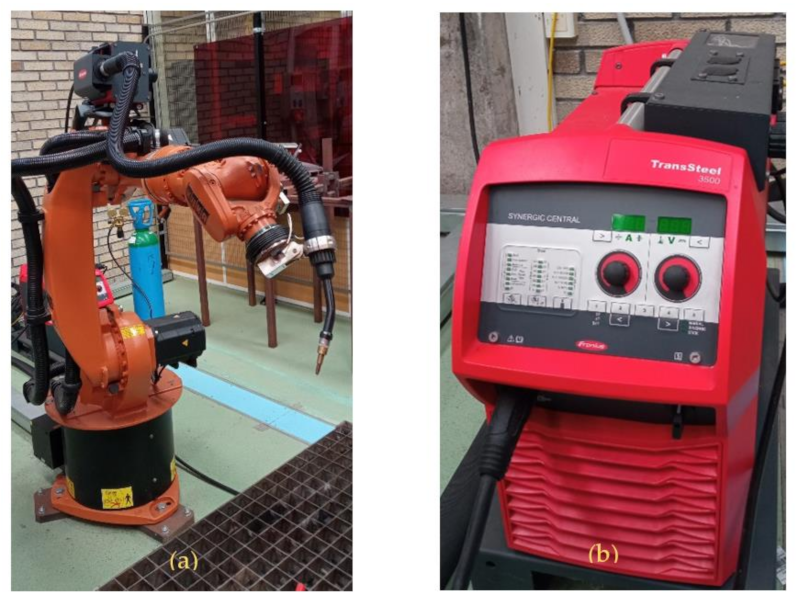
- The welding system was a Fronius® TransSteel 3500 with a microprocessor-controlled inverter system with a synergic function suitable for gas metal arc welding. The torch used in this case was a Fronius® MTW5000 model, and the wire feeder was a Fronius VR 5000 Rob 4R/FSC Kenv with double motorized rollers [32]. Depending on the gas used, it works as a MAG (Metal Active Gas) welding process. The welding system has five programable preset jobs. Two jobs were used in this research. Firstly, the wire material and thickness of the substrate must be selected. Then, under the synchronized welding procedure, wire feed, current intensity and voltage must be carefully chosen. The other two parameters will be selected automatically.
- The positioning system was a six-degrees-of-freedom KUKA® Kr16 robot with anthropomorphic morphology and a nominal load of 16 kg. The operating range was 1611 mm from the center of its base. The wire feeding system was supported on the third axis. The positioning repeatability was 0.05 mm.
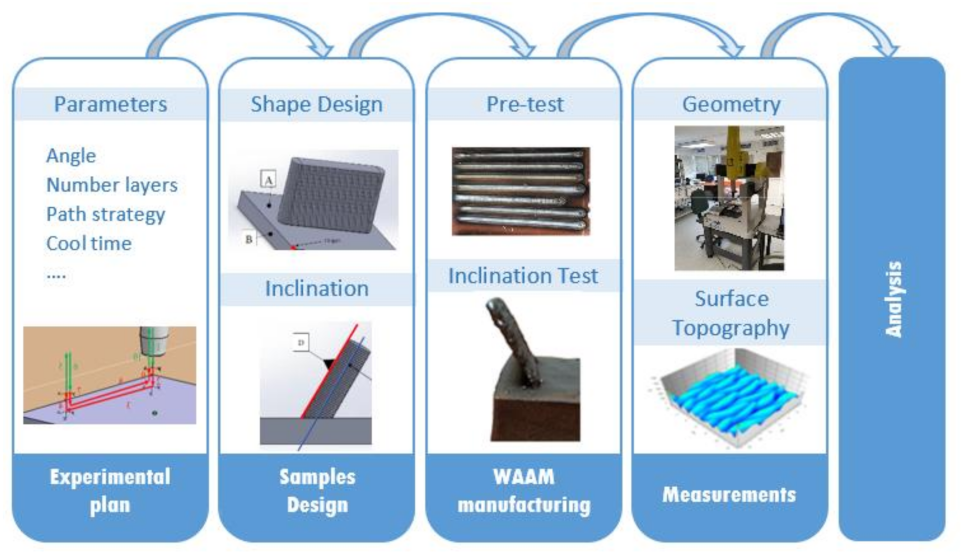
2.2. Experimental Plan
2.3. Measuring Procedure
3. Results and Discussion
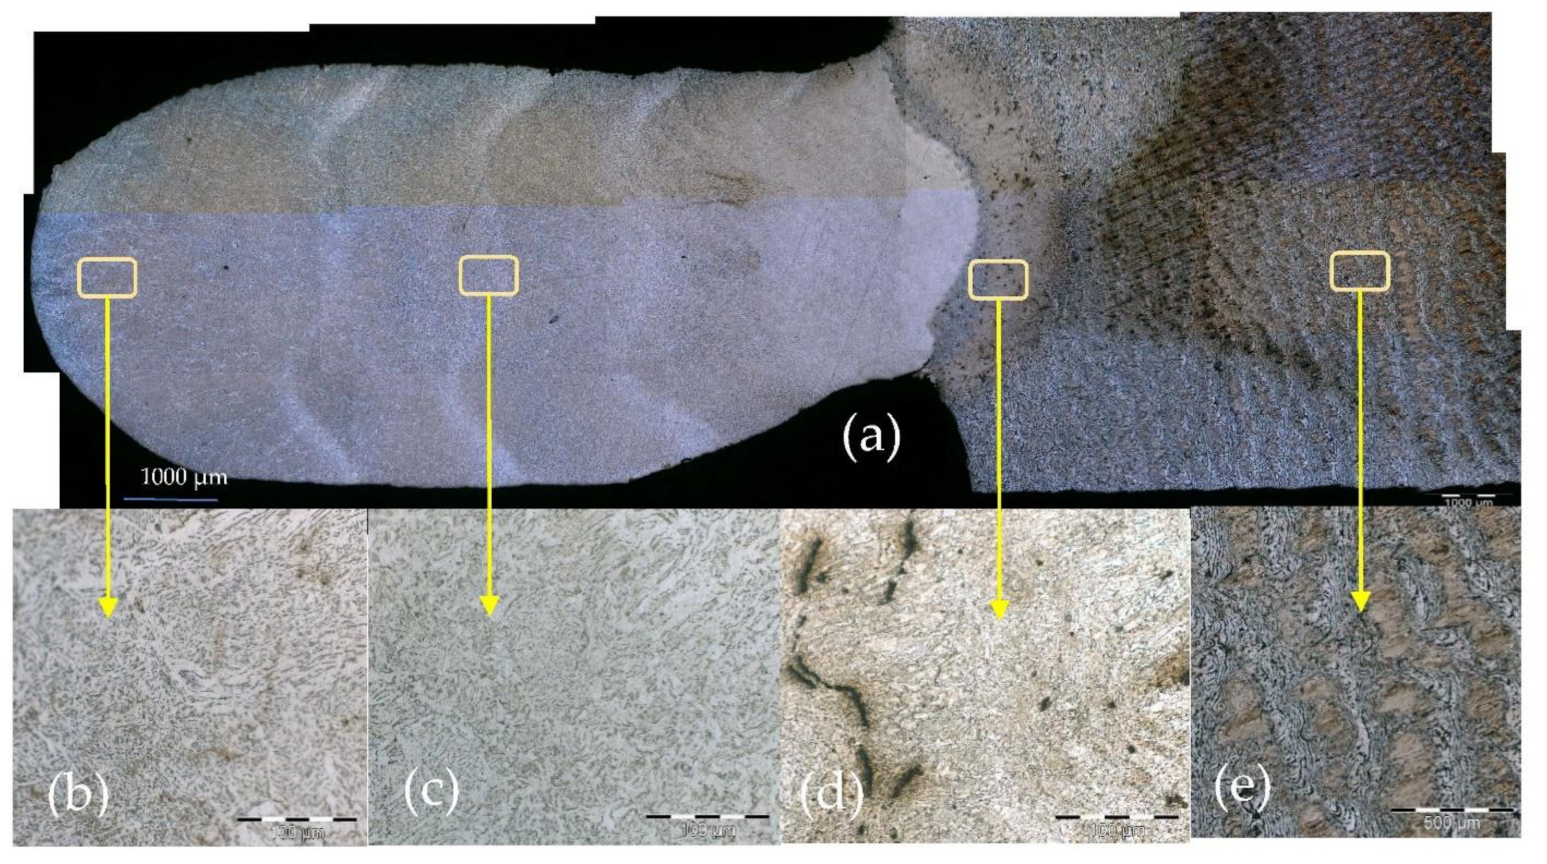
3.1. Microstructural Analysis
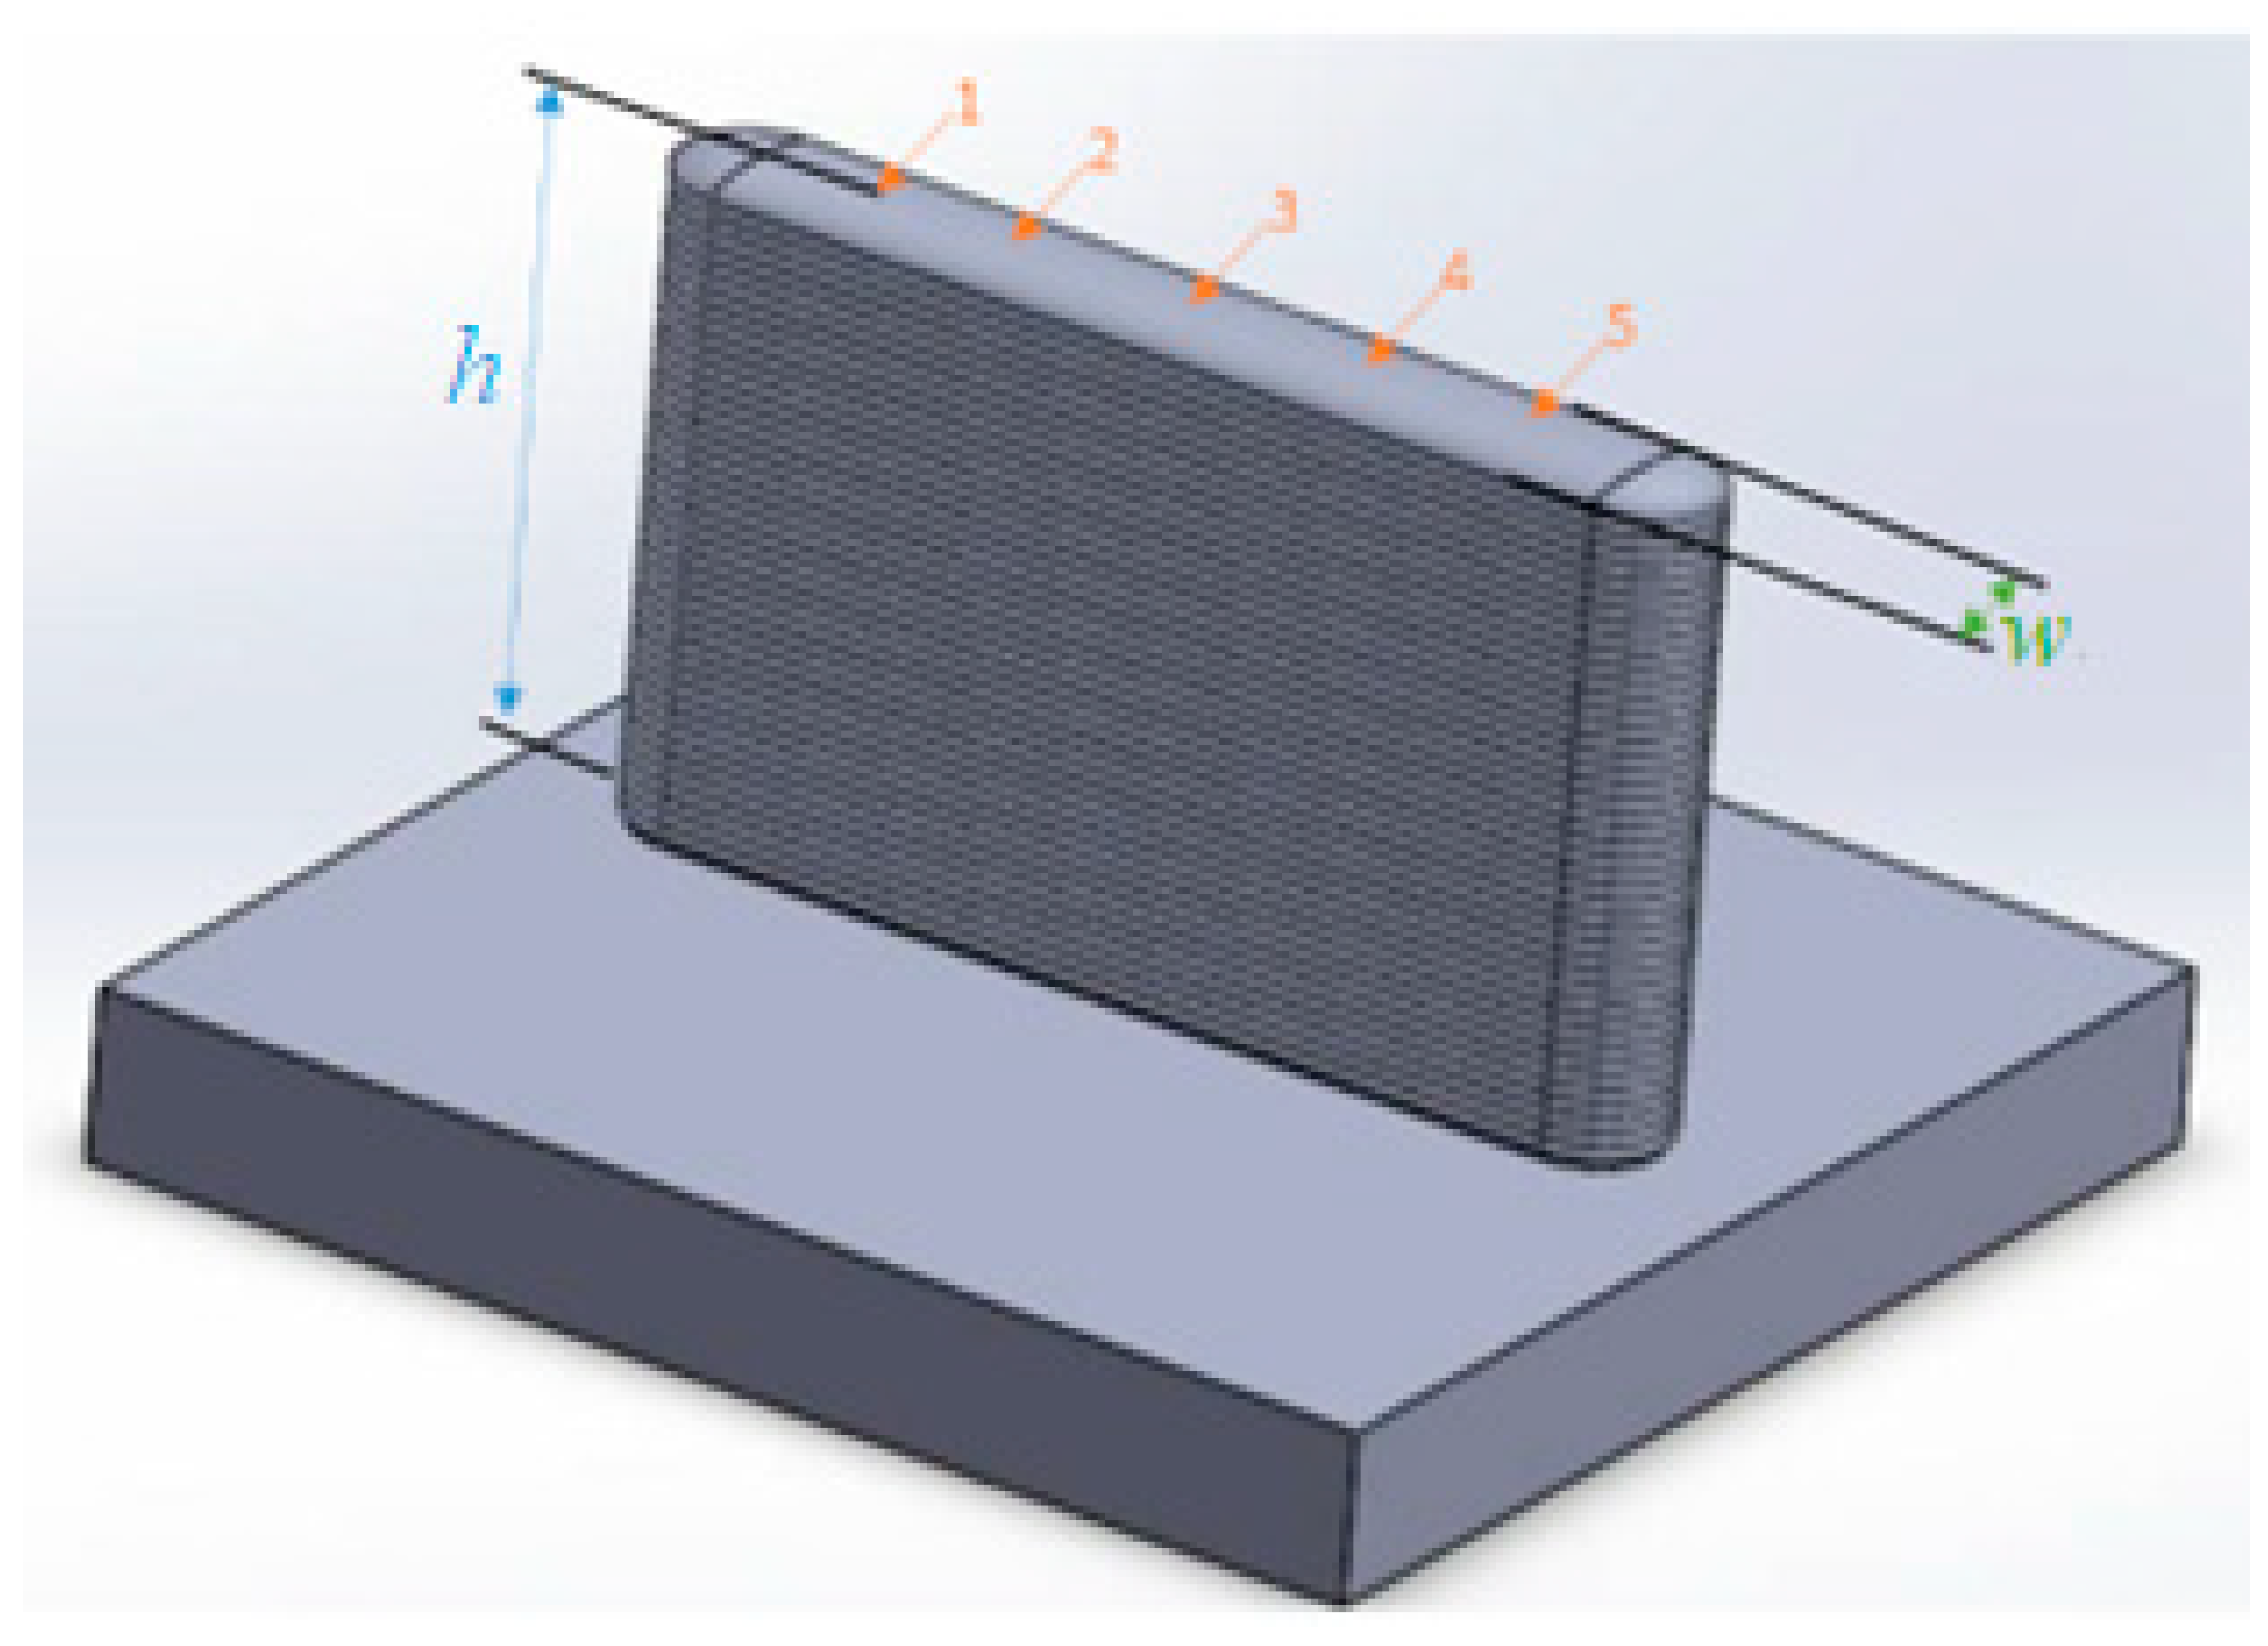
3.2. Geometrical Analysis
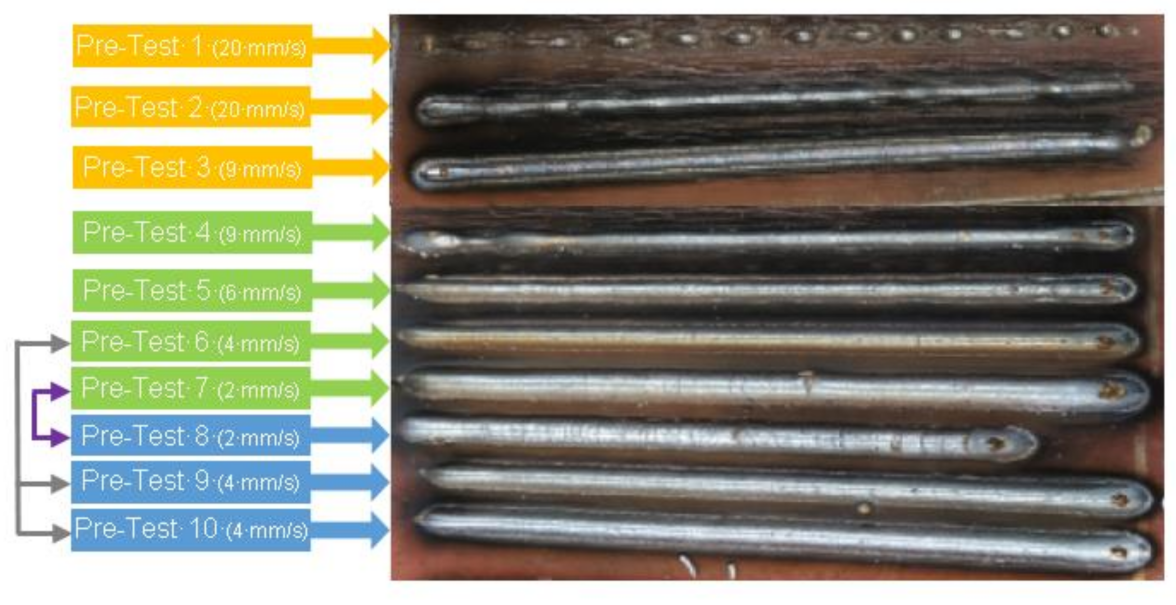
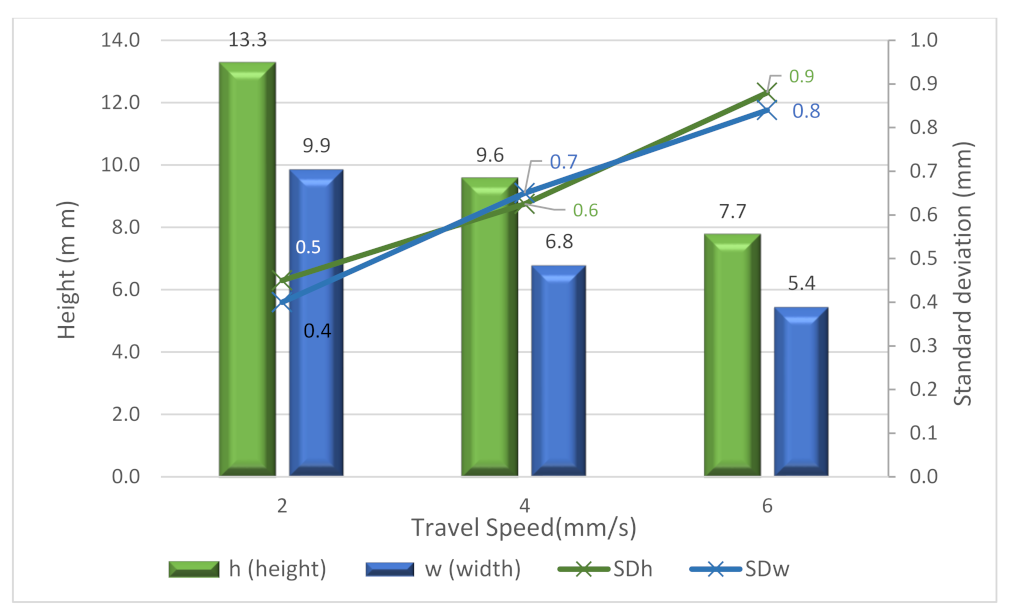
3.2.1. Travel Speed
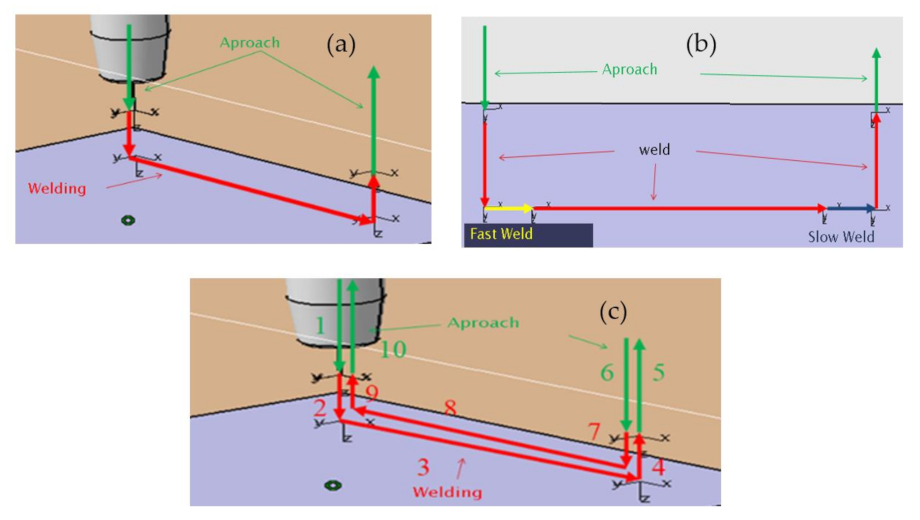
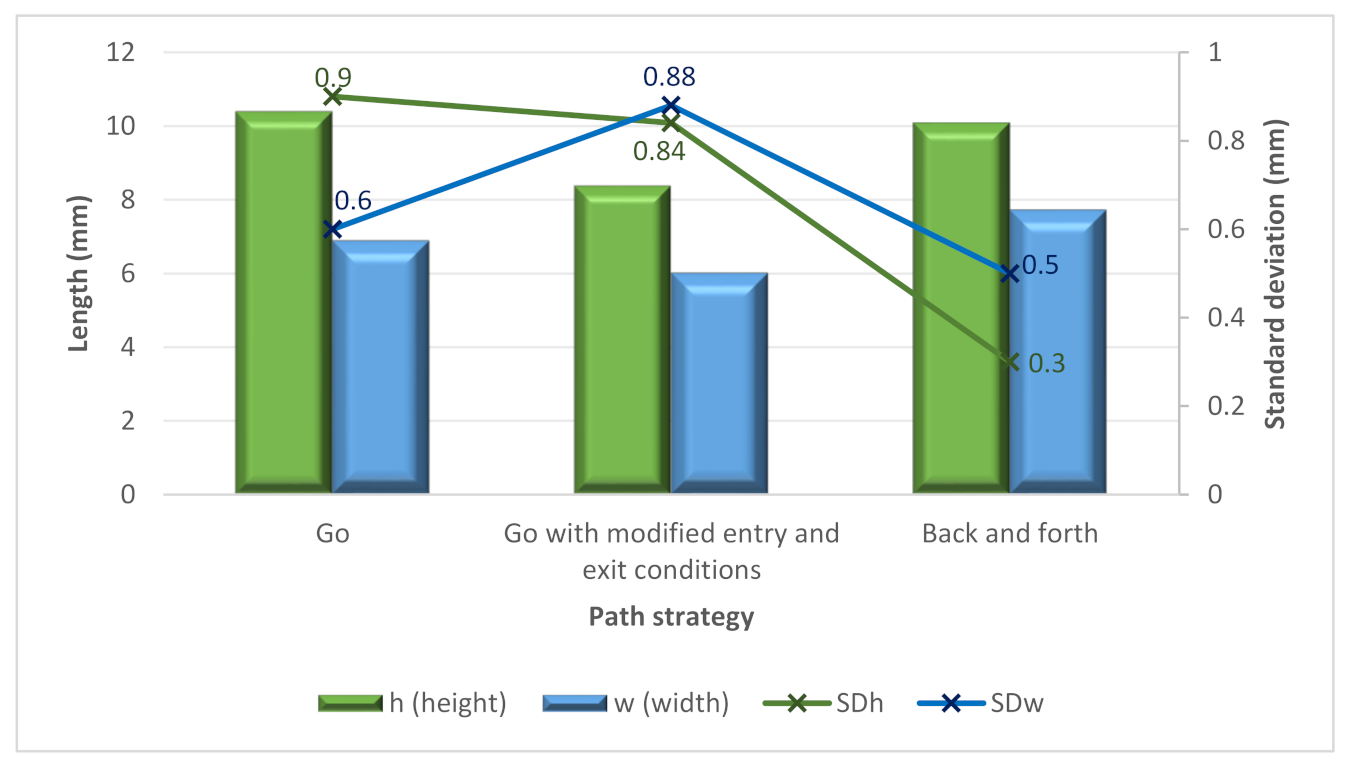
3.2.2. Path Strategy
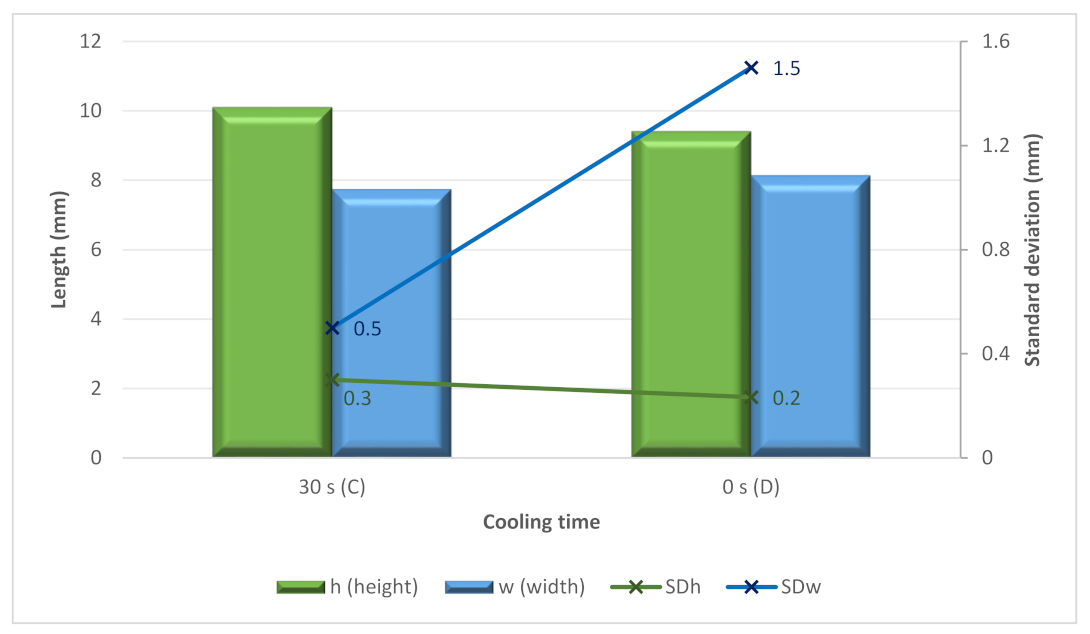
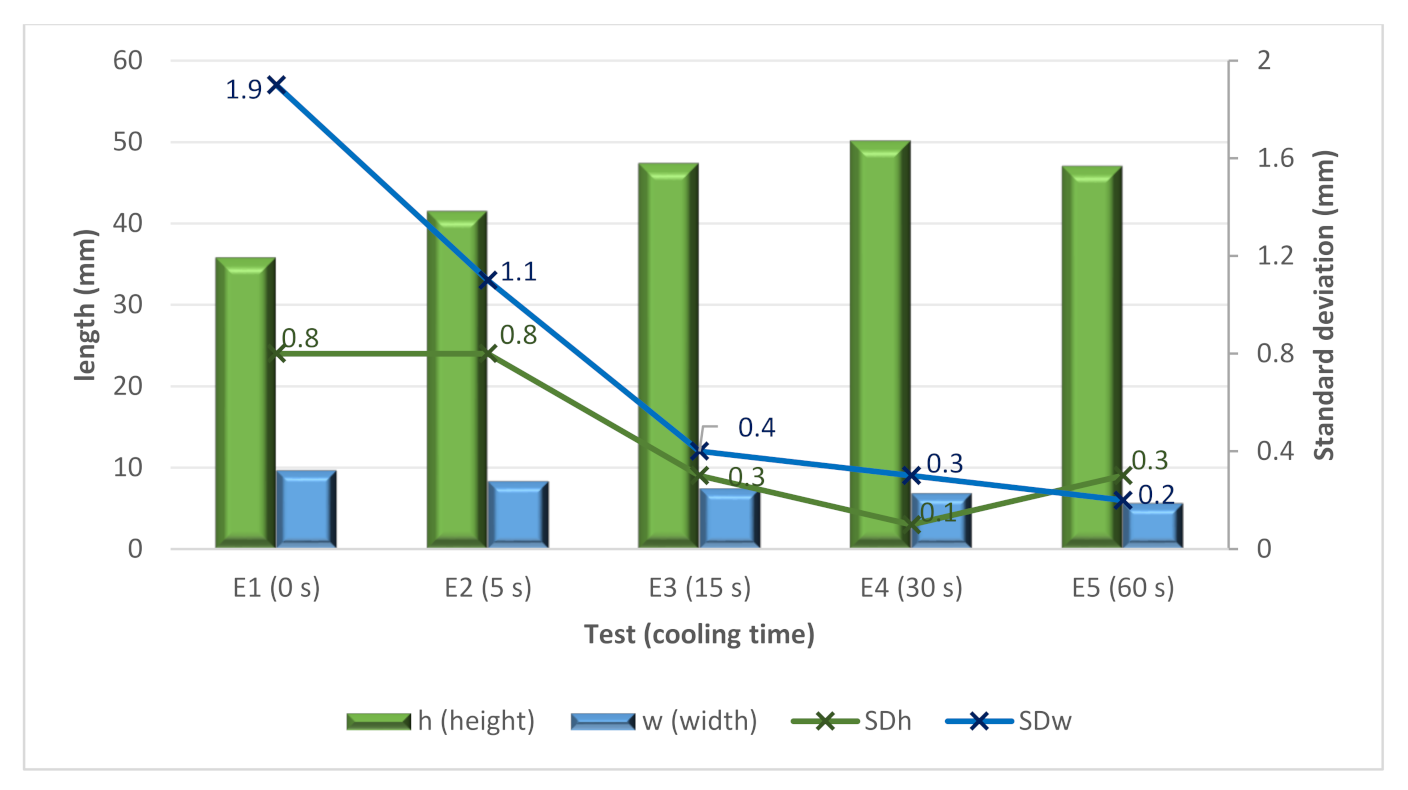
3.2.3. Intermediate Cooling
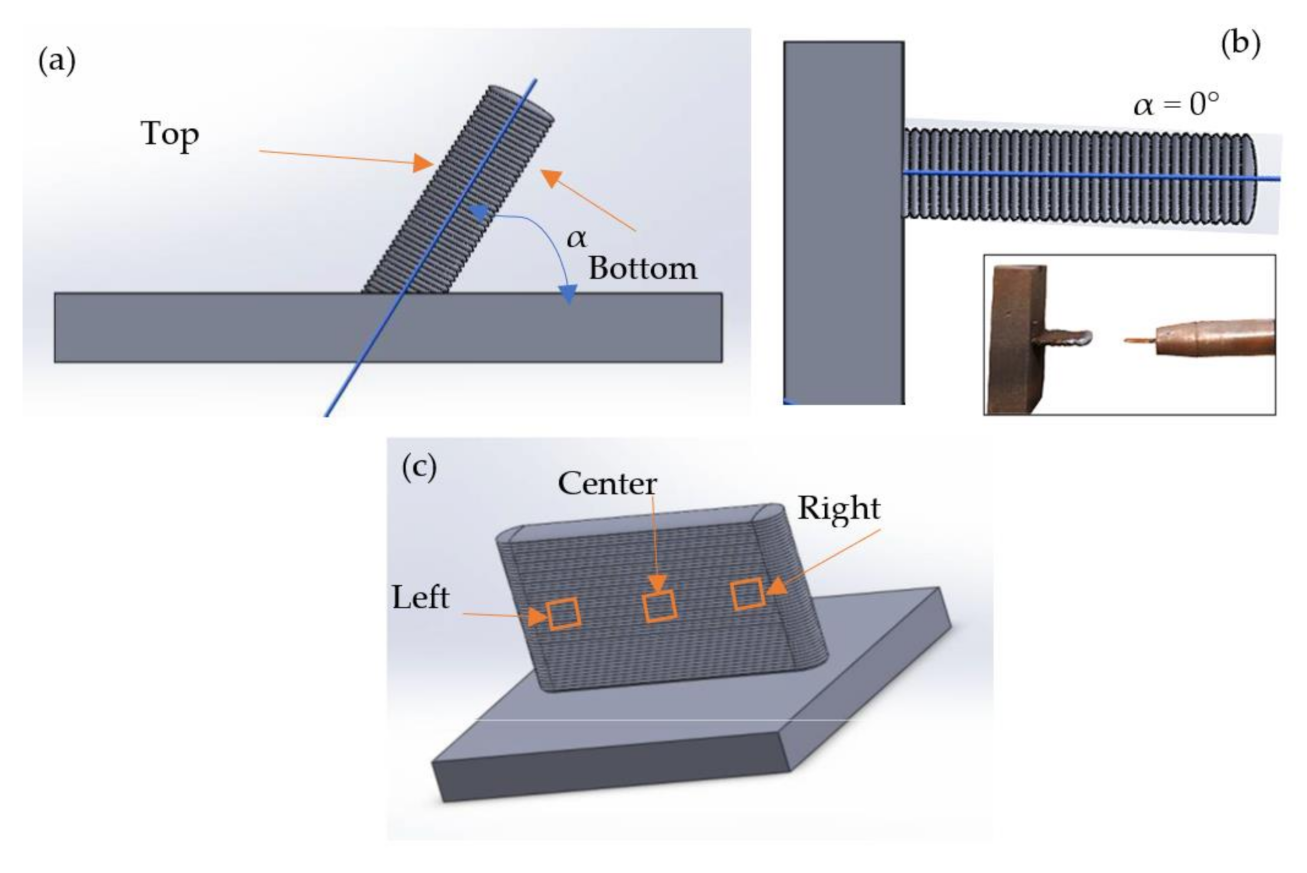
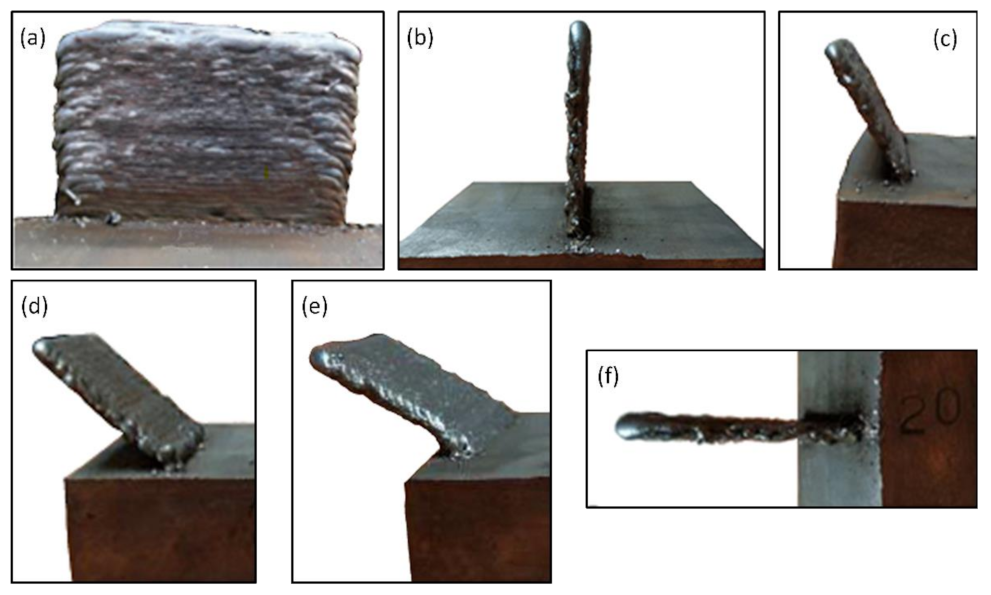
3.2.4. Inclination Angle
3.3. Surface Quality
4. Conclusions and Future Work
- The use of simulation robotic control software for the process provided satisfactory results in the manufactured parts, obtaining values similar to the theoretical ones. The software makes it possible to design and readjust the different parameters present in the process quickly and easily.
- The electrical parameters (voltage and current intensity) and the travel speed are of great importance in the morphology of the parts because they are significant factors responsible for the heat input in each zone and the distribution of the material.
- The accumulation of heat in the parts is the leading cause of deformations, producing lower height gains and greater width than estimated. Improving heat dissipation will improve the final shape of the manufactured parts.
- Intermediate cooling in welding significantly improves the results obtained, providing structures with more uniform dimensions, smaller widths and higher layer growth.
- The inclination of the pieces of walls significantly affected the growth obtained for each bead and its width and uniformity, generating minor imperfections at the bottom of the pieces because of gravity.
- The use of the WAAM method makes it possible to manufacture inclined structures effectively without the need to move the base parts or use additional supports, making it especially useful for medium and large parts with complex shapes.
- Influence of gravity on inclined structures of different materials with different densities, such as aluminum, brass and titanium. The authors are currently preparing specimens with different geometries and other materials such as 5356 aluminum. Experiments are also being prepared with specimens with 2319 aluminum in an installation consisting of a Kuka kr16 robot and a Fronius welding system.
- Influence of the inclination on the microstructure of the parts, hardness, residual stresses, and other mechanical characteristics. WAAM should be carefully researched in terms of microstructure and the porosity of the manufactured pieces. This is especially critical when tight mechanical requirements must be met. Work is currently underway on mechanical characterization by creating tensile test specimens and comparing the number of porous obtained by computer tomography. Significant samples will be submitted for metallographic testing to study the microstructure.
- Forced cooling strategies using refrigerated bases, controlled atmospheres or gas jets, which could shorten the processing time and partially control the distribution of the molten material. Future work will take into account the thermographic measurements made with a FLIR thermal imaging camera. The cooling systems are currently under study.
Author Contributions
Funding
Institutional Review Board Statement
Informed Consent Statement
Data Availability Statement
Acknowledgments
Conflicts of Interest
References
- Sartal, A.; Carou, D.; Davim, J.P. Enabling Technologies for the Successful Deployment of Industry 4.0, 1st ed.; CRC Press: Taylor & Francis Group: Boca Raton, FL, USA, 2020; 144p. [Google Scholar]
- Liu, G.; Zhang, X.; Chen, X.; He, Y.; Cheng, L.; Huo, M.; Yin, J.; Hao, F.; Chen, S.; Wang, P.; et al. Additive Manufacturing of Structural Materials. Mater. Sci. Eng. R Rep. 2021, 145, 100596. [Google Scholar] [CrossRef]
- Du Plessis, A.; Razavi, S.M.J.; Benedetti, M.; Murchio, S.; Leary, M.; Watson, M.; Bhate, D.; Berto, F. Properties and Applications of Additively Manufactured Metallic Cellular Materials: A Review. Prog. Mater. Sci. 2022, 125, 100918. [Google Scholar] [CrossRef]
- ISO/ASTM International ISO/ASTM 52900:2021(E). Additive Manufacturing–General Principles–Fundamentals and Vocabulary. ASTM International: West Conshohocken, PA, USA, 2021.
- Ahn, D.G. Directed Energy Deposition (DED) Process: State of the Art. Int. J. Precis. Eng. Manuf. Green Technol. 2021, 8, 703–742. [Google Scholar] [CrossRef]
- Singh, S.R.; Khanna, P. Wire Arc Additive Manufacturing (WAAM): A New Process to Shape Engineering Materials. Mater. Today Proc. 2021, 44, 118–128. [Google Scholar] [CrossRef]
- Yu, L.; Chen, K.; Zhang, Y.; Liu, J.; Yang, L.; Shi, Y. Microstructures and mechanical properties of NiTi shape memory alloys fabricated by wire arc additive manufacturing. J. Alloys Compd. 2022, 892, 162193. [Google Scholar] [CrossRef]
- Chaturvedi, M.; Scutelnicu, E.; Rusu, C.C.; Mistodie, L.R.; Mihailescu, D.; Subbiah, A.V. Wire Arc Additive Manufacturing: Review on Recent Findings and Challenges in Industrial Applications and Materials Characterization. Metals 2021, 11, 939. [Google Scholar] [CrossRef]
- ISO/TC 261; ISO 17296-2:2015 Additive Manufacturing—General Principles—Overview of Process Categories and Feedstock. Organization for Standardization: Geneva, Switzerland, 2015; Revised in 2020.
- Jafari, D.; Vaneker, T.H.J.; Gibson, I. Wire and arc additive manufacturing: Opportunities and challenges to control the quality and accuracy of manufactured parts. Mater. Des. 2021, 202, 109471. [Google Scholar] [CrossRef]
- Rosli, N.A.; Alkahari, M.R.; Abdollah, M.F.; Maidin, S.; Ramli, F.R.; Herawan, S.G. Review on effect of heat input for wire arc additive manufacturing process. J. Mater. Res. Technol. 2021, 11, 2127–2145. [Google Scholar] [CrossRef]
- Liu, Z.; Zhao, D.; Wang, P.; Yan, M.; Yang, C.; Chen, Z.; Lu, J.; Lu, Z. Additive manufacturing of metals: Microstructure evolution and multistage control. J. Mater. Sci. Technol. 2022, 100, 224–236. [Google Scholar] [CrossRef]
- Lunetto, V.; Galati, M.; Settineri, L.; Iuliano, L. Unit Process Energy Consumption Analysis and Models for Electron Beam Melting (EBM): Effects of Process and Part Designs. Addit. Manuf. 2020, 33, 101115. [Google Scholar] [CrossRef]
- Tomar, B.; Shiva, S.; Nath, T. A review on wire arc additive manufacturing: Processing parameters, defects, quality improvement and recent advances. Mater. Today Commun. 2022, 31, 103739. [Google Scholar] [CrossRef]
- Tabernero, I.; Paskual, A.; Álvarez, P.; Suárez, A. Study on Arc Welding Processes for High Deposition Rate Additive Manufacturing. Procedia CIRP 2018, 68, 358–362. [Google Scholar]
- Singh, S.; Sharma, S.K.; Rathod, D.W. A Review on Process Planning Strategies and Challenges of WAAM. Mater. Today Proc. 2020, 47, 6564–6575. [Google Scholar] [CrossRef]
- Zhang, C.; Gao, M.; Zeng, X. Workpiece Vibration Augmented Wire Arc Additive Manufacturing of High Strength Aluminum Alloy. J. Mater. Processing Technol. 2019, 271, 85–92. [Google Scholar] [CrossRef]
- Chen, X.; Su, C.; Wang, Y.; Siddiquee, A.N.; Konovalov, S.; Jayalakshmi, S.; Singh, R.A. Cold Metal Transfer (CMT) Based Wire and Arc Additive Manufacture (WAAM) System. J. Surf. Investig. X-ray Synchrotron Neutron Tech. 2018, 12, 1278–1284. [Google Scholar] [CrossRef]
- Yang, Q.; Xia, C.; Deng, Y.; Li, X.; Wang, H. Microstructure and Mechanical Properties of AlSi7Mg0.6 Aluminum Alloy Fabricated by Wire and Arc Additive Manufacturing Based on Cold Metal Transfer (WAAM-CMT). Materials 2019, 12, 2525. [Google Scholar] [CrossRef] [Green Version]
- Wu, B. A review of the wire arc additive manufacturing of metals: Properties, defects and quality improvement. J. Manuf. Processes 2018, 35, 127–139. [Google Scholar] [CrossRef]
- Ryan, E.M.; Sabin, T.J.; Watts, J.F.; Whiting, M.J. The Influence of Build Parameters and Wire Batch on Porosity of Wire and Arc Additive Manufactured Aluminium Alloy 2319. J. Mater. Processing Technol. 2018, 262, 577–584. [Google Scholar] [CrossRef]
- Al-Nabulsi, Z.; Mottram, J.T.; Gillie, M.; Kourra, N.; Williams, M.A. Mechanical and X Ray Computed Tomography Characterisation of a WAAM 3D Printed Steel Plate for Structural Engineering Applications. Constr. Build. Mater. 2021, 274, 121700. [Google Scholar] [CrossRef]
- Rodrigues, T.A.; Duarte, V.R.; Miranda, R.M.; Santos, T.G.; Oliveira, J.P. Ultracold-Wire and Arc Additive Manufacturing (UC-WAAM). J. Mater. Processing Technol. 2021, 296, 117196. [Google Scholar] [CrossRef]
- Lockett, H.; Ding, J.; Williams, S.; Martina, F. Design for Wire + Arc Additive Manufacture: Design Rules and Build Orientation Selection. J. Eng. Des. 2017, 28, 568–598. [Google Scholar] [CrossRef] [Green Version]
- Khan, A.U.; Madhukar, Y.K. Effects of Pillar-Based Substrate on the Wire Arc Additive Manufacturing Process. Int. J. Precis. Eng. Manuf. 2021, 22, 1311–1321. [Google Scholar] [CrossRef]
- Nagasai, B.P.; Malarvizhi, S.; Balasubramanian, V. Mechanical Properties of Wire Arc Additive Manufactured Carbon Steel Cylindrical Component Made by Gas Metal Arc Welding Process. J. Mech. Behav. Mater. 2021, 30, 188–198. [Google Scholar] [CrossRef]
- Venturini, G.; Montevecchi, F.; Scippa, A.; Campatelli, G. Optimization of WAAM Deposition Patterns for T-Crossing Features. Procedia CIRP 2016, 55, 95–100. [Google Scholar] [CrossRef] [Green Version]
- Nagamatsu, H.; Sasahara, H.; Mitsutake, Y.; Hamamoto, T. Development of a Cooperative System for Wire and Arc Additive Manufacturing and Machining. Addit. Manuf. 2020, 31, 100896. [Google Scholar] [CrossRef]
- Liu, B.; Shen, H.; Zhou, Z.; Jin, J.; Fu, J. Research on Support-Free WAAM Based on Surface/Interior Separation and Surface Segmentation. J. Mater. Processing Technol. 2021, 297, 117240. [Google Scholar] [CrossRef]
- ISO 14175; Welding Consumables-Gases and Gas Mixtures for Fusion Welding and Allied Processes. International Organization for Standardization: Geneva, Switzerland, 2008; Revised in 2017.
- González, J.; Rodríguez, I.; Prado-Cerqueira, J.-L.; Diéguez, J.L.; Pereira, A. Additive Manufacturing with GMAW Welding and CMT Technology. Procedia Manuf. 2017, 13, 840–847. [Google Scholar] [CrossRef]
- Fronius. Operating Instructions: TransSteel 3500 Syn and 5000 Syn. Available online: https://www.fronius.com/~/downloads/Perfect%20Welding/Operating%20Instructions/42%2C0426%2C0076%2CEN.pdf (accessed on 10 July 2022).
- Lin, Z.; Song, K.; Yu, X. A Review on Wire and Arc Additive Manufacturing of Titanium Alloy. J. Manuf. Processes 2021, 70, 24–45. [Google Scholar] [CrossRef]
- Aldalur, E.; Suárez, A.; Veiga, F. Metal Transfer Modes for Wire Arc Additive Manufacturing Al-Mg Alloys: Influence of Heat Input in Microstructure and Porosity. J. Mater. Processing Technol. 2021, 297, 117271. [Google Scholar] [CrossRef]
- Pepe, N.; Egerland, S.; Colegrove, P.A.; Yapp, D.; Leonhartsberger, A.; Scotti, A. Measuring the Process Efficiency of Controlled Gas Metal Arc Welding Processes. Sci. Technol. Weld. Join. 2011, 16, 412–417. [Google Scholar] [CrossRef] [Green Version]
- Nagasai, B.P.; Malarvizhi, S.; Balasubramanian, V. Effect of Welding Processes on Mechanical and Metallurgical Characteristics of Carbon Steel Cylindrical Components Made by Wire Arc Additive Manufacturing (WAAM) Technique. CIRP J. Manuf. Sci. Technol. 2022, 36, 100–116. [Google Scholar] [CrossRef]
- Lehmann, T.; Jain, A.; Jain, Y.; Stainer, H.; Wolfe, T.; Henein, H.; Qureshi, A.J. Concurrent Geometry- and Material-Based Process Identification and Optimization for Robotic CMT-Based Wire Arc Additive Manufacturing. Mater. Des. 2020, 194, 108841. [Google Scholar] [CrossRef]
- Wang, C.; Zhu, P.; Lu, Y.H.; Shoji, T. Effect of Heat Treatment Temperature on Microstructure and Tensile Properties of Austenitic Stainless 316L Using Wire and Arc Additive Manufacturing. Mater. Sci. Eng. A 2022, 832, 142446. [Google Scholar] [CrossRef]
- Blateyron, F.; Leroy, B. Optimal Characterisation of Profile Features. Surf. Topogr. Metrol. Prop. 2021, 9, 015001. [Google Scholar] [CrossRef]
- ISO 25178-2:2012; Geometrical Product Specifications (GPS)—Surface Texture: Areal—Part 2: Terms, Definitions and Surface Texture Parameters. International Organization for Standardization: Geneva, Switzerland, 2012; Revised in 2021.
- Ron, T.; Levy, G.K.; Dolev, O.; Leon, A.; Shirizly, A.; Aghion, E. Environmental Behavior of Low Carbon Steel Produced by a Wire Arc Additive Manufacturing Process. Metals 2019, 9, 888. [Google Scholar] [CrossRef] [Green Version]
- Ron, T.; Levy, G.K.; Dolev, O.; Leon, A.; Shirizly, A.; Aghion, E. The Effect of Microstructural Imperfections on Corrosion Fatigue of Additively Manufactured ER70S-6 Alloy Produced by Wire Arc Deposition. Metals 2020, 10, 98. [Google Scholar] [CrossRef] [Green Version]
- Bartkowiak, T.; Mendak, M.; Mrozek, K.; Wieczorowski, M. Analysis of Surface Microgeometry Created by Electric Discharge Machining. Materials 2020, 13, 3830. [Google Scholar] [CrossRef]
- Pawlus, P.; Reizer, R.; Wieczorowski, M. Analysis of Surface Texture of Plateau-Honed Cylinder Liner—A Review. Precis. Eng. 2021, 72, 807–822. [Google Scholar] [CrossRef]
- Xia, C.; Pan, Z.; Polden, J.; Li, H.; Xu, Y.; Chen, S.; Zhang, Y. A Review on Wire Arc Additive Manufacturing: Monitoring, Control and a Framework of Automated System. J. Manuf. Syst. 2020, 57, 31–45. [Google Scholar] [CrossRef]
- Leach, R.; Thompson, A.; Senin, N.; Maskery, I.A. Metrology Horror Story: The Additive Surface. In Proceedings of the ASPEN/ASPE Spring Topical Meeting on Manufacture and Metrology of Structured and Freeform Surfaces for Functional Applications, Hong Kong, China, 14–17 March 2017. [Google Scholar]
- Wieczorowski, M.; Iglesias, Y.; Pereira, A.; Gapiński, B.; Budzik, G.; Diering, M. Comparison of Measurements Realized on Computed Tomograph and Optical Scanners for Elements Manufactured by Wire Arc Additive Manufacturing. In Advance in Manufacturing III; Springer: Cham, Switzerland, 2022; pp. 127–141. [Google Scholar]
- Pawlus, P.; Reizer, R.; Wieczorowski, M. Functional Importance of Surface Texture Parameters. Materials 2021, 14, 5326. [Google Scholar] [CrossRef]
- Pagani, L.; Townsend, A.; Zeng, W.; Lou, S.; Blunt, L.; Jiang, X.Q.; Scott, P.J. Towards a New Definition of Areal Surface Texture Parameters on Freeform Surface: Re-Entrant Features and Functional Parameters. Meas. J. Int. Meas. Confed. 2019, 141, 442–459. [Google Scholar] [CrossRef]


| Sample | Weld Process | Intensity (A) | Voltage (V) | Wire Feed (mm/min) | Travel Speed (mm/s) | Heat Input (kJ/mm) |
|---|---|---|---|---|---|---|
| 1 | Job1 | 60 | 15.4 | 65 | 20 | 0.037 |
| 2 1 | Job1 | 60 | 15.4 | 65 | 20 | 0.037 |
| 3 | Job1 | 60 | 15.4 | 65 | 9 | 0.082 |
| 4 | Job2 | 86 | 16.4 | 85 | 9 | 0.125 |
| 5 | Job2 | 86 | 16.4 | 85 | 6 | 0.188 |
| 6 | Job2 | 86 | 16.4 | 85 | 4 | 0.282 |
| 7 | Job2 | 86 | 16.4 | 85 | 2 | 0.564 |
| Test | Travel Speed (mm/s) | Cooling Time (s) | αn (°) | Path Mode | Layers |
|---|---|---|---|---|---|
| A1 | 9 | 30 | 90 | Go | 5 |
| A2 | 6 | 30 | 90 | Go | 5 |
| A3 | 4 | 30 | 90 | Go | 5 |
| A4 | 2 | 30 | 90 | Go | 5 |
| B1.1 | 6 | 30 | 90 | Modified go | 5 |
| B1.2 | 6 | 30 | 90 | Modified go | 5 |
| B1.3 | 6 | 30 | 90 | Modified go | 5 |
| B2.1 | 4 | 30 | 90 | Modified go | 5 |
| B2.2 | 4 | 30 | 90 | Modified go | 5 |
| C1 | 6 | 30 | 90 | Back and forth | 6 |
| C2 | 4 | 30 | 90 | Back and forth | 6 |
| C3 | 2 | 30 | 90 | Back and forth | 6 |
| D1 | 6 | 0 | 90 | Back and forth | 6 |
| D2 | 4 | 0 | 90 | Back and forth | 6 |
| D3 | 2 | 0 | 90 | Back and forth | 6 |
| E1 | 6 | 0 | 90 | Back and forth | 45 |
| E2 | 6 | 5 | 90 | Back and forth | 45 |
| E3 | 6 | 15 | 90 | Back and forth | 45 |
| E4 | 6 | 30 | 90 | Back and forth | 44 |
| E5 | 6 | 60 | 90 | Back and forth | 36 |
| F1 | 6 | 60 | 60 | Back and forth | 39 |
| F2 | 6 | 60 | 45 | Back and forth | 42 |
| F3 | 6 | 60 | 30 | Back and forth | 45 |
| F4 | 6 | 60 | 0 | Back and forth | 50 |
| Description | Equation | ||
|---|---|---|---|
| Sa (µm) | Arithmetic mean surface height | (2) | |
| Sz (µm) | Maximum height, between the highest peak and the deepest valley | (3) | |
| Ssk | Surface skewness (dimensionless) | (4) | |
| Sku | Surface kurtosis (dimensionless) | (5) |
| Test | Visual Quality Inspection (Good/Poor) | h (mm) | SDh (mm) | w (mm) | SDw (mm) | α (°) |
|---|---|---|---|---|---|---|
| A1 | Poor | - | - | - | - | - |
| A2 | Good | 8.4 | 1.1 | 4.9 | 0.7 | - |
| A3 | Good | 9.6 | 0.9 | 6.4 | 0.8 | - |
| A4 | Good | 13.2 | 0.7 | 9.4 | 0.3 | - |
| B1.1 | Good | 7.7 | 0.7 | 5.6 | 0.5 | - |
| B1.2 | Good | 7.6 | 0.8 | 5.5 | 0.6 | - |
| B1.3 | Good | 7.7 | 1.3 | 5.6 | 1.7 | - |
| B2.1 | Good | 9.5 | 0.8 | 6.6 | 0.4 | - |
| B2.2 | Good | 9.4 | 0.6 | 6.8 | 1.2 | - |
| C1 | Good | 7.3 | 0.5 | 5.6 | 0.8 | - |
| C2 | Good | 9.7 | 0.2 | 7.3 | 0.2 | - |
| C3 | Good | 13.3 | 0.2 | 10.3 | 0.5 | - |
| D1 | Good | 7.2 | 0.3 | 6.3 | 1.0 | - |
| D2 | Good | 9.0 | 0.2 | 7.3 | 1.8 | - |
| D3 | Good | 12.0 | 0.2 | 10.8 | 1.7 | - |
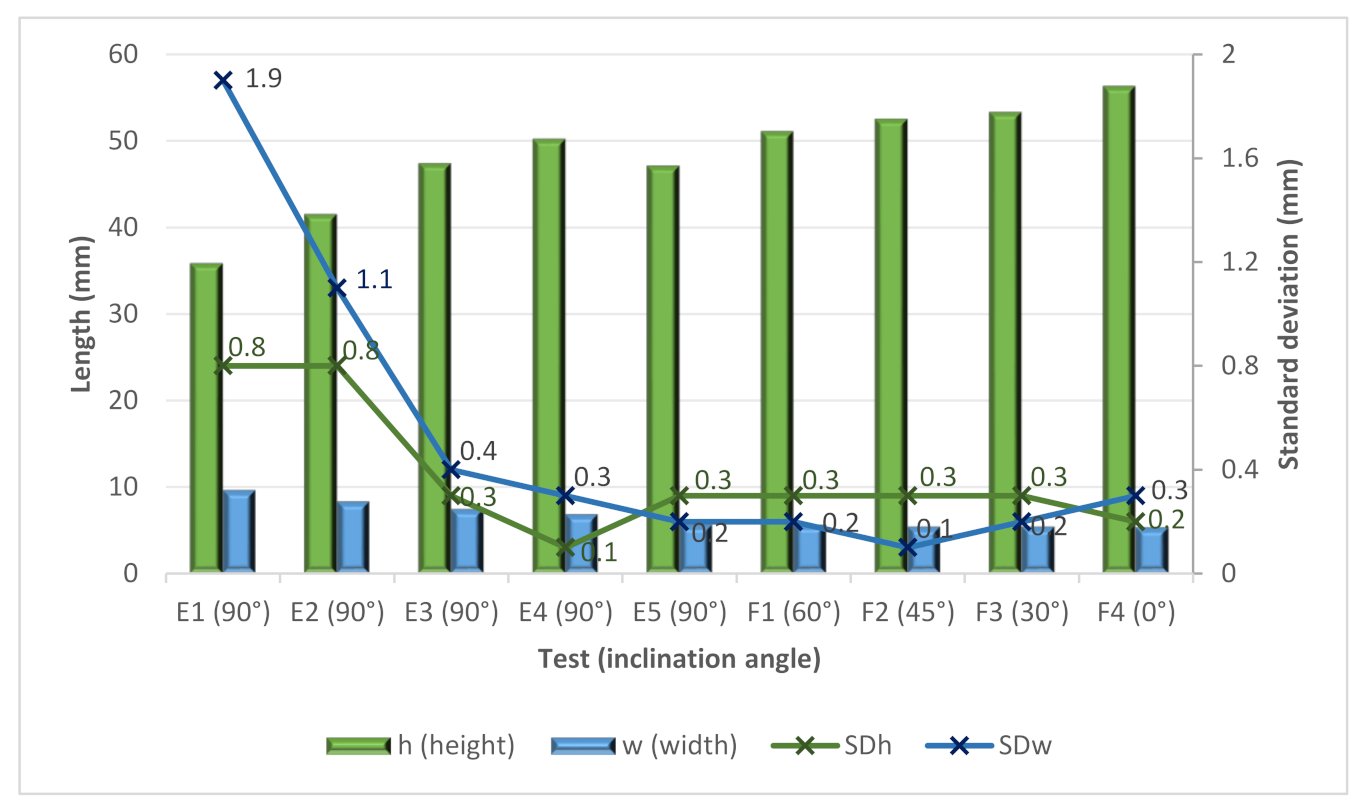
| E1 | Good | 35.8 | 0.8 | 9.6 | 1.9 | 91.3 |
| E2 | Good | 41.5 | 0.8 | 8.3 | 1.1 | 91.5 |
| E3 | Good | 47.4 | 0.3 | 7.4 | 0.4 | 91.4 |
| E4 | Good | 50.2 | 0.1 | 6.8 | 0.3 | 92.4 |
| E5 | Good | 47.1 | 0.3 | 5.6 | 0.2 | 90.3 |
| F1 | Good | 51.1 | 0.3 | 5.6 | 0.2 | 58.1 |
| F2 | Good | 52.5 | 0.3 | 5.4 | 0.1 | 43.8 |
| F3 | Good | 53.3 | 0.3 | 5.4 | 0.2 | 30.1 |
| F4 | Good | 56.3 | 0.2 | 5.3 | 0.3 | 2.49 |
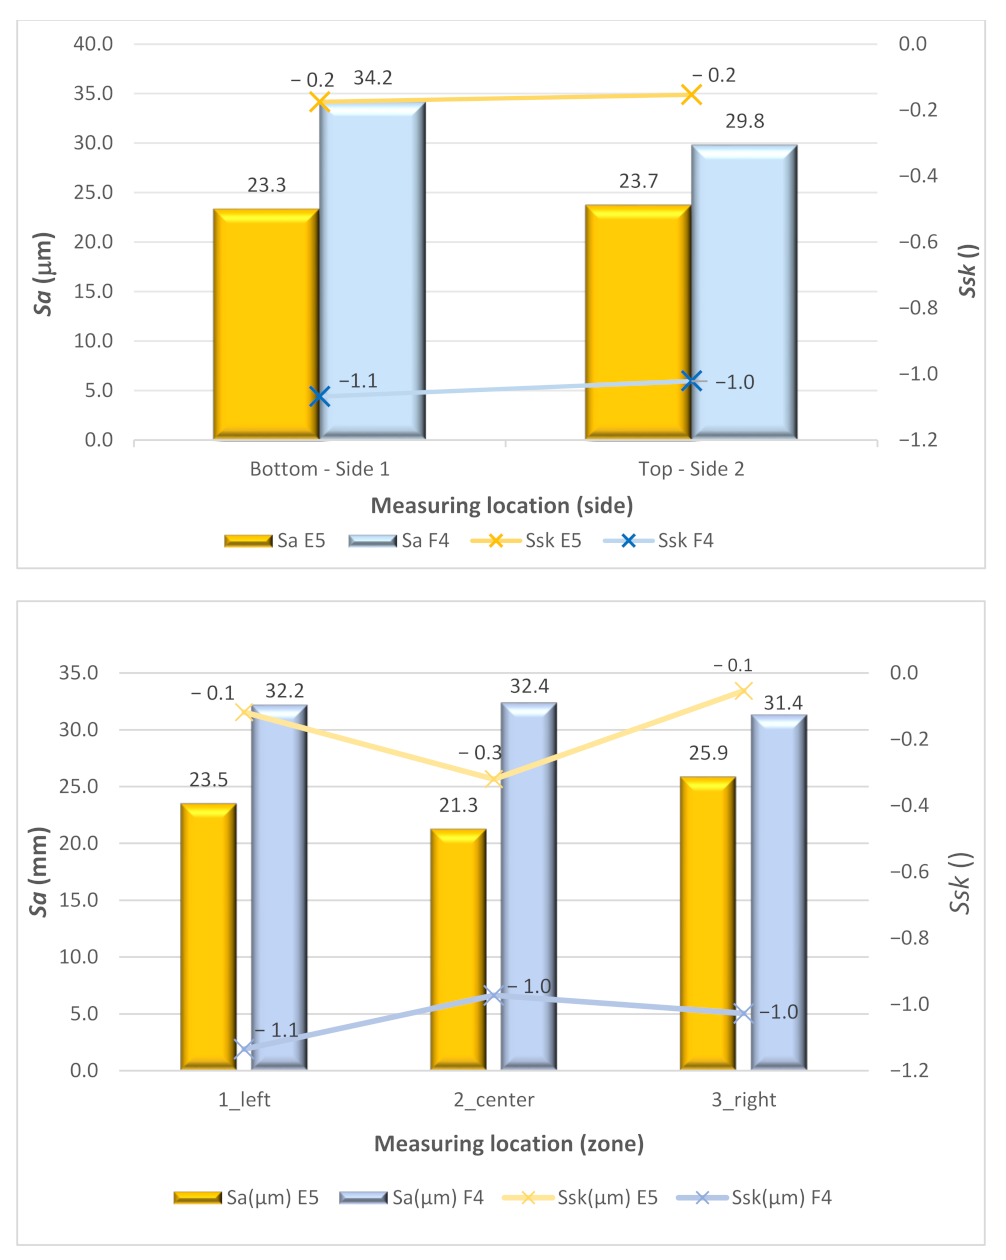
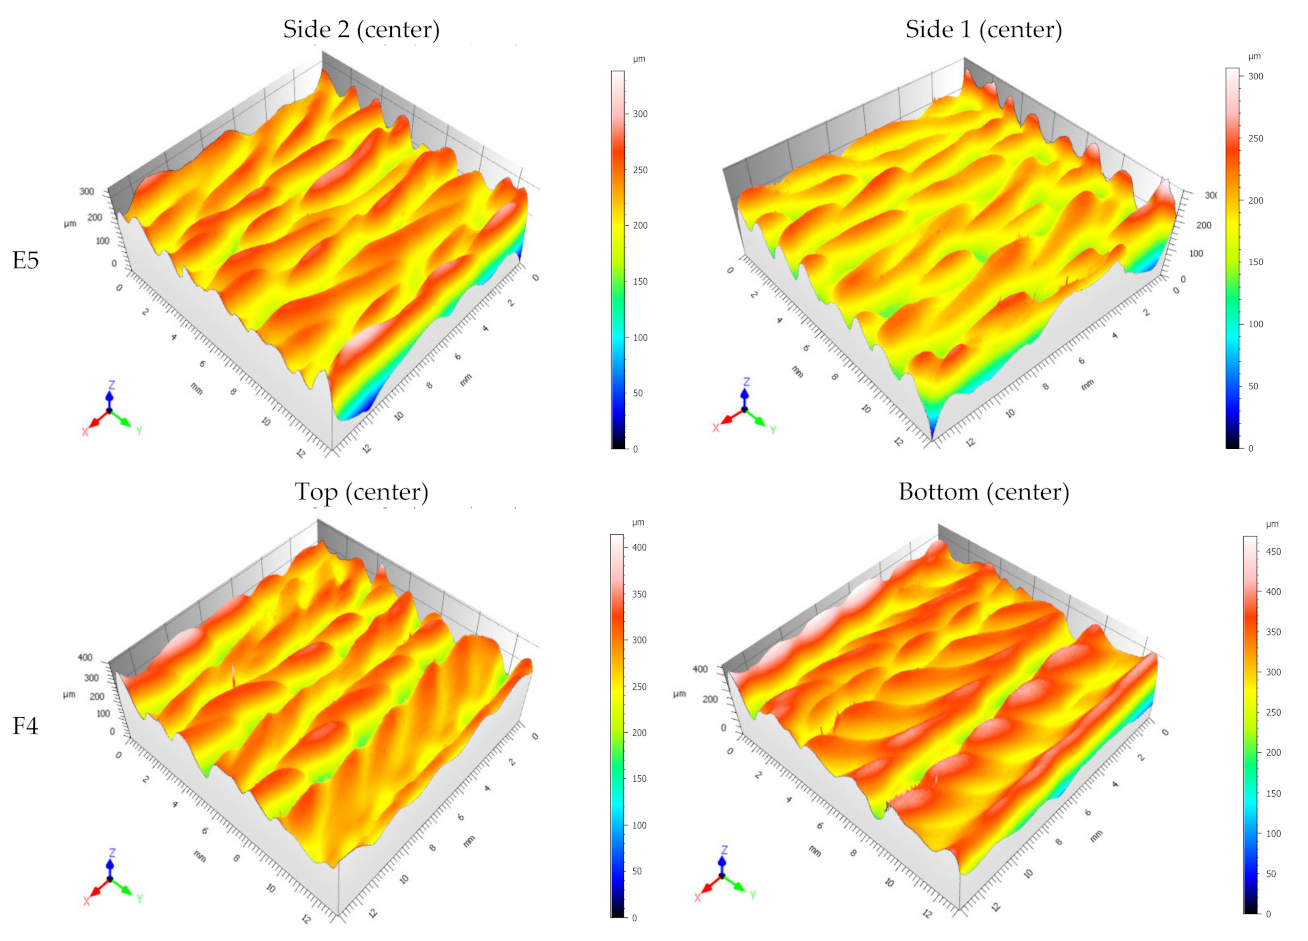
| Sample | Side | Zone | Sa (µm) | Sz (µm) | Ssk | Sku |
|---|---|---|---|---|---|---|
| E5 | Side 1 | 1_left | 24.1 | 429 | 0.0618 | 3.96 |
| E5 | Side 1 | 2_center | 20.3 | 306 | −0.285 | 3.2 |
| E5 | Side 1 | 3_right | 25.6 | 330 | −0.301 | 2.84 |
| E5 | Side 2 | 1_left | 22.9 | 224 | −0.298 | 2.73 |
| E5 | Side 2 | 2_center | 22.2 | 338 | −0.356 | 4.2 |
| E5 | Side 2 | 3_right | 26.1 | 534 | 0.194 | 4.4 |
| F4 | Bottom | 1_left | 33.6 | 707 | −1.02 | 6.97 |
| F4 | Bottom | 2_center | 34.6 | 468 | −0.885 | 6.38 |
| F4 | Bottom | 3_right | 34.3 | 730 | −1.3 | 14.4 |
| F4 | Top | 1_left | 30.8 | 1360 | −1.25 | 16.3 |
| F4 | Top | 2_center | 30.2 | 502 | −1.06 | 9.12 |
| F4 | Top | 3_right | 28.4 | 414 | −0.754 | 4.95 |
Publisher’s Note: MDPI stays neutral with regard to jurisdictional claims in published maps and institutional affiliations. |
© 2022 by the authors. Licensee MDPI, Basel, Switzerland. This article is an open access article distributed under the terms and conditions of the Creative Commons Attribution (CC BY) license (https://creativecommons.org/licenses/by/4.0/).
Share and Cite
Pereira, A.; Carou, D.; Fenollera, M.; Prado, T.; Gapiński, B.; Wieczorowski, M. Experimental Study on the Manufacturing of Steel Inclined Walls by Directed Energy Deposition Based on Dimensional and 3D Surface Roughness Measurements. Materials 2022, 15, 4994. https://doi.org/10.3390/ma15144994
Pereira A, Carou D, Fenollera M, Prado T, Gapiński B, Wieczorowski M. Experimental Study on the Manufacturing of Steel Inclined Walls by Directed Energy Deposition Based on Dimensional and 3D Surface Roughness Measurements. Materials. 2022; 15(14):4994. https://doi.org/10.3390/ma15144994
Chicago/Turabian StylePereira, Alejandro, Diego Carou, María Fenollera, Teresa Prado, Bartosz Gapiński, and Michal Wieczorowski. 2022. "Experimental Study on the Manufacturing of Steel Inclined Walls by Directed Energy Deposition Based on Dimensional and 3D Surface Roughness Measurements" Materials 15, no. 14: 4994. https://doi.org/10.3390/ma15144994
APA StylePereira, A., Carou, D., Fenollera, M., Prado, T., Gapiński, B., & Wieczorowski, M. (2022). Experimental Study on the Manufacturing of Steel Inclined Walls by Directed Energy Deposition Based on Dimensional and 3D Surface Roughness Measurements. Materials, 15(14), 4994. https://doi.org/10.3390/ma15144994