
Structural Performance of EB-FRP-Strengthened RC T-Beams Subjected to Combined Torsion and Shear Using ANN

 ,
,  ,
, 
Abstract
:1. Introduction
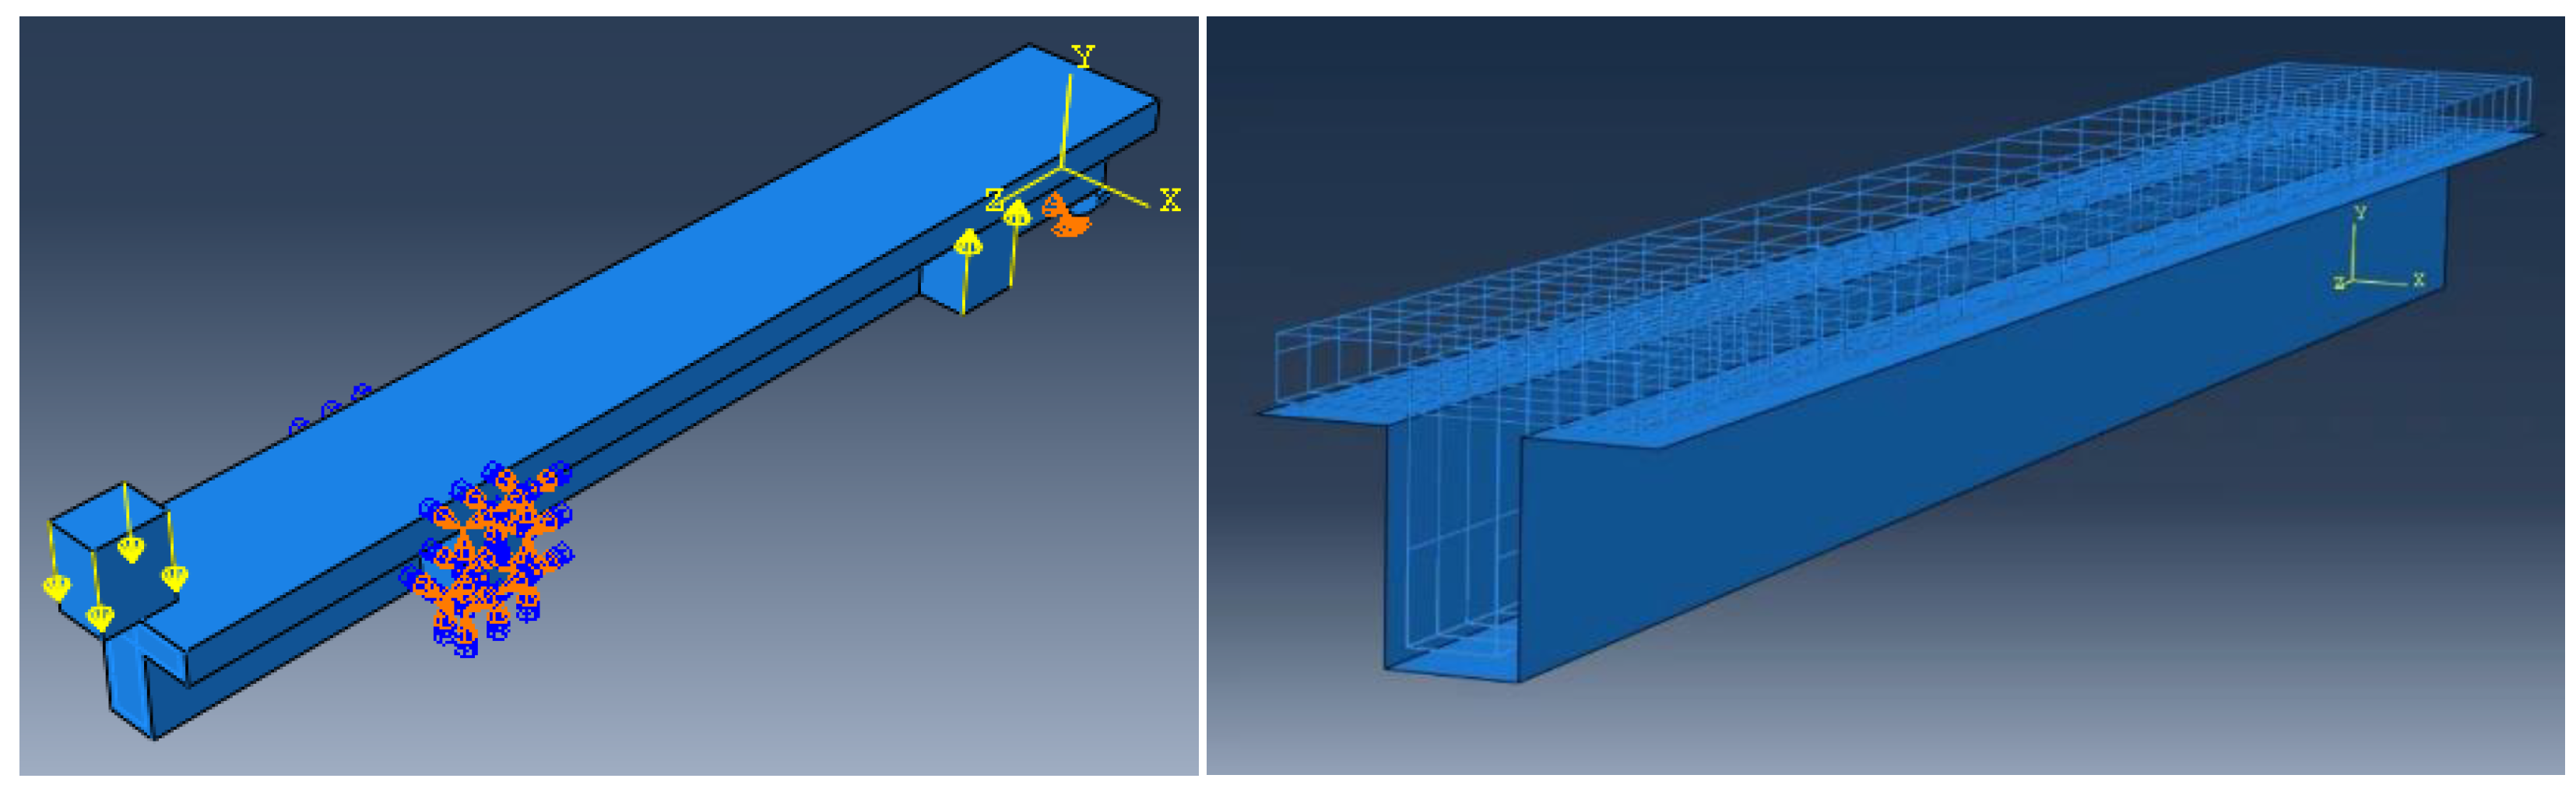
2. Material Modeling and Nonlinear Analysis
3. Results and Discussions
3.1. Evaluation of Strengthened RC T-Beams under Combined Torsion and Shear
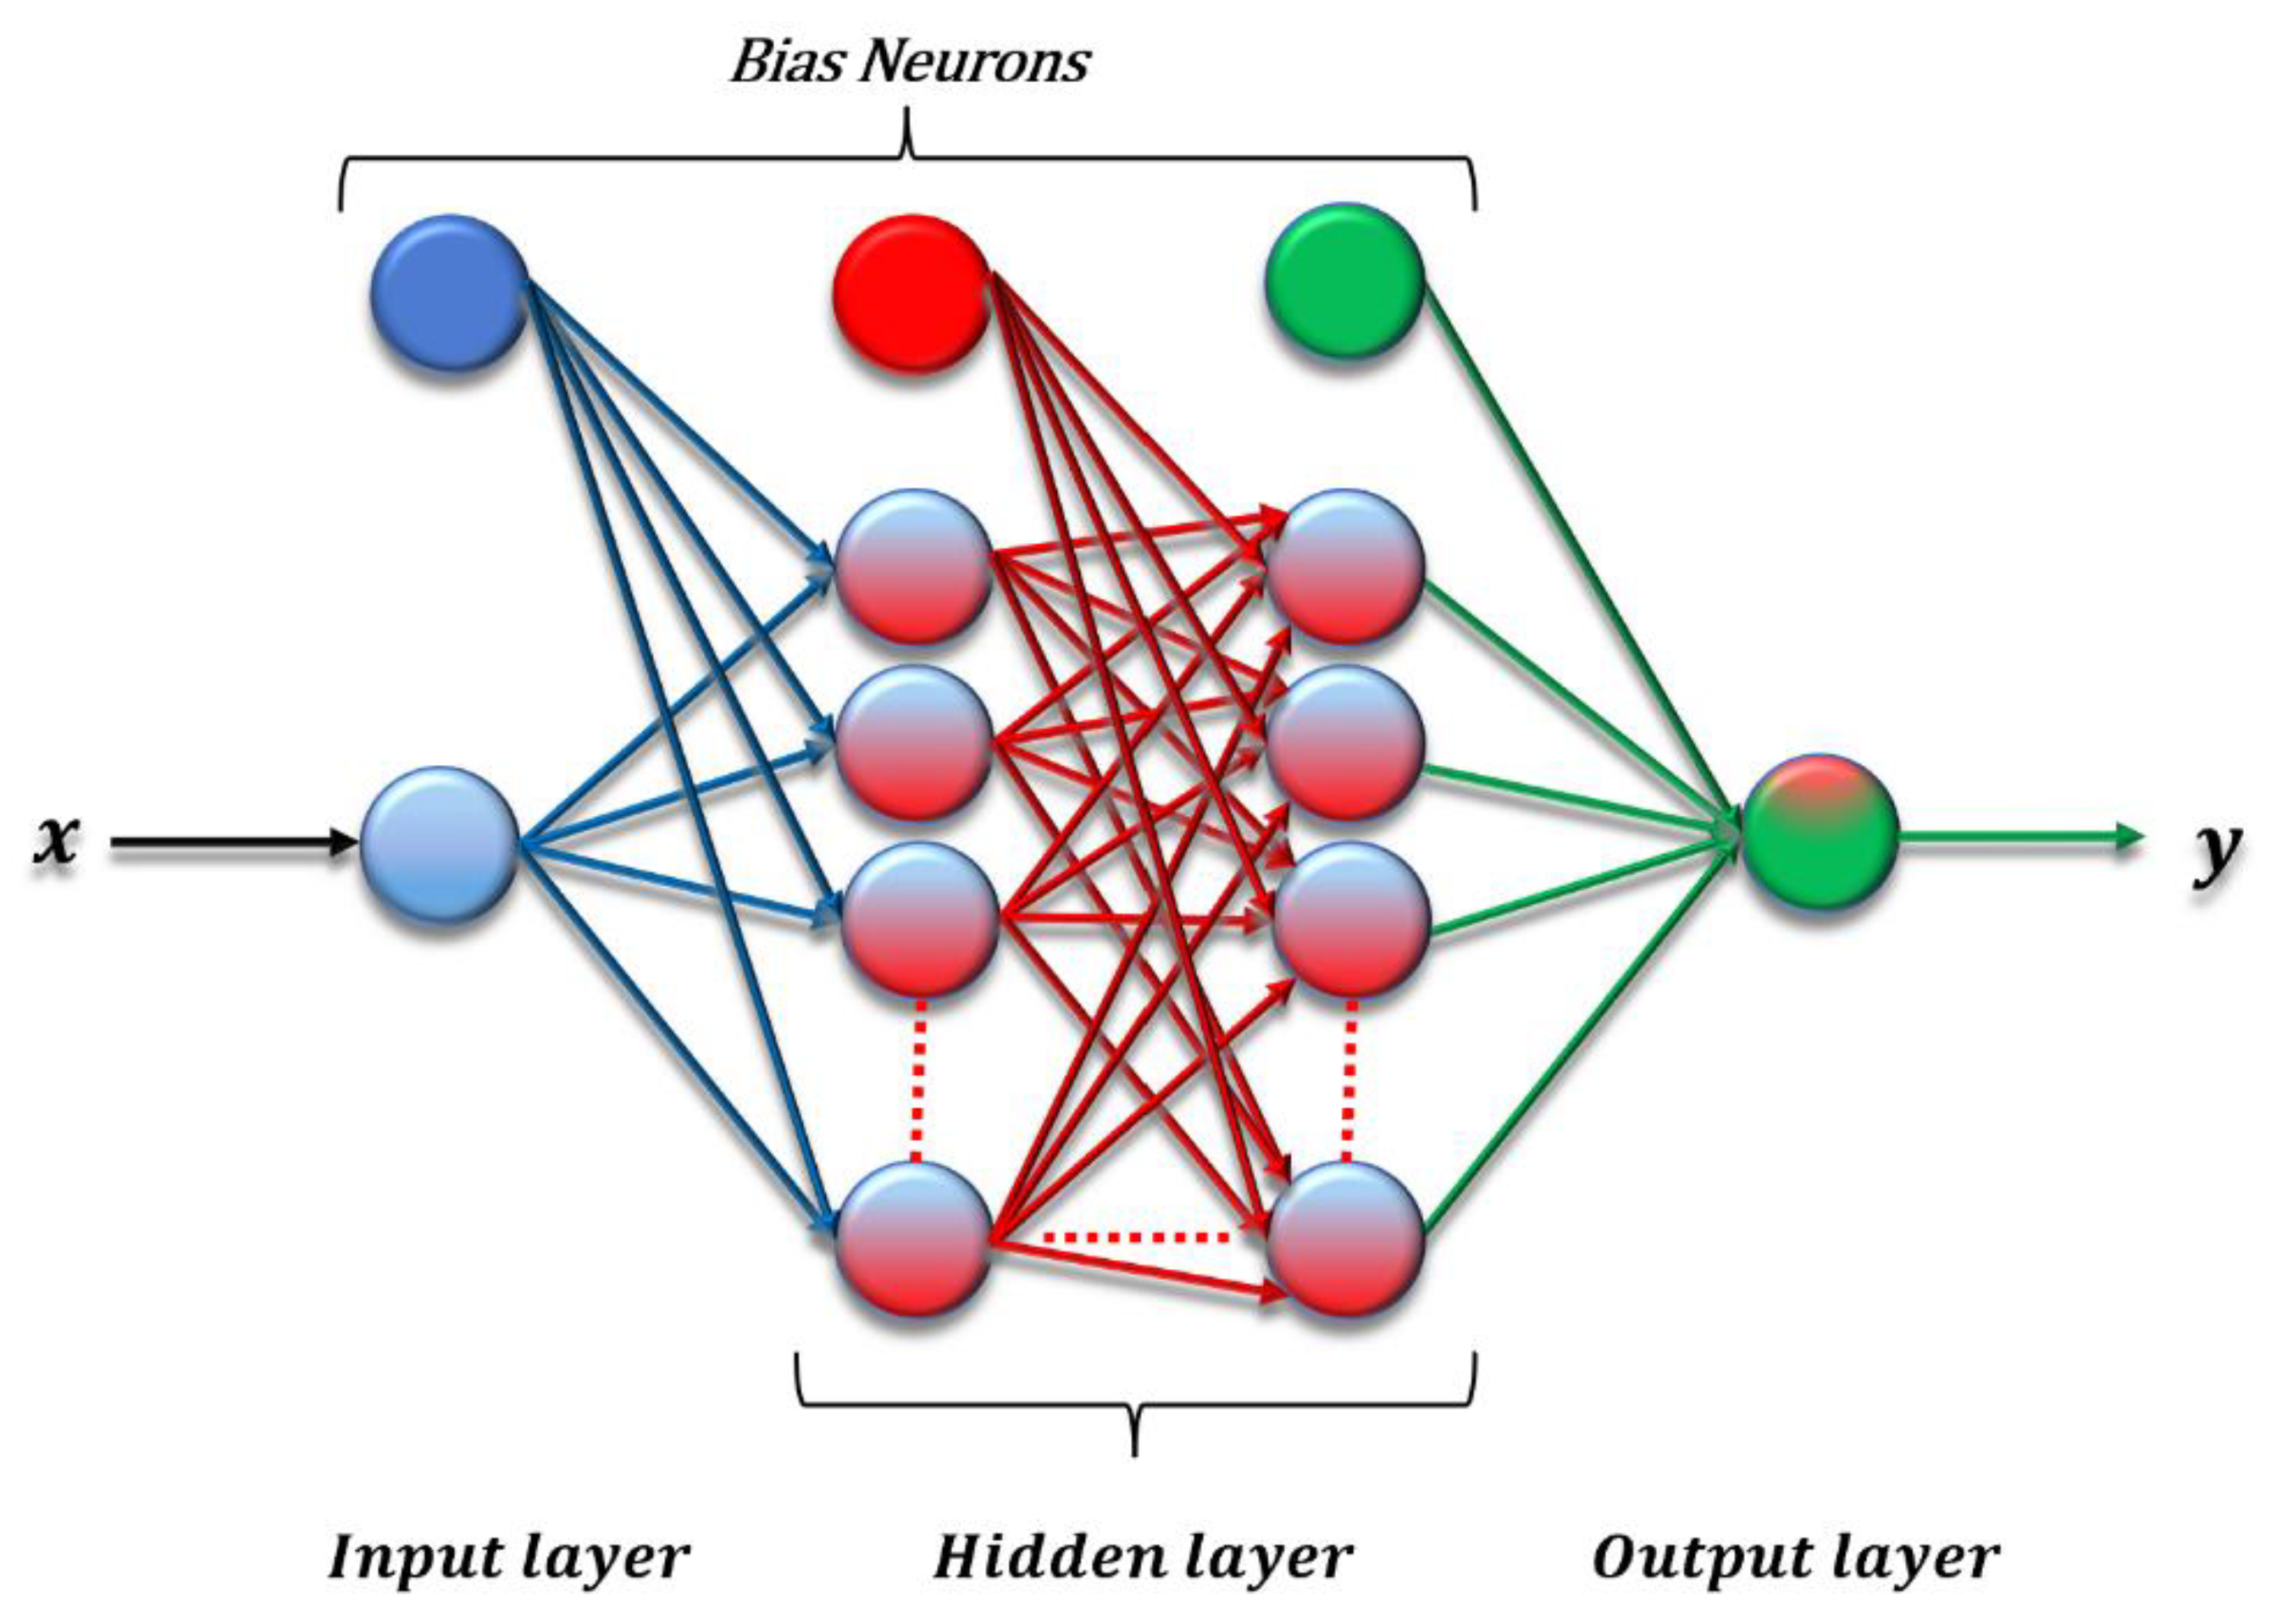
3.2. Application of ANN
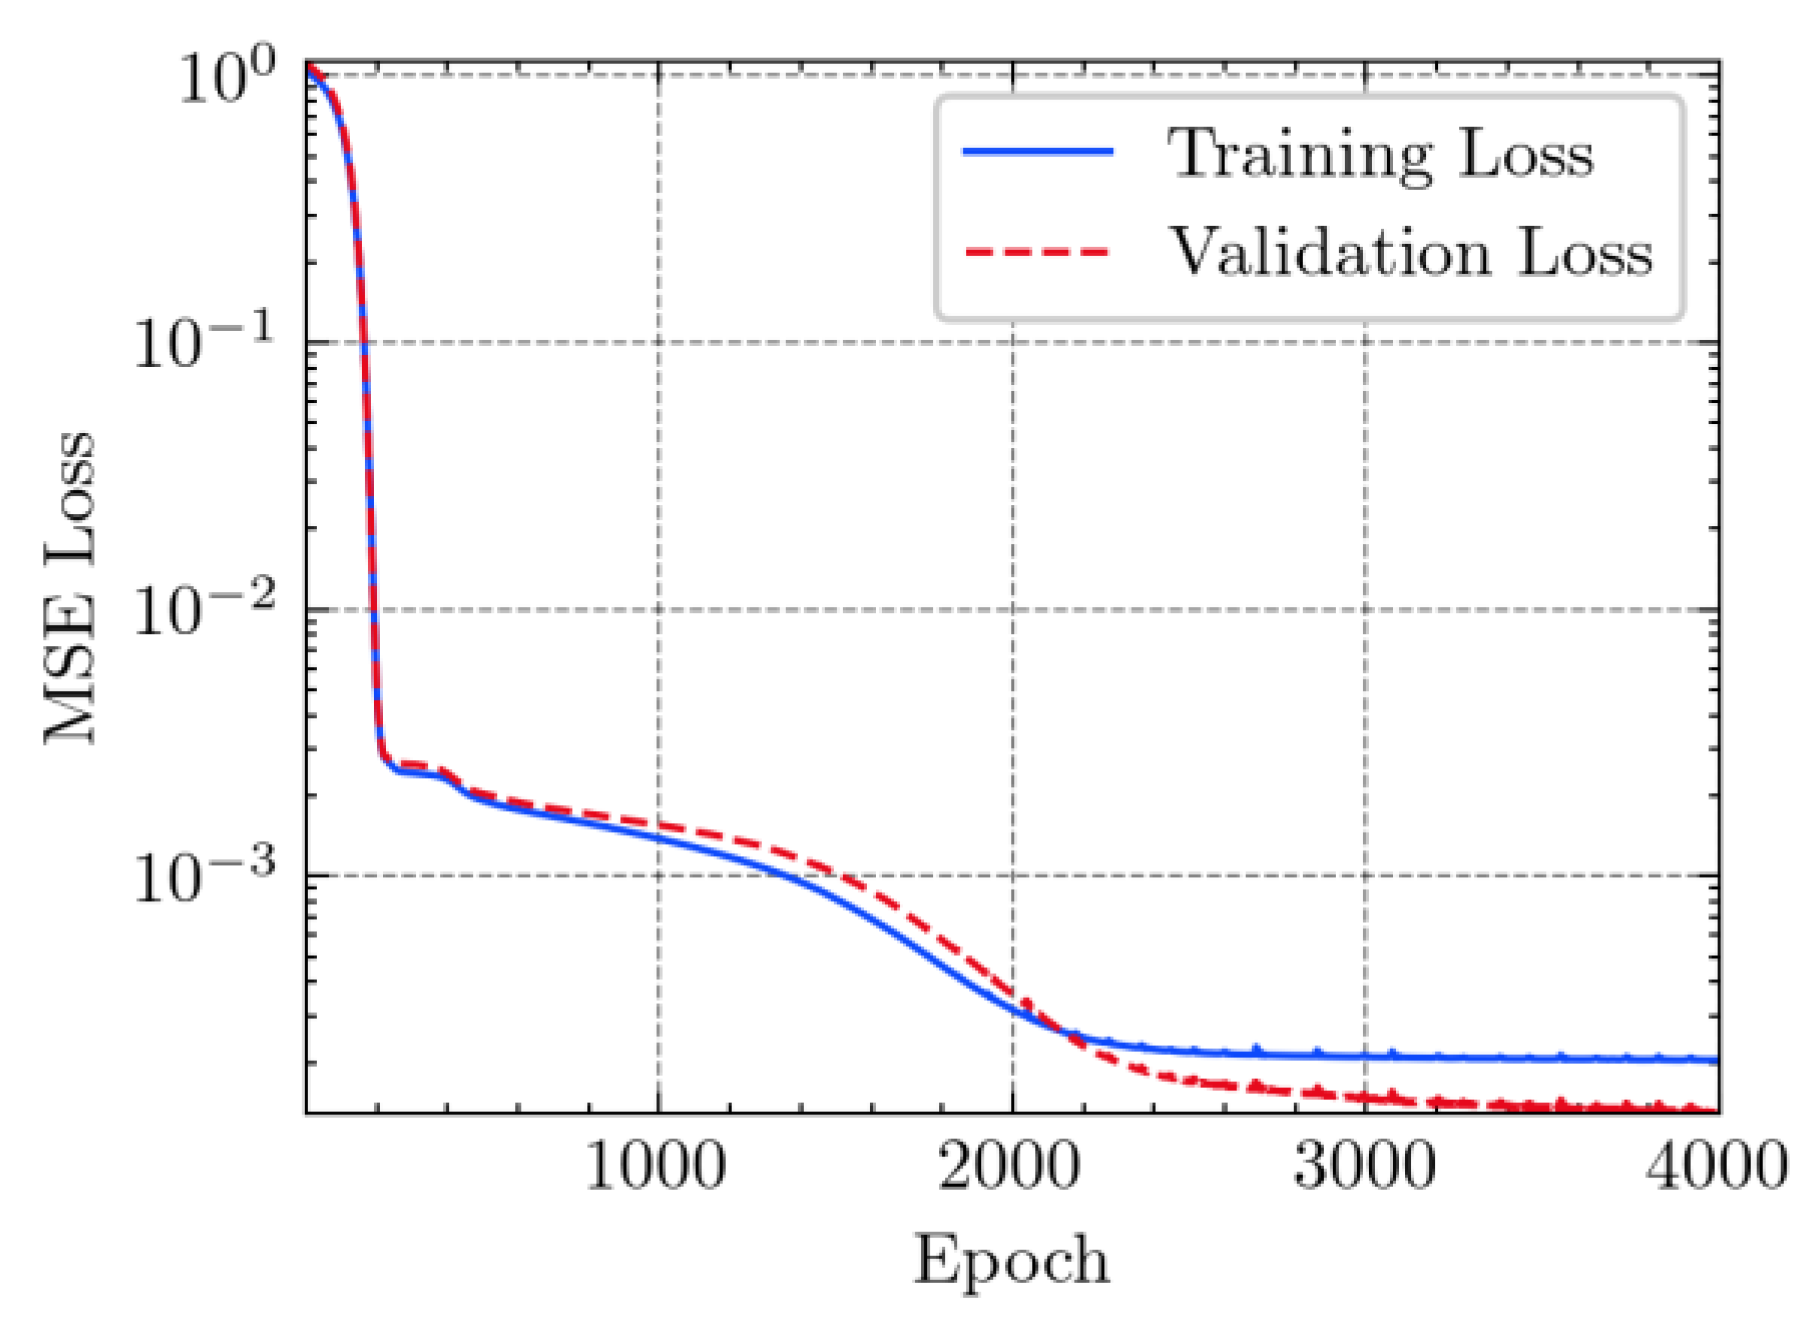
3.3. Model Evaluation Method
3.4. Comparison of ABAQUS and ANN Results
- : the weights between the -th and the -th layers;
- : the biases between the -th and the -th layers;
- : the weight from the -th neuron in the -th layer to the -th neuron in the -th layer;
- : the bias of the -th neuron in the -th layer.
4. Conclusions
- Regarding the figures and tables, numerical cracking torques, ultimate torques, the maximum angle of twist, cracking shear, and ultimate shear values are consistent with the experimental results for all beams.
- According to the numerical results, the ultimate structural strength of EB-FRP-strengthened RC T-beams depends on the volumetric ratio and fiber orientation of the employed FRP materials. For a certain angle of twist, beams with higher torsional reinforcement have greater torsional capacity, increased post-cracking stiffness, and ultimate angle of twist.
- The applications of ANN, MSE, and can evaluate the consistency of experimental and FEM results.
- The resultant values of MSE less than 0.0009 and greater than 0.9960 proved that the developed ANN model of this study fits the data precisely.
- The research methodology presented in this study can be adopted and applied in expensive and time-consuming structural experiments subjected to combined torsion, shear, and bending.
5. Possible Directions for Future Studies
Author Contributions
Funding
Institutional Review Board Statement
Informed Consent Statement
Acknowledgments
Conflicts of Interest
References
- Al-Tamimi, A.K.; Hawileh, R.A.; Abdalla, J.A.; Rasheed, H.A. Effects of ratio of CFRP plate length to shear span and end anchorage on flexural behavior of SCC RC beams. J. Compos. Constr. 2011, 15, 908–919. [Google Scholar] [CrossRef]
- Pham, T.M.; Hadi, M.N.S. Confinement model for FRP confined normal- and highstrength concrete circular columns. Constr. Build. Mater. 2014, 69, 83–90. [Google Scholar] [CrossRef] [Green Version]
- Hawileh, R.A.; Rasheed, H.A.; Abdalla, J.A.; Al-Tamimi, A.K. Behavior of reinforced concrete beams strengthened with externally bonded hybrid fiber reinforced polymer systems. Mater. Des. 2014, 53, 972–982. [Google Scholar] [CrossRef] [Green Version]
- Jalal, M.; Ramezanianpour, A.A. Strength enhancement modeling of concrete cylinders confined with CFRP composites using artificial neural networks. Compos. Part B Eng. 2012, 43, 2990–3000. [Google Scholar] [CrossRef]
- Ali, A.; Abdalla, J.; Hawileh, R.; Galal, K. CFRP mechanical anchorage for externally strengthened RC beams under flexure. Phys. Procedia 2014, 55, 10–16. [Google Scholar] [CrossRef] [Green Version]
- Naser, M.; Hawileh, R.; Abdalla, J.A.; Al-Tamimi, A. Bond behavior of CFRP cured laminates: Experimental and numerical investigation. J. Eng. Mater. Technol. 2012, 134, 21002–21009. [Google Scholar] [CrossRef]
- Salama, A.S.D.; Hawileh, R.A.; Abdalla, J.A. Performance of externally strengthened RC beams with side-bonded CFRP sheets. Compos. Struct. 2019, 212, 281–290. [Google Scholar] [CrossRef]
- Choi, E.; Utui, N.; Kim, H.S. Experimental and analytical investigations on debonding of hybrid FRPs for flexural strengthening of RC beams. Compos. Part B Eng. 2013, 45, 248–256. [Google Scholar] [CrossRef]
- Chen, G.M.; Teng, J.G.; Chen, J.F. Process of debonding in RC beams shear-strengthened with FRP U-strips or side strips. Int. J. Solids Struct. 2012, 49, 1266–1282. [Google Scholar] [CrossRef] [Green Version]
- American Concrete Institute (ACI). Guide for the Design and Construction of Externally Bonded FRP Systems for Strengthening Concrete Structures; ACI 440.2R-08; American Concrete Institute: Farmington Hills, MI, USA, 2008. [Google Scholar]
- Pansuk, W.; Sato, Y. Shear mechanism of reinforced concrete T-Beams with stirrups. J. Adv. Concr. Technol. 2007, 5, 395–408. [Google Scholar] [CrossRef] [Green Version]
- Foster, R.; Brindley, M.; Lees, J.; Ibell, T.; Morley, C.T.; Darby, A.P.; Evernden, M.C. Experimental investigation of reinforced concrete T-Beams strengthened in shear with externally bonded CFRP sheets. J. Compos. Constr. 2017, 21, 04016086. [Google Scholar] [CrossRef] [Green Version]
- Ameli, M.; Ronagh, H.R.; Dux, P.F. Behavior of FRP strengthened reinforced concrete beams under torsion. J. Compos. Constr. 2007, 11, 192–200. [Google Scholar] [CrossRef]
- Chalioris, C.E. Tests and analysis of reinforced concrete beams under torsion retrofitted with FRP strips. Comput. Methods Exp. Meas. XIII 2007, 46, 633–642. [Google Scholar]
- Mohammadizadeh, M.R.; Fadaee, M.J. Experimental investigation on torsional strengthening of high-strength concrete beams using CFRP sheets. Kuwait J. Sci. Eng. 2010, 36, 1–19. [Google Scholar]
- Hii, A.K.Y.; Al-Mahaidi, R. Experimental investigation on torsional behavior of solid and box-section RC beams strengthened with CFRP using photogrammetry. J. Compos. Constr. 2006, 10, 321–329. [Google Scholar] [CrossRef]
- Jing, M.; Raongjant, W.; Li, Z. Torsional strengthening of reinforced concrete box beams using carbon fiber reinforced polymer. Compos. Struct. 2007, 78, 264–270. [Google Scholar] [CrossRef]
- Chalioris, C.E. Torsional strengthening of rectangular and flanged beams using carbon fibre-reinforced-polymers–experimental study. Constr. Build. Mater. 2008, 22, 21–29. [Google Scholar] [CrossRef]
- Deifalla, A.; Ghobarah, A. Strengthening RC T-beams subjected to combined torsion and shear using FRP fabrics: Experimental study. J. Compos. Constr. 2010, 14, 301–311. [Google Scholar] [CrossRef]
- American Concrete Institute (ACI). Guide for the Design and Construction of Externally Bonded FRP Systems for Strengthening Concrete Structures; ACI 440.2R-02; American Concrete Institute (ACI): Detroit, MI, USA, 2002. [Google Scholar]
- Canadian Standards Association. Design and Construction of Building Components with Fiber-Reinforced Polymers; CSA-S806-02; Canadian Standards Association: Rexdale, ON, Canada, 2002. [Google Scholar]
- FIB. Externally Bonded FRP Reinforcement for RC Structures; CEB-FIP Technical Rep. Task Group 9.3; International Federation for Structural Concrete: Lausanne, Switzerland, 2001; Volume 14, 130p. [Google Scholar]
- Hii, A.K.Y.; Al-Mahaidi, R. An experimental and numerical investigation on torsional strengthening of solid and box-section RC beams using CFRP laminates. Compos. Struct. 2006, 75, 213–221. [Google Scholar] [CrossRef]
- Ganganagoudar, A.; Mondal, T.G.; Suriya Prakash, S. Analytical and finite element studies on behavior of FRP strengthened RC beams under torsion. Compos. Struct. 2016, 153, 876–885. [Google Scholar] [CrossRef]
- Zhu, H. Experimental Study and Theoretical Analysis on Torsional Behavior of RC Members Strengthened by CFRP. Master’s Thesis, Southeast of University, Nanjing, China, 2001. [Google Scholar]
- Bernardo, L.; Taborda, C. Softened Truss Model for Reinforced Concrete Beams under Torsion Combined with Axial Force. Appl. Mech. 2020, 1, 79–96. [Google Scholar] [CrossRef] [Green Version]
- Protchenko, K.; Szmigiera, E. Post-Fire Characteristics of Concrete Beams Reinforced with Hybrid FRP Bars. Materials 2020, 13, 1248. [Google Scholar] [CrossRef] [PubMed] [Green Version]
- Salih, R.; Zhou, F.; Abbas, N.; Mastoi, A.K. Experimental Investigation of Reinforced Concrete Beam with Openings Strengthened Using FRP Sheets under Cyclic Load. Materials 2020, 13, 3127. [Google Scholar] [CrossRef] [PubMed]
- Alembagheri, M.; Rashidi, M.; Yazdi, A.; Samali, B. Numerical Analysis of Axial Cyclic Behavior of FRP Retrofitted CHS Joints. Materials 2021, 14, 648. [Google Scholar] [CrossRef]
- Chellapandian, M.; Jain, S.; Prakash, S.S.; Sharma, A. Effect of Cyclic Damage on the Performance of RC Square Columns Strengthened Using Hybrid FRP Composites under Axial Compression. Fibers 2019, 7, 90. [Google Scholar] [CrossRef] [Green Version]
- Daniel, A.P.; Melo, J.; Rossetto, T. Combined Flexural and Shear Strengthening of RC T-Beams with FRP and TRM: Experimental Study and Parametric Finite Element Analyses. Buildings 2021, 11, 520. [Google Scholar] [CrossRef]
- Maher, G.M.; Abdolrasol, S.M.; Hussain, S.; Ustun, T.S.; Sarker, M.R.; Hannan, M.A.; Mohamed, R.; Ali, J.A.; Mekhilef, S.; Milad, A. Artificial Neural Networks Based Optimization Techniques: A Review. Electronics 2021, 10, 2689. [Google Scholar] [CrossRef]
- Milad, A.; Hussein, S.H.; Khekan, A.R.; Rashid, M.; Al-Msari, H.; Tran, T.H. Development of ensemble machine learning approaches for designing fiber-reinforced polymer composite strain prediction model. Eng. Comput. 2021, 1–13. [Google Scholar] [CrossRef]
- Amani, J.; Moeini, R. Prediction of shear strength of reinforced concrete beams using adaptive neuro-fuzzy inference system and artificial neural network. Sci. Iran. A 2012, 19, 242–248. [Google Scholar] [CrossRef] [Green Version]
- Pishro, A.A.; Feng, X.; Ping, Y.; Dengshi, H.; Shirazinejad, R.S. Comprehensive equation of local bond stress between UHPC and reinforcing steel bars. Constr. Build. Mater. 2020, 262, 119942. [Google Scholar] [CrossRef]
- Pishro, A.A.; Feng, X. Experimental and Numerical Study of Nano-Silica Additions on the Local Bond of Ultra-High Performance Concrete and Steel Reinforcing Bar. Civ. Eng. J. 2017, 3, 1339. [Google Scholar] [CrossRef] [Green Version]
- Pishro, A.A.; Feng, X. Experimental Study on Bond Stress between Ultra High Performance Concrete and Steel Reinforcement. Civ. Eng. J. 2017, 3, 1235. [Google Scholar] [CrossRef] [Green Version]
- Pishro, A.A.; Feng, X. RC Beams Behavior Retrofitted by FRP Subjected to Torsion, Shear and Flexure—A Review. IJCSNS Int. J. Comput. Sci. Netw. Secur. 2017, 17, 34. [Google Scholar]
- Pishro, A.A.; Zhang, S.; Huang, D.; Xiong, F.; Li, W.; Yang, Q. Application of artificial neural networks and multiple linear regression on local bond stress equation of UHPC and reinforcing steel bars. Sci. Rep. 2021, 11, 15061. [Google Scholar] [CrossRef]
- Pishro, A.A.; Zhang, S.; Zhang, Z.; Zhao, Y.; Pishro, M.A.; Zhang, L.; Yang, Q.; Postel, V. Structural Behavior of FRP-Retrofitted RC Beams under Combined Torsion and Bending. Materials 2022, 15, 3213. [Google Scholar] [CrossRef]
- ABAQUS User’s Manual Volumes I–V and ABAQUS CAE Manual, Version 6.10.1; Karlsson & Sorensen Hibbitt Inc.: Pawtucket, RI, USA, 2010.
- Hashin, Z. Failure criteria for unidirectional fiber composites. J. Appl. Mech. 1980, 47, 329–334. [Google Scholar] [CrossRef]
- Malm, R. Predicting Shear Type Crack Initiation and Growth in Concrete with Non-Linear Finite Element Method. Ph.D. Thesis, Department of Civil and Architectural Engineering, Royal Institute of Technology (KTH) Stockholm, Stockholm, Sweden, 2009. [Google Scholar]
- ACI Committee 318. Building Code Requirements for Structural Concrete and Commentary (ACI 318-99); American Concrete Institute: Detroit, MI, USA, 1999. [Google Scholar]
- Alfano, G.; Crisfield, M.A. Finite element interface models for the delamination analysis of laminated composites: Mechanical and computational issues. Int. J. Numer. Methods Eng. 2001, 50, 1701–1736. [Google Scholar] [CrossRef]
- Benzeggagh, M.L.; Kenane, M. Measurements of mixed-mode delamination fracture toughness of unidirectional glass/epoxy composites with mixed-mode bending apparatus. Compos. Sci. Technol. 1996, 56, 439–449. [Google Scholar] [CrossRef]
- Obaidat, Y.T.; Heyden, S.; Dahlblom, O. The effect of CFRP and CFRP/concrete interface models when modeling retrofitted RC beams with FEM. Compos. Struct. 2010, 92, 1931–1938. [Google Scholar] [CrossRef]
- Harper, P.W.; Hallett, S.R. Cohesive zone length in numerical simulations of composite delamination. Eng. Fract. Mech. 2008, 75, 4774–4792. [Google Scholar] [CrossRef] [Green Version]
- Turon, A.; Dávila, C.G.; Camanho, P.P.; Costa, J. An engineering solution for mesh size effects in the simulation of delamination using cohesive zone models. Eng. Fract. Mech. 2007, 74, 1665–1682. [Google Scholar] [CrossRef]
- Crisfield, M.A.; Wills, J. Solution strategies and softening materials. Comput. Methods Appl. Mech. Eng. 1988, 66, 267–289. [Google Scholar] [CrossRef]
- Zhang, Z.; Matlan, S.J.; Zhang, L.; Wang, H. Experimental and Numerical Analysis Study on Loess-Lime Structures Used for Lateral Antiseepage in Deep Collapsible Ground Embankment. Adv. Civ. Eng. 2021, 2021, 9964852. [Google Scholar] [CrossRef]
- Wang, S.; Manning, C. Fast dropout training. In Proceedings of the 30th International Conference on Machine Learning (ICML-13), Atlanta, GA, USA, 16–21 June 2013; pp. 118–126. [Google Scholar]
- Sutskever, I.; Martens, J.; Dahl, G.; Hinton, G. On the importance of initialization and momentum in deep learning. In Proceedings of the 30th International Conference on Machine Learning (ICML-13), Atlanta, GA, USA, 16–21 June 2013; pp. 1139–1147. [Google Scholar]
- Sohl-Dickstein, J.; Poole, B.; Ganguli, S. Fast large-scale optimization by unifying stochastic gradient and quasi-newton methods. In Proceedings of the 31st International Conference on Machine Learning (ICML-14), Beijing, China, 21–26 June 2014; pp. 604–612. [Google Scholar]
- Moulines, E.; Bach, F. Nonasymptotic analysis of stochastic approximation algorithms for machine learning. Adv. Neural Inf. Process. Syst. 2011, 24, 451–459. [Google Scholar]
- Graves, A.; Mohamed, A.R.; Hinton, G. Speech recognition with deep recurrent neural networks. In Proceedings of the 38th International Conference on Acoustics, Speech, and Signal Processing (ICASSP), Vancouver, BC, Canada, 26–31 May 2013; pp. 6645–6649. [Google Scholar]
- Deng, L.; Li, J.; Huang, J.T.; Yao, K.; Yu, D.; Seide, F.; Gong, Y.; Williams, J.; He, X.; Acero, A.; et al. Recent advances in deep learning for speech research at microsoft. In Proceedings of the 38th International Conference on Acoustics, Speech, and Signal Processing (ICASSP), Vancouver, BC, Canada, 26–31 May 2013. [Google Scholar]
- Raja, M.N.A.; Shukla, S.K. Predicting the settlement of geosynthetic-reinforced soil foundations using evolutionary artificial intelligence technique. Geotext. Geomembr. 2021, 49, 1280–1293. [Google Scholar] [CrossRef]
- Bardhan, A.; Biswas, R.; Kardani, N.; Iqbal, M.; Samui, P.; Singh, M.; Asteris, P.G. A novel integrated approach of augmented grey wolf optimizer and ANN for estimating axial load carrying-capacity of concrete-filled steel tube columns. Constr. Build. Mater. 2022, 337, 127454. [Google Scholar] [CrossRef]

| Beam | Wrapping Configurations | Strengthening Schemes | |
|---|---|---|---|
| TB1 | None (Un-retrofitted beam) | --- | |
| TB1S1 | U-Jacket |  |  |
| TB1S2 | Extended U-Jacket |  |  |
| TB1S3 | Full Wrapping |  |  |
| TB3 | None (Control beam) | --- | |
| TB3S4 | Extended U-Jacket + Full Wrapping |  |  |
| Designation | Combined Effects | Mean Concrete Strength (MPa) | FRP | Torsional Moment at First Crack | Maximum Torsional Resistance | Maximum Shear Resistance |
|---|---|---|---|---|---|---|
| TB1 | Torsion & Shear | 25 | -- | 10.5 | 23 | 44 |
| TB1S1 | Torsion & Shear | 25 | CFRP | 19.5 | 34 | 60 |
| TB1S2 | Torsion & Shear | 25 | CFRP | 14 | 38 | 80 |
| TB1S3 | Torsion & Shear | 25 | CFRP | 18 | 39 | 83 |
| TB3 | Torsion & Shear | 25 | -- | 3 | 10.75 | 109 |
| TB3S4 | Torsion & Shear | 25 | CFRP | 16 | 17.5 | 173 |
| FRP | E | Tensile Strength | Thickness |
|---|---|---|---|
| CFRP | 63,300 | 609 | 0.86 |
| Beam | ||||||
|---|---|---|---|---|---|---|
| TB1 | 10.5 | 23 | 2.6 | 10 | 23.38 | 2.31 |
| TB1S1 | 19.5 | 34 | 1.5 | 17.5 | 33.85 | 1.33 |
| TB1S2 | 14 | 38 | 2.5 | 16 | 39 | 2 |
| TB1S3 | 18 | 39 | 2.5 | 15.5 | 40 | 2 |
| TB3 | 3 | 10.75 | 0.9 | 3.3 | 10.44 | 1.01 |
| TB3S4 | 16 | 17.5 | 8 | 14.5 | 18 | 8.5 |
| Beam | |||
|---|---|---|---|
| TB1 | 0.95 | 1.016 | 0.888 |
| TB1S1 | 0.897 | 0.995 | 0.886 |
| TB1S2 | 1.14 | 1.026 | 0.8 |
| TB1S3 | 0.861 | 1.025 | 0.8 |
| TB3 | 1.1 | 0.971 | 1.12 |
| TB3S4 | 0.906 | 1.028 | 1.062 |
| Beam | ||||||
|---|---|---|---|---|---|---|
| TB1 | 17 | 44 | 16.3 | 42 | 0.959 | 0.95 |
| TB1S1 | 24 | 60 | 28 | 68.7 | 1.16 | 1.14 |
| TB1S2 | 35 | 80 | 33 | 73.03 | 0.94 | 0.91 |
| TB1S3 | 45 | 83 | 38 | 88.4 | 0.84 | 1.06 |
| TB3 | 58 | 109 | 60 | 119.2 | 1.034 | 1.09 |
| TB3S4 | 70 | 173 | 81 | 184.47 | 1.157 | 1.066 |
| Beam | TB1 | 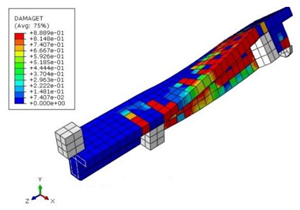 (a) | ||
| Structural Response | Torsion | 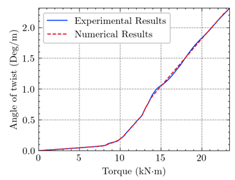 (b) |  (c) |  (d) |
| Shear | 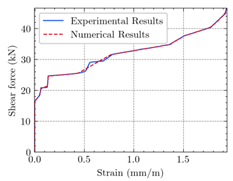 (e) | 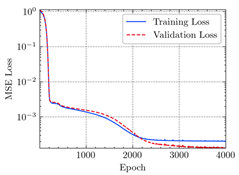 (f) | 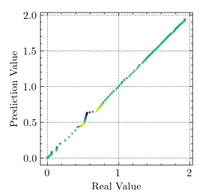 (g) | |
| Beam | TB1S1 | 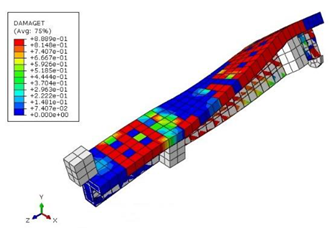 (a) | ||
| Structural Response | Torsion | 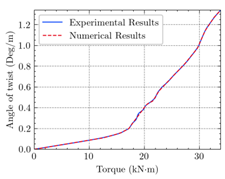 (b) | 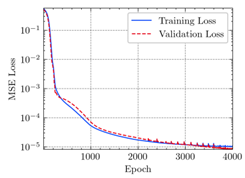 (c) |  (d) |
| Shear | 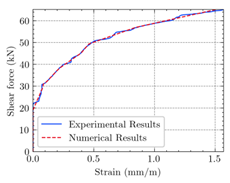 (e) |  (f) | 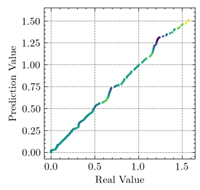 (g) | |
| Beam | TB1S2 |  (a) | ||
| Structural Response | Torsion | 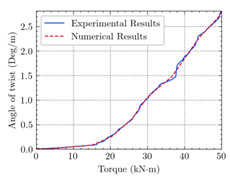 (b) | 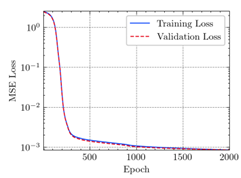 (c) | 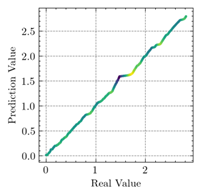 (d) |
| Shear | 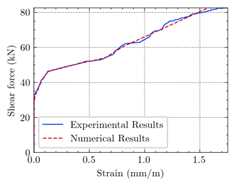 (e) | 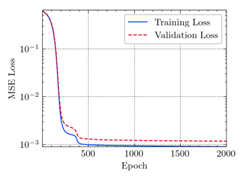 (f) | 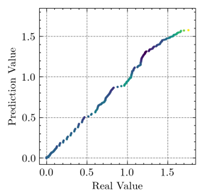 (g) | |
| Beam | TB1S3 | 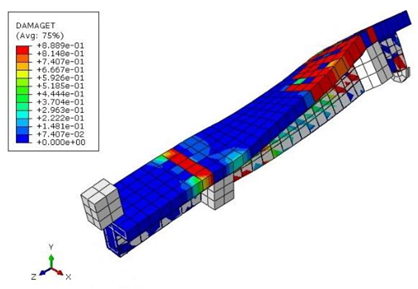 (a) | ||
| Structural Response | Torsion | 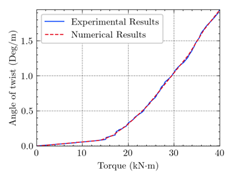 (b) |  (c) | 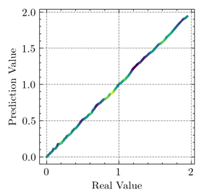 (d) |
| Shear | 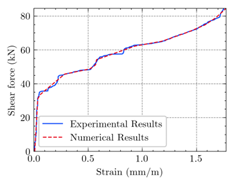 (e) | 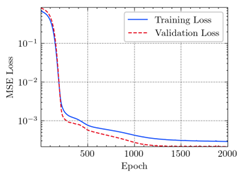 (f) | 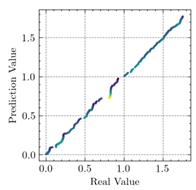 (g) | |
| Beam | TB3 |  (a) | ||
| Structural Response | Torsion | 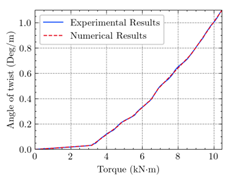 (b) | 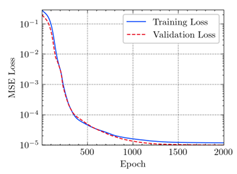 (c) | 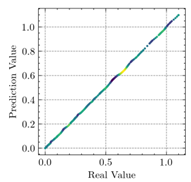 (d) |
| Shear | 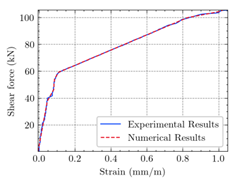 (e) | 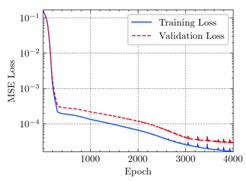 (f) |  (g) | |
| Beam | TB3S4 | 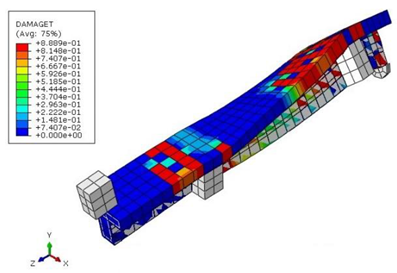 (a) | ||
| Structural Response | Torsion | 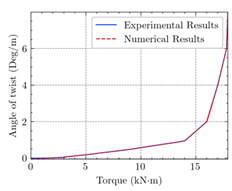 (b) |  (c) | 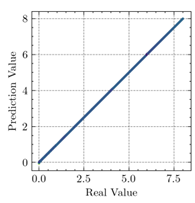 (d) |
| Shear | 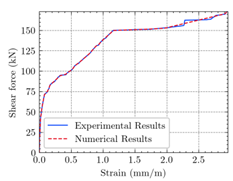 (e) | 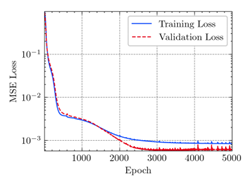 (f) | 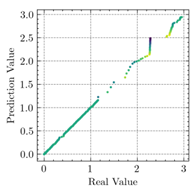 (g) | |
| Structural Loading | Beam Model | Evaluation Index | |||||
|---|---|---|---|---|---|---|---|
| Training Set | Test Set | All Set | |||||
| MSE | R2 | MSE | R2 | MSE | R2 | ||
| Torsion | TB1 | 0.000218 | 0.999584 | 0.000208 | 0.999572 | 0.000216 | 0.999582 |
| TB1S1 | 0.000010 | 0.999942 | 0.000010 | 0.999934 | 0.000010 | 0.999941 | |
| TB1S2 | 0.000855 | 0.998568 | 0.000853 | 0.998567 | 0.000854 | 0.998568 | |
| TB1S3 | 0.000120 | 0.999586 | 0.000113 | 0.999617 | 0.000119 | 0.999592 | |
| TB3 | 0.000012 | 0.999880 | 0.000010 | 0.999861 | 0.000011 | 0.999879 | |
| TB3S4 | 0.000015 | 0.999997 | 0.000017 | 0.999996 | 0.000016 | 0.999997 | |
| Shear | TB1 | 0.000204 | 0.999619 | 0.000130 | 0.999742 | 0.000189 | 0.999643 |
| TB1S1 | 0.000282 | 0.998268 | 0.000196 | 0.998732 | 0.000265 | 0.998359 | |
| TB1S2 | 0.000894 | 0.996909 | 0.001667 | 0.996277 | 0.000949 | 0.996775 | |
| TB1S3 | 0.000291 | 0.999200 | 0.000214 | 0.999500 | 0.000276 | 0.999270 | |
| TB3 | 0.000016 | 0.999808 | 0.000030 | 0.999677 | 0.000019 | 0.999780 | |
| TB3S4 | 0.000846 | 0.998700 | 0.000617 | 0.998963 | 0.000800 | 0.998749 | |
| Layers | Variables | Weights | Biases | ||||||
|---|---|---|---|---|---|---|---|---|---|
| Input Layer– Hidden Layer 1 | 0.9055 | 0.1368 | −2.1926 | 0.3227 | 0.1869 | 0.2014 | 0.2081 | 0.0113 | |
| −0.4744 | −0.5172 | 0.2766 | 0.4934 | 0.2912 | 0.2610 | 0.0833 | −0.1754 | ||
| Hidden Layer 1– Hidden Layer 2 | −0.4782 | −0.2169 | −0.2380 | −0.2013 | |||||
| −0.2345 | 0.5501 | 0.1987 | 0.8133 | ||||||
| 0.3647 | 0.1677 | 0.5850 | 0.5514 | ||||||
| 0.4934 | −0.3571 | 0.1958 | 0.6721 | ||||||
| 0.4643 | −0.9118 | −0.1101 | −0.2964 | ||||||
| −0.5442 | 0.0397 | −1.9594 | 0.9148 | ||||||
| 0.1914 | 0.4342 | −0.0231 | −0.3457 | ||||||
| 0.8302 | −0.8049 | 0.1371 | 0.2899 | 0.0000 | 0.2942 | 0.0000 | 0.2942 | ||
| 0.2652 | −0.0362 | −0.1578 | −0.5761 | 0.1679 | −0.0291 | 0.1679 | −0.0291 | ||
| −0.0078 | 0.6746 | 0.3158 | −1.9715 | ||||||
| 0.1724 | 0.0492 | 0.7593 | −0.0956 | ||||||
| 0.1656 | 0.2187 | 1.2919 | −0.0056 | ||||||
| 0.4801 | 0.4057 | −0.6696 | −0.1514 | ||||||
| 0.4514 | 0.8221 | −0.4599 | 0.4107 | ||||||
| 0.4930 | 0.0647 | 0.5120 | −1.7222 | ||||||
| −0.1700 | −0.4075 | 0.0203 | 0.4248 | ||||||
| Hidden Layer 2– Hidden Layer 3 | −0.0330 | 0.8583 | 0.2370 | −0.5885 | |||||
| 0.2429 | −0.4196 | −0.8351 | −0.1537 | ||||||
| −0.2964 | 0.1166 | −0.0714 | −0.8275 | ||||||
| 0.0003 | 0.2155 | −0.1605 | 0.2042 | ||||||
| 0.2977 | −0.6194 | 0.6551 | −0.1769 | ||||||
| −0.1414 | −0.5998 | 0.1234 | 0.1651 | ||||||
| 0.3675 | 0.0010 | −0.0161 | 0.9348 | ||||||
| 0.1266 | 0.0796 | −0.0199 | −0.3759 | 0.218 | 0.2706 | 0.218 | 0.2706 | ||
| −0.4590 | 0.3589 | −0.3686 | 0.2192 | −0.2659 | 0.0000 | −0.2659 | 0.0000 | ||
| 0.8897 | 0.2254 | −0.1640 | 0.0363 | ||||||
| −1.4055 | 0.1166 | 0.6798 | −0.2132 | ||||||
| 0.0544 | 0.1966 | −0.1423 | −0.8834 | ||||||
| −0.9197 | 0.4698 | −1.0743 | 0.2524 | ||||||
| −0.3382 | −0.3060 | 0.4118 | −0.3654 | ||||||
| 0.3631 | 0.3432 | 0.4255 | −0.0669 | ||||||
| 0.2511 | −0.3471 | 0.4713 | 0.0675 | ||||||
| Hidden Layer 3– Hidden Layer 4 | −0.0978 | 0.3359 | −0.0234 | −0.2039 | |||||
| 0.3257 | −0.5964 | 0.1834 | 0.1567 | ||||||
| 0.1030 | 0.0933 | −0.3127 | 0.2791 | ||||||
| 0.6889 | −0.1012 | 0.1629 | 0.0561 | ||||||
| 0.3922 | 0.3585 | 0.6967 | 0.0493 | ||||||
| −0.0747 | 1.6836 | −0.2026 | 0.5889 | ||||||
| −0.1932 | 0.2583 | 0.3790 | −0.098 | ||||||
| −0.1582 | 0.2372 | 0.0852 | 0.5036 | −0.0060 | 0.1727 | −0.006 | 0.1727 | ||
| 0.0680 | 0.1110 | −0.3814 | −0.0323 | 0.1675 | −0.0533 | 0.1675 | −0.0533 | ||
| 0.0911 | 0.1246 | −0.2549 | −0.3707 | ||||||
| −1.0282 | −0.0705 | 0.5200 | 0.1239 | ||||||
| 0.4415 | 0.3857 | 0.0975 | 0.1955 | ||||||
| 0.1195 | −0.0460 | 0.2357 | 0.2504 | ||||||
| −0.2813 | −0.4536 | −0.3516 | −0.4265 | ||||||
| 0.0556 | 0.0410 | −0.4205 | 0.2033 | ||||||
| −0.2370 | −0.5362 | −0.4228 | −0.2052 | ||||||
| Hidden Layer 4– Output Layer | −1.1736 | 0.5198 | −1.1736 | 0.5198 | 0.1462 | ||||
| 0.6921 | -0.6953 | 0.6921 | −0.6953 | ||||||
Publisher’s Note: MDPI stays neutral with regard to jurisdictional claims in published maps and institutional affiliations. |
© 2022 by the authors. Licensee MDPI, Basel, Switzerland. This article is an open access article distributed under the terms and conditions of the Creative Commons Attribution (CC BY) license (https://creativecommons.org/licenses/by/4.0/).
Share and Cite
Amini Pishro, A.; Zhang, Z.; Amini Pishro, M.; Liu, W.; Zhang, L.; Yang, Q. Structural Performance of EB-FRP-Strengthened RC T-Beams Subjected to Combined Torsion and Shear Using ANN. Materials 2022, 15, 4852. https://doi.org/10.3390/ma15144852
Amini Pishro A, Zhang Z, Amini Pishro M, Liu W, Zhang L, Yang Q. Structural Performance of EB-FRP-Strengthened RC T-Beams Subjected to Combined Torsion and Shear Using ANN. Materials. 2022; 15(14):4852. https://doi.org/10.3390/ma15144852
Chicago/Turabian StyleAmini Pishro, Ahad, Zhengrui Zhang, Mojdeh Amini Pishro, Wenfang Liu, Lili Zhang, and Qihong Yang. 2022. "Structural Performance of EB-FRP-Strengthened RC T-Beams Subjected to Combined Torsion and Shear Using ANN" Materials 15, no. 14: 4852. https://doi.org/10.3390/ma15144852
APA StyleAmini Pishro, A., Zhang, Z., Amini Pishro, M., Liu, W., Zhang, L., & Yang, Q. (2022). Structural Performance of EB-FRP-Strengthened RC T-Beams Subjected to Combined Torsion and Shear Using ANN. Materials, 15(14), 4852. https://doi.org/10.3390/ma15144852