Abstract
Different studies carried out in the last three decades on the magnetic susceptibility of the spinel ZnFe2O4 ferrite have revealed the positive character of its Curie–Weiss temperature, contradicting its observed antiferromagnetic behavior which is characterized by a well-defined susceptibility peak centered around the Neel temperature (10 K). Some approaches based on ab initio calculations and mixture of interactions have been attempted to explain this anomaly. This work shows how for very low values of the inversion parameter, the small percentage of Fe atoms located in tetrahedral sites gives rise to the appearance of ferrimagnetic clusters around them. Superparamagnetism of these clusters is the main cause of the anomalous Curie–Weiss behavior. This finding is supported experimentally from the thermal dependence of the inverse susceptibility and its evolution with the degree of inversion.
1. Introduction
Many antiferromagnetic materials have been reported to have positive Curie–Weiss temperature, which is a sign of ferromagnetic interactions [1,2,3,4,5,6,7]. This behavior has been explained under the coexistence of competing antiferromagnetic and ferromagnetic interactions. Zinc ferrite (ZnFe2O4) is a model system for the study of these competing interactions. These spinel ferrites have the formula MFe2O4, where M is usually one or more divalent or trivalent metals as long as positive charges are compensated for the neutrality of the unit cell. In the general case, the ionic distribution is mixed, and it can be represented by [M1−δFeδ]A[MδFe2−δ]BO4, where δ is the inversion parameter, which specifies the fraction of Fe+3 ions in A sites. Accordingly, δ = 0 and 1 stand for the normal and inverse cases, respectively. The normal (Zn)A(Fe2)BO4 is antiferromagnetic but the exchange of few Zn-Fe cations between A and B sites gives place to (Zn1−δFeδ)A[ZnδFe2−δ]BO4. Recent evidence of coexisting ferrimagnetic clusters inside of an antiferromagnetic matrix [8,9,10] suggests the use of this material as a model to correlate the increase of Zn–Fe exchange with an anomalous increasing positive Curie–Weiss temperature despite the antiferromagnetic character of the sample.
It is well established that the cation distribution among the interstitial sites of the spinel lattice plays an important role in the magnetic properties of zinc ferrites [8,11,12,13]. These ternary compounds can be described by the formula (Zn1-δFeδ)A[ZnδFe2-δ]BO4,where A and B represent the tetrahedral and octahedral sites, respectively, and δ the inversion parameter. For δ = 0, the structure is a normal spinel and presents a paramagnetic behavior, with a transition to antiferromagnetic order near 10 K. Although the equilibrium cation distribution of bulk zinc ferrites can be assumed to be completely normal, it is very difficult to prevent any exchange between the Zn and Fe cations. Thus, the partially inverted ZnFe2O4 (δ > 0) has been intensively studied to understand the relationship between cation distribution and magnetic properties [14].
Among the anomalous characteristics of the antiferromagnetic Zn ferrite, the apparent contradiction between the positive Curie–Weiss temperature, determined experimentally from the measurements of the magnetic susceptibility, and the antiferromagnetic behavior [15,16,17] character of both B–B and A–B exchange interactions [9] has been outlined. Different causes have been proposed in an attempt to explain this contradiction [18].
Recent calorimetric and Mossbauer results showed that a very small fraction of Fe atoms occupying tetrahedral A sites can profoundly modify the antiferromagnetic behavior [9]. Specifically, the Mossbauer spectra obtained from samples with a low degree of inversion (δ = 0.05) point to the coexistence of three magnetic structures that can be roughly assigned as: (a) the antiferromagnetic matrix (AFM) with a Neel temperature of the order of 10 K, (b) ferrimagnetic clusters (FM) defined around a tetrahedral or A site occupied by Fe ions, which have a Curie temperature of about 700 K [19], and (c) a spin frustrated or spin disordered (SD) region occupying the boundary between the FM and AFM clusters. It is worth noting that Lotgering [19] took into consideration the existence of ferrimagnetic clusters and calculated the magnetic susceptibility of a single cluster above its Curie temperature by using the molecular field approximation.
In this work, the positive Curie–Weiss temperature obtained from macroscopic measurements of the inverse susceptibility, at temperatures well below the Curie temperature of the ferrimagnetic clusters, is assigned to the superparamagnetic behavior of clusters of atoms with a net magnetic moment originated by A–B superexchange interactions. In other words, the linear thermal dependence of the inverse of susceptibility only appears at temperatures above the blocking temperatures of these superparamagnetic clusters. Thus, the apparent Curie–Weiss temperature is expected to be in the range of the blocking temperatures corresponding to the cluster size distribution. It is important to remark that this temperature is not the critical one corresponding to a phase transition but it corresponds to the temperature at which the relaxation time of the magnetic moment is similar to the measurement time.
2. Materials and Methods
As previously reported, the magnetic properties are rather independent of synthesis methods, but strongly depends on the inversion degree [20]. Consequently, different synthesis routes have been carried out to get zinc ferrites with different values of the inversion degree. A samples were obtained from a commercial sample which were annealed at 1100 °C during 24 h and then subjected to different milling times and annealing temperatures, as shown in Table 1. B samples were obtained by the ceramic method mixing ZnO and α-Fe2O3 in stoichiometric ratio, annealed at 1200 °C for 24 h. Subsequently, the sample was subjected to 50 h of mechanical grinding and annealed for 1 h at different temperatures. C samples were obtained by a mechanical milling of ZnO and α-Fe2O3 at 1:1 molar ratio for 150 h and subjecting the samples to different annealing temperatures. Table 1 summarizes the synthesis procedures and the subsequent milling times and annealing temperatures and times.

Table 1.
Synthesis procedure for the different samples.
A ball mill Retsch PM4 (Retsch Gmbh, Haan, Germany) was used for the milling of the samples. For more detailed information about the synthesis procedures, see refs. [10,20].
Microstructural characterization of the samples was performed by X-ray diffraction (XRD) measurements at room temperature (RT) using Co radiation (λ = 1.78897Å) in a Bruker (Bruker AXDS, GmbH, Karlsruhe, Germany)AXS D8 Advance diffractometer equipped with a Goebel mirror and a LynxEye linear detector. XRD spectra were collected over an angular range of 2θ from 10 to 120° with a step of 0.01°. The obtained XRD data were refined by the Rietveld method using the version 6.0 of the analysis program TOPAS 6.0 ((Bruker AXDS, GmbH, Karlsruhe, Germany)) and the crystallographic information for zinc ferrite taken from the Pearson crystallographic database [21]. The refinement protocol used included the degree of inversion δ constraining the cations at the octahedral and tetrahedral sites to keep the stoichiometric value. The quality of the refinements was evaluated by the statistically expected least-squares factor (Rexp), the weighted summation of residual of the least-squares fit (Rwp), and the goodness of fit (GoF) or chi-square, whose limit tends to 1. The particle size was determined by SEM and TEM and ranges from a few microns for samples A1 and B1 samples to 15 nm, nanosized particles, NPs, for C2, A3, and B3 samples (see Figure S1 in Supplementary Materials). It must be indicated that TEM observations do not indicate any disturbance at the NPs surfaces that could be associated with a core-shell structure (Figure S3 in Supplementary Materials).
On the other hand, the magnetometric study of the samples was carried out using a standard superconducting quantum interference device (SQUID) MPMS (Quantum Design, GmbH, Darmstadt, Germany). Zero field cooled (ZFC) and field cooled (FC) measurements were taken at magnetic field of 100 Oe between 5 and 300 K, in order to know the behavior as a function of temperature. In addition, hysteresis cycles were measured at 5 and 300 K and at 5 T as maximum applied field.
3. Results
Figure 1 shows the temperature dependence of the magnetization under ZFC-FC procedure and the inverse susceptibility curves measured under an applied field of 100 Oe for the samples obtained by different methods with an inversion degree of up to 0.41. As observed, the susceptibility presents a maximum at temperatures that increase with δ. The temperature range corresponding to this maximum is always above the Neel temperature corresponding to the B–B interactions, but well below the Curie temperature corresponding to the A–B coupling. The apparent Curie–Weiss temperature was determined as the intersection with the temperature axis of a tangent line drawn to the inverse susceptibility curve, as shown in the figures on the right panel.
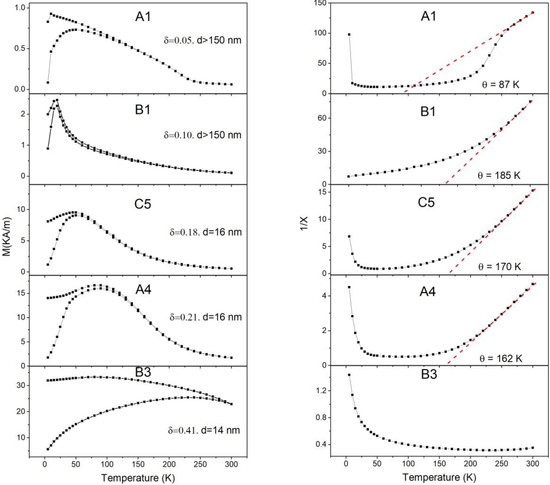
Figure 1.
(Left panel) shows ZFC-FC curves of zinc ferrites with different inversion degree (δ) and crystallite size (d). The (right panel) shows the inverse of the dimensionless susceptibility and the corresponding linear fit with the Curie–Weiss law. The samples labels are identified in Table 2.
For higher inversion degree values, the maximum of the magnetic susceptibility extends over a wide range of temperatures, so that the inverse of the susceptibility does not present any linear behavior at temperatures below 300 K, as shown in the last couple of graphics in Figure 1 corresponding to a sample (B3) with an inversion degree of around 0.41. Table 2 shows the inversion degree δ, the saturation magnetization at 5 K, apparent Curie–Weiss θ temperatures obtained by fitting the linear behavior of the inverse of the susceptibility, and the blocking temperature calculated from the maximum of the magnetization curves.
Table 2.
Inversion degree, saturation magnetization, apparent Curie–Weiss (θ), and average blocking temperature <TB> of the studied samples.
4. Discussion
It has been reported in previous works that at 2 K, both antiferromagnetic and the ferrimagnetic ordering can coexist for values of the inversion parameter of up to approximately 0.3 [10]. These magnetic orders are associated with AFM coupling between Fe cations, the first among those occupying only octahedral positions and the second among those located in tetrahedral positions with their nearest neighbors in octahedral positions (superexchange B–B and A–B interactions, respectively). As the A–B interaction is almost two orders of magnitude stronger than the B–B one, higher thermal energy is required to disorient their magnetic moments. Thus, magnetic spin clusters may arise in the system from the antiferromagnetic interaction between the Fe cations in the A and B sites above the Neel temperature. At very low inversion degree, most of these clusters are non-contacting to each other and, consequently, are expected to behave as superparamagnetic assemblies or single domains, provided that the cluster volume is smaller than the grain volume. As δ increases, the number of unit cells containing local cation inversions increases, but also the number of inversions of a given cluster could increase while keeping its volume constant. As the blocking temperature only depends on the cluster volume and not on its net magnetic moment, it should increase with δ but not linearly. Accordingly, the experiment with the blocking temperature spreads and the inverse of the susceptibility does not behave linearly with T at any range of the measuring interval, as shown in Figure 1 and Table 2 for samples with higher δ values. Therefore, it is assumed that the maximum susceptibility corresponds to the average blocking temperature, <TB>, of the ferromagnetic clusters. It is worth noting that TB only depends on the cluster volume and not on the volume of the particles. In fact, the changes of TB with the particle sizes show a tendency opposite to that expected for superparamagnetic particles. This is due to the inverse relation between particle size and average cluster volume. This relation can be understood by taking into account that the smaller the particle size, the larger the inversion degree and, consequently, the larger the average cluster volume, this last being the relevant volume for the superparamagnetic behavior.
As the measuring temperature is well below the Curie point of the ferrimagnetic A–B coupling, i.e., 700 K, the magnetic moment of the clusters can be considered to be constant. When a single Fe atom has jumped from B to A sites in a unit cell, the local δ is increased in an amount of 1/8 [9], and the ferrimagnetic volume of each of these cells is of the order of the unit cell volume, i.e., 6.0 × 10⁻²⁸ m3. Therefore, if we consider that there is only one jump per unit cell, the fraction these cells that have undergone an elementary inversion is 40% for a macroscopic inversion value δ = 0.05.
The blocking temperature of a ferrimagnetic single domain with volume V can be derived from the following, well-known relationship:
where K is the anisotropy constant, the Boltzmann constant, TB the blocking temperature, and V the cluster volume. As illustrated by Figure 1, the susceptibility reaches a maximum at temperatures between 10 and 100 K for all the samples. Therefore, if K = 1.3 × 10⁵ Jm−3 [22] and for instance, it is applied to sample B1 with TB = 19.9 K, the effective average volume of the ferrimagnetic clusters is in the order of 5 10−26 m3, which corresponds to a volume of 100 unit cells, that represents single domains of 4 nm size.
Above , the superparamagnetic susceptibility decreases following the Curie–Weiss law , i.e., in this case TB = θ.
However, when, as is the case, the volume of the clusters is distributed over a broad range, the inverse of the susceptibility becomes a linear function of T only when T is above the maximum blocking temperature (Figure S3 in Supplementary Materials). Note that is that T at which all the clusters are superparamagnetic, and it can be also observed and estimated as that for which the ZFC and FC curves become identical. According to this consideration, the experimental susceptibility associated with a cluster distribution with density , contains two terms for , the statistical average contribution of the unblocked clusters those with , and the contribution of the blocked ones, which are those with
where the average is obtained from , distribution that is equivalent to a , distribution according to (1) and is the average magnetic moment of the clusters distribution. In Figure 1, it can be seen that for the sample with inversion degree of 0.41, is above the measuring T interval; in this case, the second term of (2) has an important contribution in all the range of measuring T and, consequently, no hints of linear behavior in the inverse of susceptibility versus T can be observed.
When the measuring temperature is above , the second term in (2) vanishes, since all the clusters are unblocked, and the inverse of the susceptibility obtained from the first term of (2) asymptotically approaches to linear dependence with T as
where is close to , its exact position depending on the shape and width of the distribution. When the distribution function can be considered uniform (Supplementary Information). The Curie constant, C, as well as the macroscopic magnetization M can be experimentally obtained, and they are also related by the following expression. Consequently, the average magnetic moment of the cluster distribution can be directly estimated from (4).
The spontaneous magnetization M is given in Table 2. The experimental C values are collected in Table 3 and were inferred by the slope of straight line in Figure 1. It is obvious that as C for all the samples is two or three orders of magnitude larger than that corresponding to samples characterized by atomic paramagnetism, showing that it should correspond to canonical superparamagnetism.
Table 3.
Experimental calculation result of m by means slope of 1/X by T a.
The single domain moment depends on the number of uncompensated spins of Fe ions. For a macroscopic δ, the distribution of single domains, according to their volume and magnetic moment, is highly degenerated. However, the order of magnitude of an average m value can be inferred by means of expression [4] from the experimental C and M values.
Expression (4) helps us to infer that m should be of the order of 102 µB. Since the maximum magnetic moment per cell corresponding to a local δ = 0.5 becomes 47 µB, then a group of 2–3 unit cells with δ = 0.5 or a group of 4–6 unit cells with local δ = 0.25 could account for these observations.
It is worth noting that the distance, experimentally found and shown in Table 2, between <TB> and = , is an index of the width of the clusters size distribution.
Finally, it must be added that the possible presence of magnetostatic interactions among the clusters could contribute to increasing the apparent Curie–Weiss temperature in an amount that, according to the Lorentz field estimation, is expected to be of C/3. According to Table 3, the maximum shift produced by the Lorentz field should be of 10 K.
5. Conclusions
Due to the antiferromagnetic character of the B–B and A–B superexchange interactions in spinel ferrites, it might be surprising to experimentally find a positive value for the apparent Curie–Weiss temperature. In this work, this behavior has been related to superparamagnetism of magnetic spin clusters nucleated around the Fe3+ located in the A sites, which appear in samples with a very low degree of inversion. At temperatures higher than , provided that the Curie temperature of the ferrimagnetic clusters is well above the measuring one, the inverse of the susceptibility approaches the typical thermal dependence . The apparent Curie–Weis temperature, θ, is indeed a temperature corresponding to the blocking temperature distribution of the clusters, its particular position in the spectrum, close to , depends on the shape and width of the distribution. In the case of a uniform distribution, θ can be considered to be . In summary, in samples with very low inversion degree and blocking temperature well below the Curie one, the contribution of the superparamagnetic effect becomes dominant. The superparamagnetic apparent Curie–Weiss temperature, being a blocking one, is the temperature at which the magnetic relaxation time is similar to the measurement time; above this temperature, the behavior is superparamagnetic but below it, the system is ferromagnetic.
As indicated by Lotgering [19], the measuring temperature should increase up to 800 K to observe the straight line with negative Curie–Weiss temperature due to the antiferromagnetic A–B coupling which gives rise to the ferrimagnetic clusters. On the other hand, the negative Curie–Weiss temperature associated with the B–B antiferromagnetic coupling could only be observed for δ = 0, i.e., for ideal ZnFe2O4 samples where there is not any trace of ferrimagnetic clusters. However, since this ideal case is very difficult to achieve, the previously reported anomalous sign for the Curie–Weiss temperature can be understood as a consequence of the superparamagnetism associated with the almost unavoidable presence of a few ferrimagnetic clusters.
Supplementary Materials
The following supporting information can be downloaded at: https://www.mdpi.com/article/10.3390/ma15144789/s1, Figure S1: At the left, SEM of B1 sample, with d > 150 nm by XRD, and here is appreciated is of micron order (Reprinted with permission from Journal of Alloys and Compounds 849 (2020) 156353. Copyright 2020. Elsevier B.V.). At the right TEM of C1 sample, witch average D size in represented histogram is of 12 nm orders. (Reprinted with permission from The Journal of Physical Chemistry C 2019, 123, (28), 17472-17482. Copyright 2019 American Chemical Society.); Figure S2: HRTEM image of B4 showing that the sample are highly crystalline. (Reprinted with permission from The Journal of Physical Chemistry C 2019, 123, (28), 17472-17482. Copyright 2019 American Chemical Society.); Figure S3: illustrates the thermal dependence of 1/χ as derived from the expression (S2) for TBmin = 30 K, TB^max = 50 K and C = 1. It is shown that θ = TB^max = 50 K. Note that for T sufficiently high, T > T_B^max, 1/χ, (S2), tends towards a straight line with slope 1/C. As the average blocking temperature is 40K its difference with θ = 50 K is a measure of the half width of the distribution.
Author Contributions
A.H.: conceptualization, validation, formal analysis, writing—original draft, supervision; M.Á.C.: methodology, validation, formal analysis, resources, writing; J.A.J.: methodology, formal analysis, resources, writing; I.L.: validation, investigation, resources; A.G.-E.: validation, investigation; P.d.l.P.: conceptualization, writing—original draft, writing—review and editing, visualization, funding acquisition. All authors have read and agreed to the published version of the manuscript.
Funding
This research was funded by Spanish Ministries of Science Innovation and Universities and of Economy and Competitiveness by means of the AFORMAR (PID2019-109334RB), RTI2018-095303-B-C51 and RTI2018-095856-B-C21 projects. The support of the grants from the Community of Madrid numbers S2018/NMT-4381-MAT4.0-CM and P2018/NMT-4321 is also recognized.
Institutional Review Board Statement
Not applicable.
Informed Consent Statement
Not applicable.
Data Availability Statement
Not applicable.
Conflicts of Interest
The authors declare no conflict of interest. The funders had no role in the design of the study; in the collection, analyses, or interpretation of data; in the writing of the manuscript, or in the decision to publish the results.
References
- Jonker, G.H. Magnetic Compounds with Perovskite Structure IV Conducting and Non-Conducting Compounds. Physica 1956, 22, 707–722. [Google Scholar] [CrossRef]
- Zhou, J.S.; Goodenough, J.B. Paramagnetic phase in single-crystal LaMnO3. Phys. Rev. B 1999, 60, R15002–R15004. [Google Scholar] [CrossRef]
- Holzapfel, M.; de Brion, S.; Darie, C.; Bordet, P.; Chappel, E.; Chouteau, G.; Strobel, P.; Sulpice, A.; Núñez-Regueiro, M.D. Decoupling of orbital and spin degrees of freedom in Li(1−x)Na(x)NiO(2). Phys. Rev. B 2004, 70, 132410. [Google Scholar] [CrossRef] [Green Version]
- Baltzer, P.K.; Lehmann, H.W.; Robbins, M. Insulating Ferromagnetic Spinels. Phys. Rev. Lett. 1965, 15, 572. [Google Scholar] [CrossRef]
- Wang, X.L.; James, M.; Horvat, J.; Dou, S.X. Spin glass behaviour in ferromagnetic La2CoMnO6 perovskite manganite. Supercond. Sci. Technol. 2002, 15, 427–430. [Google Scholar] [CrossRef]
- Tsurkan, V.; Hemberger, J.; Krimmel, A.; Krug von Nidda, H.A.; Lunkenheimer, P.; Weber, S.; Zestrea, V.; Loidl, A. Experimental evidence for competition between antiferromagnetic and ferromagnetic correlations in HgCr24. Phys. Rev. B 2006, 73, 224442. [Google Scholar] [CrossRef] [Green Version]
- Hemberger, J.; von Nidda, H.A.K.; Tsurkan, V.; Loidl, A. Large Magnetostriction and Negative Thermal Expansion in the Frustrated Antiferromagnet (ZnCr)2Se4. Phys. Rev. Lett. 2007, 98, 147203. [Google Scholar] [CrossRef] [Green Version]
- Cobos, M.A.; de la Presa, P.; Llorente, I.; Alonso, J.M.; García-Escorial, A.; Marín, P.; Hernando, A.; Jiménez, J.A. Magnetic Phase Diagram of Nanostructured Zinc Ferrite as a Function of Inversion Degree δ. J. Phys. Chem. C 2019, 123, 17472–17482. [Google Scholar] [CrossRef]
- Cobos, M.A.; Hernando, A.; Marco, J.F.; Puente-Orench, I.; Jiménez, J.A.; Llorente, I.; García-Escorial, A.; de la Presa, P. Unveiling the Hidden Entropy in ZnFe2O4. Materials 2022, 15, 1198. [Google Scholar] [CrossRef]
- Cobos, M.A.; de la Presa, P.; Puente-Orench, I.; Llorente, I.; Morales, I.; García-Escorial, A.; Hernando, A.; Jiménez, J.A. Coexistence of antiferro- and ferrimagnetism in the spinel ZnFe2O4 with an inversion degree delta lower than 0.3. Ceram. Int. 2022, 48, 12048–12055. [Google Scholar] [CrossRef]
- Dolcet, P.; Kirchberg, K.; Antonello, A.; Suchomski, C.; Marschall, R.; Diodati, S.; Muñoz-Espí, R.; Landfester, K.; Gross, S. Exploring wet chemistry approaches to ZnFe2O4 spinel ferrite nanoparticles with different inversion degrees: A comparative study. Inorg. Chem. Front. 2019, 6, 1527–1534. [Google Scholar] [CrossRef]
- Bohra, M.; Alman, V.; Arras, R. Nanostructured ZnFe2O4: An Exotic Energy Material. Nanomaterials 2021, 11, 1286. [Google Scholar] [CrossRef] [PubMed]
- Sai, R.; Arackal, S.; Kahmei, R.R.; Bhat, N.; Yamaguchi, M.; Shivashankar, S. Crystallographic inversion-mediated superparamagnetic relaxation in Zn-ferrite nanocrystals. AIP Adv. 2020, 10, 015101. [Google Scholar] [CrossRef]
- Jiang, J.; Wynn, P.; Mørup, S.; Okada, T.; Berry, F. Magnetic structure evolution in mechanically milled nanostructured ZnFe2O4 particles. Nanostructured Mater. 1999, 12, 737–740. [Google Scholar] [CrossRef]
- Kamazawa, K.; Tsunoda, Y.; Kadowaki, H.; Kohn, K. Magnetic neutron scattering measurements on a single crystal of frustrated ZnFe2O4. Phys. Rev. B 2003, 68, 024412. [Google Scholar] [CrossRef]
- Boucher, B.; Buhl, R.; Perrin, M. Structure magnétique du spinelle antiferromagneétique ZnFe2O4. Phys. Status Solidi (B) 1970, 40, 171–182. [Google Scholar] [CrossRef]
- Hofmann, M.; Campbell, S.; Ehrhardt, H.; Feyerherm, R. The magnetic behaviour of nanostructured zinc ferrite. J. Mater. Sci. 2004, 39, 5057–5065. [Google Scholar] [CrossRef]
- Quintero, J.M.; Rodríguez, K.S.; Albarracín, F.G.; Rosales, H.D.; Zélis, P.M.; Stewart, S.J.; Errico, L.A.; Torres, C.R. On the deviation from a Curie–Weiss behavior of the ZnFe2O4 susceptibility: A combined ab-initio and Monte-Carlo approach. Heliyon 2019, 5, e01170. [Google Scholar] [CrossRef] [Green Version]
- Lotgering, F. The influence of Fe3+ ions at tetrahedral sites on the magnetic properties of ZnFe2O4. J. Phys. Chem. Solids 1966, 27, 139–145. [Google Scholar] [CrossRef]
- Cobos, M.; de la Presa, P.; Llorente, I.; García-Escorial, A.; Hernando, A.; Jiménez, J.A. Effect of preparation methods on magnetic properties of stoichiometric zinc ferrite. J. Alloys Compd. 2020, 849, 156353. [Google Scholar] [CrossRef]
- Villars, P.; Cenzual, K. Pearson’s Crystal Data: Crystal Structure Database for Inorganic Compounds; ASM International®: Materials Park, Geauga County, OH, USA, 2017–2018. [Google Scholar]
- Birks, J.B. First-Order Magnetic Anisotropy Constants of Ferrites. Phys. Rev. 1955, 99, 1821. [Google Scholar] [CrossRef]
Publisher’s Note: MDPI stays neutral with regard to jurisdictional claims in published maps and institutional affiliations. |
© 2022 by the authors. Licensee MDPI, Basel, Switzerland. This article is an open access article distributed under the terms and conditions of the Creative Commons Attribution (CC BY) license (https://creativecommons.org/licenses/by/4.0/).